Developed Countries
We have highlighted that while the unwinding of supply-side dislocations will carve an easy path for inflation to moderate to an underlying 4%-5% range, bringing it further down towards the Fed’s 2% target is a more difficult task requiring the unraveling of…

Executive Summary At the margin, the European Union’s proposed €140 billion “windfall profits” tax on electricity providers not using natural gas to generate power will blunt the message markets are sending to consumers to conserve energy, by distributing this windfall to households to offset higher energy costs. A “solidarity contribution” from oil, gas and coal producers – an Orwellian rendering of “fossil-fuel tax” – will reduce capex at a time when it is needed to expand supply. These measures – the direct fallout of the EU’s failed Russia-engagement policy – will compound policy uncertainty in energy markets, which also will discourage investment in new supply. Efforts to contain energy prices of households and firms in the UK will be borne by taxpayers, who will be left with a higher debt load in the wake of the government’s programs to limit energy costs, and higher taxes to service the debt. EU Still At Risk To Russia Gas Cutoff
EU Energy Markets: "Not Fit For Purpose" For A Reason
EU Energy Markets: "Not Fit For Purpose" For A Reason
Bottom Line: The EU and UK governments are inserting themselves deeper into energy markets, which will distort fundamentals and prices, leaving once-functioning markets “unfit for purpose.” This likely will reduce headline inflation beginning in 3Q22 by suppressing energy prices, and will discourage conservation and capex. Energy markets will remain tight as a result. We were stopped out of our long the COMT ETF with a loss of 5.4% and our XOP ETF with a gain of 24.6%. We will re-open these positions at tonight’s close with 10% stop-losses. Feature The EU is attempting to address decades of failed policy – primarily its Ostpolitik change-through-trade initiative vis-à-vis Russia – in a matter of months.1 This policy was brought to a crashing halt earlier this year by Russia’s invasion of Ukraine, which led to an economic war pitting the EU and its NATO allies against Russia. This conflict is playing out most visibly in energy markets. For investors, the most pressing issue in the short term center around the trajectory of energy prices – primarily natural gas, which, unexpectedly, has become the most important commodity in the world: It sets the marginal cost of power in the EU; forces dislocations in oil and coal markets globally via fuel substitution, and drives energy and food inflation around the world higher by increasing space-heating fuel costs and fertilizer costs. These effects are unlikely to disappear quickly, especially in the wake of deeper government involvement in these markets. The EU is dealing with its energy crisis by imposing taxes on power generators and hydrocarbons producers. It is proposing a €140 billion “windfall profits” tax on electricity providers not using natural gas to generate power, and is advancing a “solidarity contribution” from oil, gas and coal producers – an Orwellian rendering of a “fossil-fuel tax. Lastly, the EU will mandate energy rationing to stretch natural gas supplies over the summer and winter heating season. The tax hikes under consideration will reduce capex at a time when it is needed to expand supply. Related Report Commodity & Energy StrategyOne Hot Mess: EU Energy Policy The UK is taking a different route v. the EU, by having the government absorb the cost of stabilizing energy prices for households and firms directly on its balance sheet. Beginning 1 October, annual energy bills – electricity and gas – will be limited to £2,500. The government is ready to provide support for firms facing higher energy costs out of a £150 billion package that still lacks formal approval via legislation to be dispensed. This obviously has businesses concerned.2 Over the medium to long term, this economic war will realign global energy trade – bolstering the US as the world’s largest energy exporter, and cementing the alliance of China-Russia energy trade. Whether this ultimately evolves into a Cold War standoff remains an open question. EU Policy Failures And The Power Grid’s Limitations Chart 1Russia Plugged The Gap In EU Energy Supply
EU Energy Markets: "Not Fit For Purpose" For A Reason
EU Energy Markets: "Not Fit For Purpose" For A Reason
In addition to its failed Russia policy, the EU’s aggressive support of renewable energy disincentivized domestic fossil fuel production and forced an increased reliance on imports – with a heavy weighting toward Russian hydrocarbons – instead. Once Russia stopped playing the role of primary energy supplier to the EU, the bloc’s energy insecurity became obvious (Chart 1). The EU’s current power-pricing system is forcing households and industries to bear the brunt of energy insecurity and high natgas prices resulting from poor energy policy design.3 And it forces the government to tax energy suppliers – with “windfall profits” taxes ostensibly meant to capture economic rents, as officials are wont to describe the taxes – to fund consumer-support programs. While REPowerEU aims to alleviate the bloc’s energy insecurity by importing non-Russian LNG and increasing renewable energy’s share in the energy mix, both alternatives face bottlenecks, which could delay their implementation. This could keep energy markets in the EU tight over the medium term, until additional LNG capacity comes online in the US and elsewhere. Renewable electricity is not as reliable as electricity generated by fossil fuels on the current power grid, which needs to be constantly balanced to avoid cascading failure. This means power consumed must equal power supplied on a near-instantaneous basis to avoid grid failure. However, given its reliance on variable weather conditions, renewable energy by itself cannot keep the grid balanced, primarily due to the lack of utility-scale storage for renewable power. Battery-storage technology and green-hydrogen energy can be used in conjunction with other renewables to balance the power grid, but they still are nascent technologies and not yet scalable to the point where they can replace hydrocarbon energy sources. Furthermore, the continued addition of small-scale renewables-based power generation located further away from demand centers – cities and industrial complexes – will continue to increase the complexity and scale of the power grid.4 Realizing the importance of incumbent power sources and the infrastructure requirements to diversify away from Russian fuels, the EU labelled investments in natural gas and nuclear power as green investments in July.5 Of the two energy sources, natural gas will likely play a larger role in ensuring the bloc’s energy security over the next 3-5 years, given the polarized views on nuclear power.6 In its most recent attempt to stabilize power prices, the EU plans to redirect “inframarginal” power producers’ windfall profits to households and businesses, provided those producers do not generate electricity using natgas. The Commission did not suggest capping Russian natgas prices since that could be divisive among EU member states, and could further jeopardize the bloc’s energy security. The redistribution of the windfall profits taxes is coupled with calls for mandatory electricity demand reductions in member states. We are unsure of the net effect of these directives on physical power and natural gas balances. However, government interference will feed into the policy uncertainty surrounding electricity and natural gas markets. EU Storage Continues To Build Against all odds, the EU has been aggressively building gas in storage (Chart 2), as demand from Asia has been low during the summer months (Chart 3). This has allowed high Dutch Title Transfer Facility (TTF) prices – the European natgas benchmark – to lure US LNG exports away from Asia (Chart 4). According to Refinitiv data, US exports of LNG to Europe increased 74% y/y to a total of over 1,370 Bcf for the first half of 2022. Chart 2Europe Has Been Aggressively Building Gas Storage
EU Energy Markets: "Not Fit For Purpose" For A Reason
EU Energy Markets: "Not Fit For Purpose" For A Reason
Chart 3US LNG Exports To Asia Dropped In H1 2022
US LNG Exports To Asia Dropped In H1 2022
US LNG Exports To Asia Dropped In H1 2022
Chart 4High TTF Prices Attract US LNG
EU Energy Markets: "Not Fit For Purpose" For A Reason
EU Energy Markets: "Not Fit For Purpose" For A Reason
Since Russian gas flows to Asian states have not been completely cut off, this will reduce ex-EU demand for US LNG, providing much needed breathing room for international LNG markets. However, as the pre-winter inventory-injection period in Asia continues, there is an increasing likelihood the spread between Asian and European gas prices narrows. This could incentivize US producers to export more fuel to Asia, slowing the EU’s build-up of gas storage. US plans to increase LNG export capacity will alleviate current tightness in international gas markets over the medium term, as new export facilities are expected to begin operations by 2024, and be fully online by 2025 (Chart 5). Until US LNG exports increase, global natgas markets will continue to remain tight and prices will be volatile. Chart 5US LNG Export Capacity Projected To Rise
EU Energy Markets: "Not Fit For Purpose" For A Reason
EU Energy Markets: "Not Fit For Purpose" For A Reason
Russia’s Asian Gas Pivot Since the energy crisis began, China has accelerated the rate at which it imports discounted Russian LNG.7 Russia is aiming to increase gas exports to China to replace the sales lost to the EU following its invasion of Ukraine. Russia recently signed a deal with China to increase gas flows by an additional 353 Bcf per year, with both states agreeing to settle this trade in yuan and rouble to circumvent Western currencies, primarily the USD. Additionally, the Power of Siberia pipeline is expected to reach peak transmission capacity of ~ 1,340 Bcf per year by 2025. Chart 6China Will Not Want All Eggs In One Basket
EU Energy Markets: "Not Fit For Purpose" For A Reason
EU Energy Markets: "Not Fit For Purpose" For A Reason
Adding to the China-Russia gas trade is the planned Power of Siberia 2 pipeline, which will have an annual expected capacity of 1,765 Bcf. This will move gas to China from western Siberia via Mongolia, and is expected to come into service by 2030; construction is scheduled to begin in 2024. This will redirect gas once bound toward the EU to China. Russia’s ability to develop and construct the required infrastructure to pivot gas exports to China and the rest of Asia will be hindered by Western sanctions, as international private companies walk away from Russian projects and international investment in that state decline. This is a deeper consequence of the sanctions imposed by the US and its allies, as it denies Russia the capital, technology and expertise needed to fully develop its resource base. On China’s side, even if both Power of Siberia pipelines are developed to operate at full capacity, the world’s largest natgas importer may be wary of becoming overly reliant on Russia for a significant proportion of its gas (and oil) imports. China has developed a diversified network of natgas suppliers, which, as the experience of the EU demonstrates, is the best way to avoid energy-supply shocks (Chart 6). Investment Implications We expect natural gas price volatility to remain elevated over the next 2-3 years. EU governments’ interference with the natgas and power markets' structure and pricing mechanisms – be it via natgas price caps or skimming gas suppliers’ profits – will distort price signals, detaching them from fundamental gas balances. This will perpetuate the energy crisis currently plaguing the EU, by encouraging over-consumption of gas and reducing capex via taxes and levies on profitable companies operating below the market’s marginal cost curve. As a result of the dislocations caused by Russia’s invasion of Ukraine, dislocations in natural gas trade flows will continue, forcing markets to find work-arounds to replace lost Russian pipeline exports in the short-to-medium term. The EU will become more reliant on US LNG supplies, and will – over the next 2-3 years – have to outbid Asian states for supplies. Trade re-routing will take time and likely will lead to sporadic, localized shortages in the interim. The US is the largest exporter of LNG at present, but, by next year, it’s export capacity will max out. It will only start to increase from 2024, reaching full capacity by 2025. While higher export capacity from the world’s largest LNG supplier will help alleviate tight markets, in the interim, global gas prices, led by the TTF will remain elevated and volatile. The EU still receives ~ 80mm cm /d of pipeline gas from Russia, or ~ 7.4% of 2021 total gas consumption on an annual basis (Chart 7). A complete shut-off of Russian gas flows to the EU means the bloc would face even more difficulty refilling storage in time for next winter. This would keep the energy- and food-driven components of inflation high, and constrain aggregate demand in the EU generally. Chart 7EU Still At Risk To Russia Gas Cutoff
EU Energy Markets: "Not Fit For Purpose" For A Reason
EU Energy Markets: "Not Fit For Purpose" For A Reason
We continue to expect global natural gas markets to remain tight this year and next. We also expect natural gas prices to remain extremely volatile – particularly in winter (November – March), when weather will dictate the evolution of price levels. We were stopped out of our long the COMT ETF with a loss of 5.4% and our XOP ETF with a gain of 24.6%. We remain bullish commodities generally and oil in particular, and will re-open these positions at tonight’s close with 10% stop-losses. Robert P. Ryan Chief Commodity & Energy Strategist rryan@bcaresearch.com Ashwin Shyam Research Analyst Commodity & Energy Strategy ashwin.shyam@bcaresearch.com Paula Struk Research Associate Commodity & Energy Strategy paula.struk@bcaresearch.com Commodities Round-Up Energy: Bullish US distillate and jet-fuel stocks recovered slightly in the week ended 9 September 2022, rising by 4.7mm barrels to just over 155mm barrels, according to the US EIA. Distillate inventories – mostly diesel fuel and heating oil – stood at 116mm barrels, down 12% y/y. At 39.2mm barrels, jet fuel stocks are 7% below year-earlier levels. Refiners are pushing units to build distillates going into winter, in order to meet gas-to-oil switching demand in Europe and the US. Distillate inventories have been under pressure for the better part of the summer on strong demand. This is mostly driven by overseas demand. Distillate demand fell by 492k b/d last week, which helped domestic inventories recover. Year-on-year distillate demand was down 1.6% in the US. Ultra-low sulfur diesel prices delivered to the NY Harbor per NYMEX futures specification are up 50% since the start of the year (Chart 8). Base Metals: Bullish On Monday Chile’s government launched a plan to boost foreign investments, which includes providing copper miners with a 5-year break from the ad-valorem tax proposed in a new mining royalty. The plan however does not provide relief from the tax on operating profits, which are also part of the royalty. According to Fitch, the originally planned mining royalty would have significantly depleted copper miners’ profits, disproportionately impacting smaller operators, which cannot avail themselves of the benefits of economies of scale. In a sign that higher taxes spooked bigger players as well, in mid-July, BHP stated that it would reconsider investment plans in Chile if the state proceeded with the mining royalty in its original format. Ags/Softs: Neutral In its September WASDE, the USDA adjusted its supply and demand estimates for soybeans, and made substantial changes to new-crop 2022/23 US production estimates. This reduced acreage and yields by 2.7% from the previous August 2022 forecast. Ukraine’s soybean production was increased in the USDA's estimate. The USDA's soybean projections also include lower ending stocks, which are reduced from 245 million bushels to 200 million bushels. This is 11% below than 2021 levels for beans. The USDA's 2021/22 average price for soybeans remains at $14.35/bu, unchanged from last month but $1.05/bu above the 2021/22 average price (Chart 9). Chart 8NY Harbor ULSD Price Going Down
NY Harbor ULSD Price Going Down
NY Harbor ULSD Price Going Down
Chart 9Soybean Prices Going Down
Soybean Prices Going Down
Soybean Prices Going Down
Footnotes 1 For a discussion of the EU’s past policy mistakes which laid the foundation for current crisis, please see One Hot Mess: EU Energy Policy, which we published on May 26, 2022. It is available at ces.bcaresearch.com. 2 Please see UK business warned of delay to state energy support, published by ft.com on September 13, 2022. 3 The current EU power pricing system is set up so that the most expensive power generator – currently plants using natgas – set the price for the entire electricity market. This system was put in place to incentivize renewably generated power, however, the EU does not have the required infrastructure and technology to be reliant solely on green electricity. 4 For a more detailed discussion on power grid stability, and how renewables will affect it, please ENTSO-E’s position paper on Stability Management in Power Electronics Dominated Systems: A Prerequisite to the Success of the Energy Transition. According to estimates by WindEurope and Hitachi Energy, Europe will need to double annual investments in the power grid to 80 billion euros over the next 30 years to prepare the power grid for renewables. 5 For our most recent discussion on the infrastructure requirements of pivoting away from Russian piped gas, please see Natgas Markets: The Eye Of The Storm, which we published on June 9, 2022. It is available at ces.bcaresearch.com. 6 In 2021, nuclear power constituted majority of France’s energy mix at 36% and had nearly the lowest share for Germany at 5%. In response to the current energy crisis, Germany has opted to restart coal power plants and only keep nuclear plants on standby, signaling that the EU’s largest energy consumer would prefer to use coal despite its carbon emissions target. 7 According to Bloomberg, China signed a tender to receive LNG from Russia’s Sakhalin-2 project through December at nearly half the cost of the spot gas rates at the time. Investment Views and Themes New, Pending And Closed Trades WE WERE STOPPED OUT OF OUR LONG THE COMT ETF WITH A LOSS OF 5.4% AND OUR XOP ETF WITH A GAIN OF 24.6%. WE WILL RE-OPEN THESE POSITIONS AT TONIGHT’S CLOSE WITH 10% STOP-LOSSES. Strategic Recommendations Trades Closed in 2022
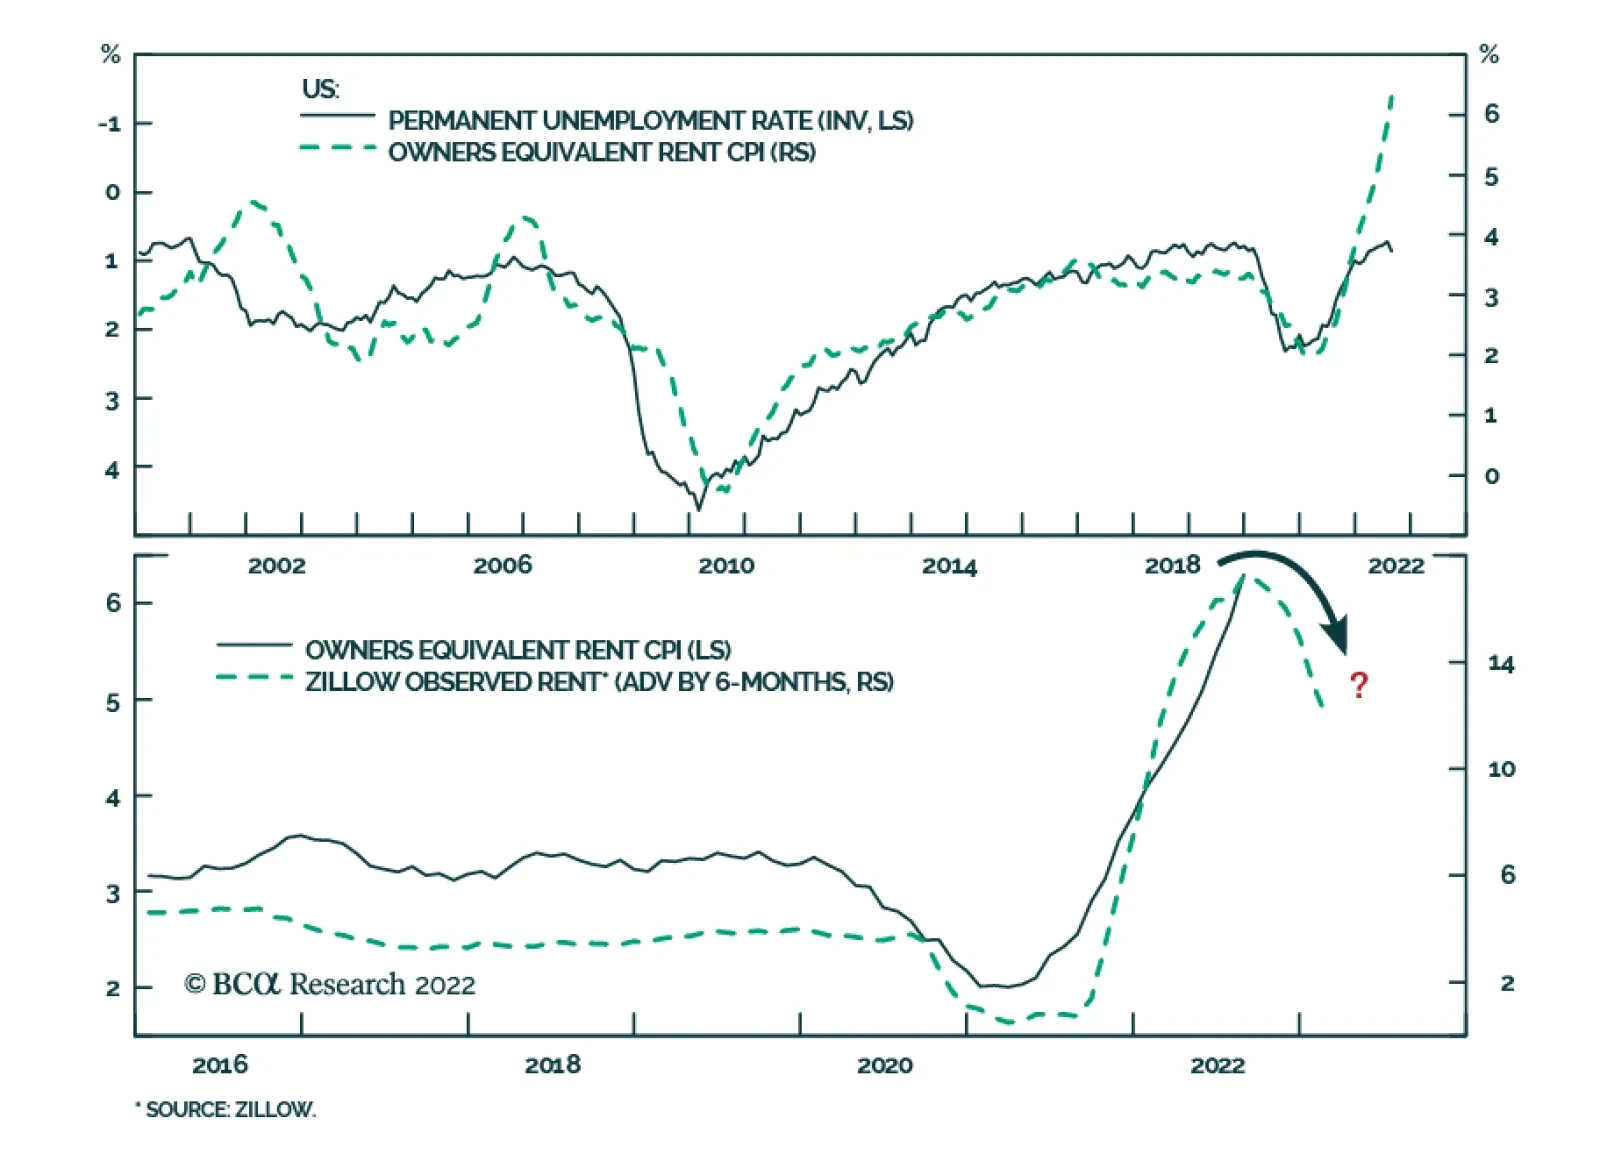
In lieu of next week’s report, I will host the monthly Counterpoint Webcast on Thursday, September 22 (9:00 AM EDT, 2:00 PM BST). In this Webcast, I will discuss the near-term and longer-term prospects for all the major asset classes: stocks, bonds, sectors, commodities, currencies, and real estate. Please mark the date in your calendar, and I do hope you can join. Executive Summary Analysing the economy as the ‘non-linear system’ that it is leads to profound conclusions about how the economy and inflation are likely to unfold, and reveals that some outcomes are impossible to achieve. It is impossible to lift the unemployment rate by ‘just’ 1-2 percent. Therefore, it is impossible to depress wage inflation by ‘just’ 1 percent. The non-linear choice is to not depress wage inflation at all, or to make wage inflation slump. Presented with this non-linear choice, central banks will likely choose to make wage inflation slump, which will take core inflation well south of the 2 percent target within the next couple of years. The structural low in bond yields, the structural low in commodity prices, the structural high in stock market valuations, and the structural high in the US dollar are yet to come. It Is Impossible To Lift The Unemployment Rate By ‘Just’ 1-2 Percent
It Is Impossible To Lift The Unemployment Rate By 'Just' 1-2 Percent
It Is Impossible To Lift The Unemployment Rate By 'Just' 1-2 Percent
Bottom Line: Inflation will slump to well below 2 percent within the next couple of years. Feature Our non-linear world often surprises our linear minds. If we discover that a small cause produces a small effect, we think that double the cause produces double the effect, and that triple the cause produces triple the effect. But in our non-linear world, double the cause could produce no effect, or half the effect, or ten times the effect. Just as important, in a non-linear world, some outcomes turn out to be impossible. In a non-linear system, some outcomes are impossible to achieve. As I will now discuss, analysing the economy as the non-linear system that it is leads to profound conclusions about how the economy and inflation are likely to unfold, and reveals that some outcomes are impossible to achieve. In A Non-Linear System, Some Outcomes Are Impossible A good physical example of a non-linear system that we can apply to inflation is to attach an elastic band to the front of a brick. And then to try pulling the brick across a table at a constant speed, say 2 mph. It’s impossible! First, nothing happens. The brick is held in place by friction. Then, at a tipping point of pulling, it starts to accelerate. Simultaneously, the friction decreases, self-reinforcing the acceleration to well above 2 mph. Meanwhile, your response – to stop pulling – happens with a lag. The result is that, the brick refuses to budge, and then it hits you in the face. Try as you might, it is impossible to pull the brick at a constant 2 mph (Figure 1 and Figure 2). Figure 1The Forces On A Brick Pulled By An Elastic Band
Inflation’s ‘Non-Linearity’ Makes It Uncontrollable
Inflation’s ‘Non-Linearity’ Makes It Uncontrollable
Figure 2The Net Forces On A Brick Pulled By An Elastic Band
Inflation’s ‘Non-Linearity’ Makes It Uncontrollable
Inflation’s ‘Non-Linearity’ Makes It Uncontrollable
In mathematical terms, the reduction in friction as the brick starts to move is known as ‘self-reinforcing feedback’. The lag in applying the brakes is called ‘delayed corrective feedback’. Their combined effect is to make it impossible to pull the brick at a constant 2 mph. Now, to model inflation, attach an elastic band to both the front and the back of the brick, and find a friend. Your task, ‘policy loosening’, is to accelerate the stationary brick to a steady 2 mph. The analogy being to run inflation at 2 percent. On the opposite side, your friend’s task, call it ‘policy tightening’, is what central banks are desperate to do now – to rein back an out-of-control brick heading towards your face at 10 mph. But without slowing it to a standstill, or worse, reversing direction. The analogy being to avoid outright deflation. You will discover that you can move the brick sharply forwards (and sharply backwards), but you cannot move it forwards at a steady 2 mph! The brick-on-an-elastic-band analogy explains why it is impossible for policymakers to run inflation at a constant 2 percent. Inflation either careers out of control, as now, or stays stuck below 2 percent, as it did through the 2010s. Inflation cannot run ‘close to 2 percent’. It Is Impossible To Lift The Unemployment Rate By ‘Just’ 1-2 Percent Central to the non-linearity of inflation is the non-linearity of the jobs market, in which some outcomes are impossible. Specifically, it has proved impossible to lift the unemployment rate by ‘just’ 1-2 percent. It has proved impossible to lift the unemployment rate by ‘just’ 1-2 percent. Through the past 75 years, whenever the US unemployment rate has increased by 0.6 percent, it has then gone on to increase by at least 2.1 percent from the trough. In no case has the unemployment rate risen by ‘just’ 0.6-2.1 percent. In other words, the unemployment rate nudges up by 0.5 percent or less, or it surges by 2.1 percent or more. There is no middle ground. Indeed, through more recent history the surge has been 2.5 percent or more (Chart I-1 and Chart I-2). Chart I-1It Is Impossible To Lift The Unemployment Rate By 'Just' 1-2 Percent
It Is Impossible To Lift The Unemployment Rate By 'Just' 1-2 Percent
It Is Impossible To Lift The Unemployment Rate By 'Just' 1-2 Percent
Chart I-2It Is Impossible To Lift The Unemployment Rate By 'Just' 1-2 Percent
It Is Impossible To Lift The Unemployment Rate By 'Just' 1-2 Percent
It Is Impossible To Lift The Unemployment Rate By 'Just' 1-2 Percent
As with the brick-on-an-elastic-band, we can explain this non-linearity through the concepts of self-reinforcing feedback combined with delayed negative feedback. At a tipping point of rising unemployment, consumers pull in their horns and slow their spending, while banks slow their lending. This constitutes the self-reinforcing feedback which accelerates the downturn. Meanwhile, as it takes time for this downturn to appear in the data, policymakers respond with a lag, and when their response eventually comes, it also acts with a lag. This constitutes the delayed negative feedback, by which time the unemployment rate has surged, with every 1 percent rise in the unemployment rate depressing wage inflation by 0.5 percent (Chart I-3 and Chart I-4). Chart I-32001-02: Every 1 Percent Rise In The Unemployment Rate Depressed Wage Inflation By 0.5 Percent
2001-02: Every 1 Percent Rise In The Unemployment Rate Depressed Wage Inflation By 0.5 Percent
2001-02: Every 1 Percent Rise In The Unemployment Rate Depressed Wage Inflation By 0.5 Percent
Chart I-42008-09: Every 1 Percent Rise In The Unemployment Rate Depressed Wage Inflation By 0.5 Percent
2008-09: Every 1 Percent Rise In The Unemployment Rate Depressed Wage Inflation By 0.5 Percent
2008-09: Every 1 Percent Rise In The Unemployment Rate Depressed Wage Inflation By 0.5 Percent
All of which brings me to a crucial point: The non-linearity in the jobs market implies a non-linearity in inflation control. Given that it is impossible to lift the unemployment rate by ‘just’ 2 percent, it is also impossible to depress wage inflation by ‘just’ 1 percent. The choice is to not depress wage inflation at all, or to make wage inflation slump. This presents a major dilemma for policymakers in their current battle against inflation. If they choose to not depress wage inflation at all, core inflation will remain north of 3 percent and destroy central banks’ already tattered credibility to achieve and maintain price stability (Chart I-5). In the medium term, this would un-anchor long-term inflation expectations, push up bond yields, and further destabilise the financial and housing markets. Chart I-5Wage Inflation Is Running Too Hot For The 2 Percent Inflation Target
Wage Inflation Is Running Too Hot For The 2 Percent Inflation Target
Wage Inflation Is Running Too Hot For The 2 Percent Inflation Target
On the other hand, if central banks do choose to depress wage inflation, the non-linearity of the jobs market implies that wage inflation will slump, taking core inflation south of the 2 percent target. Central banks could pray that a surge in productivity growth might save their skins. If productivity growth surged, elevated wage inflation might still be consistent with 2 percent inflation, as it was in the early 2000s. But we wouldn’t bet on this outcome (Chart I-6). Chart I-6Don't Bet On A Repeat Of The Early 2000s Productivity Miracle
Don't Bet On A Repeat Of The Early 2000s Productivity Miracle
Don't Bet On A Repeat Of The Early 2000s Productivity Miracle
Inflation Will Not Run ‘Close To 2 Percent’ To summarise then, the economy is a non-linear system, and should be analysed as such. In uniquely doing so in this report, we reach a profound conclusion. The non-linearity of the jobs market and inflation control means that it is impossible for core inflation to run ‘close to 2 percent’. Depending on which of the non-linear options that policymakers choose – to not depress wage inflation at all, or to make wage inflation slump – inflation will either remain well above 2 percent, or slump to well below 2 percent within the next couple of years. Which option will the central banks choose? My answer is that they will make wage inflation slump. This is not just to save their own skins, but a genuine belief that the worse long-term outcome for the economy would be if central banks’ credibility to maintain price stability was destroyed. To prevent this outcome, a recession is a price that they are willing to pay. Central banks will choose to make wage inflation slump. Not just to save their own skins, but because the worse long-term outcome for the economy would be if price stability was destroyed. But what if I am wrong, and they choose not to depress wage inflation? In this case, long-term inflation expectations would become un-anchored, pushing up bond yields, and crashing the financial and housing markets. In turn, this would unleash a massive deflationary impulse which would end up creating an even deeper recession. So, we would end up at the same place, albeit later and via a more circuitous route. All of which confirms some long-held views. The structural low in bond yields, the structural low in commodity prices, the structural high in stock market valuations, and the structural high in the US dollar are yet to come. Chart 1Hungarian Bonds Are Oversold
Hungarian Bonds Are Oversold
Hungarian Bonds Are Oversold
Chart 2Copper Is Experiencing A Tactical Rebound
Copper Is Experiencing A Tactical Rebound
Copper Is Experiencing A Tactical Rebound
Chart 3US REITS Are Oversold Versus Utilities
US REITS Are Oversold Versus Utilities
US REITS Are Oversold Versus Utilities
Chart 4FTSE100 Outperformance Vs. Euro Stoxx 50 Is Vulnerable To Reversal
FTSE100 Outperformance Vs. Euro Stoxx 50 Is Vulnerable To Reversal
FTSE100 Outperformance Vs. Euro Stoxx 50 Is Vulnerable To Reversal
Chart 5Netherlands' Underperformance Vs. Switzerland Has Ended
Netherlands' Underperformance Vs. Switzerland Has Ended
Netherlands' Underperformance Vs. Switzerland Has Ended
Chart 6The Sell-Off In The 30-Year T-Bond At Fractal Fragility
The Sell-Off In The 30-Year T-Bond At Fractal Fragility
The Sell-Off In The 30-Year T-Bond At Fractal Fragility
Chart 7Food And Beverage Outperformance Is Exhausted
Food And Beverage Outperformance Is Exhausted
Food And Beverage Outperformance Is Exhausted
Chart 8German Telecom Outperformance Has Started To Reverse
German Telecom Outperformance Has Started To Reverse
German Telecom Outperformance Has Started To Reverse
Chart 9Japanese Telecom Outperformance Vulnerable To Reversal
Japanese Telecom Outperformance Vulnerable To Reversal
Japanese Telecom Outperformance Vulnerable To Reversal
Chart 10The Strong Trend In The 18-Month-Out US Interest Rate Future Has Ended
The Strong Trend In The 18-Month-Out US Interest Rate Future Has Ended
The Strong Trend In The 18-Month-Out US Interest Rate Future Has Ended
Chart 11The Strong Downtrend In The 3 Year T-Bond Has Ended
The Strong Downtrend In The 3 Year T-Bond Has Ended
The Strong Downtrend In The 3 Year T-Bond Has Ended
Chart 12The Outperformance Of Tobacco Vs. Cannabis Is Ending
The Outperformance Of Tobacco Vs. Cannabis Is Ending
The Outperformance Of Tobacco Vs. Cannabis Is Ending
Chart 13Biotech Is A Major Buy
Biotech Is A Major Buy
Biotech Is A Major Buy
Chart 14Norway's Outperformance Has Ended
Norway's Outperformance Has Ended
Norway's Outperformance Has Ended
Chart 15Cotton Versus Platinum Has Reversed
Cotton Versus Platinum Has Reversed
Cotton Versus Platinum Has Reversed
Chart 16Switzerland's Outperformance Vs. Germany Is Exhausted
Switzerland's Outperformance Vs. Germany Is Exhausted
Switzerland's Outperformance Vs. Germany Is Exhausted
Chart 17USD/EUR Is Vulnerable To Reversal
USD/EUR Is Vulnerable To Reversal
USD/EUR Is Vulnerable To Reversal
Chart 18The Outperformance Of MSCI Hong Kong Versus China Has Ended
The Outperformance Of MSCI Hong Kong Versus China Has Ended
The Outperformance Of MSCI Hong Kong Versus China Has Ended
Chart 19US Utilities Outperformance Vulnerable To Reversal
US Utilities Outperformance Vulnerable To Reversal
US Utilities Outperformance Vulnerable To Reversal
Chart 20The Outperformance Of Oil Versus Banks Is Exhausted
The Outperformance Of Oil Versus Banks Is Exhausted
The Outperformance Of Oil Versus Banks Is Exhausted
Dhaval Joshi Chief Strategist dhaval@bcaresearch.com Fractal Trading System Fractal Trades
Inflation’s ‘Non-Linearity’ Makes It Uncontrollable
Inflation’s ‘Non-Linearity’ Makes It Uncontrollable
Inflation’s ‘Non-Linearity’ Makes It Uncontrollable
Inflation’s ‘Non-Linearity’ Makes It Uncontrollable
6-Month Recommendations Structural Recommendations Closed Fractal Trades Indicators To Watch - Bond Yields Chart II-1Indicators To Watch - Bond Yields - Euro Area
Indicators To Watch - Bond Yields - Euro Area
Indicators To Watch - Bond Yields - Euro Area
Chart II-2Indicators To Watch - Bond Yields - Europe Ex Euro Area
Indicators To Watch - Bond Yields - Europe Ex Euro Area
Indicators To Watch - Bond Yields - Europe Ex Euro Area
Chart II-3Indicators To Watch - Bond Yields - Asia
Indicators To Watch - Bond Yields - Asia
Indicators To Watch - Bond Yields - Asia
Chart II-4Indicators To Watch - Bond Yields - Other Developed
Indicators To Watch - Bond Yields - Other Developed
Indicators To Watch - Bond Yields - Other Developed
Indicators To Watch - Interest Rate Expectations Chart II-5Indicators To Watch - Interest Rate Expectations
Indicators To Watch - Interest Rate Expectations
Indicators To Watch - Interest Rate Expectations
Chart II-6Indicators To Watch - Interest Rate Expectations
Indicators To Watch - Interest Rate Expectations
Indicators To Watch - Interest Rate Expectations
Chart II-7Indicators To Watch - Interest Rate Expectations
Indicators To Watch - Interest Rate Expectations
Indicators To Watch - Interest Rate Expectations
Chart II-8Indicators To Watch - Interest Rate Expectations
Indicators To Watch - Interest Rate Expectations
Indicators To Watch - Interest Rate Expectations
Eurozone industrial production contracted by a larger-than-expected 2.3% m/m in July following a 1.1% increase in June. Capital goods and durable consumer goods led the July decline. Going forward, the outlook for the European economy remains pessimistic.…
The hotter-than-expected August US inflation report created a strong tailwind for the dollar on Tuesday, with the DXY soaring by 1.4% on the day. Curiously, the Japanese yen – which is the worst performing major currency this year due to the BoJ’s unique…
According to BCA Research’s US Investment Strategy service, investors are overly pessimistic about US corporate earnings prospects. The analyst consensus currently estimates that S&P 500 earnings per share over the next four quarters will exceed the…
Executive Summary Inflation Surprise Reinforces Gridlock And Fiscal Drag
A Politicized Fed? Another Blue Sweep? And Other Risks
A Politicized Fed? Another Blue Sweep? And Other Risks
A US recession is increasingly likely as the Fed will have to hike rates more aggressively in the short run to contain inflation. Recession would exacerbate US policy uncertainty during a period of peak polarization in the 2022-24 election cycle. The Fed’s struggle with inflation will become entangled in extreme US politics. The Fed will come under immense pressure to pause rate hikes earlier than warranted in 2023. The Fed could get blamed for both over-tightening and politicization. Investors should fade the risk of another Democratic sweep in the midterm elections. Republicans are still highly likely to gain control of the House, resulting in gridlock and a freeze to fiscal policy. If Democrats lose the House, their odds of retaining the White House will decline. A recession would greatly reduce their odds. In this context the US faces another tumultuous political cycle, as Republicans will stage a comeback. However, reform of the Electoral Count Act could reduce the risk of a catastrophic breakdown in the electoral system. Recommendation (Tactical) INITIATION DATE Return Long DXY (Dollar Index) Feb 23, 2022 12.6% Bottom Line: Stay long US dollar for now but prepare to downgrade to neutral. Feature BCA Research hosted our annual conference at the Plaza Hotel in New York last week. Clients heard a range of views on various topics, including US politics and policy. In this report we touch on some of the insights from the conference while providing our own views on what to expect going forward. A Politicized Federal Reserve? The real Fed funds rate stands at -2.2% today despite the Federal Reserve’s decision to hike rates by 225 basis points this year. The last time the real Fed funds rate was this low was in 1975, under the chairmanship of Arthur Burns – i.e. the epitome of a politicized Fed (Chart 1). Chart 1A Politicized Federal Reserve?
A Politicized Federal Reserve?
A Politicized Federal Reserve?
Is the Fed already politicized or will it become politicized in the coming years? What would that mean for monetary policy, the economy, and financial markets? The Fed waded into political territory when it began pursuing unorthodox policies in the wake of the 2008 financial crisis and again during the Covid-19 pandemic. Ideally monetary policy sets interest rates across the economy and applies equally to all economic actors. But once the Fed began quantitative easing (bond buying) and coordinating its actions with the fiscal authorities (which had bailed out major banks), it entered the game of income and wealth redistribution. Not least because asset price inflation favors asset owners over others. Now that the Fed and other central banks have pioneered these unorthodox policies, they will continue to use them in the face of future economic and political turmoil. They will also innovate new tools to deal with each crisis. As the pandemic response highlighted, the Fed will continue down the path of redistribution, which will continue to provoke political backlash from legislators and the public. At the same time, the Fed’s policy parameters today have been reined in and disciplined by the post-pandemic inflation overshoot. For example, there is not so much excited talk today about implementing Modern Monetary Theory – debt monetization – as there was in the heady days of 2019. Instead the Fed today is focused almost exclusively on fulfilling its price stability mandate, at least until inflation gets down into the 2%-3% range. The market appears over-eager for interest rate cuts in 2023 when the Fed is expecting to continue hiking rates throughout 2023 (Chart 2). The surprise in core and headline inflation in August reinforces this point. If the Fed cannot bring inflation below 3%, what will it do? Could it accept reality and modify the inflation target to 3%? A higher inflation target has long been discussed – it would enable the Fed to stimulate more effectively in the next recession. But Chairman Jerome Powell and his monetary policy strategy review rejected the idea of raising the long-term inflation target from 2% to 3% or above – and that rejection is likely to be sustained at least until the next review in 2024. Even then a higher inflation target seems unlikely as it would be very hard to achieve politically in the wake of the inflation overshoot. Chart 2Will Fed Cut Rates Next Year?
Will Fed Cut Rates Next Year?
Will Fed Cut Rates Next Year?
Of course, a lot can happen by 2024 and new deflationary shocks could conceivably force a change to the inflation target. What is clear to us is that the Fed still has a dovish bias that took a long time to develop and has not yet been entirely overturned by the inflation overshoot (Chart 3). Chart 3Dovish Consensus Built Up Over Time And Remains In Place For Now
A Politicized Fed? Another Blue Sweep? And Other Risks
A Politicized Fed? Another Blue Sweep? And Other Risks
Meanwhile the Fed’s single-minded focus on restoring price stability will bring an entirely different set of political problems – and accusations of politicization. For example, the Fed wants tighter financial conditions – since that will help to cool the economy and bring down inflation – but cannot well speak openly about deliberately driving down stock market prices and home values. The Fed also believes that a recession with unemployment ranging from 4%-5% would not be the end of the world but it cannot well speak openly about deliberately increasing unemployment. Especially because unemployment rarely stays so low in recessions. The Fed acknowledges that it will need to pause hiking interest rates at some point, hopefully before it tightens monetary conditions so much as to trigger a recession, but it does not want to call it a “pause” since financial markets will take that as a hard stop. It could cause a premature loosening of financial conditions and be blamed for a lack of vigilance when inflation revives. Will the Fed ultimately be prevented from tightening monetary policy enough because of the pressure that higher interest rates will put on the government’s fiscal sustainability? It is entirely possible. Sustaining social programs is more popular than paying bond holders. Since the Fed pays market interest rates on reserve balances, it will stop making a profit if it hikes rates to 3.25% or above (which is slated to happen this month). Very soon the Fed will be turning a loss on its holdings, rather than remitting profits to the Department of Treasury, and it will be amply criticized for spending taxpayer money. In that case there will be plenty of ammunition from critics on all sides. When it comes to the Fed’s specific predicament in 2022-24, Chairman Powell does not want to be the next Arthur Burns, i.e. he does not want to go down in history as the chairman who made a historic mistake by not forcing inflation back into an acceptable and containable range of say 2%-3.5%. Neither he nor the Fed can afford to lose control of price stability, which would damage the US economy and the Fed’s credibility. The implication is that Powell will need to hike rates until price stability is obtained. Yet even a conservative estimate would suggest that hiking rates until inflation falls beneath 3% will require the unemployment rate to rise by more than the estimated 0.5-1.0 percentage points, likely considerably more than this, which historically implies a recession in 2023-24. Recession odds have already risen sharply as priced by the bond market, according to Jonathan LaBerge at our Bank Credit Analyst flagship service (Chart 4). Of course, recession odds have an important implication for the 2022-24 political cycle, implying that the Fed’s handling of the economy will become entangled once again in America’s extreme political polarization. Chart 4Recession Odds Rising
Recession Odds Rising
Recession Odds Rising
Our past research has shown that the Fed does not pay close attention to midterm elections. The Fed is more likely to hike rates than cut rates during a midterm election year – and more likely to hike rates during a president’s first midterm election as opposed to his second. Whereas the Fed is about equally likely to cut rates as to hike them during a presidential election year. Most importantly, the Fed is more likely to hike rates during a non-election year than otherwise (Table 1). Table 1The Fed Doesn’t Care About Midterms … But Prefers To Hike In Off-Years
A Politicized Fed? Another Blue Sweep? And Other Risks
A Politicized Fed? Another Blue Sweep? And Other Risks
While the Fed had no choice but to hike in 2022, supporting these data, a critical decision will emerge in 2023, when the Fed is still expected to hike but the risk of recession grows. Recessions sharply reduce the odds of the incumbent political party staying in the White House (Table 2). Moreover a recession could bring back President Trump or a Trumpist Republican candidate bent on revenge against the political establishment. The result is that the FOMC will be under immense political pressure not to overtighten monetary policy in 2023-24. In normal times, a Fed chair appointed by a Republican president could conceivably have the license to hike rates aggressively to whip inflation, knowing that if a recession occurs and a Republican comes to power, he would be likely to be reappointed. But Powell can have no such assurance from the erratic President Trump, who is still favored for the Republican nomination as things stand. Even aside from Trump, Powell and the FOMC will fear that a populist Republican Party would seek to audit the Fed or curtail its powers. Table 2Biden’s Odds Fall If Recession Occurs
A Politicized Fed? Another Blue Sweep? And Other Risks
A Politicized Fed? Another Blue Sweep? And Other Risks
In sum, the Washington political establishment believes it is under attack from right-wing insurrectionists and will put immense pressure on the FOMC to avoid triggering a recession in 2023-24. This could produce an inflationary surprise. Bottom Line: A recession is likely to occur as the Fed continues hiking rates to bring inflation below 3%. This increases political uncertainty for the 2022-24 cycle. But a politicized Fed may compromise when inflation is closer to 4% for fear of a populist win in 2024. That would likely prove to be a historic monetary policy mistake, enabling long-term inflation expectations to rise substantially. Midterm Elections: Fade The “Blue Sweep” Risk While the Fed ignores midterm elections, investors are increasingly uncertain over fiscal policy and the outcome of the midterms. Will Congress become gridlocked, as we expect, or will Democrats retain control of Congress and continue the federal spending splurge that has played a large role in the inflation overshoot? Clearly the midterm races have tightened since President Biden changed his tone and started prioritizing the fight against inflation back in June. As inflation has abated, online betting markets have discounted Republican odds of victory, particularly in the Senate where they are now 36% (Chart 5). We anticipated that Biden’s approval ratings would stabilize on the passage of legislation and that the election would tighten in the final months, particularly on the back of women voters turning out to support Democrats in the wake of the Supreme Court’s decision to reduce abortion access. However, we also argued that gridlock would still be the most likely result based on the high odds that the House would flip to Republican control regardless of Roe. This is a consensus view that should be challenged and reassessed as November approaches. Chart 5Bookies Still Expect Gridlock In Midterms
A Politicized Fed? Another Blue Sweep? And Other Risks
A Politicized Fed? Another Blue Sweep? And Other Risks
Senate elections are held statewide and are therefore more susceptible to a shift in suburban and women voters. State-level polls leave much to be desired but the overall picture is that the races are closer than they were earlier this year – and closer than the Republicans would want them to be (Charts 6A & 6B). Persistent high inflation should be the clincher in favor of Republicans but the Senate is simply too close to call at this stage. Chart 6ANeck-And-Neck Races In Senate
A Politicized Fed? Another Blue Sweep? And Other Risks
A Politicized Fed? Another Blue Sweep? And Other Risks
Chart 6BNeck-And-Neck Races In Senate
A Politicized Fed? Another Blue Sweep? And Other Risks
A Politicized Fed? Another Blue Sweep? And Other Risks
Yet the Senate is overrated in this election because if Democrats lose either chamber, gridlock will be the result. Gridlock is what matters most for fiscal policy and hence for investors. The gridlock view rests on the House of Representatives. While the president’s party almost always loses seats in the midterm election, losing seats is not the same as losing control. In fact, over the past 120 years, a party that controls the House and/or Senate is more likely than not to retain control in a midterm election (Chart 7). But in the post-WWII era, the president’s party is slightly more likely to lose control of the House. And in almost all midterms, the president’s party loses seats in the House. Chart 7Presidents Do Not Always Lose Control, But Dems Have Small Cushion In 2022
A Politicized Fed? Another Blue Sweep? And Other Risks
A Politicized Fed? Another Blue Sweep? And Other Risks
The key point about 2022 is that the Democrats only have a six-seat buffer in the House. In other words, losing seats is very likely to be equivalent to losing control this year. To save the House, Biden’s Democrats would have to perform as well as John F. Kennedy’s Democrats in 1962, when they only lost four House seats. Our House model predicts they will lose 21 seats (Appendix). While Democrats could beat this prediction, they would be hard pressed to lose fewer than six seats on a net basis: inflation is high and sticky, real wages and incomes have fallen, consumer confidence has fallen, the president’s approval rating is low, and approval of Congress is low. If a president’s party loses control of the House, its odds of keeping the White House in 2024 also fall (Chart 8). This is another reason for investors to expect that fiscal policy will freeze, policy uncertainty will remain high, and the Fed will be under political pressure not to hike rates aggressively in 2023-24. Chart 8Biden’s 2024 Odds Fall If He Loses The House
A Politicized Fed? Another Blue Sweep? And Other Risks
A Politicized Fed? Another Blue Sweep? And Other Risks
Bottom Line: Fade the “Blue Sweep” risk in 2022. The midterm election is tightening but Republicans are still likely to win the House. Fiscal policy will remain a drag on growth and the 2024 election will become even more uncertain, putting political pressure on the Fed to avoid overtightening. Limited Big Government Another Democratic sweep would greatly reinforce the new US policy trajectory of Big Government: a trajectory that points away from the Washington Consensus and Reagan revolution toward a future of higher taxes, larger budget deficits, higher tariffs, and more extensive regulation (Chart 9).1 But Democrats will be forced to share power. This is why we call the new policy paradigm “Limited Big Government.” It is still a shift in the direction of a larger government role in the economy and society, but it is taking place within the context of the US constitutional system of checks and balances and two-party politics. We do not expect the latter two factors to disappear. Looking at the Obama, Trump, and Biden administrations together we can see that the turn toward Big Government is also compromised by vested interests: Democrats failed to increase corporate taxes, though they did put a floor under the effective tax rate by imposing a new 15% minimum tax on corporate book income. The budget deficit is normalizing after the gargantuan pandemic stimulus. But Democratic legislation will not reduce the deficit substantially over time, contrary to Biden administration propaganda. But Republicans are fiscally profligate themselves, which is clear from Trump’s term in office as well as previous periods of single-party GOP rule. Republicans joined Democrats in passing the infrastructure bill and the Chips and Science Act, which revives US industrial policy in an era of great power competition. Biden has now accepted Trump’s tariff hikes on China. While Republican leadership may push deregulation in future, they may also believe that government regulation will be required to fight back against “woke” or socially left-wing corporations. Chart 9Buenos Aires Consensus equal Spending, Taxes, Tariffs, Regulations
A Politicized Fed? Another Blue Sweep? And Other Risks
A Politicized Fed? Another Blue Sweep? And Other Risks
Thus the US’s new policy paradigm is bipartisan in nature. Of course, if Republicans take the House they will turn fiscally conservative for tactical reasons. That will put a halt to the spending splurge of 2020-22. But it will not signal a new fiscally austere paradigm since full Republican control in 2025 would be highly likely to lead to another fiscal blowout. This is even more likely to be the case now that Republicans have adopted a populist and pro-working class approach. Bottom Line: The US shift away from limited government toward Big Government is entrenched even if it suffers a setback due to gridlock from 2022-24. Given that partisan checks will prevent the US from moving too radically in any direction, we dub this paradigm “Limited Big Government.” It is marginally inflationary due to the rise in taxes, spending, regulations, and tariffs. US Electoral System: A Possible Positive Surprise Our expectation that the Fed will be politicized and that populist policies will persist stems from the underlying inequality and political polarization in the United States. Yet these same factors serve to increase overall political instability and threaten to cause a fundamental breakdown in political order. Will US institutions be able to handle the strain in the coming election cycle? There can be no doubt that polarization is reaching dangerous extremes. The US has suffered two out of five contested elections in the past 22 years. The last two Republican presidential victories have occurred without gaining the popular vote. The Biden administration’s low approval creates the risk of another tight election in 2024, implying controversy over the vote count and procedure (see Appendix). Another tight election could lead to a single state’s controversy determining the outcome of the entire election. Or it could lead to an electoral college tie in which Congress would decide the election result and could decide against the popular verdict. It is not hard to think of scenarios where contested elections and social unrest get out of hand. For example, one important consequence of the January 6 rebellion is that future governments will suppress protests with force if they attempt to interfere with the electoral process or the workings of the legislature. But imagine if a Republican administration comes to power through a contested election in Congress and then suppresses the resulting protests against it? Or imagine if Democrats retain power and push their “domestic war on terrorism” far enough to provoke a low-level militant insurgency from disaffected nationalists? It is easy to think of scenarios on either side that could lead to a much greater breakdown in public order than what occurred in 2020. It is unlikely that an institutional fix will occur in time for the 2024 election. However, there is one exception on the congressional agenda: a possible revision of the Electoral Count Act of 1887. This law was designed to prevent a failure of the electoral system in the wake of the “Stolen Election” of 1876. Its main achievement was to have the governor of each state certify the electoral votes of that state before sending them to Washington. However, the law also leaves open the door for state legislatures, secretaries of state, and governors to influence their state’s electoral votes. Democrats have written a revised version of the law that would close some of the loopholes and ambiguities. So far 10 Senate Republicans have co-sponsored the bill, making it very likely they will vote for it (Table 3). If these Republicans do not change their minds in the critical hour, and if all Democrats can be brought to vote for the measure, then a 60-vote, filibuster-proof majority will exist to pass the law. Table 3Republican Senators Who Support Revising The Electoral Count Act
A Politicized Fed? Another Blue Sweep? And Other Risks
A Politicized Fed? Another Blue Sweep? And Other Risks
The original Electoral Count Act took ten years to pass, so there is no reason to be overly optimistic. But if 60 votes can be found in the Senate, then the electoral system will be fortified ahead of the 2024 election and structural US political risks will be at least somewhat reduced. Bottom Line: The US faces serious social and political instability in the coming years and remains at “peak polarization.” But a bipartisan law could help solidify the electoral system prior to 2024, which would reduce some of the risk of election controversies spiraling out of control. Investment Takeaways Headline consumer price inflation for August came in at 8.3% year-on-year versus an expected 8.1%, while core inflation accelerated from 5.9% to 6.3%. Financial markets took it on the chin, with the S&P500 falling by 4.3%, due to the disappointed expectation that inflation had already peaked. This disappointment is the second of its kind this year: investors have been over-eager to call the peak in inflation. Market volatility is likely to continue through the fall as investors now expect that the Fed will hike interest rates by another 75-100 basis points in September and continue hiking until inflation falls more convincingly. Twice-bitten investors will be hesitant to endorse a third rally until they are certain that inflation is coming down – but by then a recession may already be upon them. A significant increase in unemployment is likely necessary to cool inflation, which implies recession. Higher inflation will drive real wages further into the red, which is negative for the Biden administration’s midterm campaign. Otherwise the economy looked to be improving just in time for the vote. Manufacturing and non-manufacturing employment is perking up, labor force participation is reaching pre-Covid levels, and consumer confidence ticked up in the latest data, albeit still much lower than in 2021 (Chart 10). Now the tightening of financial conditions will cool the economy and sentiment in the advance of the election, reinforcing the opposition party and the expected gridlock. Inflation may indeed be peaking but not in time for the election. Throughout this year we bet on the US dollar index. This trade is getting very toppy and net speculative positions have rolled over (Chart 11). The dollar is overvalued but its momentum remains strong given extreme macroeconomic and geopolitical uncertainty. We have put this trade on watch for a downgrade to neutral but we expect the momentum to be sustained at least through the US election and Chinese party congress this fall. Chart 10Small Bounce In Economy Will Not Save Democrats
Small Bounce In Economy Will Not Save Democrats
Small Bounce In Economy Will Not Save Democrats
Chart 11Dollar Is Overvalued But Has Momentum
Dollar Is Overvalued But Has Momentum
Dollar Is Overvalued But Has Momentum
Matt Gertken Senior Vice President Chief US Political Strategy mattg@bcaresearch.com Footnotes 1 This trajectory is the opposite of the Washington Consensus. As such, Marko Papic, the founder of BCA’s Geopolitical Strategy, has dubbed it the “Buenos Aires Consensus,” as it resembles Argentine economic policy more so than the Thatcher/Reagan policy mix. Strategic View Open Tactical Positions (0-6 Months) Open Cyclical Recommendations (6-18 Months) Table A2Political Risk Matrix
A Politicized Fed? Another Blue Sweep? And Other Risks
A Politicized Fed? Another Blue Sweep? And Other Risks
Table A3US Political Capital Index
A Politicized Fed? Another Blue Sweep? And Other Risks
A Politicized Fed? Another Blue Sweep? And Other Risks
Chart A1Presidential Election Model
A Politicized Fed? Another Blue Sweep? And Other Risks
A Politicized Fed? Another Blue Sweep? And Other Risks
Chart A2Senate Election Model
A Politicized Fed? Another Blue Sweep? And Other Risks
A Politicized Fed? Another Blue Sweep? And Other Risks
Table A4House Election Model
A Politicized Fed? Another Blue Sweep? And Other Risks
A Politicized Fed? Another Blue Sweep? And Other Risks
Table A5APolitical Capital: White House And Congress
A Politicized Fed? Another Blue Sweep? And Other Risks
A Politicized Fed? Another Blue Sweep? And Other Risks
Table A5BPolitical Capital: Household And Business Sentiment
A Politicized Fed? Another Blue Sweep? And Other Risks
A Politicized Fed? Another Blue Sweep? And Other Risks
Table A5CPolitical Capital: The Economy And Markets
A Politicized Fed? Another Blue Sweep? And Other Risks
A Politicized Fed? Another Blue Sweep? And Other Risks
Stubbornly elevated US CPI inflation complicates the Fed’s task (see The Numbers). On the one hand, a failure to squash inflation risks de-anchoring inflation expectations and unleashing a vicious wage-price spiral, raising the costs associated with bringing…
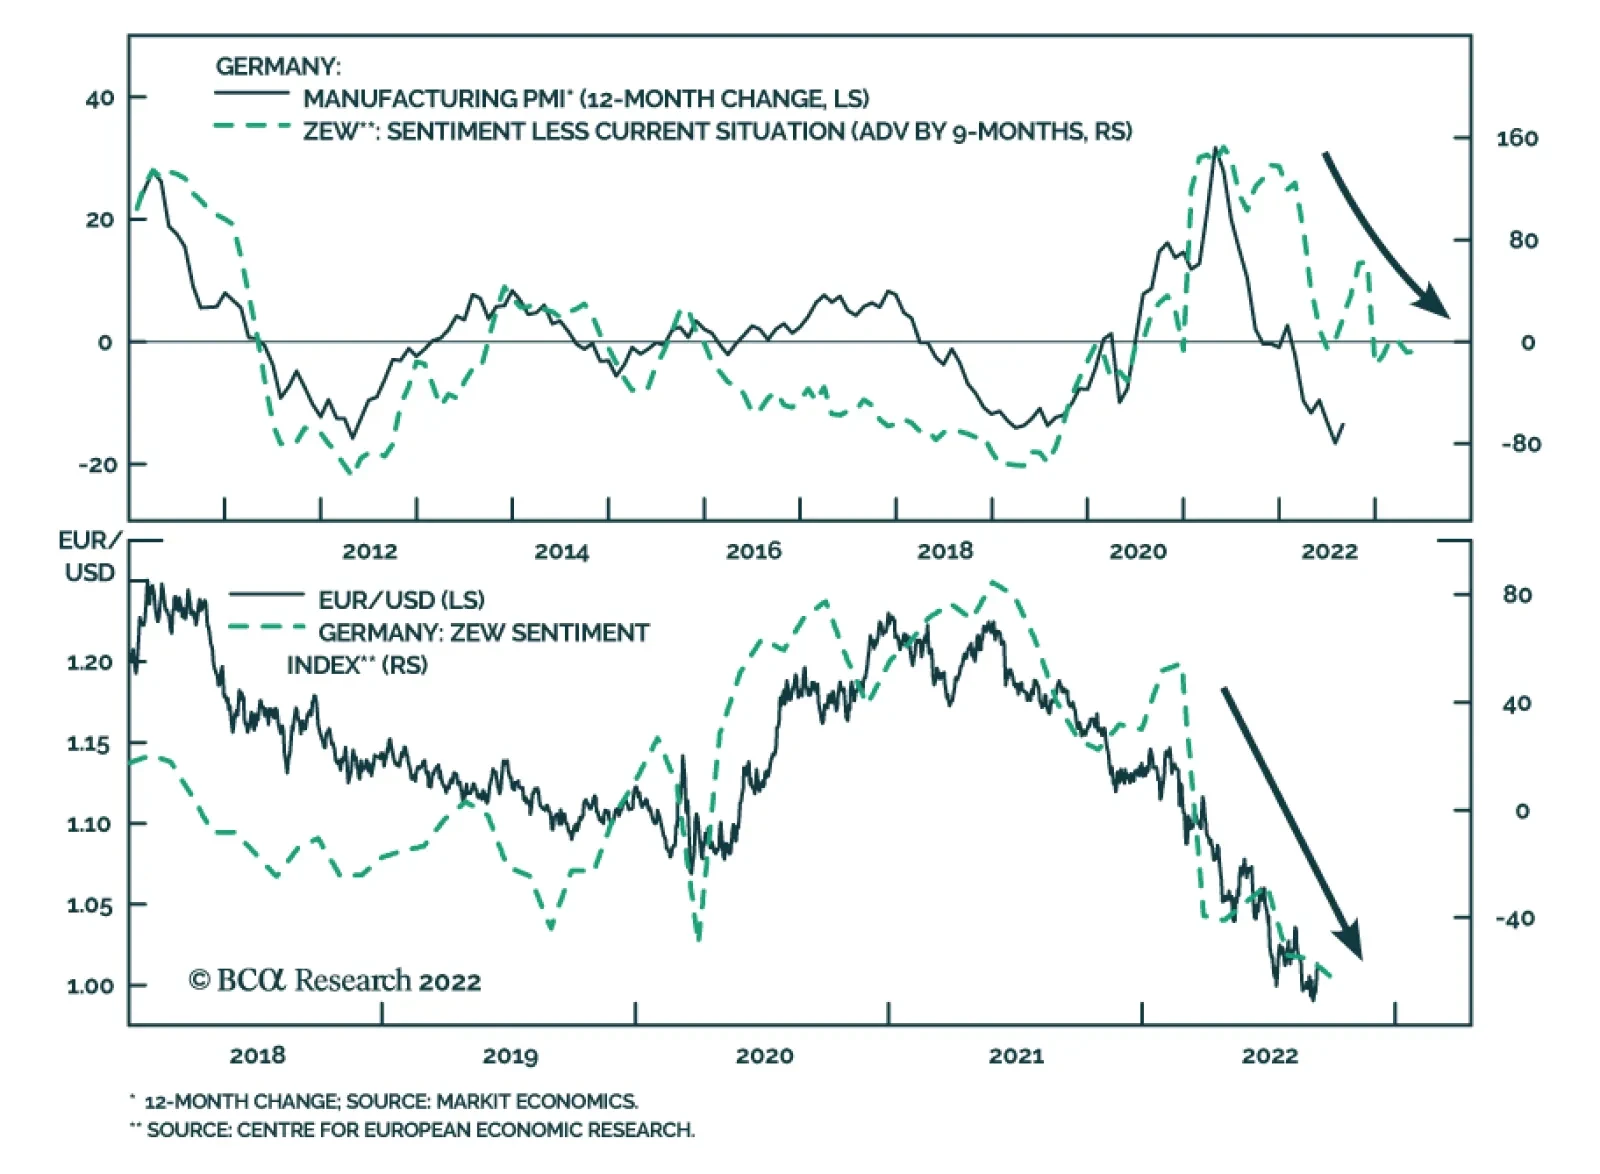
The ZEW survey of investor sentiment sent a cautionary signal on Tuesday. German investor sentiment slumped in September to the lowest level in 14 years. The current situation and expectations indices dropped by 6.6 and 12.9 points, respectively – with both…
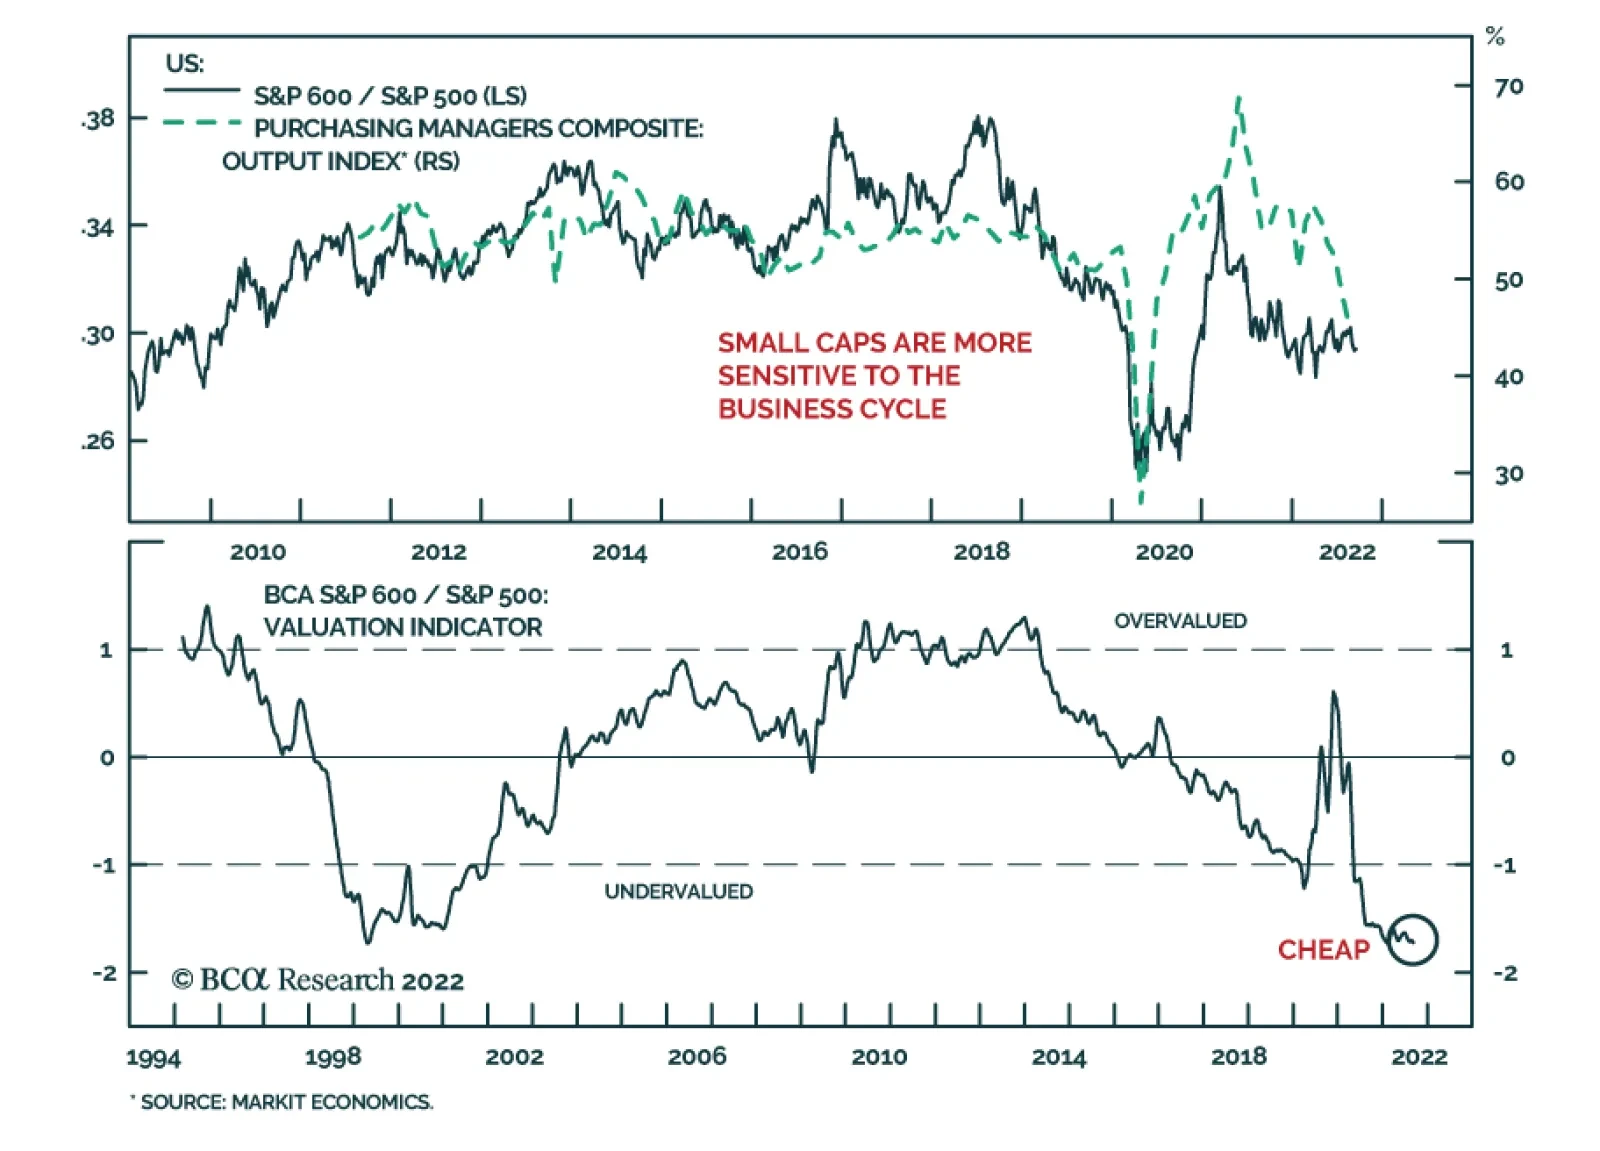
US small cap equities have performed broadly in line with their large cap peers so far this year, with both the S&P 500 and S&P 600 down nearly 14% by Monday’s close. Small caps are typically more sensitive to the business cycle. Indeed, in the…