Developed Countries
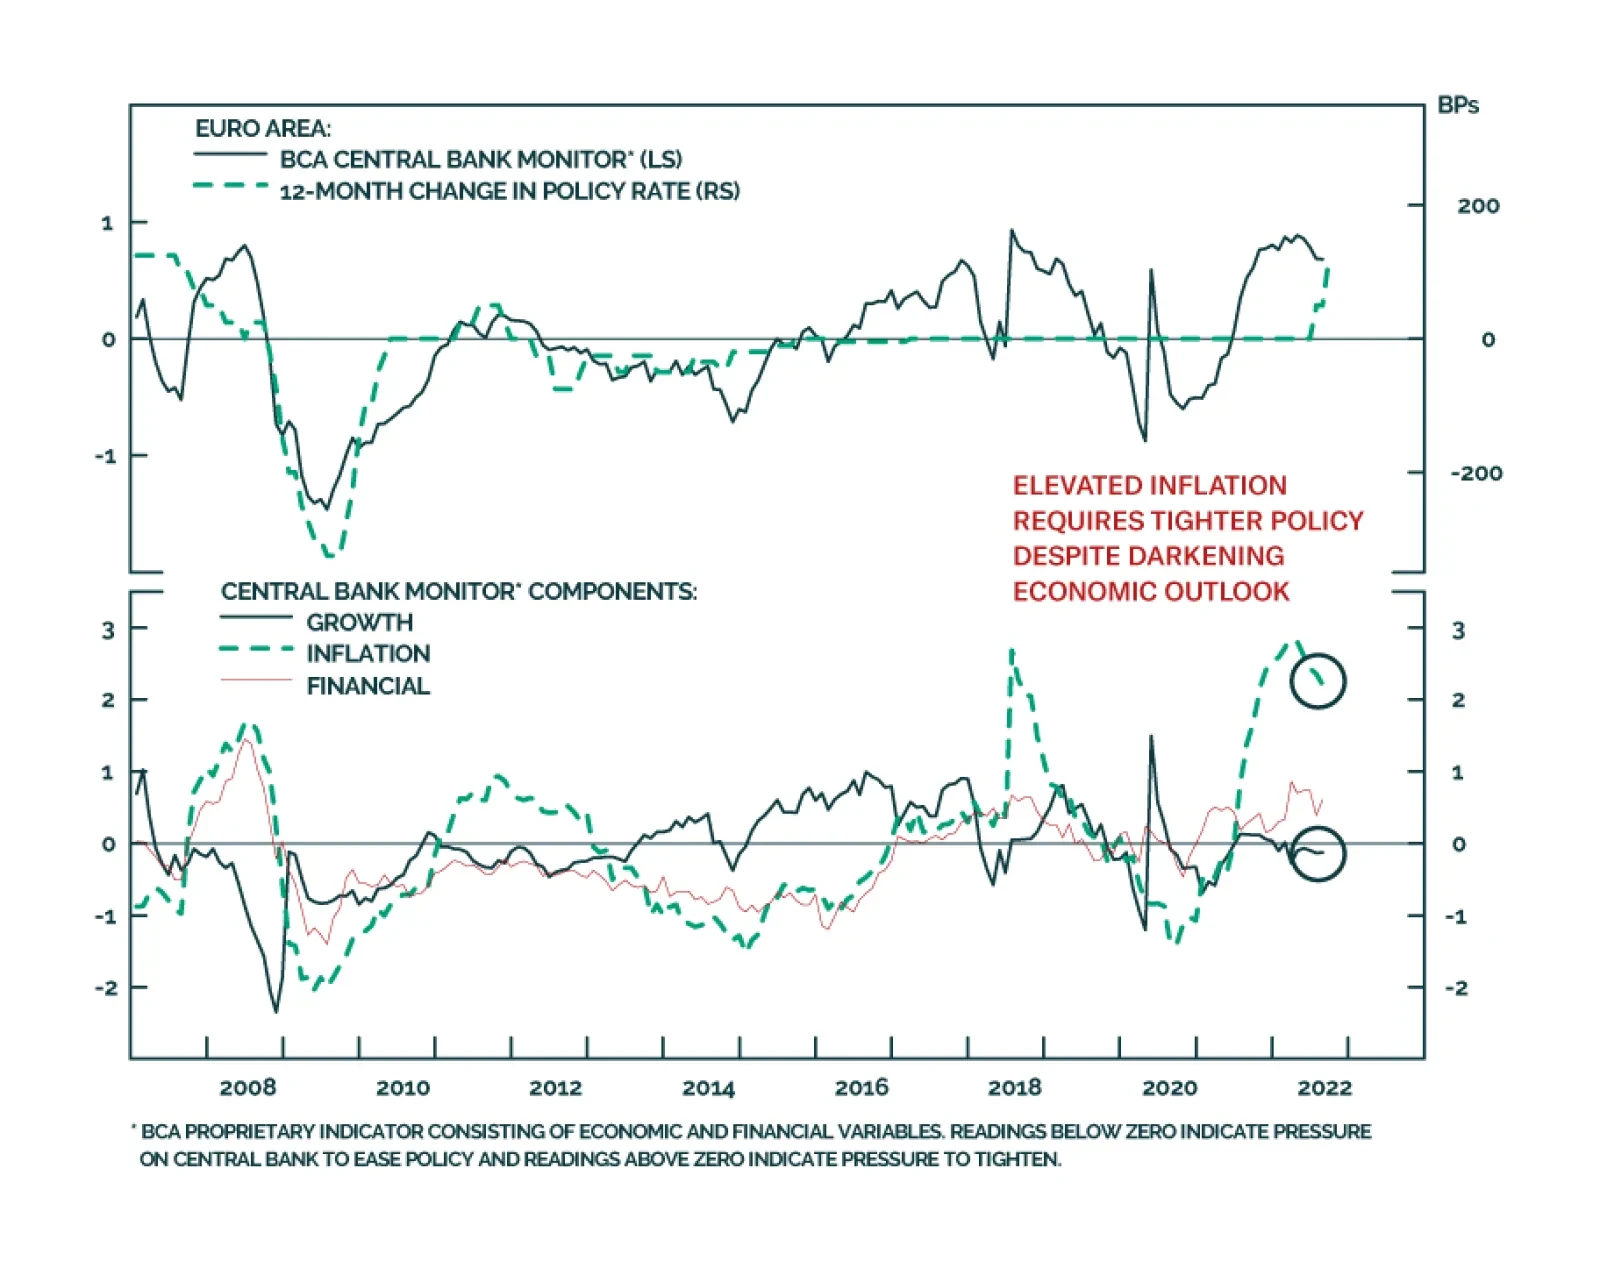
Last Thursday, the ECB raised the deposit rate by 75bps to 0.75% – in line with market expectations. The revised economic projections include an increase to the inflation forecasts with an average inflation rate of 8.1% this year (up from 6.8% in the June…
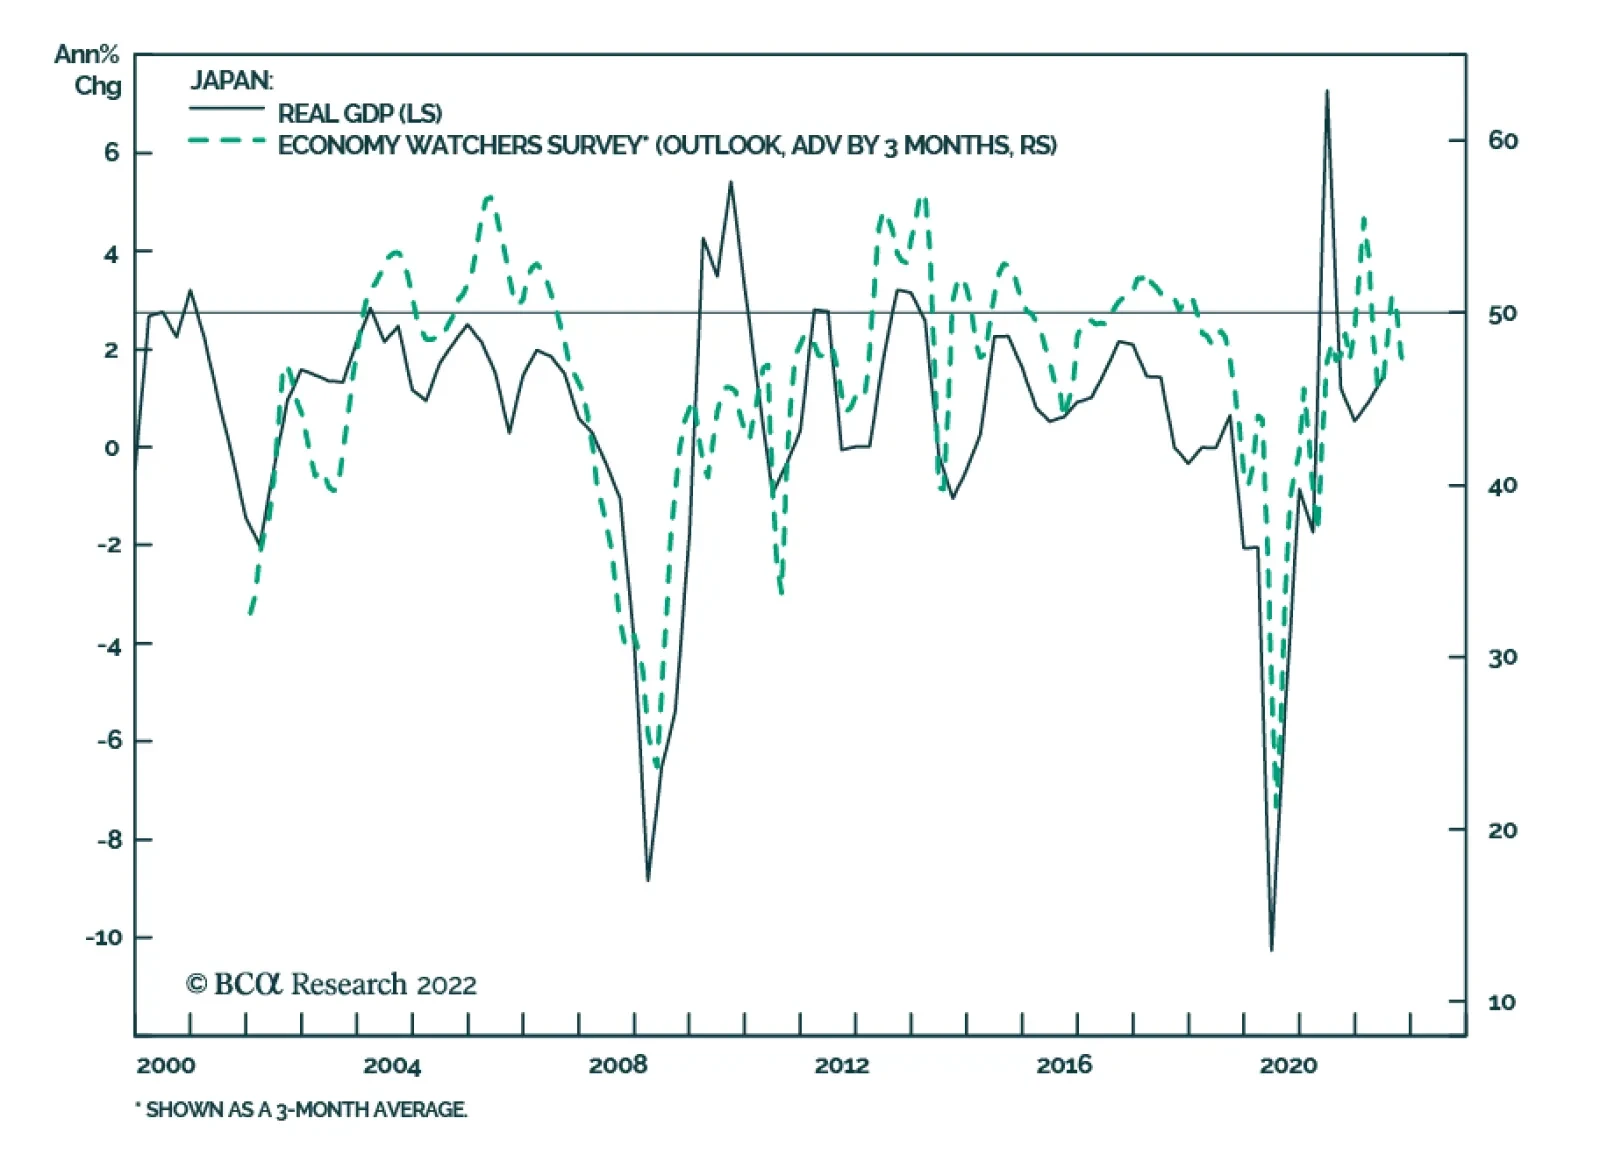
The final estimate of Japan’s second quarter GDP growth indicated that the economy grew at an annualized 3.5% q/q, from 2.2% in Q1 and largely surpassing prior estimates of 2.9%. A 2% q/q growth in business spending was the main driver of the upward revision.…
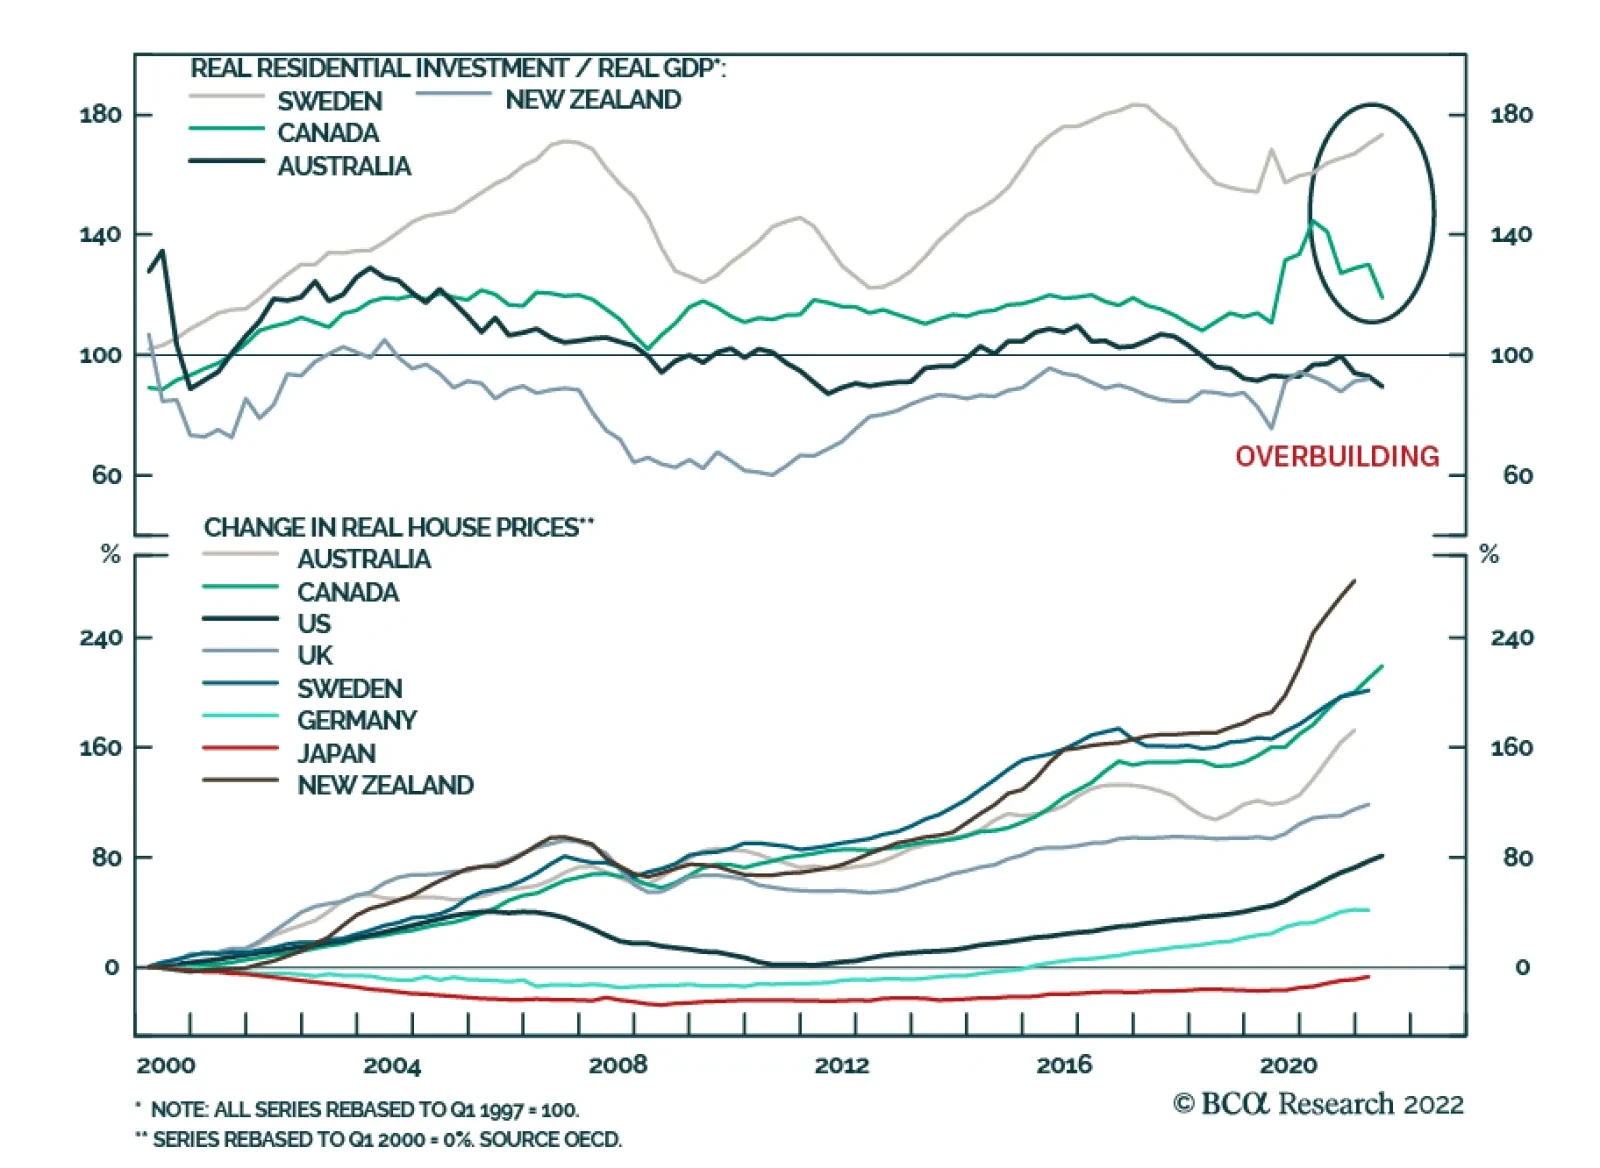
The softening housing market in the US is unlikely to tip the overall economy into a recession, or to worsen it significantly. We’ve highlighted that the scarcity of homes in the US will put a floor under the decline in home prices and will continue to…
According to BCA Research’s Global Investment Strategy service, although a drop in home prices would have adverse effects on aggregate consumer spending, the impact this time around will be far smaller than during the Great Recession. As occurred with…
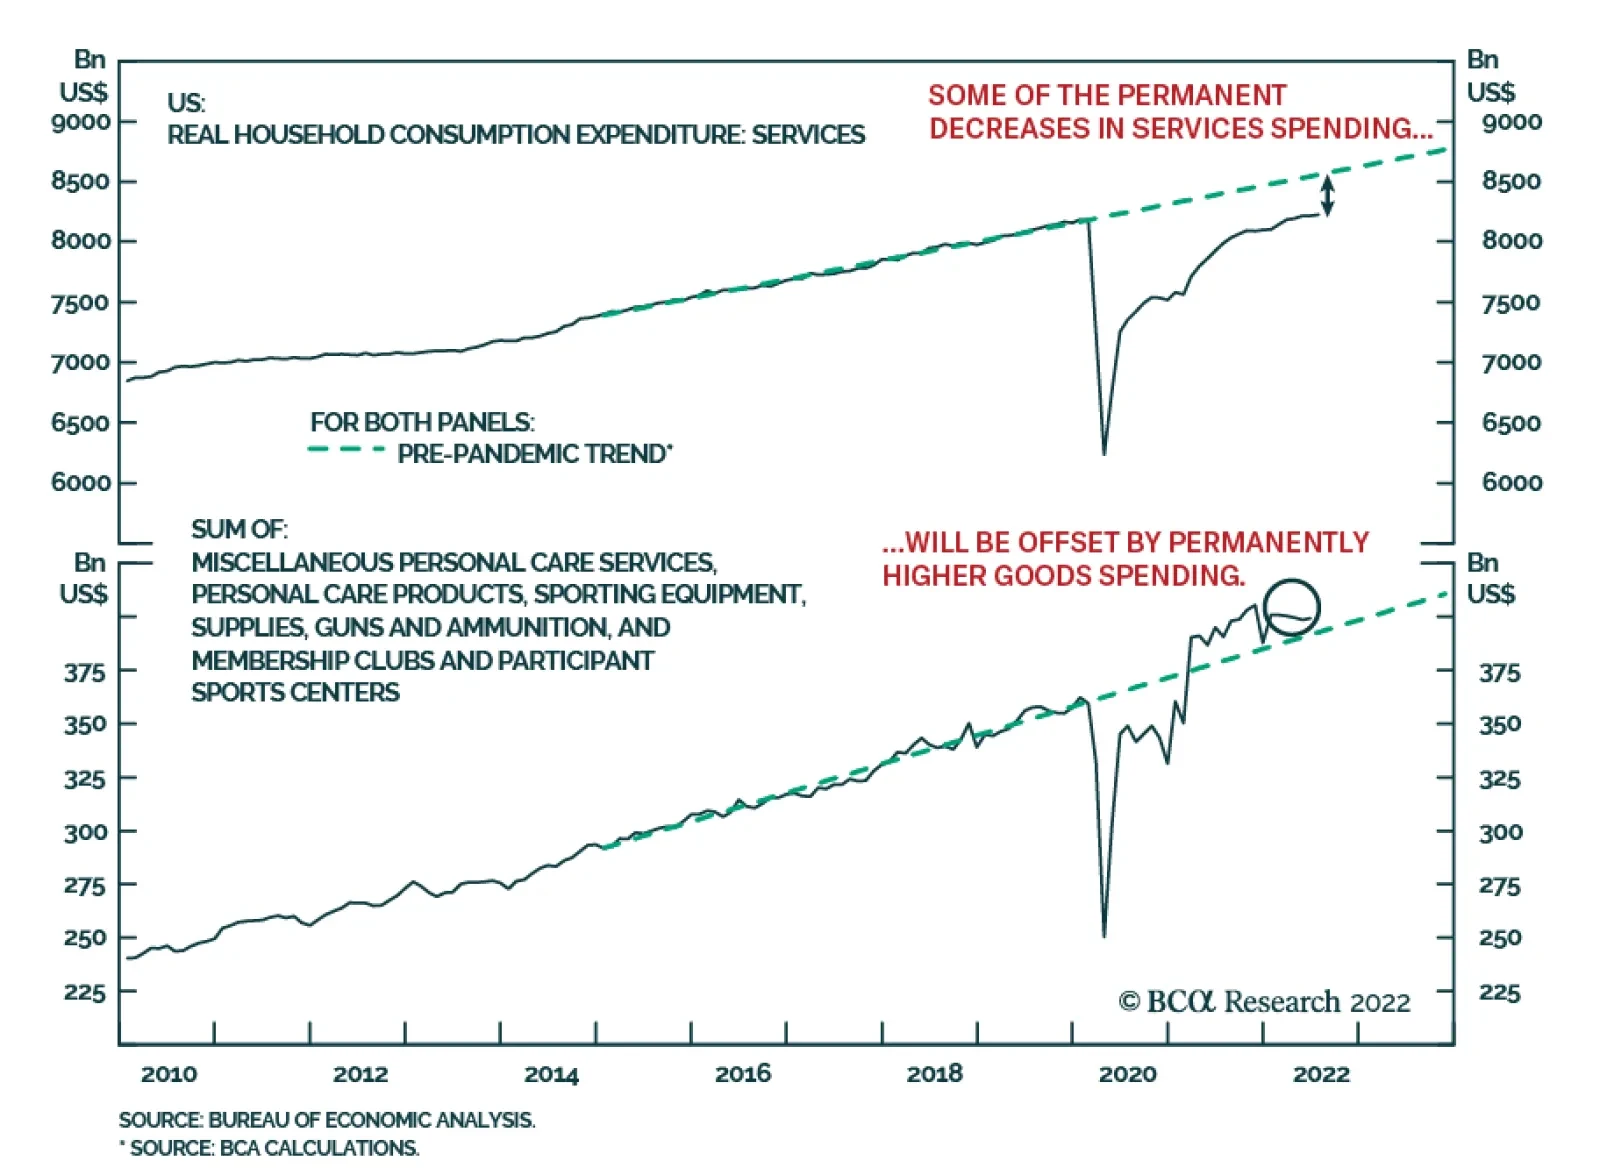
The demand normalization away from goods – which have been subject to intense price pressures – to services, is one of the factors that will contribute to lower overall inflation. However, a case can be made that services spending may…
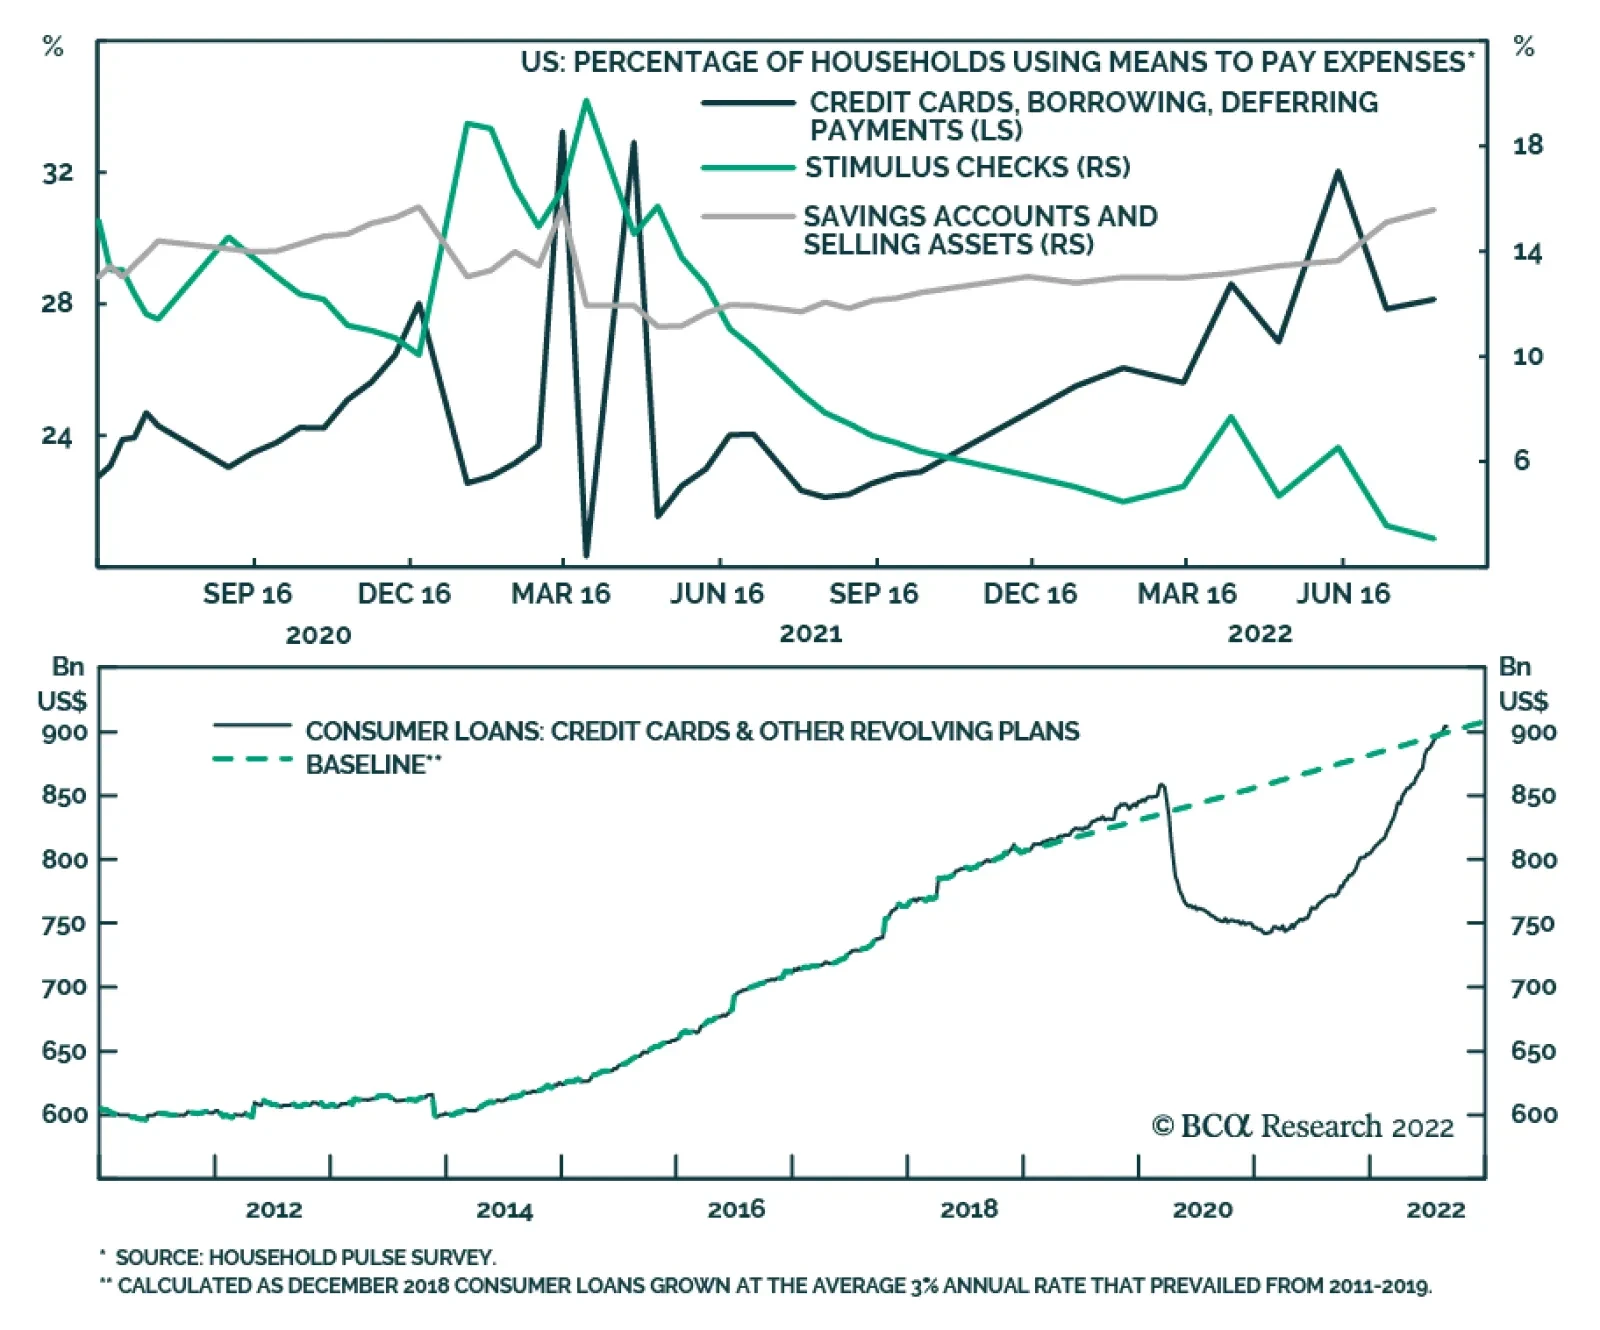
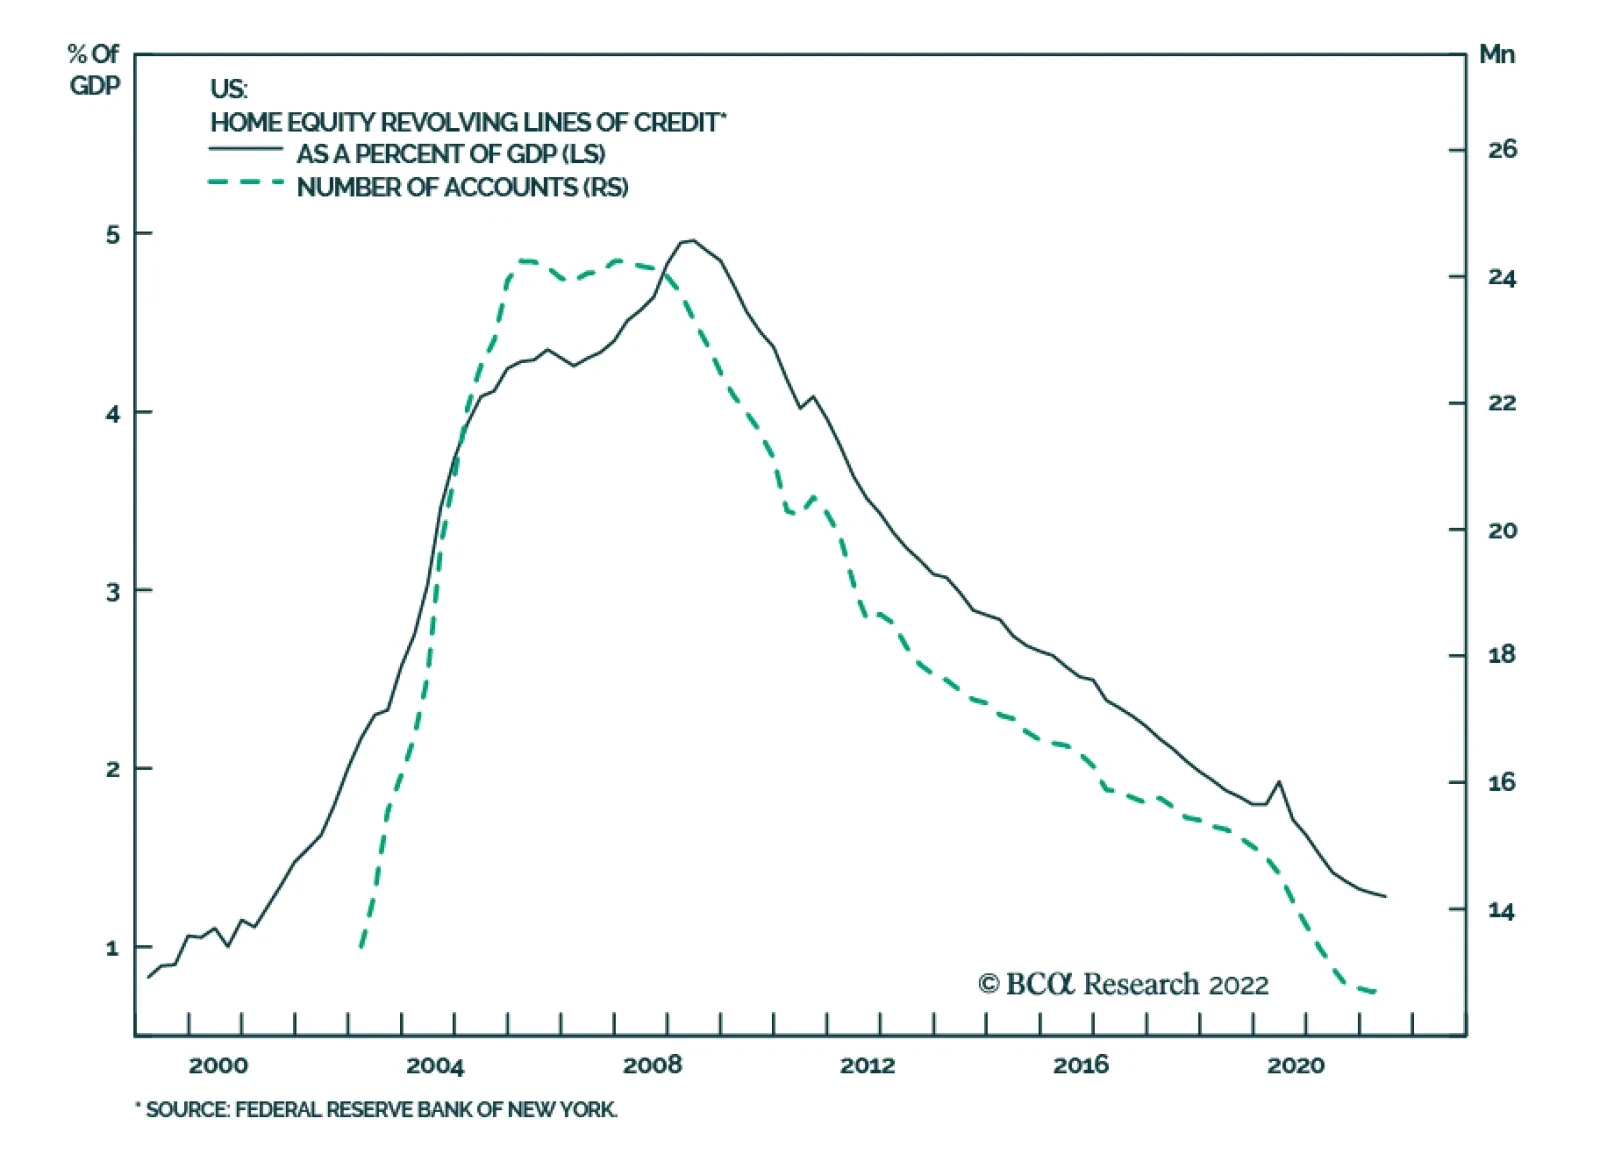
Data from the Census Bureau’s Household Pulse Survey highlight that the share of households using credit cards, borrowings and other forms of deferring payments has steadily increased since mid-2021. This data corroborates soaring credit card balances over…
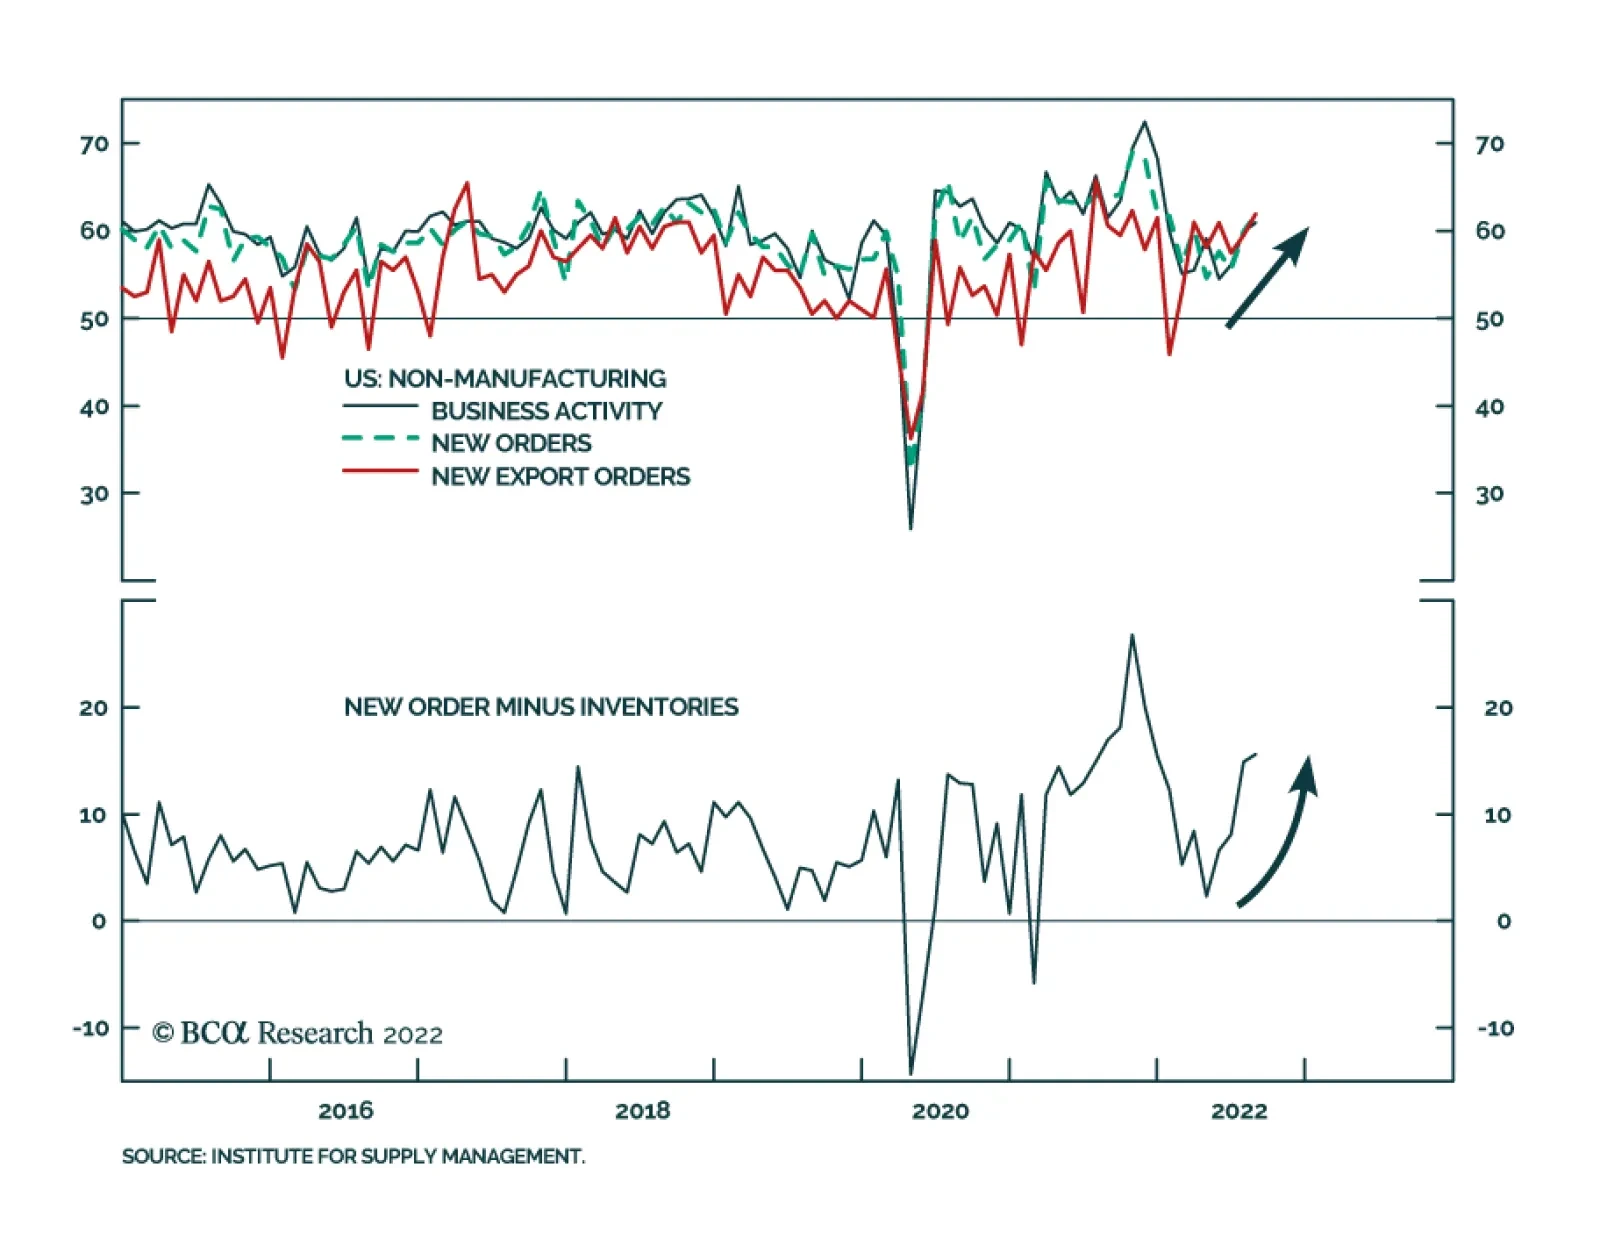
The ISM Services index rose to 56.9 in August from 56.7 and against expectations it would decelerate. The details of the release are even more encouraging. The Business Activity index firmed 1.0 ppt to 60.9, New Orders and New Export Orders increased by 1.9…
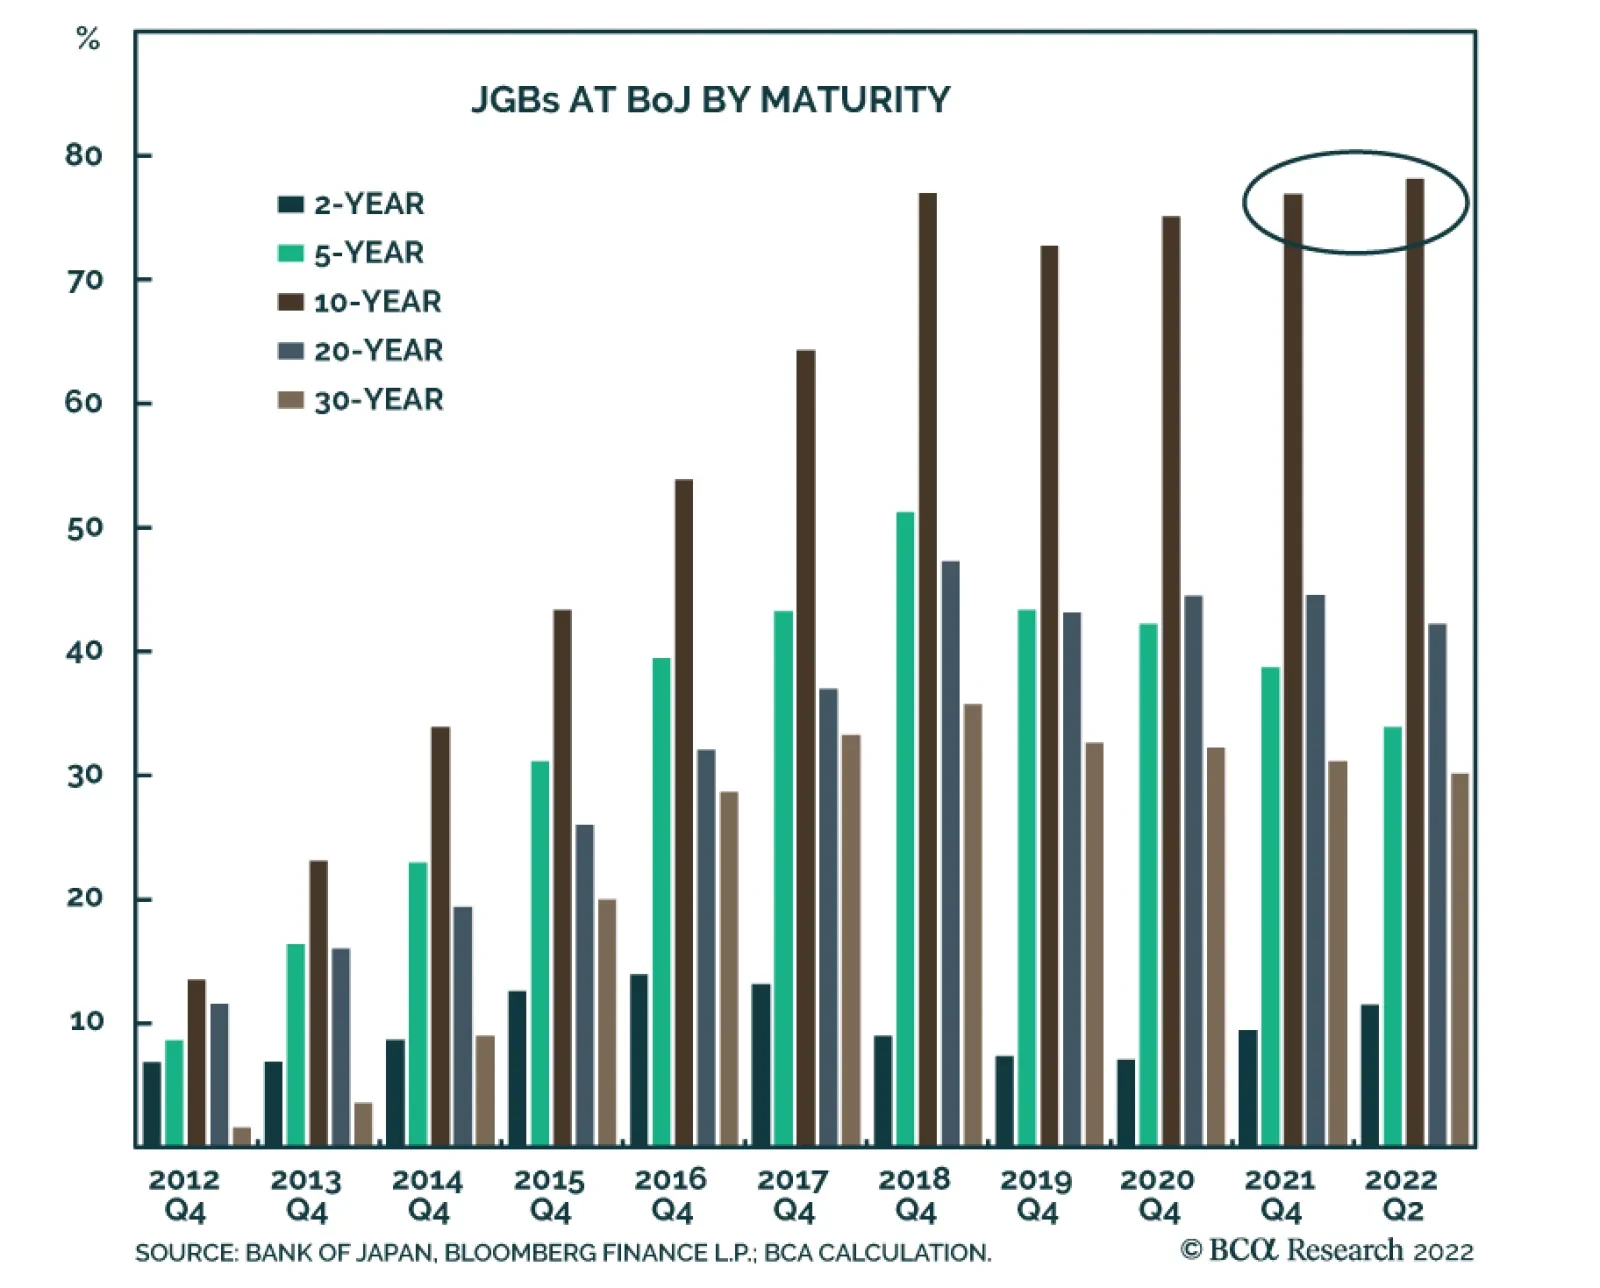
BCA Research’s Foreign Exchange Strategy service concludes that underlying inflation and growth trends in Japan are nowhere close to justifying an end to Yield Curve Control (YCC) or even a mere upward tweak of the current 0.25% yield target on 10-year JGBs. …

Highlights Chart 1A Hot Labor Market
A Hot Labor Market
A Hot Labor Market
The balance of data that’s come out during the past month points to a labor market that is not cooling very quickly. In fact, it is cooling much more slowly than we anticipated. First, nonfarm payroll growth of +315k in August is well above the +79k that is needed to maintain the unemployment and participation rates at current levels (Chart 1). Second, what had initially looked like a significant drop in job openings was revised away with the July JOLTS report. While the ratio of job openings to unemployed has leveled-off just below 2.0, it is no longer showing any signs of falling (bottom panel). Finally, the employment component of August’s ISM Manufacturing PMI jumped back above 50 and even initial unemployment claims have reversed their nascent uptrend. The conclusion we draw from this spate of strong employment data is that the Fed’s tightening cycle is not close to over. This means that the average fed funds rate that is priced into markets for 2023 is almost certainly too low. Feature Table 1 Recommended Portfolio Specification Table 2Fixed Income Sector Performance
Still Too Hot
Still Too Hot
Table 3A Corporate Sector Relative Valuation And Recommended Allocation* Table 3BCorporate Sector Risk Vs. Reward*
Still Too Hot
Still Too Hot
Investment Grade: Underweight Chart 2Investment Grade Market Overview
Investment Grade Market Overview
Investment Grade Market Overview
Investment grade corporate bonds outperformed the duration-equivalent Treasury index by 8 basis points in August, bringing year-to-date excess returns up to -267 bps. The average index option-adjusted spread tightened 4 bps on the month, and it currently sits at 145 bps. Our quality-adjusted 12-month breakeven spread ticked up to its 56th percentile since 1995 (Chart 2). A report from a few months ago made the case for why investors should underweight investment grade corporate bonds on a 6-12 month investment horizon.1 The main rationale for this recommendation is that the slope of the Treasury curve suggests that the credit cycle is in its late stages. Corporate bond performance tends to be weak during periods when the yield curve is very flat or inverted. Despite our underweight 6-12 month investment stance, we wouldn’t be surprised to see some modest spread narrowing during the next couple of months as inflation heads lower. That said, spread compression will be limited by the inverted yield curve and the persistent removal of monetary accommodation. A recent report dug deeper into the corporate bond space and concluded that investment grade-rated Energy bonds offer exceptional value on a 6-12 month horizon.2 That report also concluded that long maturity investment grade corporates are attractively priced relative to short maturity bonds. High-Yield: Neutral Chart 3High-Yield Market Overview
High-Yield Market Overview
High-Yield Market Overview
High-Yield underperformed the duration-equivalent Treasury index by 28 basis points in August, dragging year-to-date excess returns down to -519 bps. The average index option-adjusted spread tightened 15 bps on the month and it currently sits at 494 bps, 125 bps above the 2017-19 average and 43 bps below the 2018 peak. The 12-month spread-implied default rate – the default rate that is priced into the junk index assuming a 40% recovery rate on defaulted debt and an excess spread of 100 bps – increased modestly in August. It currently sits at 6.6% (Chart 3). As is the case with investment grade, high-yield spreads could stage a relief rally during the next few months as inflation falls and recession fears abate. However, the inverted yield curve will likely prevent spreads from moving much below the average level seen during the last tightening cycle (2017-19). All that said, even a move back to average 2017-19 levels would equate to a roughly 7% excess return for the junk index if it is realized over a six month period. This return potential is the main reason to prefer high-yield over investment grade in a US bond portfolio. While we maintain a neutral (3 out of 5) allocation to high-yield for now, we will downgrade the sector if spreads tighten to the 2017-19 average or if core inflation falls back to our 4% estimate of its underlying trend.3 MBS: Underweight Chart 4MBS Market Overview
MBS Market Overview
MBS Market Overview
Mortgage-Backed Securities underperformed the duration-equivalent Treasury index by 100 basis points in August, dragging year-to-date excess returns down to -144 bps. We discussed the outlook for Agency MBS in a recent report.4 We noted that MBS’ poor performance in 2021 and early-2022 was driven by duration extension. Fewer homeowners refinanced their loans as mortgage rates rose, and the MBS index’s average duration increased (Chart 4). But now, the index’s duration extension is over. The average convexity of the MBS index is close to zero (panel 3), meaning that duration is now insensitive to changes in rates. This is because hardly any homeowners have an incentive to refinance at current mortgage rates. With the duration extension trade over, the only thing preventing us from increasing exposure to the Agency MBS space is that spreads still aren’t sufficiently attractive. The average index spread versus duration-matched Treasuries is roughly midway between its post-2014 minimum and post-2014 mean (panel 4). Meanwhile, the option-adjusted spread has moved above its post-2014 mean (bottom panel), but at just 42 bps, it still offers less compensation than a Aa-rated corporate bond or a Aaa-rated consumer ABS. At the coupon level, we moved to a neutral allocation across the coupon stack last month, but this month we initiate a recommendation to favor high-coupon (3%-4.5%) securities over low coupon (1.5%-2.5%) ones. Given the lower duration of high coupon MBS, this position will profit from rising bond yields on a 6-12 month investment horizon. Emerging Market Bonds (USD): Underweight Chart 5Emerging Markets Overview
Emerging Markets Overview
Emerging Markets Overview
Emerging Market bonds outperformed the duration-equivalent Treasury index by 156 basis points in August, bringing year-to-date excess returns up to -563 bps. EM Sovereigns outperformed the Treasury benchmark by 117 bps on the month, bringing year-to-date excess returns up to -677 bps. The EM Corporate & Quasi-Sovereign Index outperformed by 180 bps, bringing year-to-date excess returns up to -491 bps. The EM Sovereign index outperformed the duration-equivalent US corporate bond index by 111 bps in August. Meanwhile, the yield differential between EM sovereigns and US corporates moved deeper into negative territory (Chart 5). As such, we continue to recommend a maximum underweight (1 out of 5) allocation to EM sovereigns. The EM Corporate & Quasi-Sovereign Index outperformed duration-matched US corporates by 168 bps in August. The index continues to offer a significant yield advantage versus duration-matched US corporates (panel 4). As such, we continue to recommend a neutral (3 out of 5) allocation to the sector. China is the most important trading partner for most EM countries and thus represents a major source of economic growth. Consequently, Chinese import volumes are a useful gauge for the outlook of EM economies. The persistent contraction of Chinese import volumes (bottom panel) therefore sends a negative signal for EM bond performance. Municipal Bonds: Overweight Chart 6Municipal Market Overview
Municipal Market Overview
Municipal Market Overview
Municipal bonds outperformed the duration-equivalent Treasury index by 126 basis points in August, bringing year-to-date excess returns up to -44 bps (before adjusting for the tax advantage). We view the municipal bond sector as better placed than most to cope with the recent bout of spread volatility. As we noted in a recent report, state & local government revenue growth has been strong, but governments have been slow to hire (Chart 6).5 The result is that net state & local government savings are incredibly high (bottom panel) and it will take some time to deplete those coffers. On the valuation front, munis have cheapened up relative to both Treasuries and corporates since last year. The 10-year Aaa Muni / Treasury yield ratio is currently 82%, up from its 2021 trough of 55%. The yield ratio between 12-17 year munis and duration-matched corporate bonds is also up significantly off its lows (panel 2). We reiterate our overweight allocation to municipal bonds within US fixed income portfolios, and we continue to have a strong preference for long-maturity munis. The yield ratio between 17-year+ General Obligation municipal bonds and duration-matched US corporates is 80%. The same measure for Revenue bonds is 94%, just below parity even without considering municipal debt’s tax advantage. Treasury Curve: Buy 5/30 Barbell Versus 10-Year Bullet Chart 7Treasury Yield Curve Overview
Treasury Yield Curve Overview
Treasury Yield Curve Overview
The Treasury curve bear-flattened in August as investors significantly marked up their 12-month rate expectations. Our 12-month Fed Funds Discounter – the market’s expected 12-month change in the funds rate – rose from 78 bps to 175 bps during the month and this caused the 2-year/10-year Treasury slope to flatten by 8 bps and the 5-year/30-year Treasury slope to flatten by 33 bps (Chart 7). We initiated a position in 5/30 flatteners (short 10-year bullet versus duration-matched 5/30 barbell) in our August 9th report.6 The main reason for this recommendation is our view that the Fed tightening cycle is not close to over. Therefore, it is too soon to position for a steepening of the 5-year/30-year Treasury slope. An analysis of past Fed tightening cycles shows that the 5-year/30-year Treasury slope tends to trough earlier than other segments of the yield curve. However, that trough has always occurred within a window spanning five months before the last Fed rate hike and three months after.7 On average, the 5-year/30-year slope troughs 1-2 months before the last Fed rate hike. Given our view that the Fed tightening cycle still has a lot of room to run, we think it makes sense to bet on a further flattening of the 5-year/30-year slope. This trade looks particularly attractive when you consider that a position short the 10-year bullet and long a duration-matched 5/30 barbell provides a yield pick-up of 12 bps (bottom panel). TIPS: Neutral Chart 8TIPS Market Overview
TIPS Market Overview
TIPS Market Overview
TIPS outperformed the duration-equivalent nominal Treasury index by 8 basis points in August, bringing year-to-date excess returns up to +264 bps. The 10-year TIPS breakeven inflation rate fell 5 bps on the month, moving back into the Fed’s 2.3% - 2.5% comfort zone (Chart 8). Meanwhile, our TIPS Breakeven Valuation Indicator shows that 10-year TIPS are close to fairly valued versus nominals. In a recent report we unveiled our Golden Rule of TIPS Investing.8 In that report we showed that TIPS of all maturities tend to outperform equivalent-maturity nominal bonds whenever headline CPI inflation exceeds the 1-year CPI swap rate during a 12-month period. The 1-year CPI swap rate is currently 2.77%, and we think this will turn out to be too low based on our modeling of headline CPI. While we see value in TIPS relative to nominals, especially at the front-end of the curve, we also suspect that more value will be created during the next few months as CPI prints come in soft. Therefore, we are reluctant to immediately upgrade TIPS to overweight. Instead, we recommend that investors initiate a 2-year/10-year TIPS breakeven inflation curve flattener. The 2/10 TIPS breakeven inflation curve has recently jumped into positive territory (bottom panel), but an inverted inflation curve is much more consistent with the current macro environment where the Fed is battling above-target inflation. ABS: Overweight Chart 9ABS Market Overview
ABS Market Overview
ABS Market Overview
Asset-Backed Securities outperformed the duration-equivalent Treasury index by 27 basis points in August, bringing year-to-date excess returns up to -25 bps. Aaa-rated ABS outperformed by 19 bps on the month, bringing year-to-date excess returns up to -24 bps. Non-Aaa ABS outperformed by 76 bps on the month, bringing year-to-date excess returns up to -28 bps. Substantial federal government support caused US households to build up an extremely large buffer of excess savings during the past two years. This year, consumers are starting to draw down that savings and are even starting to take on more debt. The amount of outstanding credit card debt is still low relative to household income, but it is rising quickly in absolute terms (Chart 9). Elsewhere, consumers are still paying down their credit card balances at high rates (panel 4), but banks are no longer easing lending standards on auto loans or credit cards (panel 3). To us, the prevailing evidence suggests that it will be a long time before delinquencies are a serious problem for consumer ABS. This justifies our overweight recommendation. That said, given that the trend toward consumer re-leveraging is in full swing, it makes sense to turn more cautious at the margin. We therefore close our prior recommendation to favor non-Aaa over Aaa-rated consumer ABS and move to a neutral allocation across the consumer ABS credit curve. Non-Agency CMBS: Overweight Neutral Chart 10CMBS Market Overview
CMBS Market Overview
CMBS Market Overview
Non-Agency Commercial Mortgage-Backed Securities outperformed the duration-equivalent Treasury index by 26 basis points in August, bringing year-to-date excess returns up to -150 bps. Aaa Non-Agency CMBS outperformed Treasuries by 20 bps on the month, bringing year-to-date excess returns up to -103 bps. Non-Aaa Non-Agency CMBS outperformed by 41 bps on the month, bringing year-to-date excess returns up to -280 bps. CMBS spreads remain wide compared to other similarly risky spread products and are currently close to their historic averages. However, the most recent Senior Loan Officer Survey showed tightening lending standards and weaker demand for commercial real estate (CRE) loans (Chart 10). This suggests a more negative back-drop for CRE prices and CMBS spreads and causes us to reduce our recommended allocation from overweight (4 out of 5) to neutral (3 out of 5). Agency CMBS: Overweight Agency CMBS underperformed the duration-equivalent Treasury index by 29 basis points in August, dragging year-to-date excess returns down to -44 bps. The average index option-adjusted spread held flat on the month, close to its long-term average (bottom panel). At 55 bps, the average Agency CMBS spread continues to look attractive compared to other similarly risky spread products. Stay overweight. Appendix A: The Golden Rule Of Bond Investing We follow a two-step process to formulate recommendations for bond portfolio duration. First, we determine the change in the federal funds rate that is priced into the yield curve for the next 12 months. Second, we decide – based on our assessments of the economy and Fed policy – whether the change in the fed funds rate will exceed or fall short of what is priced into the curve. Most of the time, a correct answer to this question leads to the appropriate duration call. We call this framework the Golden Rule Of Bond Investing, and we demonstrated its effectiveness in the US Bond Strategy Special Report, “The Golden Rule Of Bond Investing”, dated July 24, 2018. Chart 11 illustrates the Golden Rule’s track record by showing that the Bloomberg Barclays Treasury Master Index tends to outperform cash when rate hikes fall short of 12-month expectations, and vice-versa. At present, the market is priced for 175 basis points of rate hikes during the next 12 months. Chart 11The Golden Rule's Track Record
The Golden Rule's Track Record
The Golden Rule's Track Record
We can also use our Golden Rule framework to make 12-month total return and excess return forecasts for the Bloomberg Barclays Treasury index under different scenarios for the fed funds rate. Excess returns are relative to the Bloomberg Barclays Cash index. To forecast total returns we first calculate the 12-month fed funds rate surprise in each scenario by comparing the assumed change in the fed funds rate to the current value of our 12-month discounter. This rate hike surprise is then mapped to an expected change in the Treasury index yield using a regression based on the historical relationship between those two variables. Finally, we apply the expected change in index yield to the current characteristics (yield, duration and convexity) of the Treasury index to estimate total returns on a 12-month horizon. The below tables present those results, along with excess returns for a front-loaded and a back-loaded rate hike scenario. Excess returns are calculated by subtracting assumed cash returns in each scenario from our total return projections.
Still Too Hot
Still Too Hot
Appendix B: Butterfly Strategy Valuations The following tables present the current read-outs from our butterfly spread models. We use these models to identify opportunities to take duration-neutral positions across the Treasury curve. The following two Special Reports explain the models in more detail: US Bond Strategy Special Report, “Bullets, Barbells And Butterflies”, dated July 25, 2017, available at usbs.bcaresearch.com US Bond Strategy Special Report, “More Bullets, Barbells And Butterflies”, dated May 15, 2018, available at usbs.bcaresearch.com Table 4 shows the raw residuals from each model. A positive value indicates that the bullet is cheap relative to the duration-matched barbell. A negative value indicates that the barbell is cheap relative to the bullet. Table 4Butterfly Strategy Valuation: Raw Residuals In Basis Points (As Of September 1, 2022)
Still Too Hot
Still Too Hot
Table 5 scales the raw residuals in Table 4 by their historical means and standard deviations. This facilitates comparison between the different butterfly spreads. Table 5Butterfly Strategy Valuation: Standardized Residuals (As Of September 1, 2022)
Still Too Hot
Still Too Hot
Table 6 flips the models on their heads. It shows the change in the slope between the two barbell maturities that must be realized during the next six months to make returns between the bullet and barbell equal. For example, a reading of -7 bps in the 5 over 2/10 cell means that we would expect the 5-year to outperform the 2/10 if the 2/10 slope flattens by less than 7 bps during the next six months. Otherwise, we would expect the 2/10 barbell to outperform the 5-year bullet. Table 6Discounted Slope Change During Next 6 Months (BPs)
Still Too Hot
Still Too Hot
Appendix C: Excess Return Bond Map The Excess Return Bond Map is used to assess the relative risk/reward trade-off between different sectors of the US bond market. It is a purely computational exercise and does not impose any macroeconomic view. The Map’s vertical axis shows 12-month expected excess returns. These are proxied by each sector’s option-adjusted spread. Sectors plotting further toward the top of the Map have higher expected returns and vice-versa. Our novel risk measure called the “Risk Of Losing 100 bps” is shown on the Map’s horizontal axis. To calculate it, we first compute the spread widening required on a 12-month horizon for each sector to lose 100 bps or more relative to a duration-matched position in Treasury securities. Then, we divide that amount of spread widening by each sector’s historical spread volatility. The end result is the number of standard deviations of 12-month spread widening required for each sector to lose 100 bps or more versus a position in Treasuries. Lower risk sectors plot further to the right of the Map, and higher risk sectors plot further to the left. Chart 12Excess Return Bond Map (As Of September 1, 2022)
Still Too Hot
Still Too Hot
Ryan Swift US Bond Strategist rswift@bcaresearch.com Robert Timper Research Analyst robert.timper@bcaresearch.com Footnotes 1 Please see US Bond Strategy / Global Fixed Income Strategy Special Report, “Turning Defensive On US Corporate Bonds”, dated April 12, 2022. 2 Please see US Bond Strategy / Global Fixed Income Strategy Special Report, “Looking For Opportunities In US & European Corporates After The Recent Selloff”, dated May 31, 2022. 3 For more details on this call please see US Bond Strategy Weekly Report, “When The Dual Mandates Clash”, dated June 28, 2022. 4 Please see US Bond Strategy Weekly Report, “The Bond Market Implications Of A 5% Mortgage Rate”, dated April 26, 2022. 5 Please see US Bond Strategy Weekly Report, “Echoes Of 2018”, dated May 24, 2022. 6 Please see US Bond Strategy Weekly Report, “The Great Soft Landing Debate”, dated August 9, 2022. 7 In our analysis we examined seven Fed tightening cycles. The five most recent cycles and the two cycles that occurred during the inflation spike of the early 1980s. 8 Please see US Bond Strategy Special Report, “The Golden Rule Of TIPS Investing”, dated August 23, 2022. Recommended Portfolio Specification Other Recommendations Treasury Index Returns Spread Product Returns
Executive Summary Chair Powell’s Jackson Hole speech did not change our fundamental take on the economy; we still think the expansion will survive through the first half of 2023 at a minimum. Financial markets’ reaction to Powell’s remarks highlighted that volatility will likely remain elevated but we continue to expect that equities will generate meaningful excess returns over Treasuries and cash over the rest of the year. The flow of data continues to send mixed signals about the outlook for financial markets and the economy, but the biggest risks to our view are no closer to occurring today than they were when we laid them out last month. An Eventful Intermeeting Period
An Eventful Intermeeting Period
An Eventful Intermeeting Period
Bottom Line: We remain more optimistic than the consensus and continue to recommend a risk-friendly tilt in multi-asset portfolios over the next six months. We are still on high alert, however, and remain open to changing our views if incoming data begin to hint at an approaching inflection. Feature At the outset of a Zoom call last week, a US-based client asked if Chair Powell’s Jackson Hole speech had changed our view. The short answer is no, though it certainly roiled financial markets, providing the latest reminder that investors’ conviction levels should be lower than normal. This week’s report offers a longer answer, analyzing Powell’s comments while revisiting the risks to our view that we laid out in August. The principal risks have not gotten any closer to fruition and we therefore stand by our glass-half-full view, though we reiterate that it is contingent on incoming data flows – if they point to a worse outcome than our current base case, we may yet join the bearish chorus. The Fed Bigwigs Went To Grand Teton National Park … Chair Powell opened his speech by promising brevity, focus and directness and he delivered on all three counts. He used less than a third of his allotted 30 minutes to hammer home the Fed’s commitment to bringing inflation back to its 2% target and he didn’t mince words. The speech was short enough to allow the following close reading of it in which we excerpt a key line from nearly every paragraph, followed by our italicized takeaways. Powell: “Restoring price stability will take some time and requires using our tools forcefully to bring demand and supply into better balance.” US Investment Strategy: We are prepared to accept a lengthy stretch of subpar growth as the cost of getting inflation under control. Until further notice, fighting inflation takes precedence over encouraging growth. “The labor market … is clearly out of balance, with demand … substantially exceeding … supply[.]” The rip-roaring labor market is so strong that we have no choice but to lean against it given the inflation backdrop. “In current circumstances, … [the dots’] estimates of [the] longer-run neutral [fed funds rate] are not a place to stop or pause.” It will take a good bit more monetary tightening to get inflation back to the 2% target. “I said [in July] that another unusually large increase could be appropriate at our next meeting.” Another 75-basis point hike is on the table in September. The pace of increases will eventually slow, but we don’t yet know when. “Restoring price stability will likely require maintaining a restrictive policy stance for some time.” Don’t count on rate cuts any time soon. “[C]entral banks can and should take responsibility for delivering low and stable inflation.” The Fed is obligated to combat high inflation, even if some of its causes are beyond our control. Though we can’t relieve supply constraints, we can bring demand into better balance with supply. Related Report US Investment StrategyRisks To Our View (Again) “If the public expects that inflation will remain low and stable over time, absent major shocks, it likely will. Unfortunately, the same is true of expectations of high and volatile inflation.” High inflation expectations can be self-fulfilling and we cannot allow them to become entrenched à la the 1970s. “The longer the current bout of high inflation continues, the greater the chance that expectations of higher inflation will become entrenched.” We cannot take it for granted that inflation expectations will remain well anchored despite high inflation prints. The public’s focus on inflation threatens future price stability and future growth and we would be playing with fire if we didn’t address it now. “[W]e must keep at it until the job is done.” If we do not act forcefully now, the cost of getting inflation back to the 2% target will be much greater. “We will keep at it until we are confident the job is done.” In case you missed my first reference to Paul Volcker’s memoir, Keeping At It, a moment ago, or the two times I spoke his name, understand that we’re willing to do whatever it takes to getting the inflation genie back in the bottle. … And All Investors Got Was A Lousy Selloff Our italicized translations should have sent a chill down the spines of equity investors and the S&P 500 duly plunged 3.4% after Powell’s speech, then followed up by sliding as much as another 3.8% in last week's sessions. BCA has always viewed 2023 rate cuts as something of a pipe dream, and we have been relieved to see the money market raise its terminal fed funds rate estimate while pushing out the date it will be reached. As Chart 1 shows, the expected terminal rate has risen by about 75 basis points and rate cuts have been pushed back since the July FOMC meeting, but even Jackson Hole didn’t get investors to give up on them entirely. Our best guess is that they still question the Fed’s commitment in the face of a slowdown. Chart 1A Lot Can Change In Five Weeks
A Lot Can Change In Five Weeks
A Lot Can Change In Five Weeks
That interpretation offers a ready answer for why the glass-half-full view has taken a beating over the last six sessions but suggests that the glass-half-empty view could be at risk before too long. A higher terminal fed funds rate implies lower near-term earnings as well as a reduced willingness to pay for those earnings, so stocks have suffered as investors revised their expectations to better align with the Fed’s guidance. But the need to hike more and faster than investors expected underscores aggregate demand’s surprising resilience. If the labor market, consumption and corporate earnings all continue to hold up better than expected, equities have a path to move higher once the terminal rate outlook fully discounts the Jackson Hole rhetoric. Risks To Our View: Unanchored Inflation Expectations If it takes longer than markets expect for rate hikes to bite, and corporate earnings and economic growth surprise to the upside while inflation intrinsically recedes along with COVID's threat, underweight investors are likely to find themselves pulled back into equities. That scenario remains our base case, but it would become highly improbable if inflation expectations were to become unmoored, forcing the Fed to race to get the fed funds rate above 4% and keep it there. We therefore deem a breakout in inflation expectations to be an existential threat to our view. One month’s flat headline CPI reading certainly does not meet the Fed’s “clear and consistent” standard for falling inflation but various indications that consumer prices have peaked have begun to provide some near-term expectations relief. Two-year TIPS breakevens fell 35 basis points in two weeks, to 2.3%, their lowest level since January 2021 (Chart 2, top panel). Two-year CPI swap rates dipped 15 basis points in that stretch and are at their lowest level since last October (Chart 3, top panel). Intermediate- (Charts 2 and 3, middle panel) and long-term (Charts 2 and 3, bottom panel) expectations have ticked slightly higher in the last two weeks but reduced near-term expectations will take some of the pressure off them. Consumers see it the same way, with one-year inflation coming down sharply in the University of Michigan’s August survey (Chart 4, top panel) while long-term inflation expectations held steady at the bottom of the 2.9-3.1% range that has been in place for a year (Chart 4, bottom panel). Chart 2Way Lower Near-Term And ...
Way Lower Near-Term And ...
Way Lower Near-Term And ...
Chart 3... Range-Bound Longer-Term Expectations
... Range-Bound Longer-Term Expectations
... Range-Bound Longer-Term Expectations
Chart 4No Vicious Inflation Expectations Cycle Yet
No Vicious Inflation Expectations Cycle Yet
No Vicious Inflation Expectations Cycle Yet
Risks To Our View: Consumer Retrenchment Our sanguine take on economic growth and corporate earnings will be in trouble if consumers begin to hoard their excess savings. The Personal Income report released the morning of Powell’s Jackson Hole speech indicated that the aggregate household savings rate was just 5% in July, matching June’s downwardly revised number. We view the steadily declining trend (Chart 5) as ongoing validation of our thesis that consumers will deploy their excess savings to keep consumption and the US economy growing at trend, despite uncomfortably high inflation. Chart 5Staying Out Of The Paradox-Of-Thrift Trap
Staying Out Of The Paradox-Of-Thrift Trap
Staying Out Of The Paradox-Of-Thrift Trap
Risks To Our View: A Softening Labor Market The major labor market datapoints that have arrived over the last two weeks have been consistently robust. Job openings, which had appeared to have entered a steady decline, turned out to be in a holding pattern following a significant July beat and an upward revision to June’s reading. Before the release, job openings were projected to be 12.5% below their March peak; instead, they’ve only shrunk by 5%, or about 100,000 more than July’s net payroll additions (Chart 6, top panel). Meanwhile, job quits data softened a little more, falling for the fourth straight month (Chart 7, top panel) and pushing the quits rate to its lowest level since May 2021 (Chart 7, bottom panel). Taken together, the openings and quits data hint that a Goldilocks outcome – labor demand remains strong but not so strong that employees are able to command higher wages simply by walking to the competitor across the street – is not impossible. Chart 6Job Openings Have Gotten A Second Wind ...
Job Openings Have Gotten A Second Wind ...
Job Openings Have Gotten A Second Wind ...
Chart 7... While Quits Are Slowing
... While Quits Are Slowing
... While Quits Are Slowing
The four-week moving average of initial unemployment claims extended its modest decline after a smaller-than-expected number last week and a downward revision in the previous week’s estimate (Chart 8). Markets let out a sigh of relief after the August employment situation report managed to thread the needle,1 showing that net payrolls robust growth is gently moderating (Chart 9). The numbers below the headline were also encouraging; average hourly earnings increased just 0.3% from July and the labor force participation rate rose by 30 basis points to match the post-COVID high set in March (Chart 10). The part rate remains a full percentage point below its pre-COVID level, amounting to 2.75 million missing workers – if they were to return, payrolls would have room to expand even as the unemployment rate ticks higher. Chart 8Jobless Claims Have Been Falling Since Mid-July
Jobless Claims Have Been Falling Since Mid-July
Jobless Claims Have Been Falling Since Mid-July
Chart 9Payrolls Are Still Growing At A Healthy Clip
Payrolls Are Still Growing At A Healthy Clip
Payrolls Are Still Growing At A Healthy Clip
Chart 10Yet Another Supply Constraint
Yet Another Supply Constraint
Yet Another Supply Constraint
Investment Implications The data received over the last two weeks suggest that the economy retains considerable momentum. Solid nonfarm payrolls gains, the month-and-a-half interruption in initial unemployment claims’ uptrend and the job openings and job quits data paint a picture of a labor market that is still humming even as upward pressure on wages may be moderating. We continue to be heartened by the low and slightly declining savings rate, which lends support to our thesis that excess pandemic savings will provide households with a cushion to keep spending despite painful increases in the price of necessities. Finally, despite eye-popping inflation readings, household, business and investor inflation expectations have remained well anchored. Though the fundamentals have been good since we elaborated on the key risks to our view two weeks ago, the technical picture turned against us with a vengeance. The S&P 500 support at 4,175 folded like a cheap lawn chair after Chair Powell took to the podium at Jackson Hole. We are CFAs, not CMTs, though we posit that technical analysis has a place in fundamental practitioners’ processes as a means of identifying advantageous entry and exit points. Going forward, however, we will not float ideas about technical levels without explicitly defining stops to exit a position if the technical level fails to hold. The stock swoon that ensued after Jackson Hole underlines how much investors are hanging on the Fed. Any perceived change of emphasis or direction has the potential to scramble financial markets and we continue to advise that investors carefully manage their holding periods and benchmark deviations. Although we think the Fed will eventually force a sober reckoning for risk assets, we believe equities can outperform over the next three to six months and therefore recommend overweighting equities in multi-asset portfolios through the end of the year. If inflation decelerates over the rest of the year as we expect, the Fed’s rhetoric should become less frightening and risk assets should see renewed inflows as the gloomy scenarios take longer to arrive than the consensus currently expects. Doug Peta, CFA Chief US Investment Strategist dougp@bcaresearch.com Footnotes 1 As we went to press, however, equities were selling off sharply, apparently on reports of an extended Gazprom pipeline shutdown.