Developed Countries
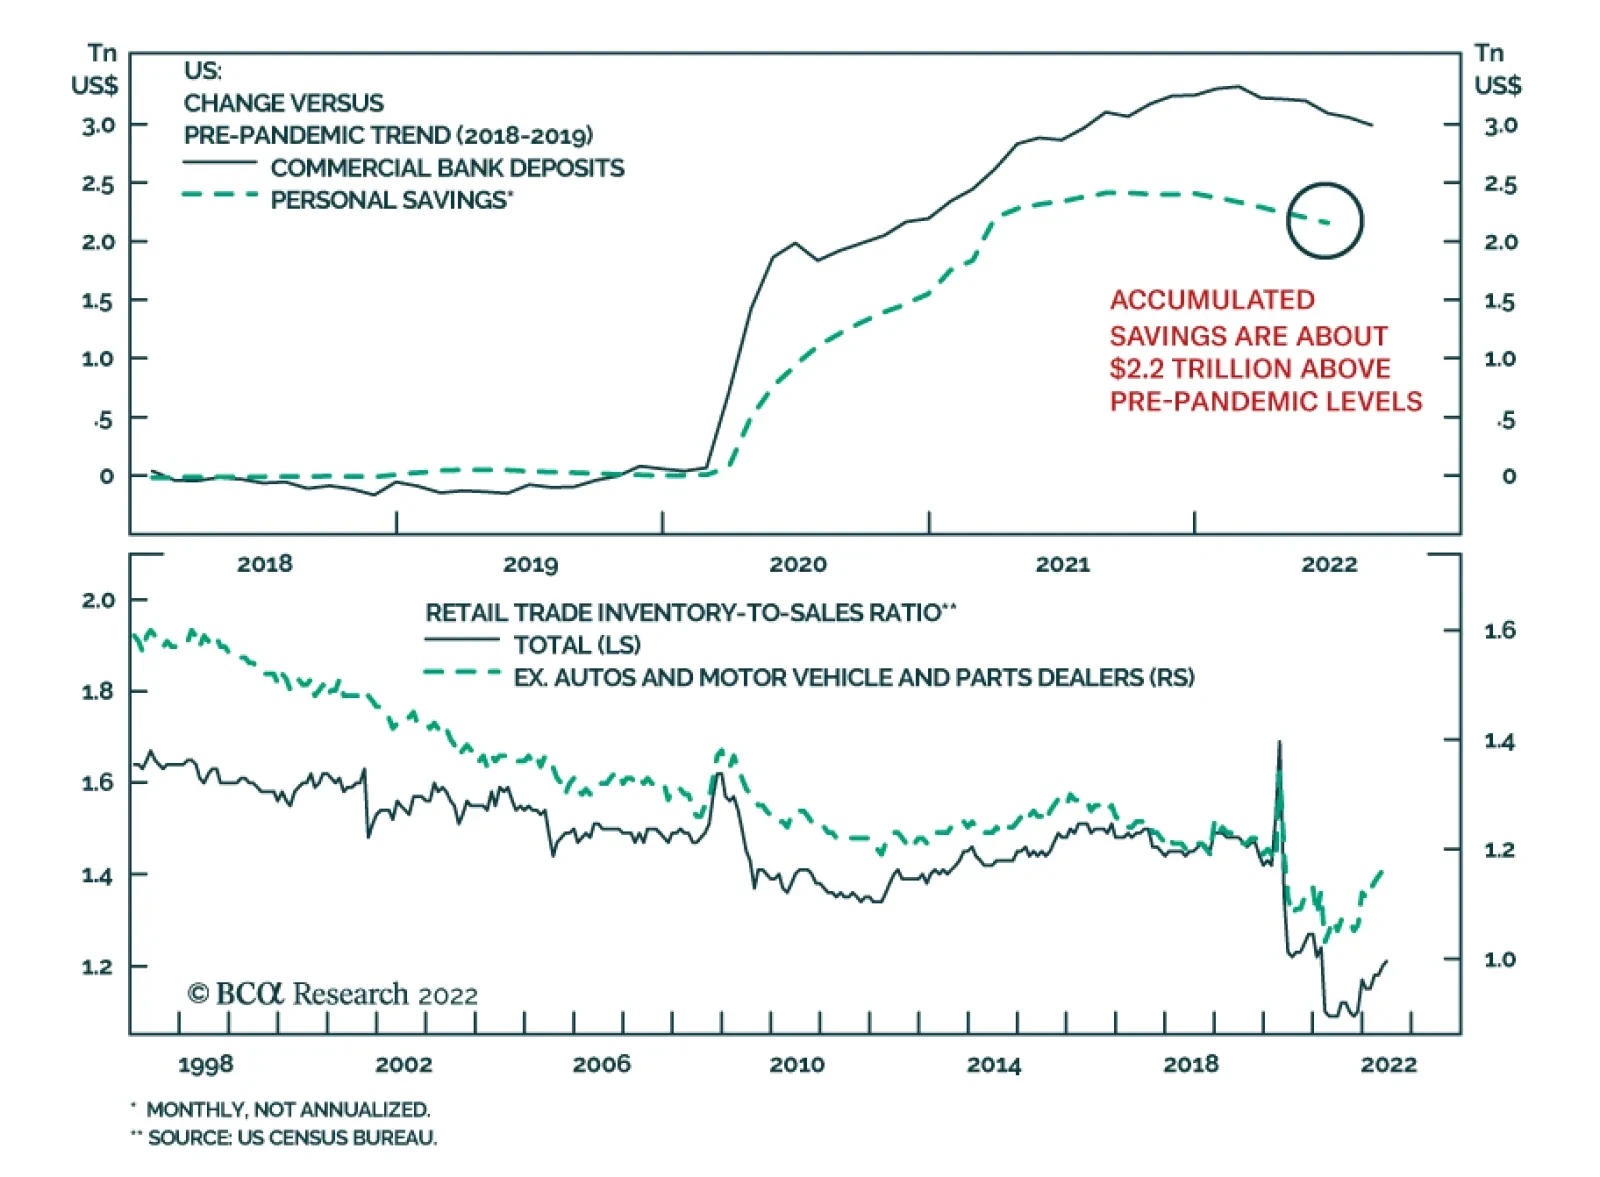
According to BCA Research’s Global Investment Strategy service, the presence of significant pent-up demand is one of three factors that will protect the US economy over the next 12 months. US households have accumulated $2.2 trillion (9% of GDP) of excess…

Executive Summary US Support For A Military Coup?
Trump Raid Heightens Political Risk
Trump Raid Heightens Political Risk
A confluence of structural and cyclical factors makes the US highly prone to social and political instability, as in 2020. Today’s stagflationary economic environment further amplifies domestic political risk. The Biden administration’s decision to pursue a criminal investigation of former President Trump will drive political polarization higher, as will the overall 2022-24 political cycle. Investors should expect negative surprises from US politics, including social unrest, political violence, and domestic terrorism of whatever stripe. Such crisis events usually cause only a short-term spike in financial market volatility. A major crisis that affects election results could have a more lasting impact. The base case for US policy in 2023-24 is gridlock, which is marginally disinflationary. It would take an extraordinary surprise to change that. On a relative basis, US assets benefit from domestic political risk because geopolitical risk rises even faster. Recommendation (Tactical) INITIATION DATE Return Long DXY (Dollar Index) Feb 23, 2022 10.8% Bottom Line: Investors should expect volatility and negative “October surprises” in the short term, at least through the midterm elections. US domestic political risk is high and will also amplify global geopolitical risk. Feature The US’s rolling political crisis is escalating again and political violence is likely to rise in the lead up to the midterm elections on November 8 and the presidential election in November 2024. The Department of Justice (DoJ) refused on August 15 to release the affidavit underpinning the Federal Bureau of Investigation’s (FBI) raid on former President Trump’s Mar-a-Lago residence in Florida. Never before has a US president suffered a raid on his home by the country’s federal law enforcement agencies – though presidents have been investigated before. It is not yet clear what charges will be brought against Trump but it is highly likely that he will be indicted for something. The Justice Department released a redacted version of the search warrant suggesting that Trump may be accused of having kept state secrets at his home in violation of the Presidential Records Act and possibly also the 1917 Espionage Act. Speculation says that some information he took back from the White House relates to nuclear weapons.1 The DoJ is pursuing a criminal investigation. The former president could very well end up on trial, or even in jail, but it is also possible that changes in political power will prevent him from going. What are the investment implications, if any? The US will see significant social and political upheaval but the main investment implication is that the US will continue to play an unpredictable and disruptive role abroad, perpetuating a flight to safety in financial markets, at least until the midterm elections are over. Drivers Of US Political Instability The US political crisis should first be seen through the lens of geopolitics: The US is a continent-sized nation that is separated from the other world powers by large oceans. It is therefore highly defensible and economically insulated, with total exports accounting for only 10.2% of GDP. However, this insularity and relative security create space for a fast growing and evolving society that is primarily focused on doing business rather than strengthening the state. The rapid creation of wealth is good but also produces large disparities in region, class, and race that periodically undermine stability. Maintaining domestic stability across the continent would be a constant challenge even if the government were not a federal republic with short political cycles driven by fickle popular opinion. Freedom is a source of political contention as well as wealth creation. Over the past 70 years the society has become less religious and more secular, while the economy has become less manufacturing-oriented and more service-oriented. The shift to a high-tech and information-driven society has empowered the highly educated at the expense of the less educated. Capital owners have benefited from rising asset values, deregulation, and globalization, while labor has witnessed stagnant real wages. Agricultural and manufacturing regions have fallen behind. Social stability is especially hard to maintain during cyclical periods of economic distress, highlighted today by the rising Misery Index (Chart 1). While inflation may subside in the short run, it will probably persist in the long run, and unemployment has nowhere to go but up. There is a demographic and generational factor that is also driving US instability today: The Baby Boom generation did not begin their adult lives with a robust policy consensus, like their parents’ generation, which shared sacrifices during the Great Depression and World War II. Instead the Boomers began with deep divisions due to the Vietnam War and social revolution of the 1960s. As they grew in wealth and power in the 1980s-90s, pro-growth tax policy, deregulation, and rapid socioeconomic changes aggravated these divisions. Inequality surged (Chart 2). The Iraq War and 2008 financial crisis made matters worse. Chart 1US: High Misery Index
US: High Misery Index
US: High Misery Index
Chart 2US: High Inequality
US: High Inequality
US: High Inequality
Now the elites of this generation, who lead the two major parties, are trying to secure their economic and political interests before retirement and death. Bluntly, the pro-business faction is trying to prevent the pro-government faction from clawing back its wealth. Political polarization has reached the highest level since the early twentieth century (Chart 3). While polarization has subsided from the peaks of 2020, it could still exceed those peaks in the 2022-24 political cycle. The US will remain at or near “peak polarization” until generational change and geopolitical conflicts forge a new policy consensus. Bottom Line: The US is geopolitically secure but periodically struggles to maintain domestic stability. Today it is witnessing a confluence of structural and cyclical factors that generate social unrest and historic levels of political polarization. The 2022-24 election cycle will be tumultuous. Chart 3US: Peak Polarization
US: Peak Polarization
US: Peak Polarization
Disaffection Can Lead To Violence Any kind of fanaticism can lead to violent extremism. Militants have emerged from secular movements on the right and left, from communism to fascism, as well as from religious movements.2 In recent years the US has seen a rise in violence, including crime and terrorism. Mass shootings have spiked since the 2008 financial crisis. Terrorism has revived to the highest levels since the 1980s, 96% of which is domestic terrorism (Chart 4). Recent improvements to the social safety net may or may not reduce violence. The stagflationary economic backdrop bodes ill. Opinion polls are of dubious accuracy when they ask people to admit to militant or criminal inclinations, but they still take the temperature of society. Several recent polls suggest that as many as 25% of Americans are willing to consider violence as a means of resolving political problems (Chart 5). Chart 4US: Domestic Terrorism, Political Violence
Trump Raid Heightens Political Risk
Trump Raid Heightens Political Risk
Chart 5US Support For Political Violence?
Trump Raid Heightens Political Risk
Trump Raid Heightens Political Risk
In addition, 55% of Republicans and 40% of independents claim that a military coup could be justified when there is “a lot of corruption,” a subjective standard to say the least (Chart 6). While this number has spiked over the 2020 election cycle, it also shows a substantial pre-existing willingness to entertain authoritarian solutions to political disputes. We do not take these polls at face value given the difficult subject matter. When a major violent event occurs and real people die, popular “support” for political violence will collapse across the United States. Nevertheless these data suggest a high level of disaffection and discontent, which is supported by the structural socioeconomic problems cited above. Chart 6US Support For A Military Coup?
Trump Raid Heightens Political Risk
Trump Raid Heightens Political Risk
The January 6, 2021 incident at the US Capitol was the crescendo of an explosion of social unrest that occurred across the country in 2020, triggered by the aforementioned structural factors, the Covid-19 pandemic, race riots, and political conflict over the 2020 election. The number of homicides rose to 7.4 per hundred thousand people, the highest annual number since the 1990s, higher than in 2001 when the 9/11 terrorist attacks occurred, and reminiscent of the turbulent late 1960s. This year’s midterm elections will be the first major electoral test since the chaotic events of 2020 and none of the underlying drivers of unrest have been resolved. On the contrary, recent signs are pointing to another escalation of social and political upheaval. The 2024 election will also spark unrest and violence. Bottom Line: The number of violent incidents is rising while a substantial minority of public opinion appears willing to entertain violent means of resolving political disputes. From Reality TV To Real Rebellion? The FBI’s raid on Trump’s Mar-a-Lago estate is naturally triggering a backlash from Trump supporters and Republicans. These groups were already distrustful of the federal government and particularly the FBI for spying on the Trump presidential campaign in the 2016 election.3 Republican support for the FBI and DoJ will fall sharply from its current level in opinion polling taken in 2019 (Chart 7, top panel). Trump opponents will argue that Trump is being investigated because of wrongdoing while Trump supporters will think that the Biden administration is trying to prevent him from running for re-election in 2024. Any lack of transparency by the Justice Department will heighten suspicion and acrimony. Chart 7US Views On 2021 Rebellion
Trump Raid Heightens Political Risk
Trump Raid Heightens Political Risk
A fraction of radicalized Trump supporters could be motivated by this extraordinary event to conduct attacks. Already an armed suspect, allegedly linked to a right-wing extremist group and to the January 6 rebellion at the Capitol, attempted to storm an FBI field office in Cincinnati, Ohio. The Department of Homeland Security and FBI have warned about the risk of domestic terrorism for several years and have issued a new warning since the FBI raid on Mar-a-Lago.4 There is no easy way to resolve the dispute over the 2020 election or the January 6 rebellion because these events have taken on mythic status in the eyes of the different factions. For about half of Republicans, the January 6 incident was a patriotic defense of freedom – rather than an insurrection or attempt to prevent the peaceful and democratic transfer of power (Chart 7, bottom panel). Some small portion of those who view the election as stolen could become radicalized and act out violently. Trump received 46% of the popular vote in 2016 and 47% in 2020 (Chart 8). His favorability has suffered since the January 6 events but not as much as one might think. Among Republicans, Trump’s favorability remains largely unperturbed (Chart 9). While the vast majority of these voters are law-abiding, the decision to raid Trump’s home, and any future decision to press criminal charges, will drastically increase the risk of radicalization on the fringes. Chart 8Trump’s Share Of Popular Vote
Trump Raid Heightens Political Risk
Trump Raid Heightens Political Risk
Chart 9Trump’s Popular Support Post-2020
Trump Raid Heightens Political Risk
Trump Raid Heightens Political Risk
It does not take a social scientist to recognize the potential for an increase in political violence if the federal government is perceived as using the arm of the law to prevent a popular candidate from contesting past or future elections. The risk of political violence cannot be dismissed because the US is a particularly well-armed country. There were 120 civilian-held firearms per 100 persons in the United States as of 2017. By contrast, the nearest country is France, with only 20 firearms per 100 persons (Chart 10). That does not mean that a major incident of violence will necessarily stem from the right wing. Only five years ago an extremist left-wing gunman tried to assassinate a whole group of Republican lawmakers while they were playing baseball. Earlier this year the Department Homeland Security warned about violent reactions to the Supreme Court’s overturning of the Roe v. Wade decision on abortion.5 If and when a major incident of political violence occurs, the public reaction will be a powerful rejection of violence across the political spectrum. For example, President Bill Clinton’s administration benefited from the Oklahoma City bombing in 1995 (Chart 11). Much will depend on the nature of the attack and which faction is most able to capitalize on its victimization. Chart 10Right To Bear Arms Shall Not Be Infringed
Trump Raid Heightens Political Risk
Trump Raid Heightens Political Risk
Chart 11OKC Bombing Spurred Rally Round The Flag
OKC Bombing Spurred Rally Round The Flag
OKC Bombing Spurred Rally Round The Flag
Ultimately instability will generate a popular consensus opposed to political violence and supportive of law and order, just as it did in previous periods of American upheaval. The future policy consensus will be “federalist” in orientation due to America’s geopolitics: there will be an increasing need to unify the states to achieve other strategic imperatives like prosperity and national security. We call this theme “Limited Big Government.” This re-centralization process will involve the federal government intervening to stabilize the society. It is not obvious which political party will first capture this consensus. It depends on the nature and timing of any crisis events and the cyclical rotation of parties. Bottom Line: The US is a heavily armed country that is currently prone to social and political instability. The risk of political violence and domestic terrorism of whatever stripe is already very high. In addition, a substantial portion of the country’s right-wing faction believes that the 2020 election was stolen, that the January 6 rebellion was justified, and that the federal government is now abusing its law enforcement powers to prevent a candidate from running in 2024. Domestic terrorism risk will increase. Implications For The 2024 Election Federal agencies were well aware of the risk of a domestic backlash when they decided to raid Mar-a-Lago. Investigators may or may not produce ironclad evidence of wrongdoing by Trump, but polarization will continue to be the overriding dynamic in the short run. It is unlikely that any evidence will convince the different parties to change their opinions of Trump. Assuming Republicans retake the House of Representatives this fall, they will likely impeach Biden, though they will lack the votes in the Senate to remove him from office. US domestic policy will be effectively paralyzed as the partisan conflict continues. The 2024 election will be required to settle the Trump saga and the future direction of US national policy. Trump’s legal troubles could be a blessing or a curse for the Republican Party in the 2024 cycle: If Trump is disqualified or put in jail, then he will become a political martyr for his populist base, motivating Republican voter turnout. At the same time, the Republican Party establishment will gain the advantage of nominating a more favorable candidate who will be eligible to hold the presidency for eight years. Republicans would benefit. If Trump is not disqualified, then he will be even more incentivized to run for the Republican nomination to avoid legal prosecution. In that case he will hinder Republican appeal among moderate and independent voters – leaving them vulnerable to a party split or third-party challenge. Even if he wins, he will only be eligible for the presidency for four years, limiting his party’s prospects. Republicans would suffer. The takeaway from the above is that Trump’s interests continue to be at odds with the interests of the Republican Party elite. If the Democrats aggressively prosecute Trump and try to put him behind bars, they will in fact help unify and motivate the Republican Party opposition. Two further conclusions can be drawn: First, because of the January 6 incident and the political fallout, any future attempt by protesters or rioters to storm a major federal power center will likely be met with overwhelming force rather than accommodation. If that occurs, and state violence is seen as partisan, then the party that uses force will suffer in public opinion. As with domestic terrorism, a major crisis is likely to occur. But it will ultimately be conducive to a new national policy consensus. Second, US domestic instability will incentivize foreign powers to take advantage of US distraction to pursue their national interests aggressively in their own region. At the same time, the US government will also pursue a reactive foreign policy to attempt to divide the opposition and suppress domestic dissent. Therefore US domestic political instability increases global geopolitical instability. Market Response Will Be Volatility What are the investment ramifications of the above? US corporate earnings are heavily insulated from political crises that do not affect either US policy or the structure of the government and economy. Volatility sometimes pops briefly during domestic terrorist events but not in a way that affects the investment outlook (Chart 12). Investors should bear this in mind since another crisis event is coming. True, if the Mar-a-Lago raid affects the midterm election – and hence the composition of the US government in 2023-24 – then financial markets will respond to some extent. However, investors can safely ignore this risk because the stagflationary economy will be the chief factor in the midterms and already favors the opposition party. For the same reason it remains highly likely that Republicans will retake the House of Representatives, producing legislative gridlock in 2023. The result is disinflationary in the short run, though inflation will be a persistent problem over the long run. If Democrats somehow retain control of both houses of Congress, i.e. the “Blue sweep risk,” then investors would see a substantial change in the policy outlook, as Democrats would have a second chance to raise taxes and social spending. But the odds of a blue sweep are low. Our House election model implies that Democrats will lose 22 seats when they only need to lose a net of five seats to lose control. Our Senate model gives 47.5% chance of Democrats retaining control, too close to call at this point (Appendix). The odds of another blue sweep are only 20% according to online betting market PredictIt. Chart 12Market Historically Ignores Domestic Terrorism
Market Historically Ignores Domestic Terrorism
Market Historically Ignores Domestic Terrorism
US political instability has, if anything, supported the US dollar and US equity and bond outperformance for many years. The more unstable the US, the more unstable the world. Indeed, because of the US’s geopolitical position, the US often exports domestic instability to the rest of the world. That is the situation today as the Biden administration’s domestic-focused, reactive foreign policy exacerbates the conflicts with Russia and China. The Biden administration is willing to escalate strategic tensions with both China and Russia in the lead-up to the midterm elections – and this tendency will likely become the Biden Doctrine, lasting into 2024. Investors should remain defensively positioned, and overweight US assets, at least until the midterm election is over. Matt Gertken Senior Vice President Chief US Political Strategist mattg@bcaresearch.com Footnotes 1 Read the warrant behind FBI search of Trump’s Mar-a-Lago,” PBS, August 12, 2022, pbs.org. 2 See Katarzyna Jasko et al, “A comparison of political violence by left-wing, right-wing, and Islamist extremists in the United States and the world,” PNAS [Proceedings of the National Academy of Sciences of the United States of America] 119:30 (2022), July 18, 2022, pnas.org. See also Herbert McClosky and Dennis Chong, “Similarities and Differences between Left-Wing and Right-Wing Radicals,” British Journal of Political Science 15:3 (1985), pp. 329-63, jstor.org. 3 See Jessica Lee, “Did Obama Get Caught ‘Spying’ on Trump’s 2016 Campaign?” Snopes, September 29, 2020, snopes.com. See also Wall Street Journal Editorial Board, “Trump Really Was Spied On,” February 14, 2022, wsj.com. 4 See Department of Homeland Security, “Strategic Intelligence Assessment and Data on Domestic Terrorism,” July 11, 2022, dhs.gov; Christopher Wray, “Worldwide Threats to the Homeland,” Federal Bureau of Investigation, September 17, 2020, fbi.gov. See also Ryan Lucas, “FBI, Homeland Security warn about threats to law enforcement after Trump search,” NPR, August 15, 2022, npr.org. 5 See Stef W. Kight, “DHS memo: Violent extremism ‘likely’ in wake of Roe v. Wade decision,” Axios, June 24, 2022, axios.com. Strategic View Open Tactical Positions (0-6 Months) Open Cyclical Recommendations (6-18 Months) Table A2Political Risk Matrix
Trump Raid Heightens Political Risk
Trump Raid Heightens Political Risk
Table A3US Political Capital Index
Trump Raid Heightens Political Risk
Trump Raid Heightens Political Risk
Chart A1Presidential Election Model
Third Quarter US Political Outlook: Last Ditch Effort
Third Quarter US Political Outlook: Last Ditch Effort
Chart A2Senate Election Model
Third Quarter US Political Outlook: Last Ditch Effort
Third Quarter US Political Outlook: Last Ditch Effort
Table A4House Election Model
Biden's Midterm Tactics Bear Fruit… But There's A Snake
Biden's Midterm Tactics Bear Fruit… But There's A Snake
Table A5APolitical Capital: White House And Congress
Trump Raid Heightens Political Risk
Trump Raid Heightens Political Risk
Table A5BPolitical Capital: Household And Business Sentiment
Trump Raid Heightens Political Risk
Trump Raid Heightens Political Risk
Table A5CPolitical Capital: The Economy And Markets
Trump Raid Heightens Political Risk
Trump Raid Heightens Political Risk
Executive Summary Russia’s Crude Oil Output Will Fall
EU Russian Oil Embargoes, Higher Prices
EU Russian Oil Embargoes, Higher Prices
Russia will have to lower oil production to ensure output it hasn’t placed with non-EU buyers does not tax its limited storage facilities, ahead of the bloc’s December 5 embargo. The EU’s insurance/reinsurance ban on ships carrying Russian material also commences in December. It will profoundly affect Russian output, if fully implemented. Russian and Chinese firms will expand ship-to-ship transfers on the high seas, along with external processing and storage services to mask crude and product exports. The EU embargos will force Russia to shut in ~ 1.6mm b/d of output by year-end, rising to 2mm b/d in 2023, by our reckoning. Gas-to-oil switching in Europe will boost distillate and residual fuel demand by ~ 800K b/d this winter. Chinese policymakers will be compelled to deploy greater fiscal and credit support to reverse weakening GDP. Tighter monetary policy in DM economies will dampen aggregate demand. Bottom Line: EU embargoes on Russian oil imports will significantly tighten markets, and lift Brent to $119/bbl by year-end. This has a 60% chance of being offset by ~ 1mm b/d of Iranian oil exports in 2023, in our estimation. We are maintaining our Brent forecast at $110/bbl on average for this year, and $117/bbl next year. WTI will trade $3-$5/bbl lower. At tonight’s close we are re-establishing our long COMT ETF position. Risks remain to the upside. Feature Chart 1Russia’s Crude Oil Output Will Fall
EU Russian Oil Embargoes, Higher Prices
EU Russian Oil Embargoes, Higher Prices
Following an unexpected increase in production during June and July, Russia will have to begin reducing its oil output ahead of the implementation of the EU’s embargo on its seaborne crude oil imports, which kicks on December 5. EU, UK and US shipping insurance and reinsurance sanctions also are scheduled to be implemented in December. If fully implemented, ~ 2.3mm b/d of seaborne imports of Russian crude oil will be excluded from EU markets by year-end. Come February, another 800k b/d of refined products will be embargoed. On the back of these lost sales, and production that cannot be loaded on ships due to insurance/reinsurance bans, we expect Russian production to fall ~ 2mm b/d by the end of next year (Chart 1).1 As noted in previous research, a goodly chunk of Russian crude continues to go to China and India. Together, these two states accounted for just over 40% of Russia’s crude sales last month – ~ 1.9mm b/d of a total of ~ 4.5mm b/d. This is down from just under 45.5% in May, according to Reuters. Both China and India have benefited from discounted prices of ~ 30% vs. Brent, which is a powerful inducement to buy. Asia accounts for more than half of Russia’s seaborne crude oil sales, according to Bloomberg data. Related Report Commodity & Energy StrategyTighter Oil Markets On The Way Whether China and India can maintain these purchases depends on whether ships taking oil to them can get their cargoes insured. Both states have domestic insurance providers, and, in the case of the latter, long-standing trade relationships going back decades. Other Asian economies do not have such financial infrastructure. Still, this is a high concentration of sales to two buyers. In addition, press reports indicate China spent $347mm to secure tankers to conduct high-risk ship-to-ship (STS) transfers of Russian crude in the Atlantic Ocean.2 Similar STS transfers have been used to move ~ 1.2mm b/d of Iranian and Venezuelan crude oil, most of which ends up in China, according to Lloyds. Base Case Sees Markets Balance In our base case analysis, markets remain relatively balanced going into winter. On the supply side, we expect core OPEC 2.0 – the Kingdom of Saudi Arabia (KSA) and the United Arab Emirates (UAE) – to continue to provide crude to the markets subject to their spare-capacity constraints (Chart 2, top panel). KSA likely will be producing close to 11mm b/d by year-end – vs its current output of 10.6mm b/d output presently – and the UAE will be close to 3.5mm b/d, vs 3.1mm b/d at present. KSA’s max capacity is 12mm b/d, while the UAE’s is 4mm b/d; both will want to maintain spare capacity to offset unexpected exogenous supply shocks next year. These two states account for most of the spare capacity in the world (Chart 3). The rest of OPEC 2.0 will continue to struggle to maintain its production, which makes the core producers’ spare capacity critically important (Chart 2, bottom panel). Chart 2Core OPEC 2.0 Will Increase Supply
EU Russian Oil Embargoes, Higher Prices
EU Russian Oil Embargoes, Higher Prices
Chart 3Spare Capacity Concentrated In Core OPEC 2.0
EU Russian Oil Embargoes, Higher Prices
EU Russian Oil Embargoes, Higher Prices
Outside of OPEC 2.0, we are expecting the largest contribution to global supply will continue to come from US shale production (Chart 4). Shale-oil output in the top 5 US basins is expected to increase ~540K b/d this year, and next. This will take shale output to slighly above 7.5mm b/d and account for 76% of Lower 48 production in the States this year. Next year, we are expecting US Lower 48 production to rise 700K b/d, and for total US crude output to go to 12.8mm b/d, a new record. Chart 4US Remains Top Non-OPEC 2.0 Supplier
US Remains Top Non-OPEC 2.0 Supplier
US Remains Top Non-OPEC 2.0 Supplier
This winter we are expecting an uptick in oil demand – particularly for distillates like gasoil and diesel in Europe, as EU firms switch from natural gas to oil on the margin. We expect this will add 800K b/d of demand over the winter months (November through March), which will lift our overall demand estimate 150k b/d this year, and 20K b/d next year – +2.19mm b/d vs +2.04mm b/d, and 1.82mm b/d vs. 1.80mm b/d next year. Chinese year-on-year oil demand growth remains negative. January-July 2022 demand was 15.24mm b/d vs 15.34mm b/d in 2021, continuing a string of y/y contractions. The two other major economic pillars of global oil demand – the US and Europe – show positive y/y growth of 800K b/d each over the same period. Global demand in 1H22 recovered to 98% of its pre-COVID-19 level – even with China’s negative y/y growth – while supply recovered to 96% of its pre-pandemic level, according to the International Energy Forum (IEF). Over most of the forecast period, we estimate global balances will continue to show the level of supply below that of demand, which will lead to continued physical deficits (Chart 5). Refined-product inventories increased by 34mm barrels in 1H22, while crude-oil stocks fell 23mm barrels. Global crude and product inventories are ~ 460mm barrels below their five-year average, which includes pandemic demand destruction, the IEF reported. We continue to expect inventories to remain below their 2010-14 average, which we prefer to track – it excludes the market-share wars of 2015-17 and that of 2020, and the pandemic’s effects on inventories (Chart 6). This will revive the backwardation in Brent and WTI prices, particularly if the loss of Russian barrels is larger than we expect this year and next. This could be dampened if the US resumes its SPR releases after they’ve run their course in October. Chart 5Global Market Balanced, But Slight Deficits Will Persist
Global Market Balanced, But Slight Deficits Will Persist
Global Market Balanced, But Slight Deficits Will Persist
Chart 6OECD Inventories Below 5Y Average
OECD Inventories Below 5Y Average
OECD Inventories Below 5Y Average
Investment Implications Our analysis indicates markets are mostly balanced going into winter (Table 1). That said, the balance of risks remains to the upside ahead of the EU’s embargoes on Russian crude and product imports, and the EU/UK/US insurance/reinsurance bans on providing cover for vessels carrying Russian material. This all is highly contingent on the extent to which the EU and its allies follow through on these punitive actions imposed on Russia in retaliation for its invasion of Ukraine. Table 1BCA Global Oil Supply - Demand Balances (MMb/d, Base Case Balances) To Dec23
EU Russian Oil Embargoes, Higher Prices
EU Russian Oil Embargoes, Higher Prices
The removal from the market of some 2mm b/d of Russian oil production due to the various EU embargoes – even if it is offset by the return of 1mm b/d of Iranian exports on the back of a deal with the US – will push crude oil prices higher and inventories lower (Chart 7).3 Chart 7Brent Price Expectation Unchanged, But Demand Shifts To Winter
Brent Price Expectation Unchanged, But Demand Shifts To Winter
Brent Price Expectation Unchanged, But Demand Shifts To Winter
Given these views, we remain long the oil and gas producer XOP ETF, which is up 19.5% since we re-established it on July 5, and, at tonight’s close, will be re-establishing our COMT ETF, to take advantage of higher energy and commodity prices and increasing backwardation in oil markets as inventories draw. Robert P. Ryan Chief Commodity & Energy Strategist rryan@bcaresearch.com Ashwin Shyam Research Analyst Commodity & Energy Strategy ashwin.shyam@bcaresearch.com Paula Struk Research Associate Commodity & Energy Strategy paula.struk@bcaresearch.com Commodities Round-Up Energy: Bullish US distillate inventories – diesel and heating oil mostly – were up less than 1% for the week ended 12 August 2022, according to the US EIA. US distillate inventories stood at 112mm barrels. This did nothing to reverse the deep drawdown in distillate inventories of 18.5% y/y, which, along with European stocks, refiners are attempting to rebuild going into the 2022-23 winter. We expect natgas-to-oil switching this winter to add 800k b/d of demand to the market over the Nov-Mar winter season. Most of this demand will be for distillates, in our view, given its dual use as a fuel for industrial applications and household space-heating. Distillate demand could be higher this winter, if a La Niña produces colder-than-normal temperatures. The US Climate Prediction Center gives the odds of such an outcome 60% going into the 2022-23 winter. This would lift ultra-low-sulfur diesel futures in the US and gasoil futures in Europe higher as inventories draw (Chart 8). Base Metals: Bullish Copper prices dropped on weaker-than-expected Chinese macroeconomic data for July, although the fall was bounded by the People’s Bank of China’s decision to cut interest rates. According to US CFTC data, copper trading volumes are lower than pre-pandemic levels, as hedge funds' net speculative positions turned negative beginning in May and have mostly remained in the red since then. Low trading volumes will result in copper prices being highly susceptible to macroeconomic events, especially those occurring in China. Precious Metals: Neutral Gold prices are facing difficulty overcoming market expectations of high interest rates for the rest of this year (Chart 9). The bearish influence of tightening monetary policy and a strong USD has the upper hand on the supportive effect of recession risks, inflation, and geopolitical uncertainty for gold prices. Recent strength in US stock markets - which historically is inversely correlated with gold prices - following better-than-expected earnings, also contributed to recent gold price weakness. Chart 8
EU Russian Oil Embargoes, Higher Prices
EU Russian Oil Embargoes, Higher Prices
Chart 9
Investors Expect Fed Tightening To Give Way To An Easing Cycle In 2023
Investors Expect Fed Tightening To Give Way To An Easing Cycle In 2023
Footnotes 1 Please see Oil: It Ain't Over Till It's Over, which we published 11 August 2022, for additional discussion. NB: We discuss the differences between our view and that of our Geopolitical Strategy service regarding a deal between the US and Iran, which returns 1mm b/d of crude oil exports to the market. We give 60% odds to such a deal, while our colleagues at the GPS service assign a 40% probability to it. In our base case modeling presented herein, we expect these barrels to return to the market by 2Q23, perhaps sooner. 2 Please see Anonymous Chinese shipowner spends $376m on tankers for Russian STS hub published by Lloyd’s List 9 August 2022. The report notes, “All the ships are aged 15 years or older, precluding them from chartering by most oil majors, as well being unable to secure conventional financing, suggesting the beneficial owner is cash rich. The high seas logistics network offers scant regulatory and technical oversight as crude cargoes loaded on aframax tankers from Baltic Russian ports are transferred to VLCCs mid-Atlantic for onward shipment to China. One cargo has been tracked to India.“ 3 Please see Oil: It Ain't Over Till It's Over, which we published 11 August 2022, for additional discussion. NB: We discuss the differences between our view and that of our Geopolitical Strategy service regarding a deal between the US and Iran, which returns 1mm b/d of crude oil exports to the market. We give 60% odds to such a deal, while our colleagues at the GPS service assign a 40% probability to it. In our base case modeling presented herein, we expect these barrels to return to the market by 2Q23, perhaps sooner. Investment Views and Themes Strategic Recommendations Trades Closed in 2022
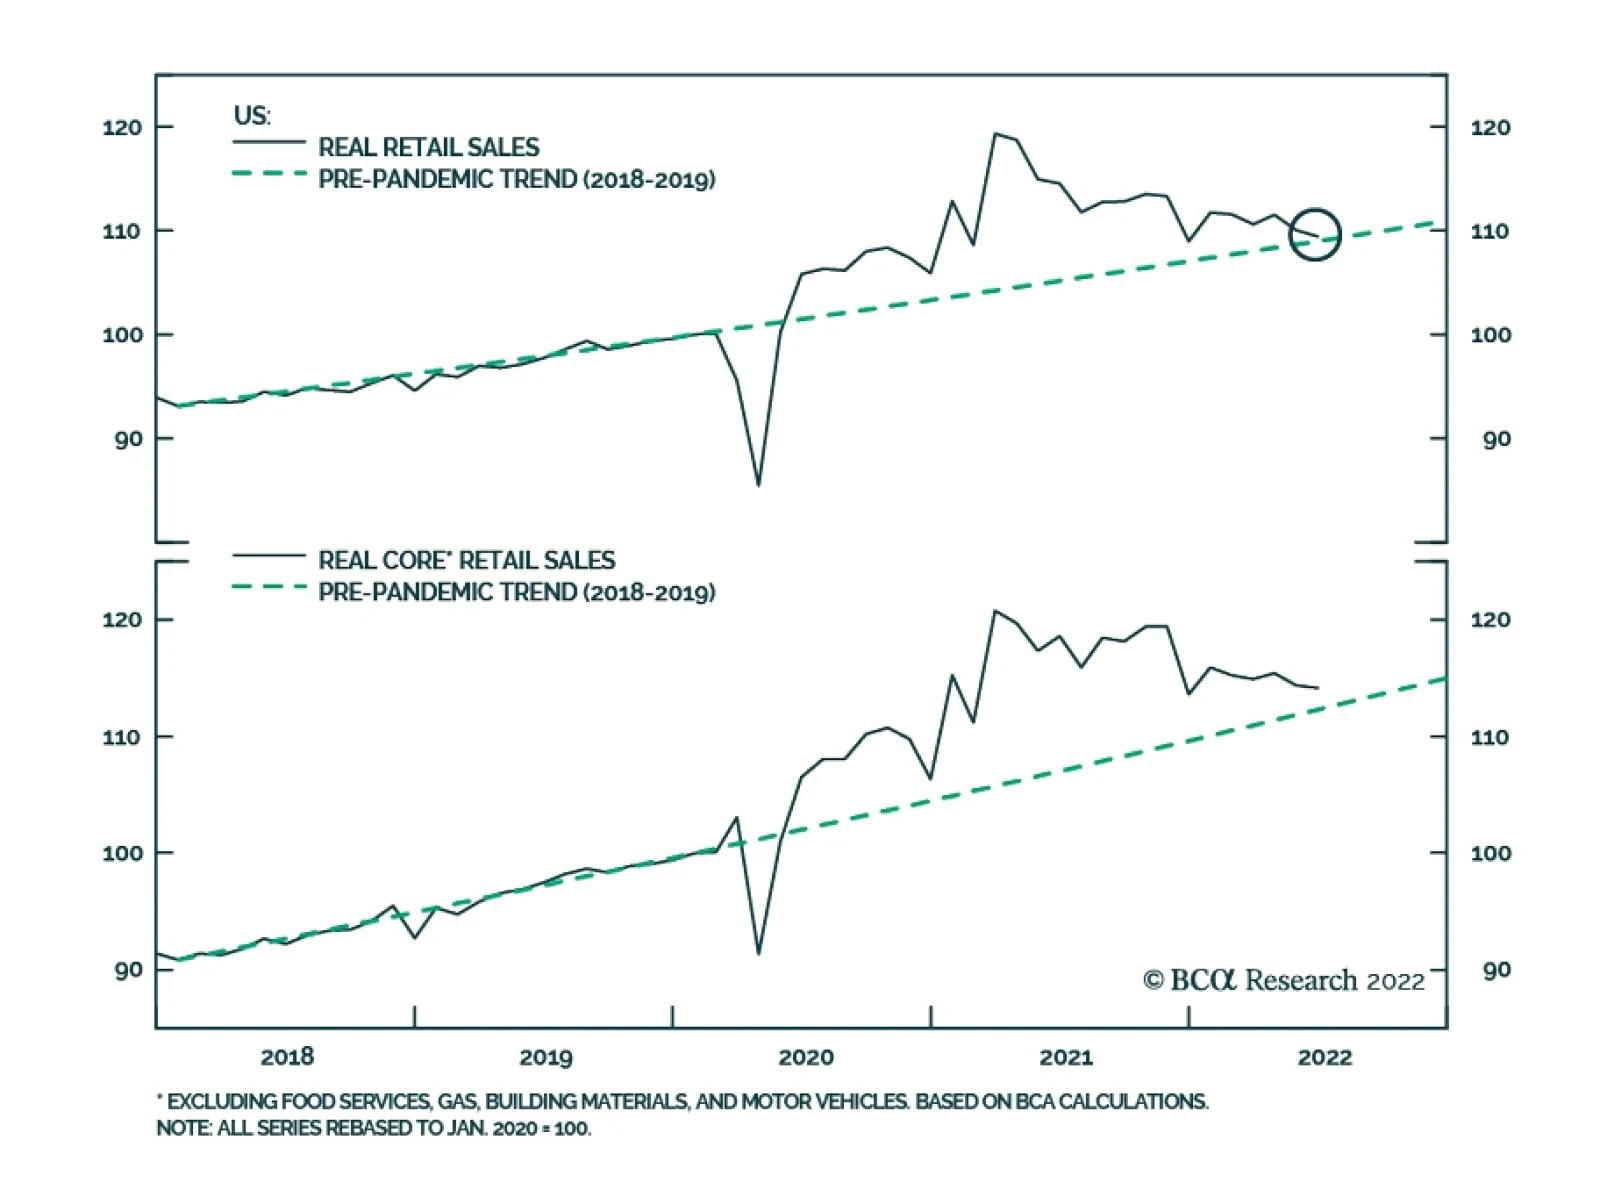
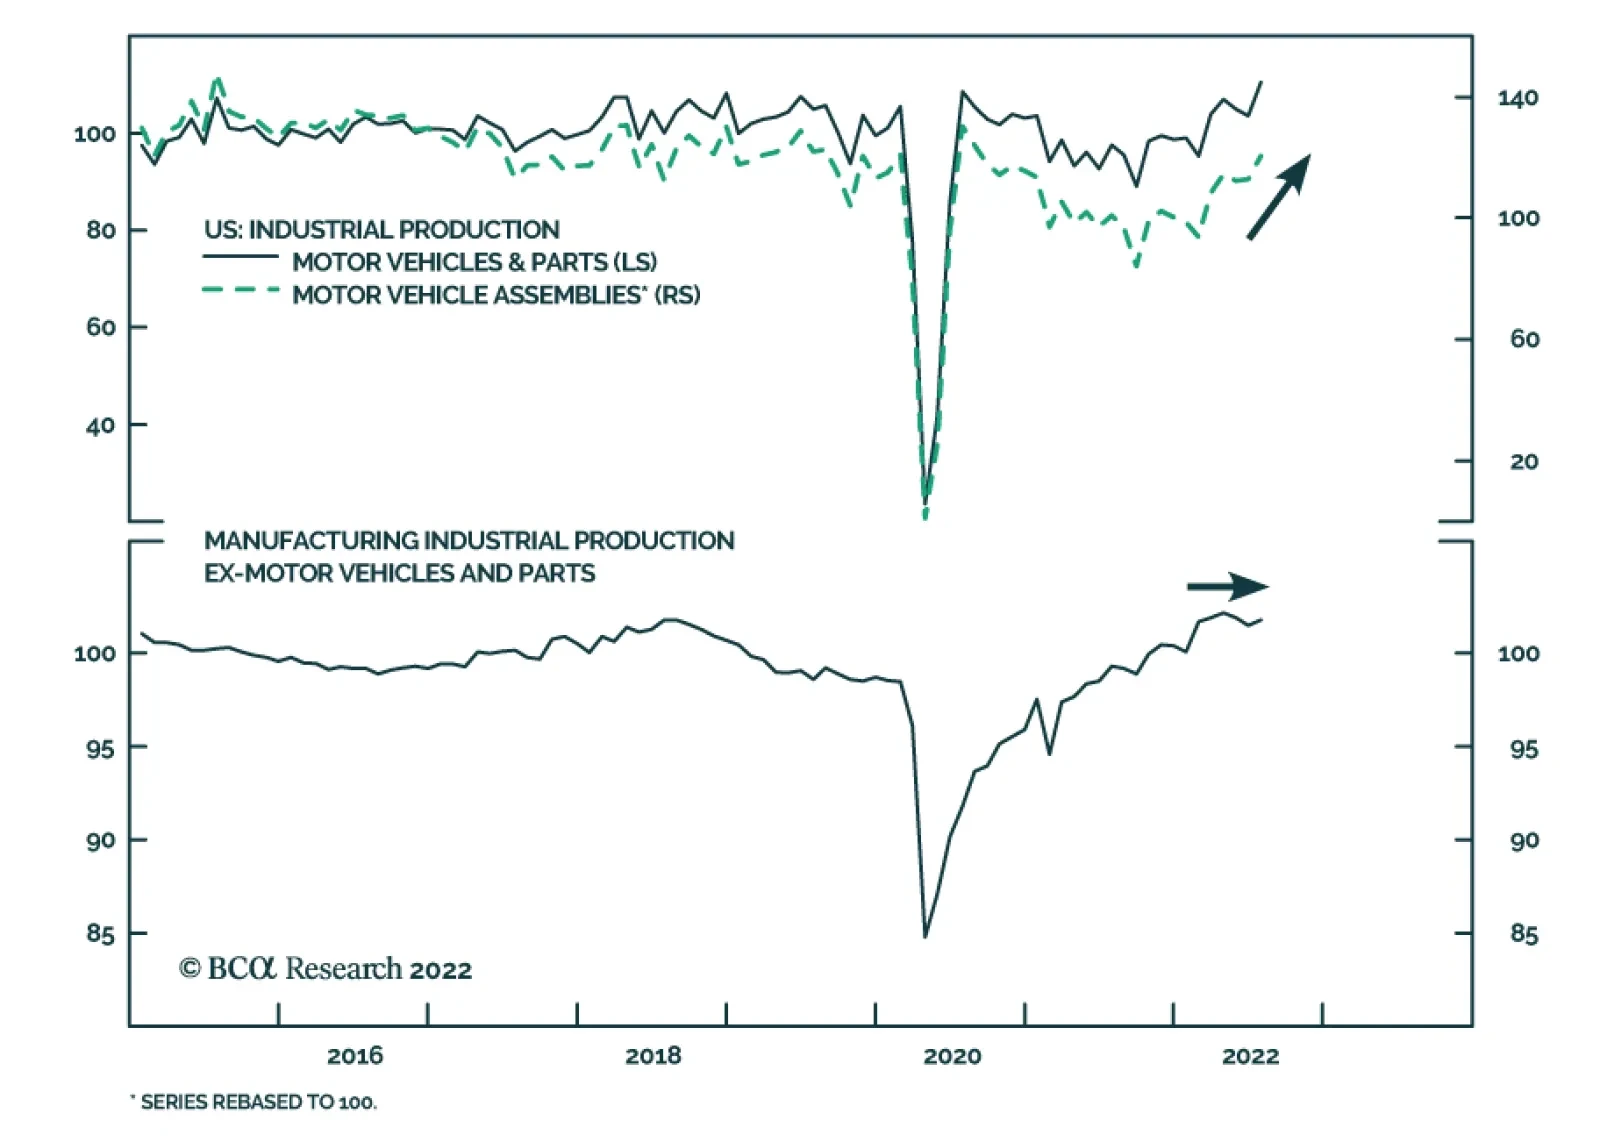
US retail sales were unchanged m/m in July, and the previous month’s positive surprise was revised downwards to 0.8% m/m. Declines in the sales of motor vehicles and parts, as well as in gasoline prices, offset gains from nonstore retailers, building…
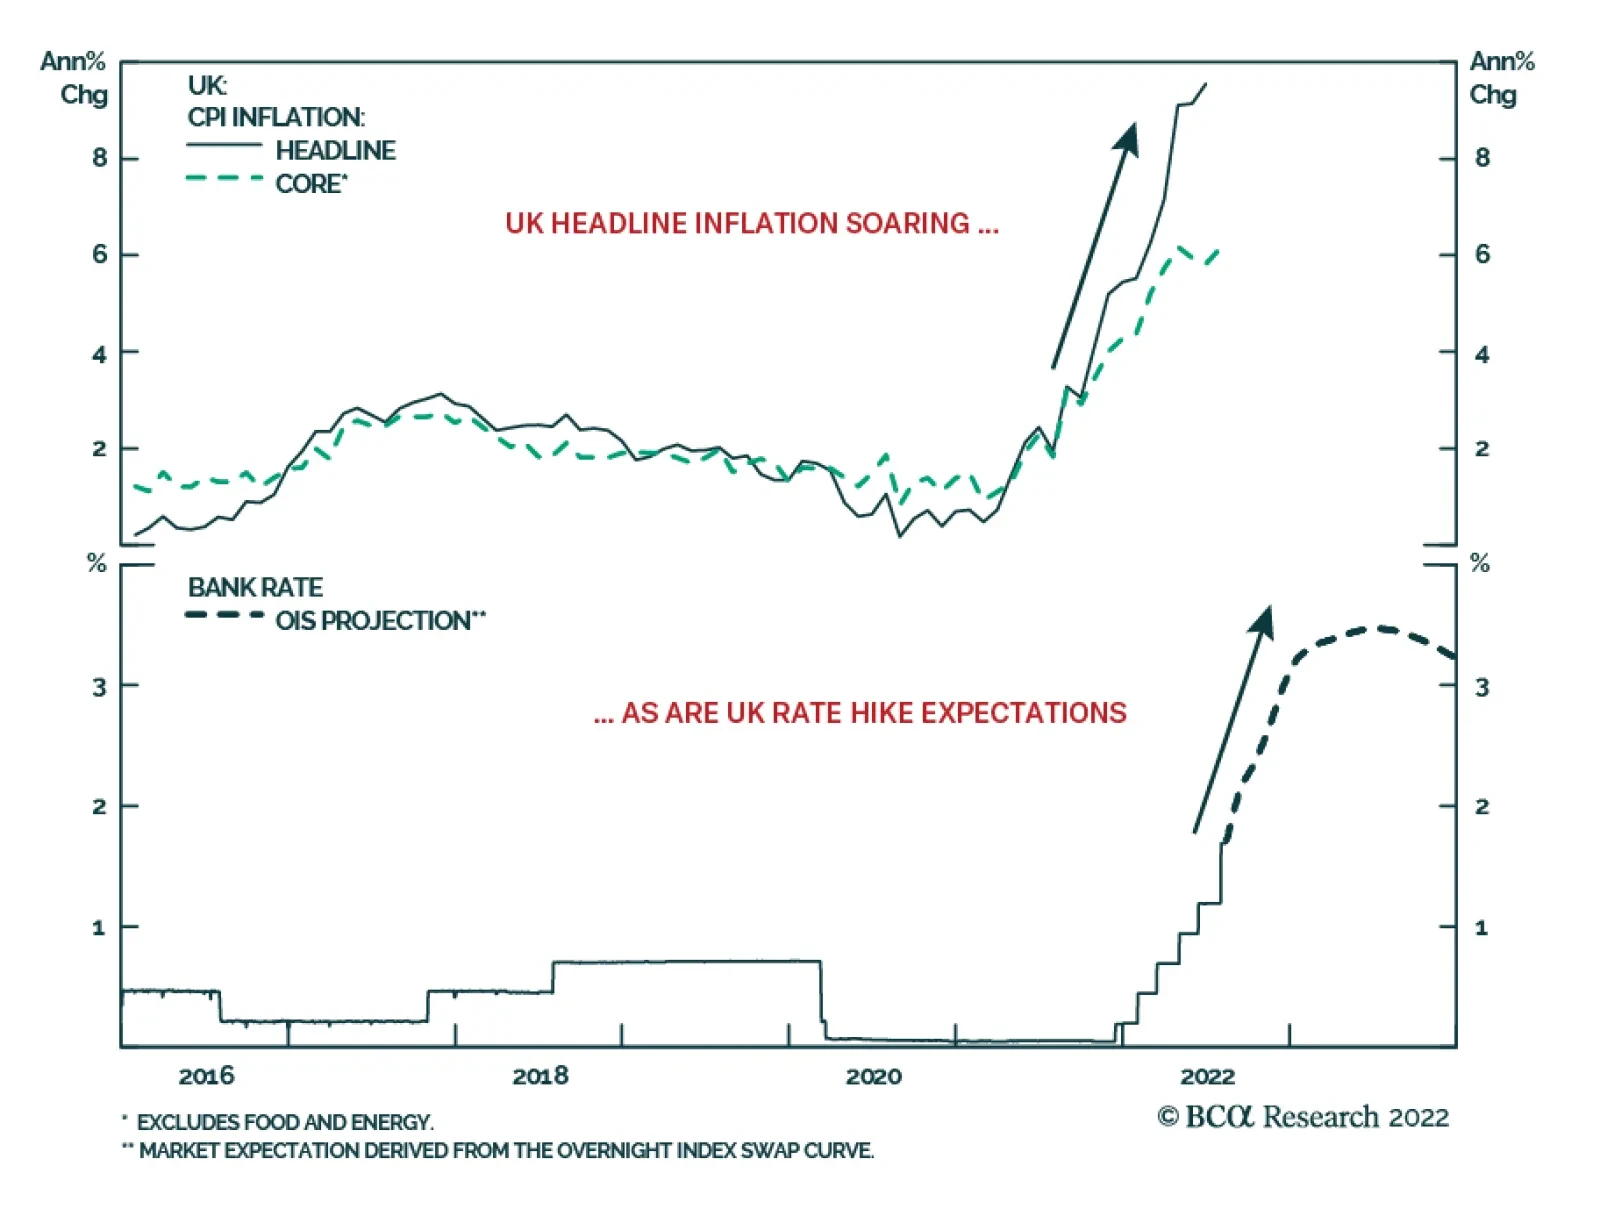
The July UK CPI data released on Wednesday showed an acceleration of year-over-year headline inflation into double-digit territory at 10.1%, up from 9.4% in June and beating market expectations. Higher food and energy prices were the largest contributors, but…
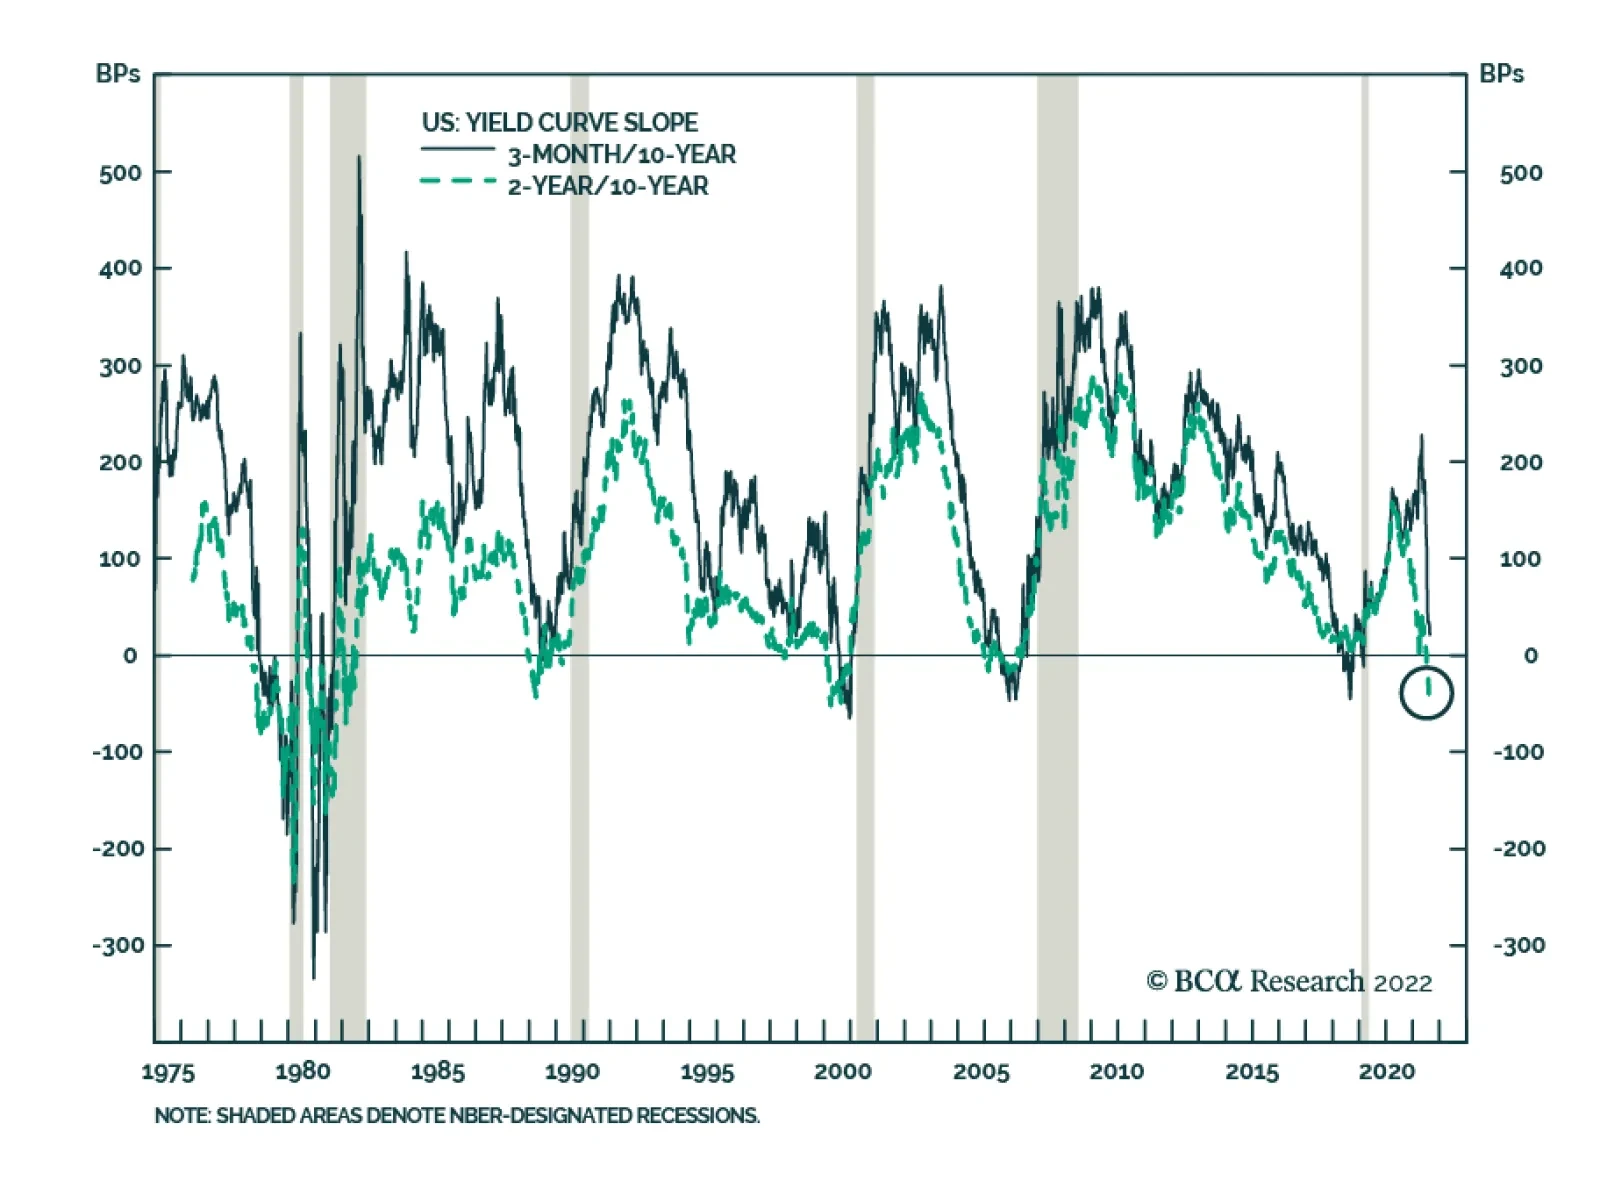
Despite all the worries, the most reliable yield curve slope measure, the 3-month/10-year segment, is not yet sending a recessionary signal. At 14bps, it is very flat, but recessions only follow an actual inversion, not a mere flattening episode. However, the…
Executive Summary More Regional Divergences Within Our Global LEI
More Regional Divergences Within Our Global LEI
More Regional Divergences Within Our Global LEI
The BCA global leading economic indicator (LEI) is still in a downtrend, but its diffusion index – which tends to lead the overall global LEI at major cyclical turning points – has crept higher since bottoming in January. The diffusion index is rising in part because of very marginal increases in the LEIs of a few countries, but there have been more decisive increases in the LEIs of two major countries outside the developed world – China and Brazil. There is not yet enough evidence pointing to a true bottoming of the BCA global LEI anytime soon, but an improvement in the LEI diffusion index above 50 (i.e. a majority of countries with a rising LEI) would be a more convincing signal that global growth momentum is set to rebound. Bottom Line: Given the uncertain message on growth from our global LEI, and with inflation rates still too high for central banks to pivot dovishly, we recommend staying close to neutral on overall global fixed income duration and modestly defensive on overall spread product exposure. Feature Investors can be forgiven for being a bit confused by some conflicting messages in recent global economic data. For example, US real GDP contracted in both the first and second quarter of this year – a so-called “technical recession” – and consumer confidence is at multi-decade lows, yet the US unemployment rate fell to 3.5%, the lowest level since 1969, in July. A similar story is playing out across the Atlantic, where a historic surge in energy prices was supposed to have already tipped the euro area into recession, yet real GDP expanded in both Q1 and Q2 at an above-trend pace and unemployment continues to decline. At times like the present, when market narratives do not always line up with hard data, we always believe it important to look within our vast suite of indicators to help clear the fog. One of our most trusted growth indicators, the BCA Global Leading Economic Indicator (LEI), is still falling and, thus, signaling a continued deceleration of global growth over at least the next 6-9 months. However, there are some signs of more optimistic news embedded within our global LEI stemming from outside the developed economies, which could be a potential early sign of a bottoming in global growth momentum. In this report, we dig deeper into the guts of our global LEI to assess the odds of an imminent turning point in the LEI and, eventually, global growth. This has important implications for global bond yields, which are likely to remain rangebound until there is greater clarity on global growth momentum (and inflation downside momentum). What Leads The Leading Indicator? The BCA global LEI is a composite index that combines the LEIs of 23 individual countries using GDP weights. The underlying list of countries differs from that of the widely followed OECD LEI, which is comprised of data from 33 countries but with a heavy weighting on developed market economies. The overall OECD LEI excludes important exporting countries such as Taiwan and Singapore, which are highly sensitive to changes in global growth. Most importantly, the OECD LEI omits the world’s largest economy, China. For our global LEI, we prefer to use a smaller set of countries but one that includes China and a bigger weighting on emerging market (EM) economies. For most of the nations in our global LEI, we do use the country-level LEIs produced by the OECD.1 That also includes several large and important non-OECD EM countries for which the OECD calculates LEIs - a list that includes China, Brazil, India, Russia, Indonesia and South Africa. For a few selected countries, however, we use the following data: US, Korea, Taiwan and Singapore: LEIs produced by national government data sources or, in the case of the US, the Conference Board. Argentina, Malaysia and Thailand: LEIs are produced in-house at BCA, a necessary step given the lack of domestically-produced LEIs in those countries at the time our global LEI was first constructed. We find that our global LEI leads global real GDP growth by around six months, and leads global industrial production growth by around twelve months (Chart 1). Chart 1A Gloomy Message From Our Global LEI
A Gloomy Message From Our Global LEI
A Gloomy Message From Our Global LEI
The latest reading on the global LEI from July is pointing to a further deceleration of global GDP into a “growth recession” where GDP is expanding slower than the pace of potential global GDP growth (less than 2%). The global LEI is also pointing to an outright contraction of global industrial production, a path also signaled by the JPMorgan global manufacturing PMI index which hit a two-year low of 51.1 – closing in on the 50 level that signifies expanding industrial activity – in July. Chart 2A Ray Of Hope On Global Growth?
A Ray Of Hope On Global Growth?
A Ray Of Hope On Global Growth?
The momentum of our global LEI is largely influenced by its breadth. Specifically, we have found that when a growing share of countries within the global LEI have individual LEIs that are rising, the overall LEI will eventually follow suit. Thus, the diffusion index of our global LEI, which measures the percentage share of countries with rising individual LEIs, is itself a fairly good leading indicator of the global LEI at major cyclical turning points. We may be approaching such a turning point, as our global LEI diffusion index has increased from a low of 9 back in January of this year to the level of 30 in July (Chart 2). In past business cycles, the diffusion index has tended to lead the global LEI by around 6-9 months, which suggests that a bottom in the actual global LEI could occur sometime in the next few months – although that outcome is conditional on the magnitude of the rise in the diffusion index. In the top half of Table 1, we list previous episodes since 1980 where the global PMI diffusion index followed a similar path to that seen in 2022 – bottoming out below 10 and then rising to at least 30. We identified nine such episodes. In the table, we also show the subsequent change in the level of the global LEI after the increase in the diffusion index. Table 1Global LEI Diffusion Index Greater Than 50 Typically Signals LEI Uptrend
A Hint Of Recovery In The BCA Global Leading Economic Indicator?
A Hint Of Recovery In The BCA Global Leading Economic Indicator?
The historical experience shows that an increase in the diffusion index to 30 was only enough to trigger a decisive rebound in the global LEI over a 6-12 month horizon in the 2000-01 and 2008 episodes. In several episodes, the global LEI actually contracted despite the pickup in the diffusion index. Related Report Global Fixed Income StrategyDovish Central Bank Pivots Will Come Later Than You Think In the bottom half of Table 1, we run the same analysis but define the episodes as when the diffusion index rose from a low below 10 to at least 50. Unsurprisingly, periods when at least half of the countries have a rising LEI tend to result more frequently in the overall global LEI entering an uptrend within one year – although the two most recent episodes in 2010 and 2018-19 were notable exceptions. Bottom Line: After looking at past experience, the latest pickup in the global LEI diffusion index has not been by enough to confidently forecast a rebound in the LEI – and, eventually, faster global growth. No Broad-Based Improvement In Our Global LEI When grouping the countries within our global LEI by geographical region, it is clear that there is still no sign of improvement in North America or Europe, but some signs of bottoming in Asia and Latin America (Chart 3). Typically, the regional LEIs tend to be very positively correlated during major cyclical moves in the overall LEI, with no one region being particularly better than the others at consistently leading the global business cycle. Chart 3More Regional Divergences Within Our Global LEI
More Regional Divergences Within Our Global LEI
More Regional Divergences Within Our Global LEI
Table 2Country Weightings In Our Global LEI
A Hint Of Recovery In The BCA Global Leading Economic Indicator?
A Hint Of Recovery In The BCA Global Leading Economic Indicator?
Of course, the global LEI is a GDP-weighted index that is dominated by the US and China (Table 2). When looking at individual country LEIs, the recent improvement in the LEI diffusion index looks less impressive. Some countries, like the UK and Korea, have only seen a tiny fractional uptick in the most recent LEI reading – moves small enough to qualify as statistical noise, even though the tiniest of positive moves still register as an “increase” when calculating the diffusion index. When looking at all the individual country LEIs within our global LEI, only two countries stand out as having meaningful increases over the past few months – China and Brazil (Chart 4). In the case of China, the idea that there could be signs of improving growth runs counter to the broad swath of recent data that highlight slowing momentum of Chinese consumer spending, business investment and residential construction. However, the production-focused components of the OECD’s China LEI, which we use in our global LEI, have shown some improvement of late (Chart 5). For example, motor vehicle production grew at a 32% year-over-year rate in July according to the OECD’s data, while total construction activity (based on OECD aggregates of production by industry) rose 9% year-over-year. Chart 4LEI Improvement In China & Brazil, Sluggish Elsewhere
LEI Improvement In China & Brazil, Sluggish Elsewhere
LEI Improvement In China & Brazil, Sluggish Elsewhere
Chart 5Improvement In Some Components Of The OECD's China LEI
Improvement In Some Components Of The OECD's China LEI
Improvement In Some Components Of The OECD's China LEI
The OECD’s LEI methodology is designed to include the minimum number of data series to optimize the fit of the LEI to the growth rate of each country’s industrial production index, which does lead to some peculiar series being included in the LEIs. However, there are signs of a potential rebound in Chinese economic growth evident in indicators preferred by our emerging market strategists, like the change in overall credit and fiscal spending as a share of GDP, a.k.a. the credit and fiscal impulse (Chart 6). The latter has shown a modest improvement that is hinting at faster Chinese growth in 2023, similar to the OECD’s China LEI. Turning to Brazil, the improvement in the OECD’s LEI there is focused on more survey-based data, like confidence among manufacturers and expectations on the demand for services. However, some hard data that the OECD includes in its Brazil LEI, namely net exports to Europe, have also shown clear improvement (Chart 7). Chart 6China Credit/Fiscal Impulse Signaling A Growth Rebound
China Credit/Fiscal Impulse Signaling A Growth Rebound
China Credit/Fiscal Impulse Signaling A Growth Rebound
Bottom Line: The modest improvement in our global LEI diffusion index is even less than meets the eye, as only China and Brazil have seen LEI increases that are meaningfully greater than zero. Chart 7Improvement In Many Components Of The OECD's Brazil LEI
Improvement In Many Components Of The OECD's Brazil LEI
Improvement In Many Components Of The OECD's Brazil LEI
Investing Around The Global LEI Chart 8Global Financial Conditions Not Signaling An LEI Rebound
Global Financial Conditions Not Signaling An LEI Rebound
Global Financial Conditions Not Signaling An LEI Rebound
Investors spend a sizeable chunk of their time focused on the future growth outlook to make investment decisions. This would, presumably, give leading economic indicators a useful role in any investment process. However, when looking at the relationship between our global LEI and the returns on risk assets like equities and corporate credit, the correlation is highly coincident (Chart 8). In other words, risk assets are themselves leading indicators of future economic growth – so much so that equity indices are often included as a component of the leading indicators of individual countries. On that front, the recent rebound in global equity markets, and the pullback in global credit spreads from the mid-June peak, could be signaling a more stable growth outlook that would be reflected in a bottoming of our global LEI. However, the monetary policy cycle matters, as evidenced by the correlation between the shape of government bond yield curves and our global LEI (bottom panel). That relationship is less strong than that of the LEI and equity/credit returns, but there are very few examples where yield curves are flat, or even inverted as is now the case in the US, and leading indicators are rising. Chart 9Stay Neutral On Overall Duration Exposure
Stay Neutral On Overall Duration Exposure
Stay Neutral On Overall Duration Exposure
In the current environment where more central banks are worrying more about overshooting inflation than slowing growth, a turnaround in our global LEI will be difficult to achieve until inflation is much closer to central bank target levels, allowing policymakers to loosen policy and steepen yield curves. We do not expect such a scenario to unfold over at least the next 12-18 months, given broad-based entrenched inflation pressures in global services and labor markets. While leading indicators may not be of much value in forecasting risk assets, we do find value in using them to forecast moves in government bond yields. Regular readers of BCA Research Global Fixed Income Strategy will be familiar with our Global Duration Indicator, comprised of growth-focused measures that have historically had a leading relationship to the momentum (annual change) in developed market bond yields (Chart 9). The Duration Indicator contains both the global LEI and its diffusion index, as well as the ZEW expectations indices for the US and Europe. Three of those four indicators remain at depressed levels suggesting waning bond yield momentum. Overshooting global inflation has weakened the correlation between bond yield momentum and our Duration Indicator over the past year. However, with global commodity and goods inflation now clearly decelerating, we expect bond momentum to begin tracking growth dynamics more closely again. This leads us to expect bond yields to remain trapped in ranges over at least the balance of 2022, defined most prominently by the 10-year US Treasury yield trading between 2.5% and 3%. Bottom Line: Given the uncertain message on growth from our global LEI, and with inflation rates still too high for central banks to pivot dovishly, we recommend staying close to neutral on overall global fixed income duration and modestly defensive on overall spread product exposure. Robert Robis, CFA Chief Fixed Income Strategist rrobis@bcaresearch.com Footnotes 1 Details on how the OECD calculates the individual country leading economic indicators can be found here: http://www.oecd.org/sdd/leading-indicators/compositeleadingindicatorsclifrequentlyaskedquestionsfaqs.htm\ GFIS Model Bond Portfolio Recommended Positioning Active Duration Contribution: GFIS Recommended Portfolio Vs. Custom Performance Benchmark
A Hint Of Recovery In The BCA Global Leading Economic Indicator?
A Hint Of Recovery In The BCA Global Leading Economic Indicator?
The GFIS Recommended Portfolio Vs. The Custom Benchmark Index Global Fixed Income - Strategic Recommendations* Cyclical Recommendations (6-18 Months)
A Hint Of Recovery In The BCA Global Leading Economic Indicator?
A Hint Of Recovery In The BCA Global Leading Economic Indicator?
US industrial production grew 0.6% m/m in July, exceeding expectations of 0.3%. Capacity utilization also firmed to 80.3% in July, from 80.0%. These figures contrast with the previously released August Empire State manufacturing survey which sent a poor…
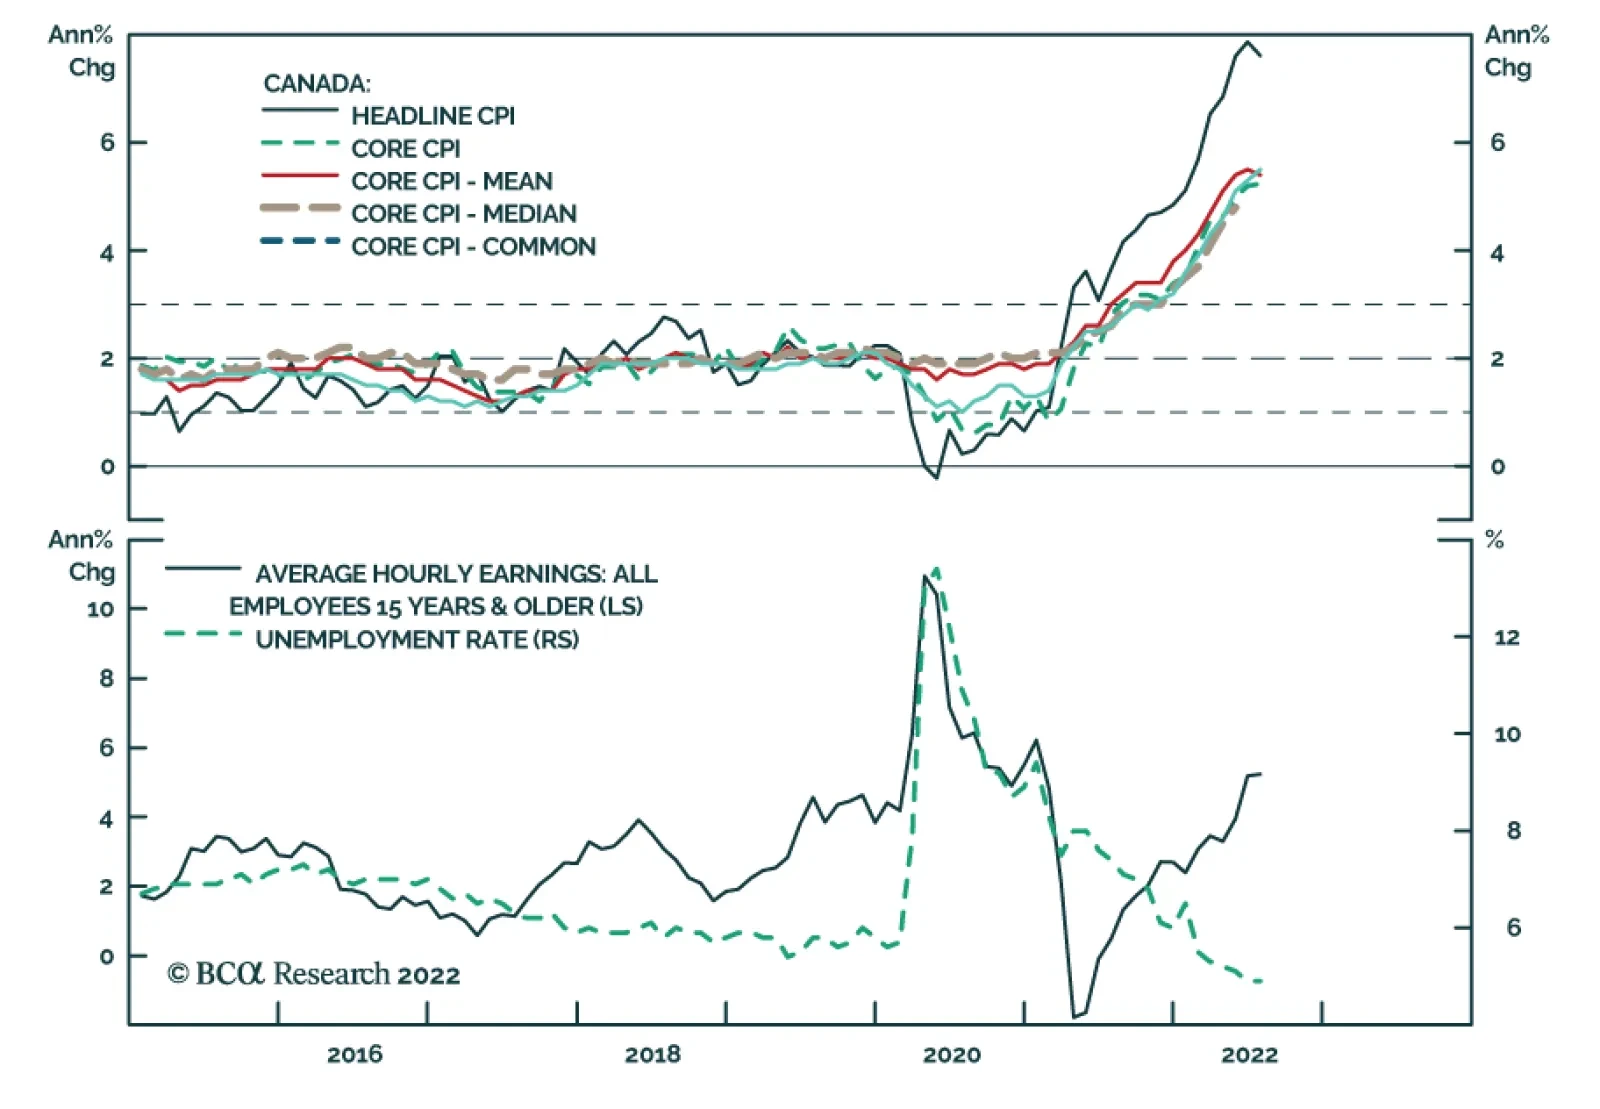
Canadian headline inflation rose at a slower 7.6% y/y (0.1% m/m) pace in July, down from 8.1% y/y (0.7% m/m) in June. Decelerating gasoline prices were the main contributor to easing inflation. Excluding gasoline, CPI rose 6.6% y/y from 6.5% y/y in June.…
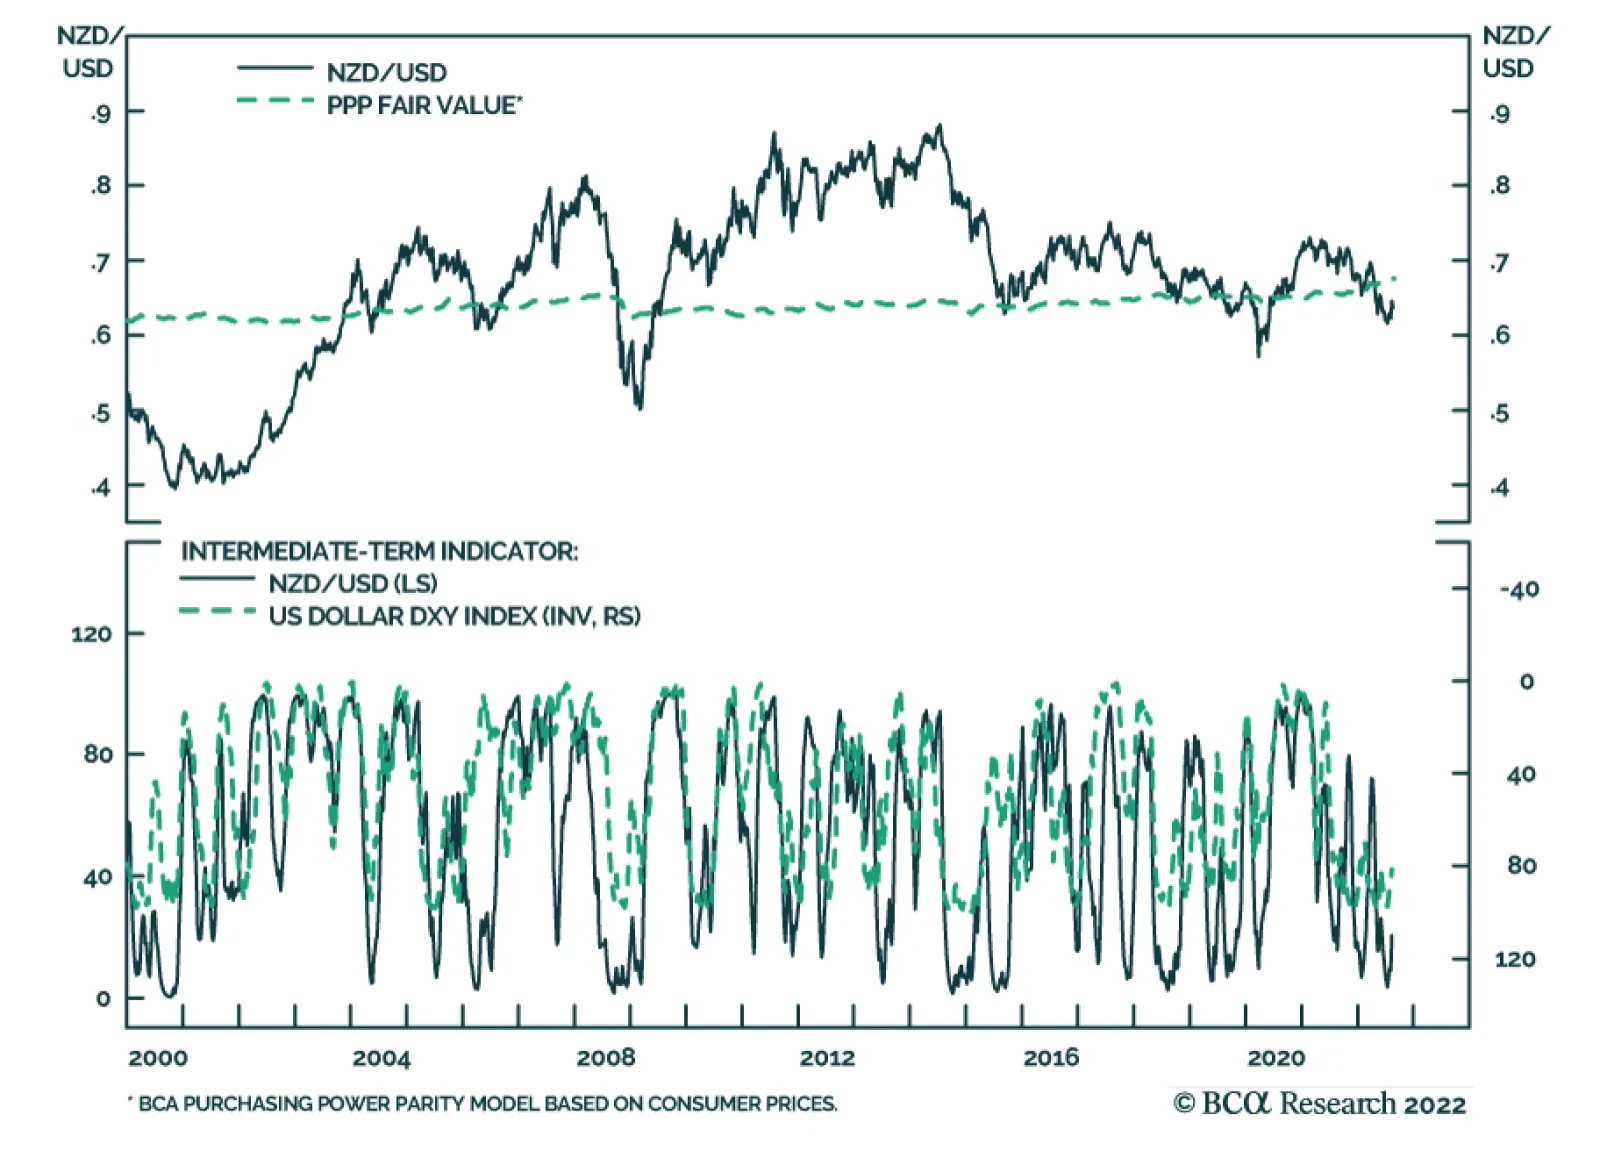
The DXY index has dropped from a high of 108.54 in July to 106.47 today and is churning around its 50-day moving average. As both bulls and bears battle the next move in the dollar, one currency that is likely to lag its G10 peers is the kiwi, according to…