Developed Countries
BCA Research’s US Political Strategy & US Equity Strategy services conclude that Biden’s legislative victories are not disinflationary. The bill does not stand alone but is part of the Biden administration’s “last-ditch effort” to pass two major bills…

Dear Client, This week, the US Bond Strategy service is hosting its Quarterly Webcast (August 16 at 10:00 AM EDT, 15:00 PM BST, 16:00 PM CEST). In addition, we are sending this Quarterly Chartpack that provides a recap of our key recommendations and some charts related to those recommendations and other areas of interest for US bond investors. Please tune in to the Webcast and browse the Chartpack at your leisure, and do let us know if you have any questions or other feedback. To view the Quarterly Chartpack PDF please click here. Best regards, Ryan Swift, US Bond Strategist Treasury Index Returns Spread Product Returns
The gauge of manufacturing activity in the state of New York slumped 42 points to a -31.3 contraction in August, largely disappointing expectations of a relatively more muted deterioration. Notably, new orders and shipments contracted by 36 points and 49…
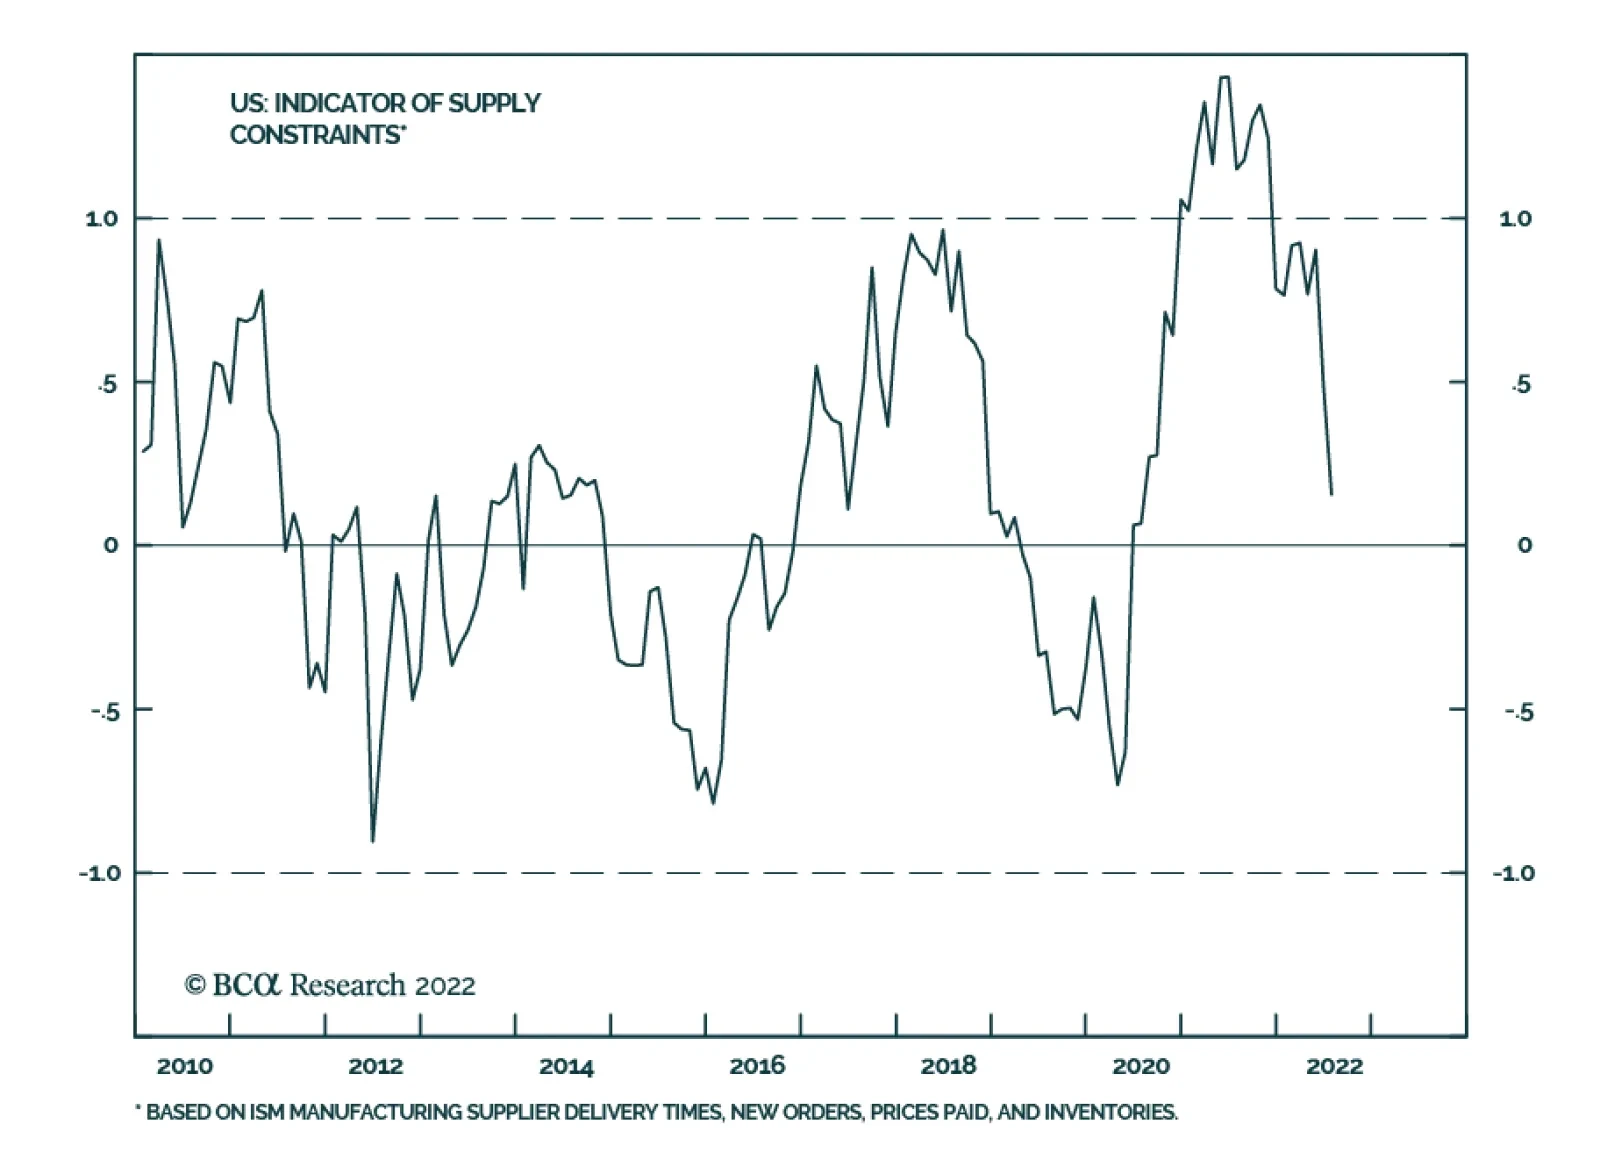
The supply bottlenecks caused by the pandemic are easing rapidly. Global trade is flowing once again as highlighted by the rapid decline in bulk and container shipping costs around the world. Companies are also taking notice. BCA’s indicator of US Supply…
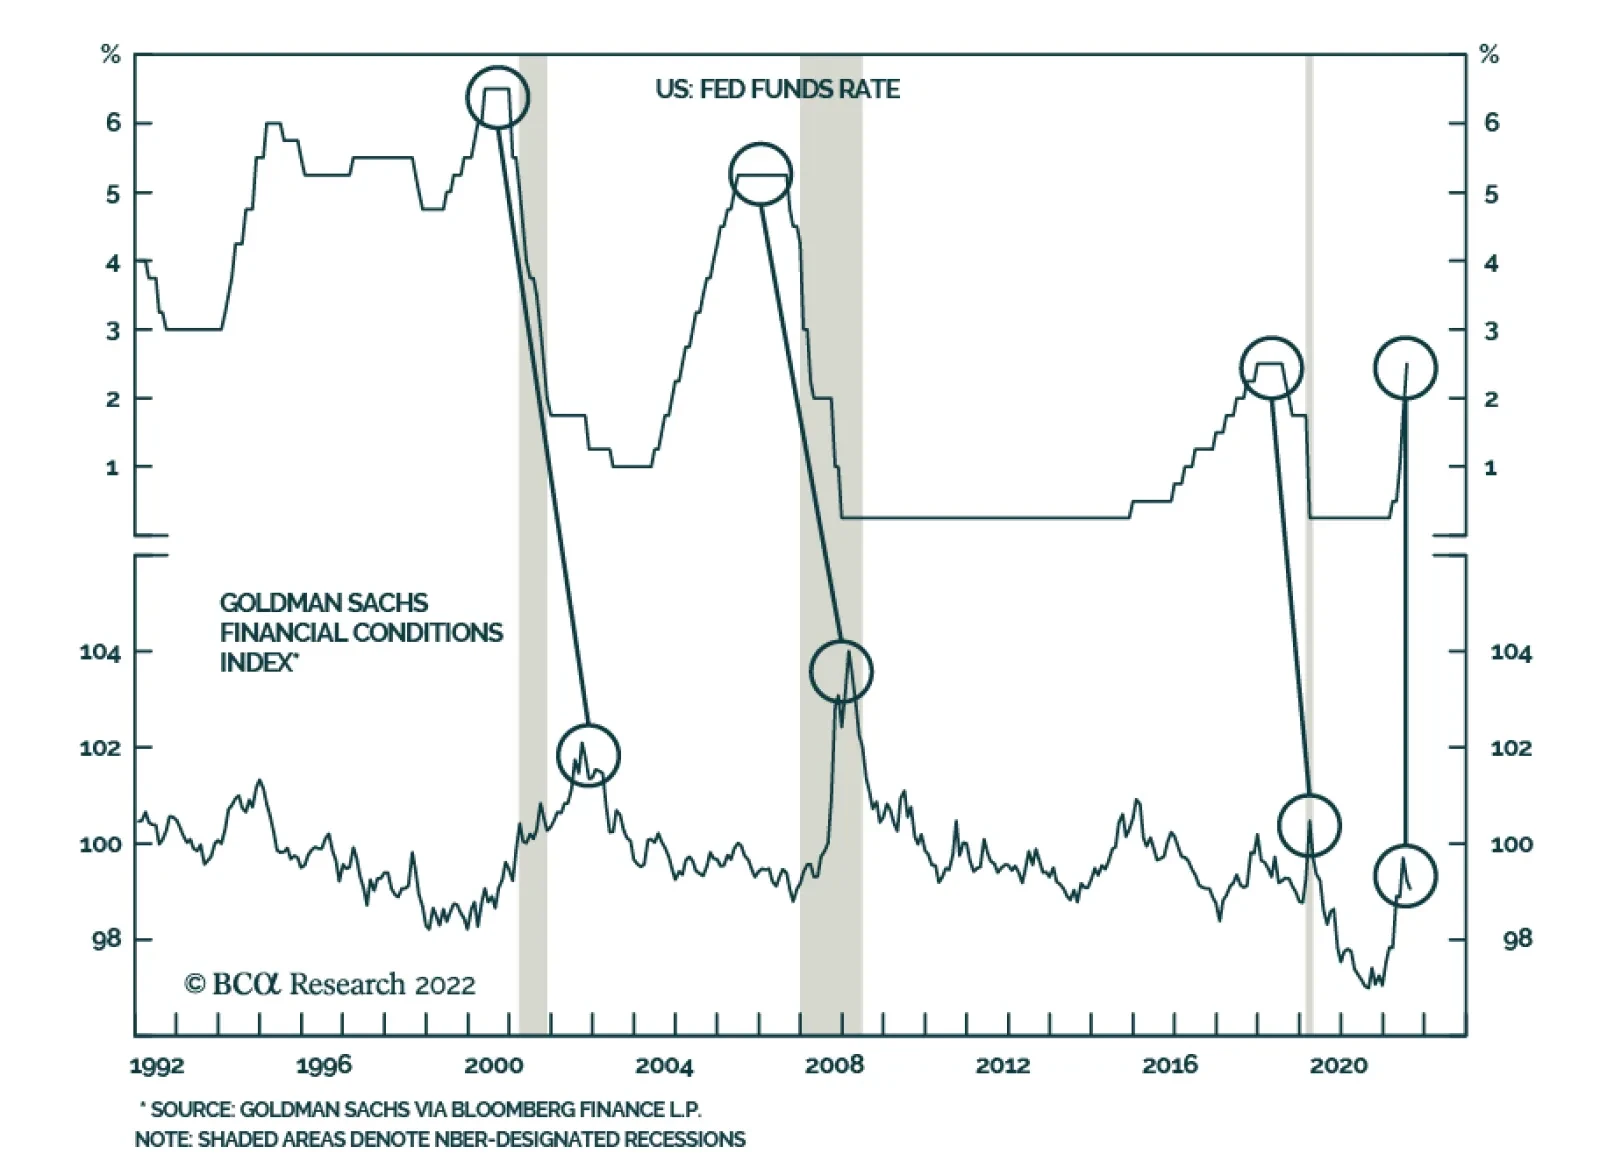
As illustrated by Goldman Sachs’ Financial Conditions Index (FCI), the US economy came under considerable pressure in H1 as a wide swath of financial markets sold off sharply. Every one-point move in the FCI equates to a one-percentage-point move in real GDP…
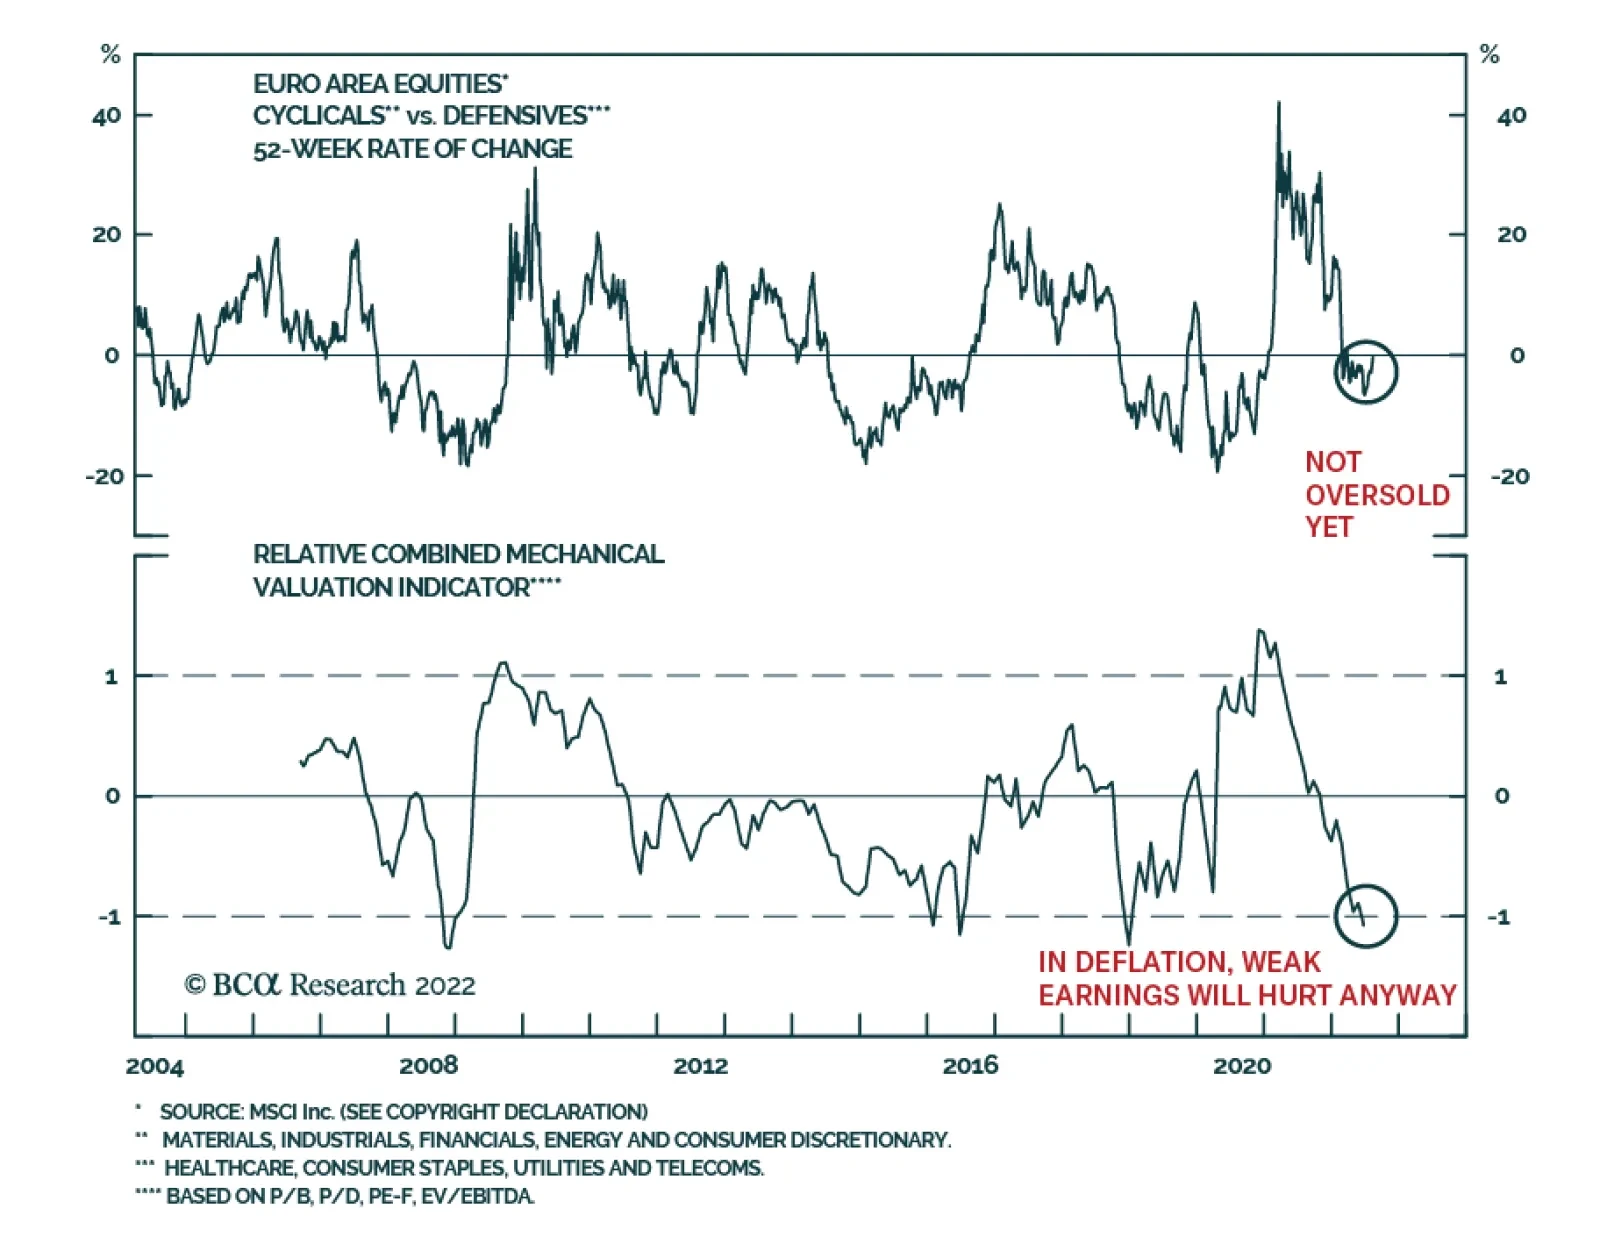
According to BCA Research’s European Investment Strategy service, the risk of deflation is greater than investors currently appreciate, which would be especially painful for European equities. European equities are more cyclical than their US counterparts,…
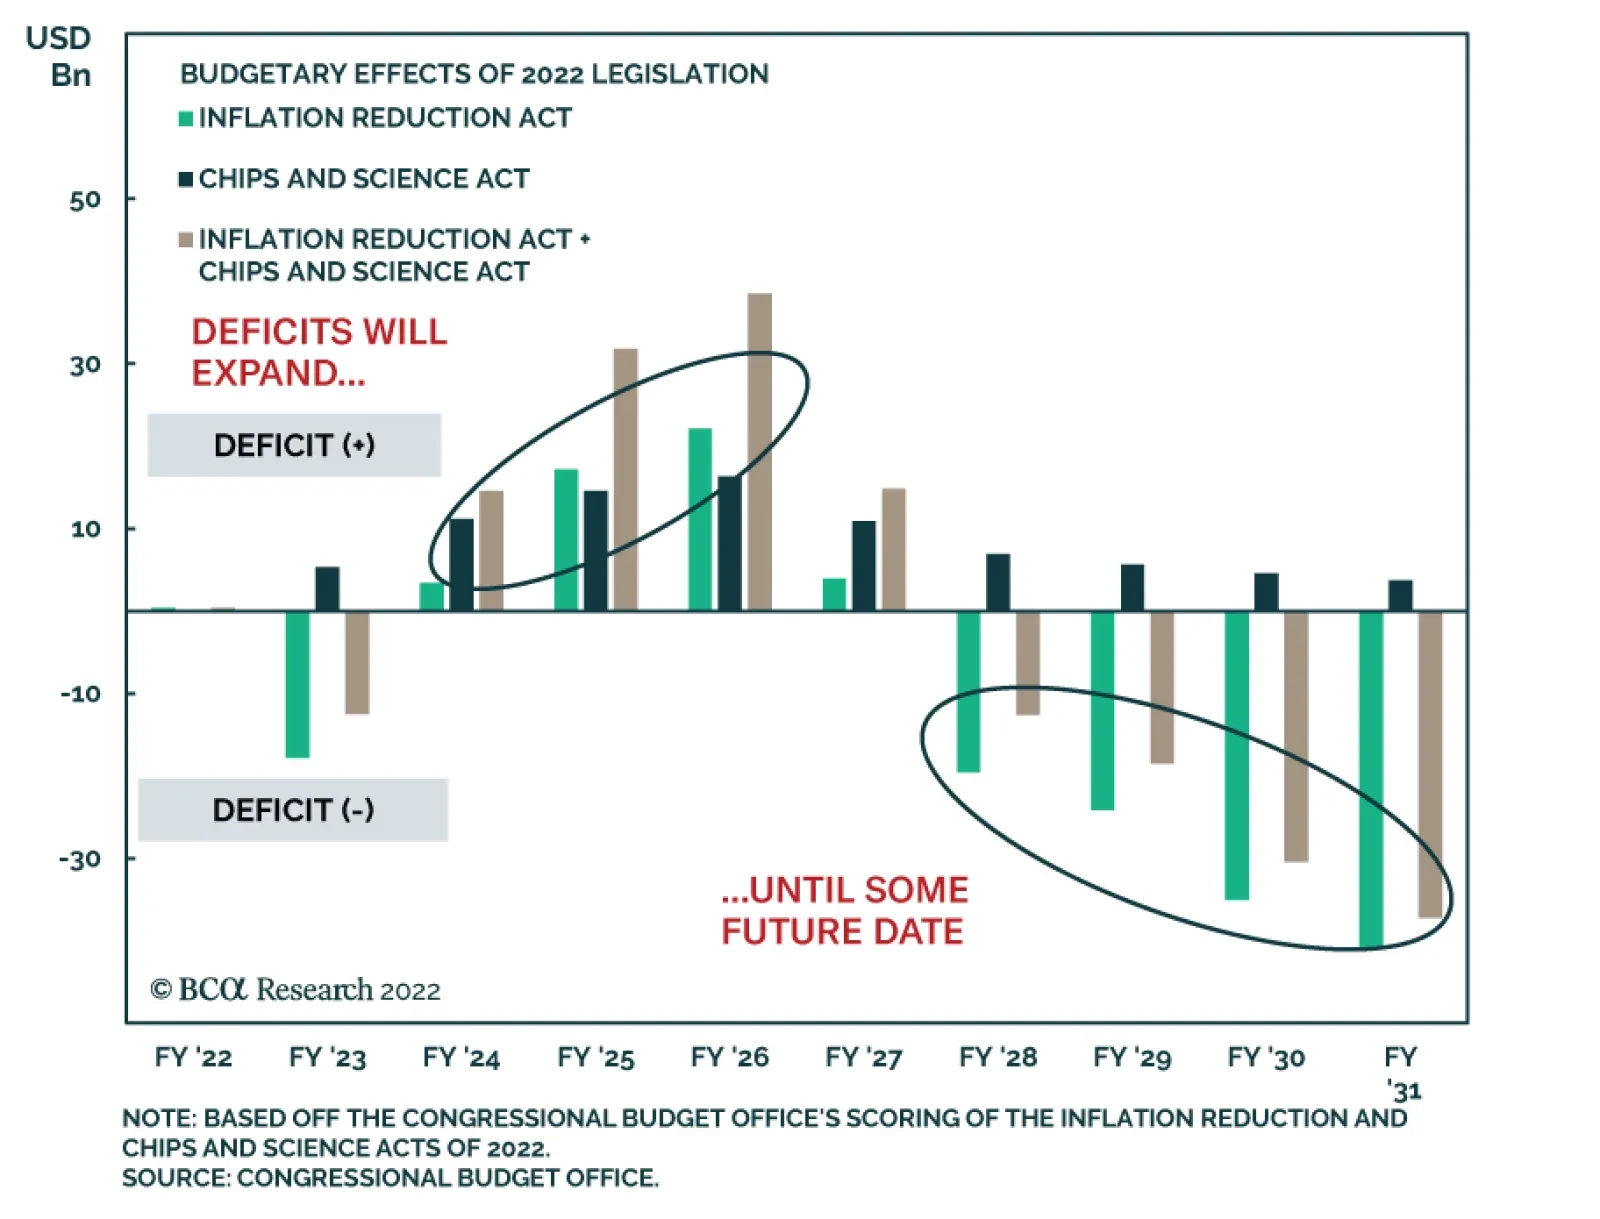
Executive Summary US Deficits Will Rise Before They Fall
No, The Inflation Reduction Act Will Not Reduce Inflation
No, The Inflation Reduction Act Will Not Reduce Inflation
The Inflation Reduction Act combined with the Chips and Science Act will add $88 billion to the budget deficit through FY2027. The two bills would only reduce the deficit by $11.1 billion by 2031. The deficit that year will be $2 trillion. Hence Congress’s latest actions add to the deficit in the short run and are effectively deficit-neutral over the long run. That is not disinflationary. Gridlock is still the likeliest outcome of the midterm elections. That is disinflationary for 2023-24 because fiscal policy freezes. Whether gridlock will persist after 2024 is unknown. Federal investments in US computer chips and renewable energy could enhance productivity over the long run. That could well be disinflationary … but the magnitude and timing are unknown. Overall, US social spending, industrial spending, defense spending, and government intervention are rising as the nation-state responds to social unrest and geopolitical conflict. Inflation will depend on many things, but this policy trend is not disinflationary. Close Recommendation (Tactical) Closing Level CLOSING DATE Return Long US Treasuries Vs. TIPS 1.3768 AUG 12, 2022 1.53% Bottom Line: Close long US Treasuries relative to TIPS. But stay long the US dollar. Biden’s legislative victories underscore our strategic themes of Limited Big Government and Peak Polarization – and are not disinflationary. Feature President Biden’s approval rating ticked up to 40% after a series of policy wins, including the passage of the Inflation Reduction Act and the Chips and Science Act. These bills reinforce our strategic theme of Limited Big Government, i.e. a rising role for the state within the US’s free market context. When Biden unveiled his anti-inflation agenda back in June we argued that his only real options to reduce inflation before the midterm elections hinged on other people: namely the Federal Reserve, the Saudis, the Iranians, and also Capitol Hill. With regard to Congress, we expected Democrats to pass a budget reconciliation bill. We saw that they were repackaging this bill as an “inflation reduction” measure to improve their election prospects. But we argued that it would not fight inflation in any substantive way.1 Now that the bill is on the way to Biden’s desk, it is only fair to ask: What will be the impact? Will it reduce inflation or not? The short version is no. The bill does not stand alone but is part of the Biden administration’s “last-ditch effort” to pass two major bills before the midterms. These two laws are deficit-neutral at best but slightly stimulative in the short run – and hence marginally inflationary. These laws could prove disinflationary over the long run, as investments in semiconductors and renewable energy should drive innovation. But that is hard to predict. We are optimistic on that front but for the foreseeable future the effects are neutral or inflationary. To understand this view, we need to review BCA’s stance on inflation overall and then discuss the legislation. The BCA View On Inflation BCA sees this year’s inflationary bout as both a cyclical and a structural phenomenon. The cyclical rise in inflation stemmed from the pandemic and the ensuing economic stimulus. This cycle is peaking now. Commodity prices are moderating and goods spending has fallen two-thirds of the way back to where it stood prior to the pandemic, suggesting that inflation will take a step back. At very least inflation has stopped skyrocketing (Chart 1). Yet the structural drivers of inflation will persist. Chart 1Inflation Rolls Over ... For Now
Inflation Rolls Over ... For Now
Inflation Rolls Over ... For Now
The long-term inflation thesis hinges first and foremost on global population trends. Fewer prime-age workers as a share of the population means that the price of a prime-age worker goes up. It also hinges on the decline in the global glut of savings, the rise of mercantilism and trade protectionism (i.e. hypo-globalization), and the conclusion of household deleveraging in the wake of the 2008 crisis. Structurally looser fiscal policy – soft budgets – also plays a role. The decay of the liberal world order since 2008 financial crisis entails that western governments face the combined threats of social unrest at home and great power competition abroad. These governments’ answer is to take a more active role in the economy to appease popular wrath, improve energy security, and bulk up national defense. The result will be larger deficits. Larger budget deficits reduce the savings available to the private sector and constrain future supply, feeding into inflation. The result is that, in the United States, the neutral rate of interest will likely prove to be higher than expected, monetary conditions will be looser than expected in real terms, and hence the economy will overheat. At least until central banks and fiscal authorities impose austerity. Bottom Line: Inflation is a cyclical and structural phenomenon in the United States. Cyclically inflation is starting to moderate as various factors from the pandemic and fiscal stimulus wear off. But structurally inflation will be a persistent problem due to population aging, the end of the savings glut, hypo-globalization, geopolitical conflict, and a rising government role in the economy. New Laws Do Not Cut The Deficit Until 2027 At Best Now we can put the Biden administration’s policy into context. The stagflationary cyclical backdrop poses a severe challenge for the ruling Democratic Party. Midterm elections are only three months away and yet headline inflation is still running at 8.5% and core inflation is rising unabated at 5.9% year-on-year. The median voter suffers from high inflation in the form of falling real income and wages. Yet the Democratic legislative agenda has focused on increasing spending, which adds to inflation. If US gasoline prices continue to moderate, the median household’s inflation expectations will come down – and that is a positive short-term development for Democrats (Chart 2). That is why President Biden went to Saudi Arabia with his tail between his legs to beg for more crude oil production. That is why he is trying to do a deal with Iran too (though there our view is pessimistic). That is why he has urged Europe to wait until after the midterm to implement full oil sanctions on Russia. Hence also the Senate repackaged the -$4 trillion “Build Back Better” spending splurge as a +$300 billion “Inflation Reduction” fiscal reform. But will the Inflation Reduction Act truly reduce inflation? Will it affect the cyclical or structural drivers mentioned above? Chart 2Inflation Expectations Moderating
Inflation Expectations Moderating
Inflation Expectations Moderating
The title of the bill alone should prompt investors to be skeptical. The bill does not meaningfully reduce budget deficits. According to the Democratic Party it will generate $300 billion in savings over 10 years, mostly as a result of capping drug costs that Medicare pays to hospitals on behalf of about 64 million Americans. However, the Committee for a Responsible Federal Budget provides a more realistic scenario in which the savings amount to $160 billion, or about half as much as advertised (Table 1).2 The CBO estimates the bill will reduce the budget deficit by $100 billion over 10 years, one third of the official selling point. Table 1What Is Inside The Inflation Reduction Act Of 2022?
No, The Inflation Reduction Act Will Not Reduce Inflation
No, The Inflation Reduction Act Will Not Reduce Inflation
Table 2 shows the CBO’s baseline estimates of the US budget deficit outlook as of July 2021, May 2022, and August 2022 (i.e. the latter with the new legislation). The trend line with the reconciliation bill is virtually indistinguishable from the May estimate (Chart 3). Table 2US Budget Balance Projections Before/After The Inflation Reduction Act
No, The Inflation Reduction Act Will Not Reduce Inflation
No, The Inflation Reduction Act Will Not Reduce Inflation
Chart 3What Deficit Reduction?
No, The Inflation Reduction Act Will Not Reduce Inflation
No, The Inflation Reduction Act Will Not Reduce Inflation
Table 3 shows the specific change in the budget deficit for each year, illustrated in Chart 4. The bill modestly reduces the deficit in 2023 but increases the deficit in subsequent years until 2028. When the bill’s savings peak at $41 billion in 2031, they will shave off 2% of the $2 trillion deficit. Table 3Change In US Deficit Due To Inflation Reduction Act And Chips And Science Act
No, The Inflation Reduction Act Will Not Reduce Inflation
No, The Inflation Reduction Act Will Not Reduce Inflation
In other words, the deficit reduction will not occur until after the 2028 election – by which time it will be swamped by other political and economic factors. In addition, the bipartisan Chips and Science Act will add $47.5 billion to the budget deficit through FY2026 and $79.3 billion through FY2031. Combining them shows that Congress is still adding to spending despite today’s 5.9% core inflation reading – while delaying the miniscule deficit reduction until the latter part of the decade. Credit should be given to the Democrats for offsetting their new spending with revenue increases. But in realistic terms Congress’s latest actions are deficit-neutral at best. The question was how to pay for the desired spending rather than how to impose budget consolidation. Austerity is politically impractical in the context of left-wing and right-wing populism. Chart 4US Deficits Will Rise Before They Fall
No, The Inflation Reduction Act Will Not Reduce Inflation
No, The Inflation Reduction Act Will Not Reduce Inflation
The new fiscal spending makes sense given the strategic predicament that the US faces. But it should flag to investors that the only real fiscal discipline on the horizon will come after the midterm election, when Congress is gridlocked and fiscal policy is basically frozen. Bottom Line: The Inflation Reduction Act combined with the Chips and Science Act will add about $88 billion to the budget deficit through FY2027. The two bills only reduce the growth of the budget deficit by $11.1 billion by 2031. They will not reduce investors’ inflation expectations over the next five years. Cyclical inflation expectations will fall for other reasons – such as Fed rate hikes, the slowdown in global growth, and looming gridlock. Reducing Drug Prices And EV Prices Is Not Generally Disinflationary What about the sector effects of the Inflation Reduction Act? Could they be disinflationary? The bill raises a minimum corporate tax rate of 15% to pay for renewable energy subsidies, it bulks up the Internal Revenue Service’s tax collecting capabilities to pay for an expansion of Obamacare subsidies, and it empowers Medicare to negotiate pharmaceutical prices, creating revenue savings for the federal government. Theoretically caps on drug prices will push prices down, while subsidies to buy electric vehicles (EV) will incentivize Americans to buy those cars and expand the domestic EV supply chain. Hence Democrats can at least claim to be reducing drug price inflation and arguably EV price inflation. Drug price caps are popular and could increase social stability. Electric car subsidies are less popular but tap into demands for domestic manufacturing and action on climate change. Neither will generate substantial opposition in the voting booth. However, the general level of prices will not fall as a result of these sector-specific interventions. Spending on motor vehicles is around 4.2% of total personal consumption expenditure (Chart 5, first panel). Spending on prescription drugs is around 3.2% of total personal consumption expenditure (Chart 5, second panel). Hence the bill could at maximum affect 7.4% of total consumer spending. But only certain drugs will face price caps and only EVs will be subsidized, so the effect is even narrower than that. Spending on cars grew by 1.7% between 2003-20, in line with economic growth. Drug spending grew faster, in line with an aging society, at 2.9% over the same period (Chart 6). Normally the contribution to inflation is negligible for cars but higher-than-average for drugs. True, after Covid-19 car prices surged while drug prices fell below average, but that process should normalize (Chart 7). Chart 5The Role Of Cars And Drugs In Inflation
The Role Of Cars And Drugs In Inflation
The Role Of Cars And Drugs In Inflation
Chart 6Growth Of Car And Drug Spending
Growth Of Car And Drug Spending
Growth Of Car And Drug Spending
Chart 7Change In Car And Drug Prices
Change In Car And Drug Prices
Change In Car And Drug Prices
Only 20 drugs will be eligible for Medicare negotiation per year. The top 20 drugs amount to around 18% of the pharmaceutical market. The new government-negotiated prices will begin to take effect in 2027. The effect will be to dampen domestic manufacturers’ incentive to produce generics, leading to supply constraints or substitution effects (e.g. imports). Hence overall drug prices will not fall as much as expected. The US lacks universal healthcare coverage, so price controls represent an economic transfer between corporations or between corporations and government – not between corporations and consumers. Capping drug prices will benefit insurers directly and consumers only indirectly. The profit will change from the hands of Big Pharma to Big Insurance (managed healthcare providers) (Chart 8). Incidentally big insurers will also benefit from the bill’s expansion of the Obamacare subsidies. Of course, Obamacare enrollees will see a marginal increase in disposable income – especially lower-income individuals, who have a higher propensity to consume. This is positive from the perspective of social stability but likely to be inflationary, not disinflationary. Lower insurance premiums mean more spending cash. Chart 8Big Insurance Versus Big Pharma
Big Insurance Versus Big Pharma
Big Insurance Versus Big Pharma
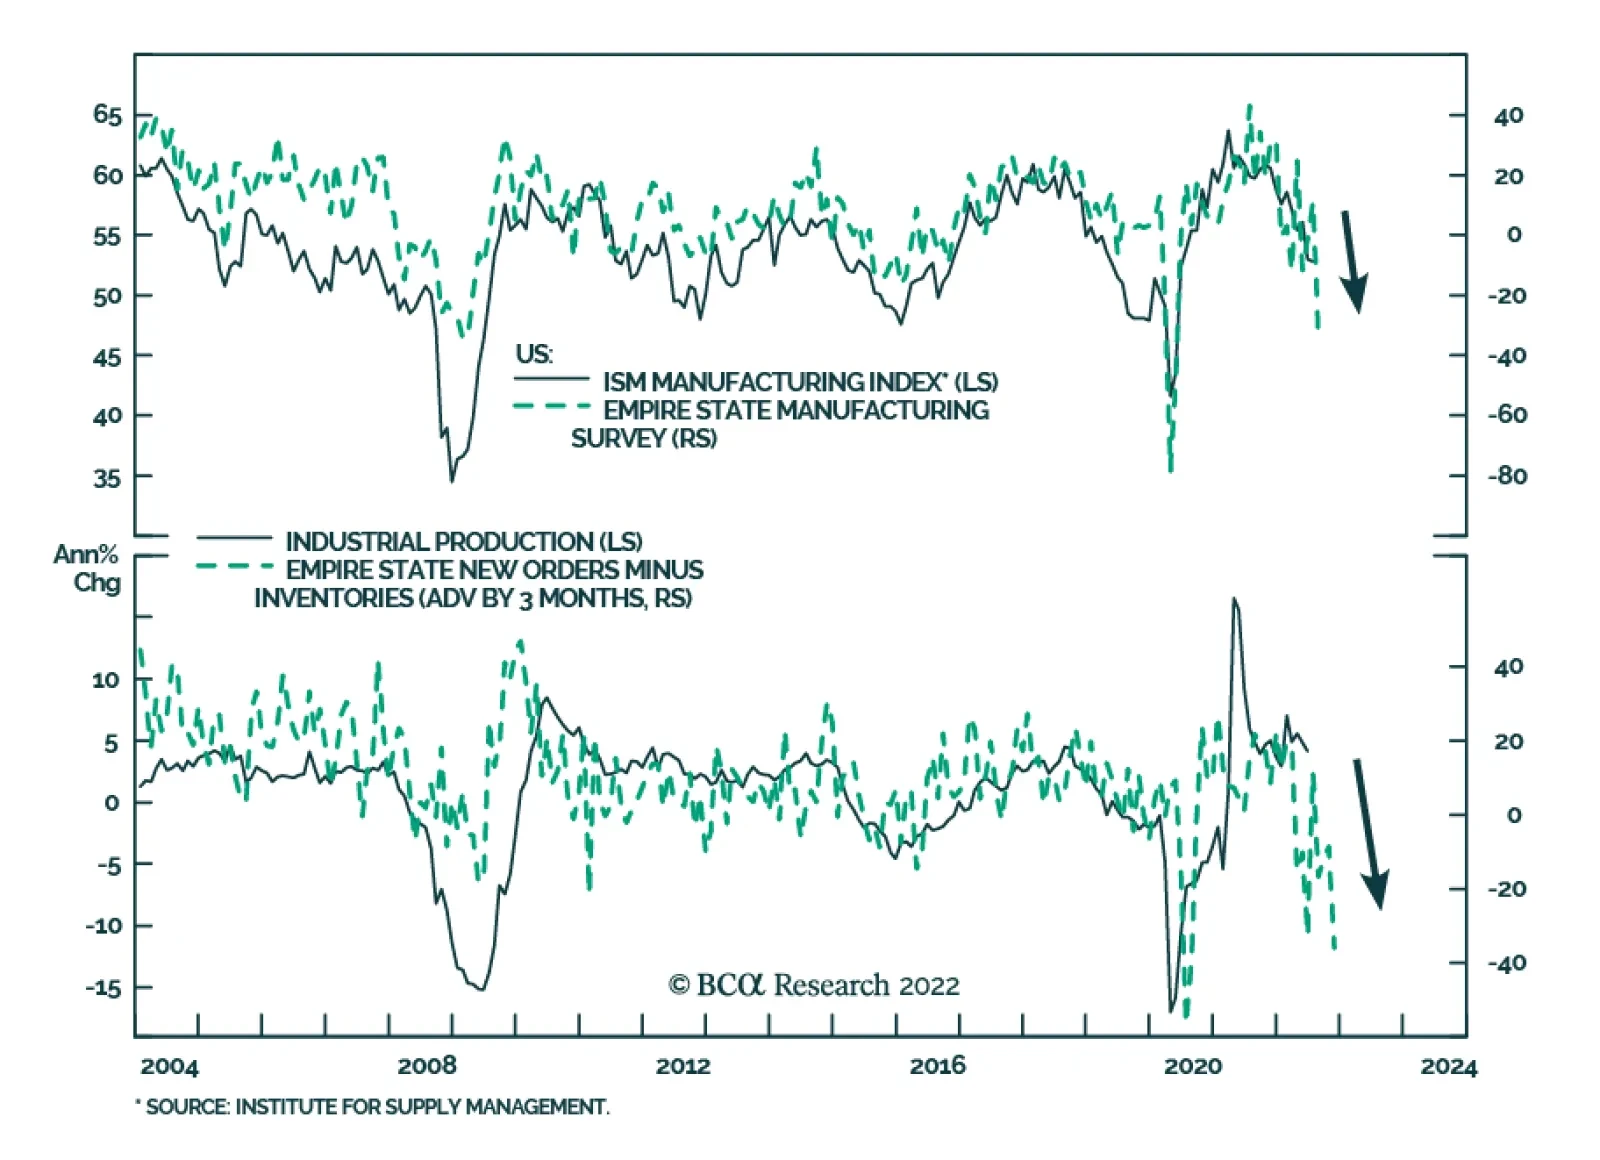
As for the bill’s green subsidies, EVs account for about 5.6% of cars sold. Subsidies will encourage the production of EVs and accelerate the growth of EV market share. The point is to make EV prices competitive with other cars since EVs are more costly to make, especially if they are to be made domestically. Non-EVs may have to lower their prices but, as we have seen, car inflation is not a major contributor to general inflation, at least not in normal times. Of course, no electric vehicles will qualify for the new rebate immediately. The law requires a large share of qualifying electric cars to be manufactured in North America, or at least not to be produced in “countries of concern” such as China. China is still the leader in making critical components of EVs, especially batteries. Such policies are not conducive to the most efficient manufacturing methods and lowest consumer prices. Rather they seek to shift supply chains to allied countries or to “onshore” them within the United States for strategic reasons, even at a higher cost to consumers. As such the new law reflects the US’s newfound populism, economic nationalism, industrial policy, and trade protectionism. It epitomizes the connection between great power competition and hypo-globalization, prioritizing supply chain resilience at the expense of economic efficiency. That makes sense from a national security point of view but is not likely to be disinflationary – quite the opposite. The bipartisan Chips and Science Act will dovetail with these measures to revive US industrial policy, steer capital into priority projects, and encourage domestic investment. This law and the climate change subsidies are federal investments that should boost productivity and enhance the supply side of the economy. We are optimistic over the long run regarding the productivity enhancements that could accrue from the government’s historic shift to re-initiate these kinds of investments. The space program in the 1960s may be too optimistic but it is still analogous. The US is already in the midst of Cold War II. If a major breakthrough in renewable energy eventually occurs that is tied to investments from the Inflation Reduction Act, then it will justify the bill’s anti-inflation moniker. But that remains to be seen. In the meantime, these investments will quicken US economic activity when the economy is already at full employment and inflation is running hot. Bottom Line: Cars do not contribute much to inflation in normal times and this bill gives subsidies to make electric cars in the US, which is not optimal for costs. Drugs contribute positively to inflation but Medicare caps will not lower drug prices until 2027 and general price effects are debatable. Overall, social unrest and great power competition are leading to greater government involvement in the economy, which is marginally inflationary. Economic Slowdown Is Disinflationary What will be the effect of this legislation on the midterm election campaign? Economic sentiment improved over the past month, even among Republicans. That led to a drop in polarization for the right reasons, i.e. a resilient economy, rather than the wrong reasons, i.e. the universal loathing of inflation (Chart 9). Polarization will stay near peak levels during the 2022-24 election campaign but the bipartisan Chips Act, the Biden administration’s adoption of hawkish foreign policy on trade and China, and the administration’s attempt to pursue at least a deficit-neutral approach to the budget reinforce our “Peak Polarization” theme. Long-term US policy consensus is developing beneath the still extreme polarization in the short term. Business activity is improving, which has contributed to the equity rally on the basis that the Fed is achieving a “soft landing” (Chart 10). We expect a hard landing due to the combination of negative macro and geopolitical factors but the latest data brings a positive surprise. Chart 9Economic Sentiment Ticks Up ... Even Among Republicans
Economic Sentiment Ticks Up ... Even Among Republicans
Economic Sentiment Ticks Up ... Even Among Republicans
Chart 10Business Activity Improves
Business Activity Improves
Business Activity Improves
In the short term, Biden and the Democrats will benefit from passing legislation (“getting things done”) and piggybacking on the fact that inflation is rolling over and the economy is showing some positive surprises. Biden’s approval rating is showing signs of stabilizing, albeit at a low level (Chart 11). The two parties are neck and neck in congressional ballot, with Democrats taking back the lead again from Republicans (Chart 12). If this trend continues it will mitigate the Democrats’ losses in the midterms. The Senate is competitive. Chart 11Biden’s Approval Will Perk Up At Least Somewhat
No, The Inflation Reduction Act Will Not Reduce Inflation
No, The Inflation Reduction Act Will Not Reduce Inflation
Chart 12US Parties Neck And Neck In Generic Congressional Ballot
No, The Inflation Reduction Act Will Not Reduce Inflation
No, The Inflation Reduction Act Will Not Reduce Inflation
If inflation rolls over, real wages will improve, which will boost consumer confidence and, if it comes by October, could help the Democrats further (Chart 13). Chart 13Uptick In Real Wage Would Boost Consumer Confidence
Uptick In Real Wage Would Boost Consumer Confidence
Uptick In Real Wage Would Boost Consumer Confidence
Still, Democrats are likely to lose the House of Representatives in the midterms, as the ruling party usually loses seats and Democrats only have a five-seat margin. In other words, we would fade the emerging “Blue Sweep” risk (i.e. risk that Democrats keep control of both houses of Congress). A sweep is possible but unlikely, especially because many of Biden’s foreign policy problems can still come back to haunt him before the midterm. Two consecutive quarters of negative GDP growth usually results in an official recession. The jury is still out. Bankruptcies are ticking up and unemployment has nowhere to go but up (Chart 14). The stagflationary environment will probably persist through the midterm. Biden will face a rocky road to re-election. Chart 14Yet Unemployment And Bankruptcy Will Rise
Yet Unemployment And Bankruptcy Will Rise
Yet Unemployment And Bankruptcy Will Rise
Investment Takeaways Inflation expectations began to roll over due to the global slowdown, the drop in commodity prices, and the Fed’s rate hikes, but structural factors suggest inflation will remain a problem over the long run. The Inflation Reduction Act will not be implemented in time to have any effect on prices in 2022. It will slightly reduce the budget deficit next year but expand the deficit from FY2024-27. Combined with the Chips and Science Act the effect is slightly stimulative or inflationary until FY2028 at earliest. The bill increases policy uncertainty ahead of the midterms. Democrats will be able to take credit for any moderation of inflation through October and hence the election will become more competitive. But the election outcome is still highly likely to be congressional gridlock. Gridlock is disinflationary in 2023-24 because it implies that fiscal policy will shift to neutral – or even that real deficit reduction will occur if Biden compromises with a partially or wholly Republican congress. Structurally the US suffers from an imbalance of savings and investment. The global savings glut more than filled the gap and prevented inflation for several decades. Now the society is aging, the savings glut is depleting, globalization is retreating, and governments need to maintain spending to address high domestic and foreign challenges. US policy is forming a new consensus (“Peak Polarization”) that includes a larger role for government within the US context (“Limited Big Government”) in order to fight against social instability and geopolitical threats. The result is inflationary or at least not disinflationary. A high-tech and/or green energy productivity boom is possible and would combat the structural drivers of inflation. We are optimistic but the disinflationary impact is not forthcoming immediately and much remains to be seen. Matt Gertken Senior Vice President Chief US Political Strategist mattg@bcaresearch.com Jesse Anak Kuri Associate Editor jesse.kuri@bcaresearch.com Footnotes 1 Specifically we argued that the bill would be “mildly stimulating for the economy (i.e. inflationary) and none of the supply-side improvements would reduce inflation in time for the midterms.” We also implied that the act would probably not correct the US’s long-term rise in budget deficits as a share of GDP. 2 The difference has to do with the Affordable Care Act (Obamacare). Obamacare subsidies were expanded during the pandemic. The reconciliation bill will spend about $100 billion on extending the subsidies by three years. But it will be politically difficult for future congresses to revoke these subsidies. Hence the CBO assumes they will become permanent. Strategic View Open Tactical Positions (0-6 Months) Open Cyclical Recommendations (6-18 Months) Table A2Political Risk Matrix
No, The Inflation Reduction Act Will Not Reduce Inflation
No, The Inflation Reduction Act Will Not Reduce Inflation
Table A3US Political Capital Index
No, The Inflation Reduction Act Will Not Reduce Inflation
No, The Inflation Reduction Act Will Not Reduce Inflation
Chart A1Presidential Election Model
Third Quarter US Political Outlook: Last Ditch Effort
Third Quarter US Political Outlook: Last Ditch Effort
Chart A2Senate Election Model
Third Quarter US Political Outlook: Last Ditch Effort
Third Quarter US Political Outlook: Last Ditch Effort
Table A4House Election Model
Biden's Midterm Tactics Bear Fruit… But There's A Snake
Biden's Midterm Tactics Bear Fruit… But There's A Snake
Table A5APolitical Capital: White House And Congress
No, The Inflation Reduction Act Will Not Reduce Inflation
No, The Inflation Reduction Act Will Not Reduce Inflation
Table A5BPolitical Capital: Household And Business Sentiment
No, The Inflation Reduction Act Will Not Reduce Inflation
No, The Inflation Reduction Act Will Not Reduce Inflation
Table A5CPolitical Capital: The Economy And Markets
No, The Inflation Reduction Act Will Not Reduce Inflation
No, The Inflation Reduction Act Will Not Reduce Inflation
Executive Summary Then And Now
Then And Now
Then And Now
Investors are fixated on inflation; for now, the peak in US CPI is a positive for global stocks. However, this tailwind could easily transform into fear if inflation becomes deflation. The risk of deflation is greater than investors currently appreciate. In the early 1920s, the policy-driven inflation of World War One quickly morphed into a violent deflationary shock, which prompted a severe bear market. Even in the absence of the gold standard, many contemporary factors parallel those that were apparent before 1921. As a result, if commodity prices do not stabilize by year-end, investors will start to worry about deflation. This fear could prompt another sell-off in stocks, which would be particularly painful in Europe. Buy protection against deflation while it is cheap by selling EUR/JPY. Continue to favor defensive over cyclical equities. Bottom Line: The deflation risk for 2023 is greater than the investment community currently appreciates. While it remains a tail risk, it is an underpriced one. As a result, investors should use the current rebound in stocks to buy protection against deflation. Last week, the NASDAQ entered a new bull market following a decline in US inflation. European stocks have rallied too, albeit considerably less so, only rising 12.5% since their July 5th low. We have participated in this rally, having taken a more constructive view on European equities and other risk assets since our return from a trip visiting clients in Europe. Related Report European Investment StrategyQuestions From The Road The decline in US inflation is likely to remain a tailwind for global equities in the near future. The pandemic-related factors that spiked inflation in the past quarters are ebbing, and commodity inflation is decreasing. However, BCA’s US bond strategists expect this window to be short-lived. Labor market tightness and strong rents suggest that core CPI will stabilize around 4%. Nonetheless, as long as this window is open, stocks should remain bid. Investors expecting the demise of this current rebound continue to pin their view on stubborn inflation. While sticky inflation is an undeniable risk, it is a threat well understood by the market. However, another danger lurks, which is much less appreciated by investors: deflation. Investors currently underestimate its odds, when deflation could prove even more damaging to the market than sticky inflation. Remembering 1921 Chart 1The 1921 Bear Market
The 1921 Bear Market
The 1921 Bear Market
The most famous period of deflation in US economic history is the Great Depression. This is not, however, an appropriate parallel. The 1921 recession, at which time deflation hit a historical low of 16% per annum, is the more direct potential equivalent to today. It was accompanied by a 47% crash in the market that brought the Shiller P/E to five (Chart 1, top panel). At the end of WWI, the stock market experienced a rapid rally, with the Dow Jones jumping 58% from its low in March 1918 to its peak in November 1919. In that time frame, inflation was robust, with headline CPI averaging 16% between 1917 and 1920. Inflation was high because of a combination of factors: The war had forced a substantial loosening of fiscal policy with the Federal debt rising from 2.7% of GDP in 1916, before the entry of the US in the conflict, to 32.9% in 1921. The money supply experienced an unprecedented surge. At the beginning of the war, the US was a neutral party and European powers purchased large quantities of US goods. The resulting trade surplus pushed the US stock of gold from $1.5bn in 1914 to $2.6bn in 1920. Meanwhile, to help finance the government’s wartime expenditures, the newly created Federal Reserve expanded its banknote issuance and its claims on the banking system, which meant that Fed money rose from 21% of high-power money in April 1917 to 59% by November 1918. As a result of these two concurrent trends, the money supply doubled between 1916 and June 1920. The Fed was slow to remove the accommodation. The New York discount rate, which had fallen from 6% to 4% as war broke out in Europe, was only increased to 4.75% in the Spring of 1918 and stayed there until January 1920. The global economy was facing potent supply constraints. Large swaths of the European capital stock had been destroyed by the war, at the same time as the US economy had been redesigned to supply military goods, not consumer goods. As a result, inflation remained perky in 1919 and 1920, despite the end of the conflict. The fiscal and monetary supports suddenly ended in 1920, and the economy entered a vicious contraction that caused industrial production to plunge by 36% in 1921 and deflation to hit 16% (Chart 1, second and third panel). The fiscal easing suddenly shifted toward fiscal rectitude under the administration of Warren Harding, which greatly hurt domestic demand in 1921. Additionally, the inflow of gold from the war period morphed into outflow, as European powers enjoyed trade surpluses after their currencies fell 60% to 30% against the dollar between 1919 and the start of 1921. Moreover, the Fed increased the discount rate to 6% in 1920 and cut back the ratio of Fed money to gold, which caused M2 to swing from a 20% growth annual growth rate in Q1 1920 to a 7% contraction in Q3 1921. Simultaneously, corporate borrowing rates soared (Chart 1, fourth and fifth panel) The shock of stagflation and the associated deep output contraction caused the Dow Jones to collapse by 47% from late 1919 to August 1921. The market only stabilized once deflationary pressures ebbed, after the Fed had cut back the discount rate to 6% and around the same time when commodity prices began to firm up. By the end of the bear market, the reconstituted S&P 500 was trading at a cyclically-adjusted P/E of 5.2, and profits had fallen 81% from their 1916 peak. Bottom Line: The 1921 bear market was one of the most violent of the twentieth century. It was caused by an economic contraction and deep deflation that engulfed the US economy after the monetary and fiscal support of WWI had been removed. It only ended once deflationary forces began to ebb, after commodity prices found a floor. What Are The Parallels? At first glance, the parallels between 1921 and today seem negligible. Yes, inflation was raging in 1920, but deflation was a direct consequence of the gold standard that forced a rapid contraction in high-powered money, especially as gold fled the US in 1921. Chart 2Inflationary Fiscal And Monetary Policy
Inflationary Fiscal And Monetary Policy
Inflationary Fiscal And Monetary Policy
The similarities, however, are remarkable too. As a result of the COVID-19 pandemic, the economy was subjected to similar conditions as that of the US around WWI. The US economy witnessed a massive explosion of fiscal stimulus that pushed the Federal deficit from 5% in 2019, to 10% and 6% of GDP in 2020 and 2021, respectively. Moreover, the Federal Reserve generated extremely accommodative monetary conditions during and after the pandemic, when its balance sheet more than doubled and M2 grew by 41% (Chart 2). Additionally, the global economy has witnessed extraordinary supply-side disruptions that have added to inflationary pressures created by the extreme push to aggregate demand from fiscal and monetary policy.1 Chart 3The Money Supply Is Contracting
The Money Supply Is Contracting
The Money Supply Is Contracting
However, as in 1921, these forces are moving in the opposite direction. The fiscal thrust in the US was deeply negative in 2021 and 2022, when fiscal policy subtracted 4% and 2% from GDP growth, respectively. Moreover, the Fed’s policy tightening campaign is exceptionally aggressive. The Fed has increased rates by 2.25% in five months, and, based on the OIS curve, will push up interest rates by an additional 1.3% by the year-end (Chart 3). As a result, the recent contraction in M2 has further to run, even if the US economy is not constrained by its golden tethers (Chart 3, bottom panel). Between 1920 and 1921, investors had trouble judging how far the Fed would tolerate money contraction, which is again the case. Chart 4The Dollar Is Deflationary
The Dollar Is Deflationary
The Dollar Is Deflationary
While the gold standard has been dissolved, the recent wave of dollar strength creates deflationary forces that are similar to the bullion anchor in the 1920s. In the US, the strength in the dollar is limiting imported inflation. US import prices have rolled over, a trend likely to continue. Once converted in USD, Chinese PPI is almost contracting today, which is no small matter when China is the marginal supplier of goods for the world (Chart 4). A strong dollar is deflationary for the global economy, not just that of the US. A rising greenback hurts commodity prices and also tightens global liquidity conditions. Already, the dollar-based liquidity is contracting and EM FX reserves – which are a form of high-powered money similar to gold flows in the 1920s – are tanking, even after adjusting for the confiscation of Russian reserves in the wake of the Ukrainian conflict (Chart 4, bottom panel). To defend their currencies as the dollar rallies, EM central banks are forced to tighten policy, which hurts their domestic economies. This phenomenon is also visible in advanced economies. The weak euro has played a role inching the ECB toward aggressive rate hikes, while the Riksbank and the Swiss National Bank are both lifting interest rates to fight the inflationary impact of their currencies falling against the greenback. Global supply constraints are also defusing. The price of shipping commodities and goods around the world is declining meaningfully (Chart 5). Meanwhile, deliveries by suppliers are accelerating globally, which is contributing to a very rapid easing of our indicator of US Supply Constraints (Chart 5, bottom panel). Beyond these parallels with the early 1920s, demand is already weakening globally. Hampered by the current rise in living costs, households have begun to reduce the volume of goods they purchase, while companies have maintained robust production schedules. As a result, inventories are swelling around the world (Chart 6). Historically, the best cure for elevated inventories is lower prices. Chart 5Easing Supply Constraints
Easing Supply Constraints
Easing Supply Constraints
Chart 6Inventories And Weak Demand Are Deflationary
Inventories And Weak Demand Are Deflationary
Inventories And Weak Demand Are Deflationary
Bottom Line: There is no guarantee that deflation will become the prevailing force in the global economy. However, the risk is there—and this threat is woefully underappreciated by the investment community. At this current juncture, investors are welcoming lower commodity prices as they take the edge off ebullient inflation. However, if commodity prices do not stabilize by year-end, then investors will begin to worry about deflation. As the 1921 experience showed, deflation is very painful for stocks because it is so negative for profits. While the absence of the gold standard means that the deep deflation of 1921 is extremely unlikely, a period of deflation would nonetheless have a very negative impact on stocks, since they trade at 29 times cyclically-adjusted earnings, not 6.2 times, as was the case in November 1919. What Does This Mean For European Assets? A bout of global deflation would be especially painful for European equities. European equities are more cyclical than their US counterparts, which means that they often underperform when global growth is weak and global export prices of manufactured goods are falling (Chart 7). In other words, a deflationary shock in the US would be felt more acutely in the European market than in that of the US. Additionally, the euro would likely weaken further. Already, the European money impulse (the change in M1 flows) is contracting, which augurs poorly for European economic activity (Chart 8). The addition of a deflationary shock to the weak domestic backdrop would prompt further outflows from Europe, which would hurt the euro even more. Chart 7European Stocks Hate Deflationary Busts
European Stocks Hate Deflationary Busts
European Stocks Hate Deflationary Busts
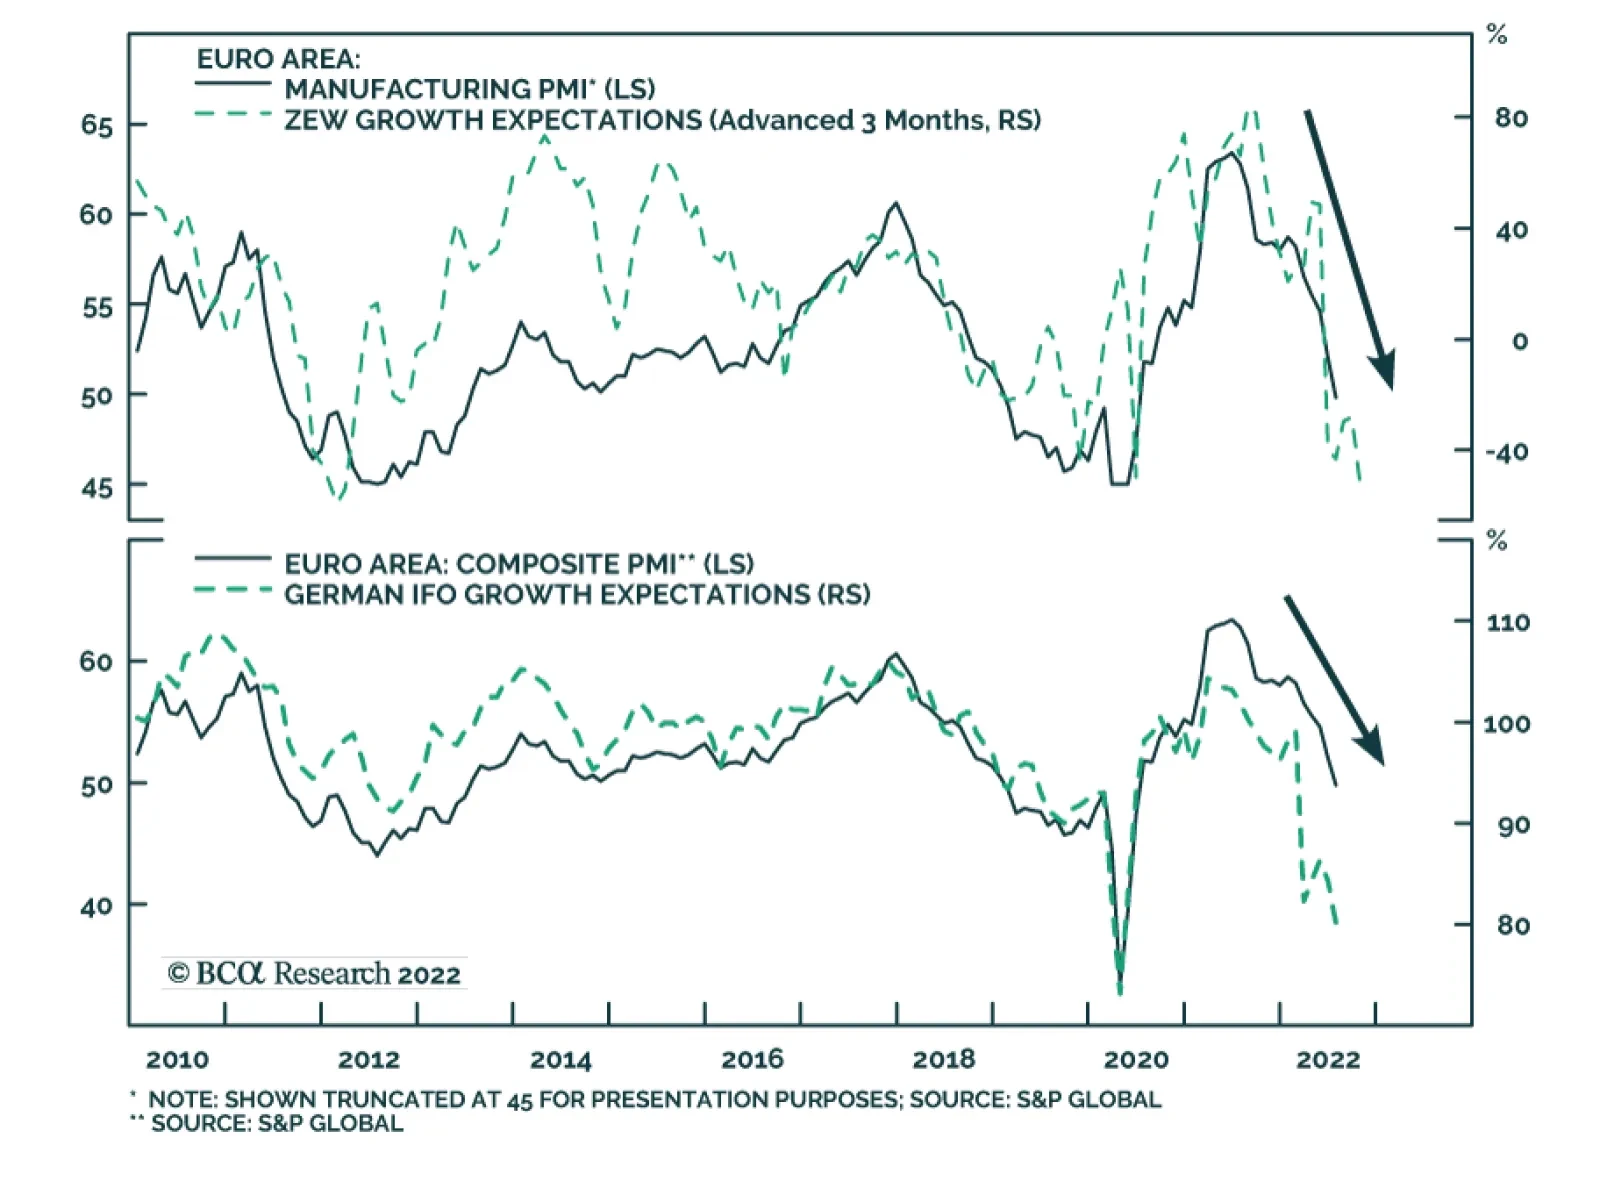
Chart 8European Activity Is Weak
European Activity Is Weak
European Activity Is Weak
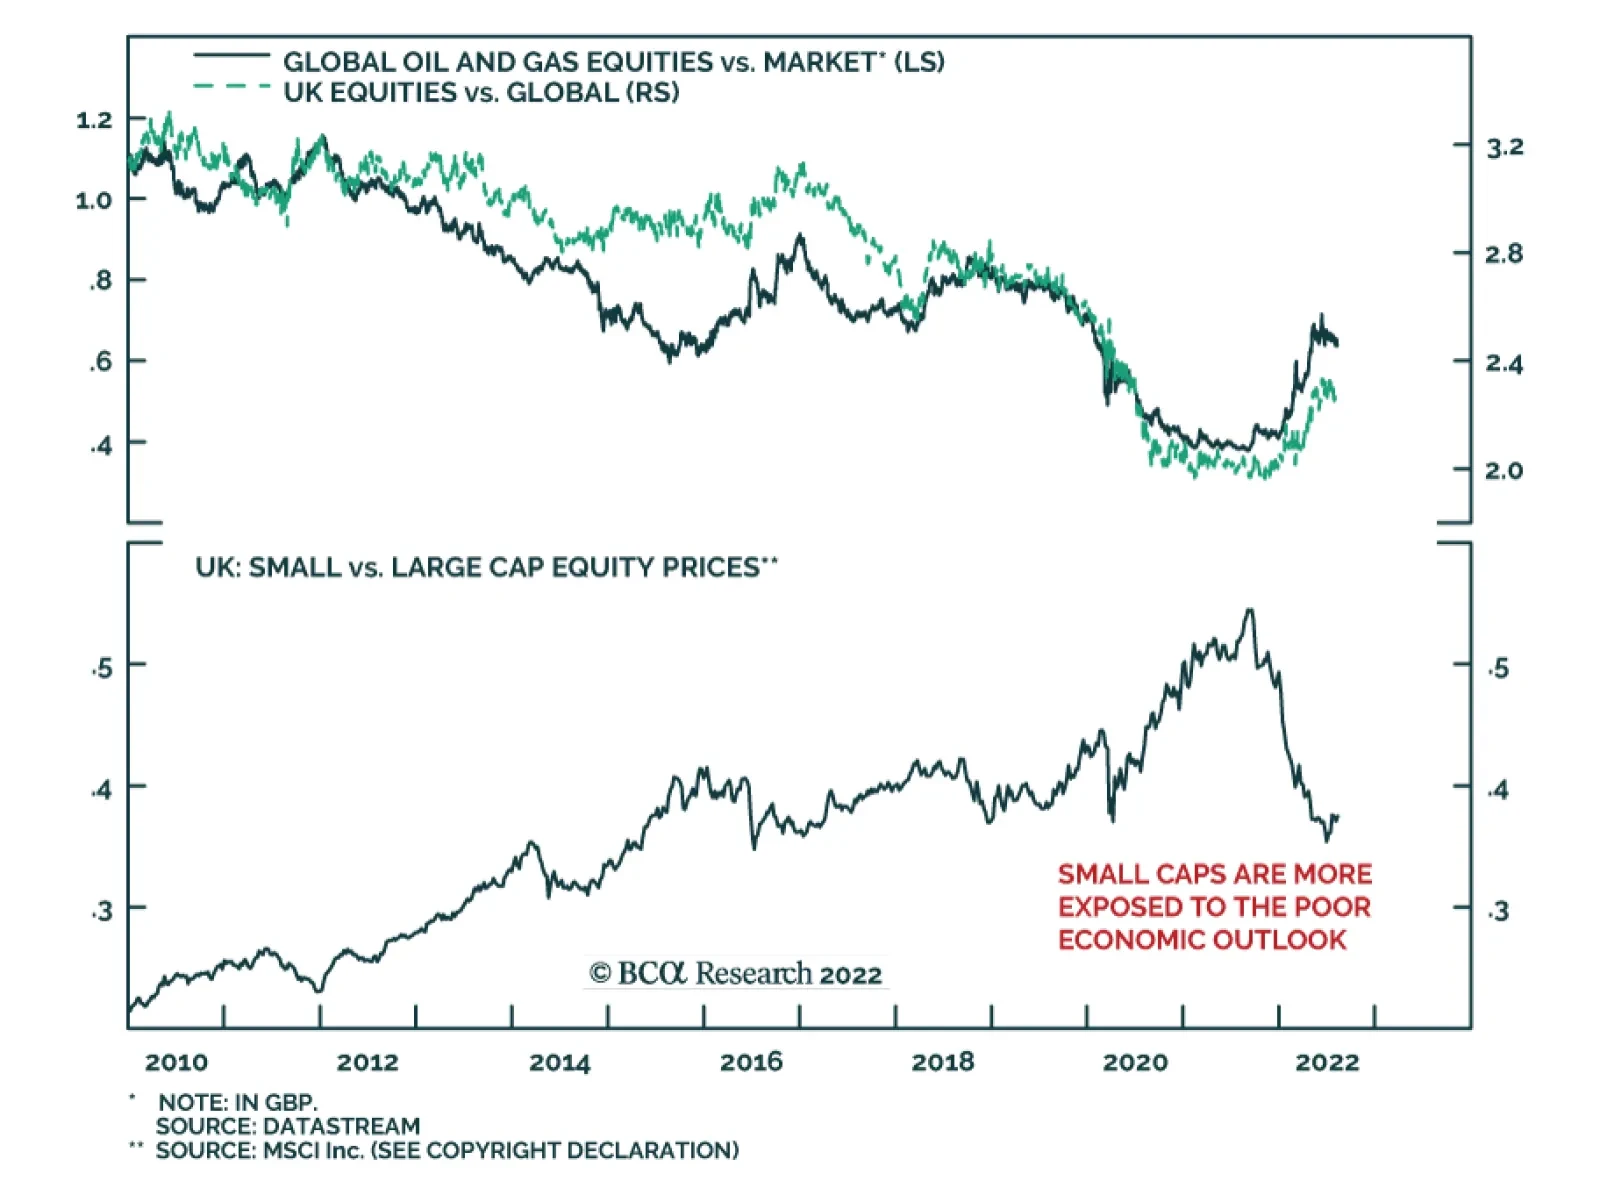
Chart 9A Value Trap?
A Value Trap?
A Value Trap?
Finally, with respect to the European cyclicals-to-defensive ratio, our Combined Mechanical Valuation Indicator suggests that European cyclicals have purged their overvaluation relative to their defensive counterparts (Chart 9). However, in previous deflationary outbreaks such as those in 1921 or the 1930s, cyclicals deeply underperformed defensive equities, no matter how cheap they became. This time around, we would expect the same outcome from cyclicals. Moreover, even if investors do not price in a deflationary risk early next year, European cyclicals remain hampered by the deceleration in the Chinese economy and the energy rationing that will hit Europe this winter. As a result, we continue to fade any rebound in the European cyclicals-to-defensives ratio. Bottom Line: Even if a deflationary shock is a risk that is more likely to emanate from the US, European markets will not be immune. The European economy is already weak, and the cyclicality of European equities creates greater vulnerability to deflation. Thus, while deflation in 2023 is a tail risk, investors should use the current rebound in global risk assets to buy protection cheaply. Selling EUR/JPY and favoring defensive European markets continue to make sense in light of this risk. Mathieu Savary, Chief European Strategist Mathieu@bcaresearch.com Footnotes 1Another similarity is that the Spanish Flu was decimating the population from late WWI to 1921. Tactical Recommendations Cyclical Recommendations Structural Recommendations
Eurozone industrial production surprised to the upside, expanding by 0.7% m/m in June versus an anticipated 0.2% m/m rise. Moreover, IP growth in May was revised up from 0.8% m/m to 2.1% m/m. Do these better-than-expected figures suggest that…
Economic conditions are deteriorating in the UK. The preliminary Q2 GDP release estimates that growth contracted by 0.1% q/q following the 0.8% q/q expansion in Q1. The cost of living crisis is weighing down heavily on households’ purchasing power, leading to…