Developed Countries
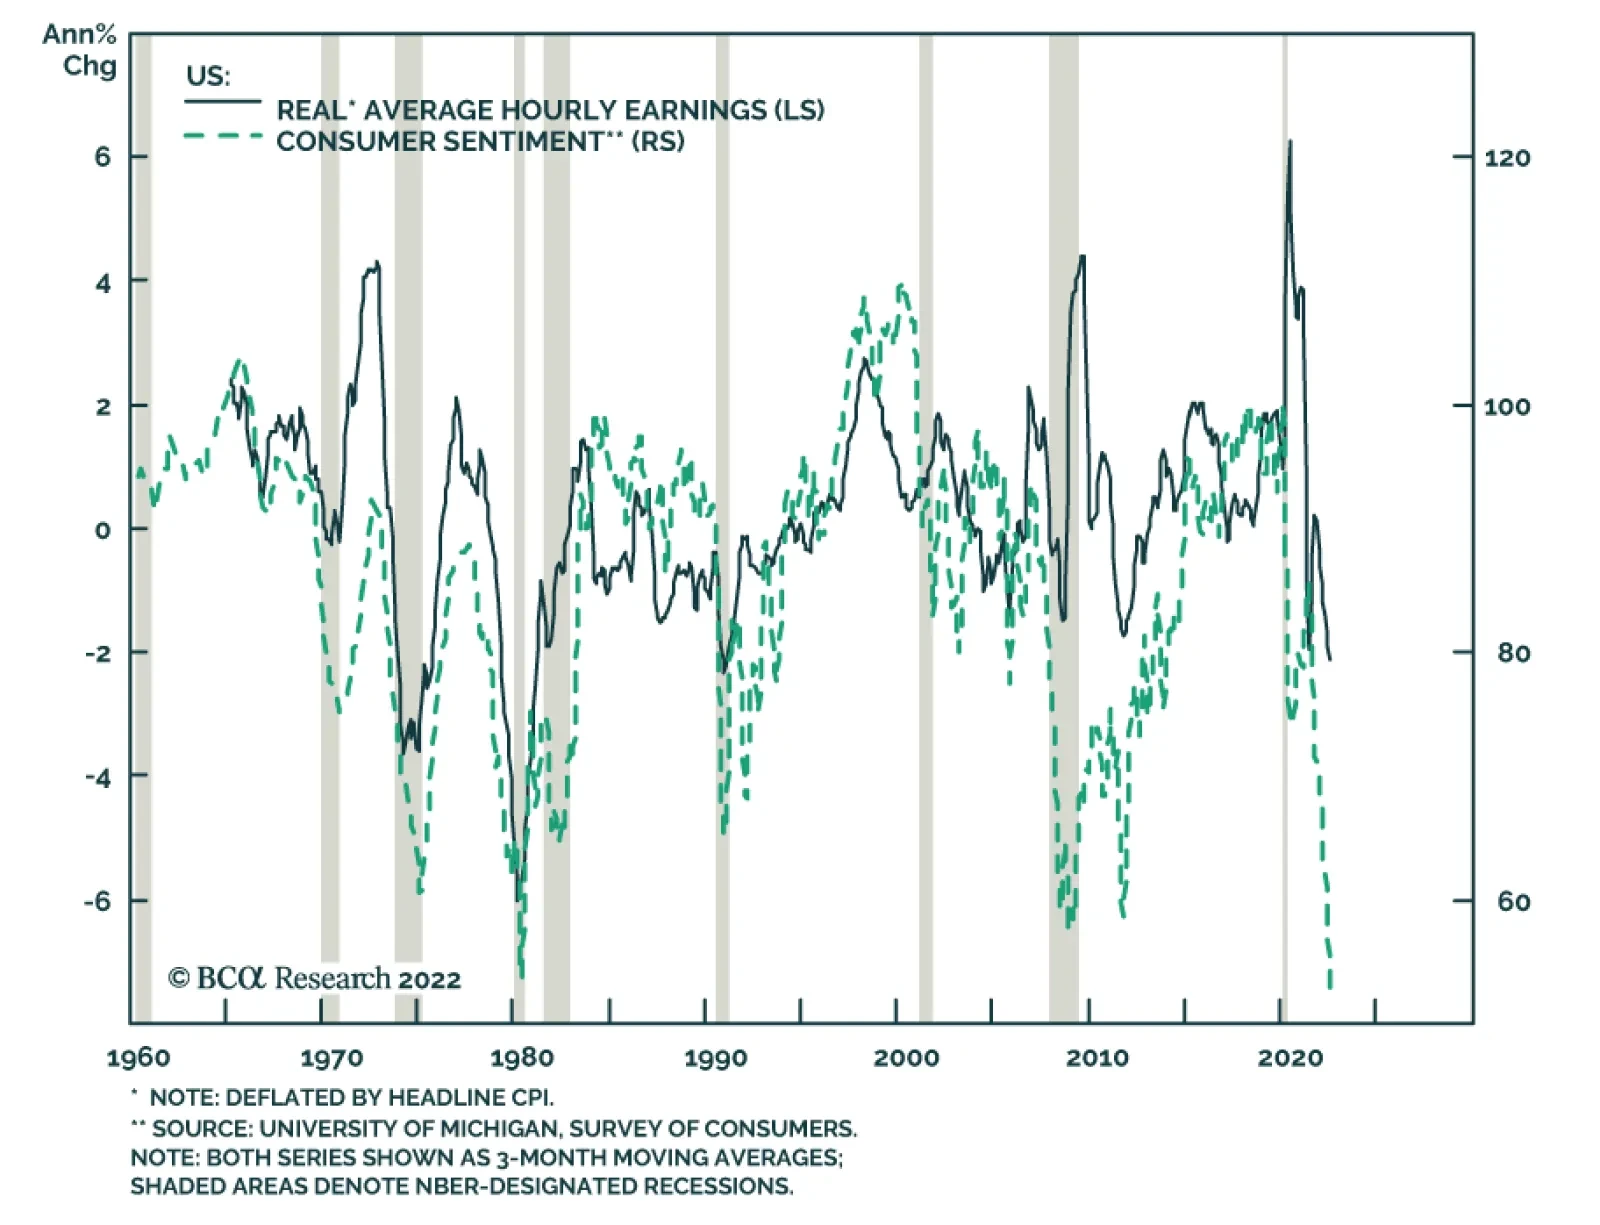
US consumer sentiment improved slightly in August, according to the preliminary release of the University of Michigan survey results. Although the Current Conditions index slid 2.6 points to 55.5, Expectations rebounded by 7.6 points to 54.9 –…

Listen to a short summary of this report. Executive Summary Chart 1The Dollar Has Broken Below The First Line Of Support
The Dollar Has Broken Before The First Line Of Support
The Dollar Has Broken Before The First Line Of Support
The softer CPI print in the US boosted growth plays and pushed the DXY index below its 50-day moving average (Feature Chart). This suggests CPI numbers will remain the most important print for currency markets in the coming weeks and months. If US inflation has peaked, then the market will price a less aggressive path for Fed interest rates, which will loosen support for the dollar. At the same time, other G10 central banks are still seeing accelerating inflation. This will keep them on a tightening path. This puts the DXY in a tug of war. On the downside, the Fed could turn less hawkish. On the other hand, currencies such as the EUR, GBP and even SEK face high inflation but deteriorating growth. This will depress real rates. Within this context, the most attractive currencies are those with relatively higher real rates, and a real prospect of a turnaround in growth. NOK and AUD stand out as potential candidates. Our short EUR/JPY trade has been performing well in this context. Stick with it. RECOMMENDATIONS INCEPTION LEVEL inception date RETURN Short EUR/JPY 141.20 2022-07-21 3.29 Bottom Line: Our recommended strategy is a neutral dollar view over the next three months, until it becomes clear inflation has peaked and global growth has bottomed. Feature The DXY index peaked at 108.64 on July 14 and has dropped to 105.1 as we go to press. There have been two critical drivers of this move. First, the 10-year US Treasury yield has fallen from 3.5% to 2.8%. With this week’s all important CPI release, which showed a sharp deceleration in the headline measure, bond yields may well stabilize at current levels for a while. Second, the drop in energy prices has boosted the JPY, SEK and EUR, which are heavily dependent on imported energy. Related Report Foreign Exchange StrategyA Montreal Conversation On FX Markets Another development has been happening in parallel – as US inflation upside surprises have crested, so has the US price impulse relative to its G10 counterparts (Chart 1). To the extent that this eases market pricing of a hawkish Fed (relative to other G10 central banks), it will continue to diminish upward pressure on the dollar. Much will depend on the incoming inflation prints both in the US, and abroad. With the DXY having broken below its 50-day moving average, the next support level is at 103.6. This is where the 100-day moving average lies, which the dollar tested twice this year before eventually bouncing higher (Chart 2). The next few sections cover the important data releases over the last month in our universe of G10 countries, and implications for currency strategy. What is clear is that most foreign central banks are committed to their tightening campaign, which argues for a neutral stance towards the DXY for now. Chart 1US Inflation Momentum Has Rolled Over
US Inflation Momentum Has Rolled Over
US Inflation Momentum Has Rolled Over
Chart 2The Dollar Has Broken Below The First Line Of Support
The Dollar Has Broken Below The First Line Of Support
The Dollar Has Broken Below The First Line Of Support
US Dollar: Consolidation Chart 3The Conditions For A Fed Hike Remain In Place
The Conditions For A Fed Hike Remain In Place
The Conditions For A Fed Hike Remain In Place
The dollar DXY index is up 10% year to date. Over the last month, the DXY index is down 2.1% (panel 1). Incoming data continues to make the case for a strong dollar. Job gains are robust. In June, the US added 372K jobs. The July release was even stronger at 528K jobs. This pushed the unemployment rate to a low of 3.5% (panel 2). Wages continue to soar. Average hourly earnings came in at 5.2% year-on-year in July. The Atlanta Fed wage growth tracker continues to edge higher across all income cohorts (panel 3). The June CPI print was above expectations at 9.1% for headline, with core at 5.9%. The July print for headline that came out this week was 8.5%, below expectations of 8.7%. At 5.9%, the core measure is still well above the Fed’s target (panel 4). June retail sales remained firm, but consumer sentiment continues to weaken. While the University of Michigan current conditions index increase from 53.8 to 58.1 in June, this is well below the January 2020 level of 115. Correspondingly, the Conference Board consumer confidence index fell from 98.7 to 95.7 in July. On June 17, the Fed increased interest rates by 75bps, as expected. The US entered a second consecutive quarter of GDP growth contraction in Q2, falling by an annualized 0.9%. The ISM manufacturing index was flat in July suggesting Q3 GDP is not starting on a particularly strong foot. The Atlanta Fed Q3 GDP growth tracker is, however, printing 2.5%. Unit labor costs are soaring, rising 10.8% in Q2. This is sapping productivity growth, which fell 4.6% in Q2. The key for the dollar’s outlook is the evolution of US inflation and the labor market. For now, inflation remains sticky, and wages are rising. Meanwhile, labor market conditions remain robust. This will keep the Fed on a tightening path in the near term. We initially went short the DXY index but were stopped out. We remain neutral in the short term, though valuation keeps us bearish over a long-term horizon. The Euro: A European Hard Landing Chart 4The Euro Is At Recession Lows
The Euro Is At Recession Lows
The Euro Is At Recession Lows
The euro is down 9.2% year to date. Over the last month, the euro is up 2.7%, having faced support a nudge below parity. Incoming data continues to suggest weak economic conditions, with a stagflationary undertone: The ZEW Expectations Survey for July was at -51.1, the lowest reading since 2011 (panel 1). The current account remains in a deficit, at -€4.5bn in May. Consumer confidence continues to plunge. The July reading of -27 is the worst since the 2020 Covid-19 crisis (panel 2). Despite the above data releases, the ECB surprised markets by raising rates 50bps. CPI continues to surprise to the upside. The preliminary CPI print for July came in at 8.9%, well above the previous 8.6% print. PPI in the euro area was at 35.8% in June, a slight decline from the May reading (panel 3). The German Ifo business expectations index fell to 80.3 in July. Historically, that has been consistent with a manufacturing PMI reading of 45 (panel 4). The Sentix confidence index stabilized in August but remains very weak at -25.2. This series tends to be trending, having peaked in July last year. We will see if the next few months continue to show stabilization. The ECB mandate dictates that it will continue to fight soaring inflation. As such, it may have no choice but to generate a Eurozone-wide recession. This is the key risk for the euro since it could push EUR/USD below parity again. We continue to sell the EUR/JPY cross. In a risk-off environment, EUR/JPY will collapse. In a risk-on environment, like this week, the yen can still benefit since it is oversold. Meanwhile, investors remain overwhelmingly bearish (panel 5). The Japanese Yen: Quite A Hefty Rally Chart 5Some Green Shoots In Japan
Some Green Shoots In Japan
Some Green Shoots In Japan
The Japanese yen is down 13.4% year-to-date, the worst performing G10 currency (panel 1). Over the last month, the yen is up 3.3%. Incoming data in Japan has been worsening as the rising number of Covid-19 cases is hitting mobility and economic data. According to the Eco Watcher’s survey, sentiment among small and medium-sized Japanese firms deteriorated in July. Current conditions fell from 52.9 to 43.8. The outlook component also declined from 47.6 to 42.8. Machine tool order momentum, one of our favorite measures of external demand, continues to slow. Peak growth was at 141.9% year-on-year in May last year. The preliminary reading from July was at 5.5% (panel 2). Labor cash earnings came in at 2.2% year-on-year, a positive sign. Household spending also rose 3.5%. Rising wages could keep inflation momentum rising in Japan (panel 3). On that note, the Tokyo CPI report for July was also encouraging, with an increase in the core-core measure from 1% to 1.2%. The Tokyo CPI tends to lead nationwide measures. The labor market remains robust. Labor demand exceeds supply by 27%. The Bank of Japan kept monetary policy on hold on July 20th, a policy move that makes sense given incoming data. The BoJ still views a large chunk of inflation in Japan as transitory. For inflation to pick up, wages need to rise. While they are rising, inflation expectations remain well anchored, suggesting little rationale for the BoJ to shift (panel 4). That said, the yen is extremely cheap after being the best short this year (panel 5). British Pound: Coiled Spring Below 1.20? Chart 6Cable Is Vulnerable
Cable Is Vulnerable
Cable Is Vulnerable
The pound is down 9.8% year to date. Over the last month, the pound is up by 2.5%. Sterling broke below a soft floor of 1.20, but quickly bounced back and is now sitting at 1.22, as sentiment picked up (panel 1). We find the UK to have an even bigger stagflation problem than the eurozone. CPI came in at 9.4% in June. The RPI came in at 11.8%. PPI was at 24%. All showed an acceleration from the month of May (panel 2). Nationwide house price inflation has barely rolled over unlike other markets, increasing from 10.7% in June to 11% in July. The Rightmove national asking price was 9.3% higher year-on-year in July, compared to 9.7% in June (panel 3). Meanwhile, mortgage approvals have been in steady decline over the last two years, which points toward stagflation. Retail sales excluding auto and fuel fell 5.9% year-on-year in June, the weakest reading since the Covid-19 crisis. Consumer confidence is lower than in 2020 (panel 4). Trade data continues to be weak, which has dipped the current account towards decade lows (panel 5). The external balance is the biggest driver of the pound, given the huge deficit. The above environment has put the BoE in a stagflationary quagmire. Last week, they raised rates by 50 bps suggesting inflation is a much more important battle than growth. Politically, the resignation of Prime Minister Boris Johnson, and broader difficulties for the Conservative Party, is fueling sterling volatility. We are maintaining our long EUR/GBP trade as a bet that at 1.03, the euro has priced in a recession (well below the 2020 lows), but sterling has not. On cable, 1.20 will prove to be a long-term floor but it will be volatile in the short term. Australian Dollar: A Contrarian Play Chart 7Relatively Solid Domestic Conditions In Australia
Relatively Solid Domestic Conditions In Australia
Relatively Solid Domestic Conditions In Australia
The AUD is down 2.3% year-to-date. Over the last month, the AUD is up 5.3%. AUD is fast approaching its 200-day moving average. If that is breached, it could signal that the highs of this year, above 76 cents, are within striking distance (panel 1). Inflation is accelerating in Australia. In Q2, the inflation reading was 6.1%, while the trimmed-mean and weighted-median measures were above the central bank’s 1-3% band (panel 2). As a result, the RBA stated the benchmark rate was “well below” the neutral rate. It increased rates by an additional 50bps in August, lifting the official cash rate to 1.85%. Further rate increases are likely. There are a few reasons for this. First, labor market conditions are the most favorable in decades. In June, unemployment reached 3.5%, its lowest level in 50 years, against a consensus of 3.8% (panel 3). The participation rate also increased to 66.8% in June from 66.7%, which has pushed the underutilization rate to multi-decade lows (panel 4). Despite this, consumer confidence continued its decline in August, dropping to 81.2 from 83.8. A pickup in Covid-19 cases and high consumer prices are the usual suspects. Beyond the labor market, monetary policy seems to be having the desired effect. Demand appears to be slowing as retail sales grew 0.2% month-on-month in June from 0.9%. Home loan issuance declined by 4.4% in June, driven by a 6.3% decline in investment lending. House price growth continued to decline in July, particularly in densely populated regions like Sydney and Melbourne. The manufacturing sector remains strong, with July PMI coming in at 55.7, suggesting the RBA might just be achieving a soft landing in Australia. The external environment was largely favorable for the AUD in June, as the trade balance increased substantially by A$17.7bn with commodities rallying early in the month. However, commodity prices are rolling over. The price of iron for example, is down 24% from its peak in June. This will likely weigh on the trade balance going forward (panel 5). A weakening external environment are near-term headwinds for the AUD, but we will be buyers on weakness (panel 6). New Zealand Dollar: Least Preferred G10 Currency Chart 8Near-Term Risks To NZD
Near-Term Risks To NZD
Near-Term Risks To NZD
The NZD is down 6.1% this year. Over the last month, it is up 5% (panel 1). The Reserve Bank of New Zealand raised its official cash rate (OCR) in July by 50bps to 2.5%, in line with market expectations. Policymakers maintained their hawkish stance and guided towards increased tightening until monetary conditions can bring inflation within its target range of 1-3%. Inflation rose in Q2 to 7.3% from a 7.1% forecast, largely driven by rising construction and energy prices (panel 2). As of the latest data, monetary policy appears to be continuing to have the desired effect on interest rate sensitive parts of the economy. REINZ home sales declined 38.1% year-on-year in June. Home price growth continues to roll over (panel 3). The external sector continues to slow. Dairy prices, circa 20% of exports, saw a 12% drop in early August after remaining flat in July. The 12-month trailing trade balance remains in deficit. This is most likely due to a substantial slowdown in Chinese economic activity, given that China is an important trade partner with New Zealand. What is important is that the RBNZ’s “least regrets” approach seems to be working. Despite a cooling economy, sentiment seems to be stabilizing. ANZ consumer confidence improved to 81.9 in July from 80.5. Business confidence also improved to -56.7 from -62.6 (panel 4). Ultimately, the NZD is driven by terms of trade, as well as domestic conditions (panels 1 and 5). Thus, short-term headwinds from a deteriorating external sector do not make us buyers of the currency for now, though a rollover in the dollar will help the kiwi. Canadian Dollar: Lower Oil, Hawkish BoC Chart 9The BoC Will Stay On A Hawkish Path
The BoC Will Stay On A Hawkish Path
The BoC Will Stay On A Hawkish Path
The CAD is down 1.2% year to date. Over the last month, it is up 1.8%. The Canadian dollar did not fully catch up to oil prices on the upside. Now that crude is rolling over, CAD remains vulnerable, unless the dollar continues to stage a meaningful decline (panel 1). Canadian data has been rather mixed over the last month. For example: There have been two consecutive months of job losses. This is after a string of positive job reports. In July, Canada lost 31K jobs. In June, it lost 43K. The reasons have been mixed, from women dropping out of the labor force, to lower youth participation (the participation rate fell), but this is a trend worth monitoring (panel 2). CPI growth remains elevated and is accelerating both on headline and core measures(panel 3). Building permits and housing starts have started to roll over, as house price inflation continues to lose momentum. June housing starts were at 274K from 287.3K. June building permits also fell 1.5% month-on-month though annual inflation is still outpacing house price growth (panel 4). The Canadian trade balance is improving, hitting a multi-year high of C$5.05 bn in June. This has eased the need for foreign capital inflows. The BoC raised rates 100bps in July, the biggest interest rate increase in one meeting among the G10. Unless the labor market continues to soften, the BoC will continue to focus on inflation, which means more rate hikes are forthcoming. The OIS curve is pricing a peak BoC rate of 3.6% in 9 months (panel 5). Two-year real rates are still higher in the US compared to Canada. And the loonie has lost the tailwind from strong WCS oil prices. As such, unless the dollar softens further, the loonie will remain in a choppy trading pattern like most of this year. Swiss Franc: A Safe Haven Chart 10The Franc Will Remain Strong Against The Euro For Now
The Franc Will Remain Strong Against The Euro For Now
The Franc Will Remain Strong Against The Euro For Now
CHF is down 3.2% year-to-date and up 4.3% in the past month. The Swiss franc has been particular strong against the euro, with EUR/CHF breaching parity (panel 1). Switzerland remains an island of relative economic stability in the G10. Although slowing, the manufacturing PMI was a healthy 58 in July. The trade surplus was up to CHF 2.6bn in June, despite a strong franc. While most European countries are preparing for a tough winter with energy rationing, prospects for Switzerland, which derives only 13% of its electricity from natural gas, look more favorable. Still, as a small open economy, Switzerland is feeling the impact of global growth uncertainty. The KOF leading indicator dropped to 90.1 in August with a sharp decline in the manufacturing component. This broader measure suggests the relative resilience of the manufacturing sector might not last long (panel 2). Consumer confidence also fell to the lowest level since the onset of the pandemic. Swiss headline inflation stabilized at 3.4% in July. The core measure rose slightly to the SNB’s 2% target (panel 3). The UBS real estate bubble index rose sharply in Q2, suggesting inflation is not only an imported problem. Labor market conditions also remain tight, with the unemployment rate at 2%, a two-decade low. The SNB will continue to embrace currency strength while inflation risks persist (panel 4), as can be seen by the decline in sight deposits and FX reserves (panel 5). The market is still pricing in another 50 bps hike in September although August inflation data that comes out before the meeting will likely be critical for that decision. CHF is one of the most attractive currencies in our ranking. Despite the recent outperformance, CHF is still down year-to-date against the dollar. A rise in safe-haven demand, and a possible energy crunch in winter will be supportive, especially against the euro. Norwegian Krone: Oil Fields Are A Jewel Chart 11NOK Will Reap Dividends From Energy Exports
NOK Will Reap Dividends From Energy Exports
NOK Will Reap Dividends From Energy Exports
NOK is down 7.4% year-to-date and up 7.1% over the last month. It is also up 4.2% versus the euro, despite softer oil prices (panel 1). Inflation in Norway continues to accelerate. In July, CPI grew 6.8% year-on-year, above the market consensus and the Norges Bank’s forecast. Underlying inflation jumped sharply to an all-time high of 4.5%, compared to the Bank’s 3.2% forecast made just over a month ago (panel 2). These figures are adding pressure on the central bank to increase the pace of interest rate hikes, with 50bps looking increasingly likely at the meetings in August and September. NOK jumped on the inflation news. The housing market is starting to show signs of slowing with prices down 0.2% on the month in July, the first decrease since December. This, together with household indebtedness (panel 3), makes the task of policy calibration challenging. Our bias is that a persistently tight labor market and strong wage growth (panel 4) will allow the bank to focus on inflation. Economic activity remains robust in Norway but is softening. The manufacturing PMI fell to 54.6 in July, while industrial production was down 1.7% month-over-month in June. Consumer demand remains frail with retail sales and household consumption flat in June from the previous month. On a more positive note, trade surplus remains near record levels and is likely to stay elevated as high European demand for Norwegian energy is likely to last at least through the winter (panel 5). As global risk sentiment picked up, the krone became the best performing G10 currency over the past month. If the risk appetite reverses, the currency is likely to feel some turbulence. Swedish Krona: Cheap, But No Catalysts Yet Chart 12SEK = EUR On Steroids
SEK = EUR On Steroids
SEK = EUR On Steroids
SEK is down 10% year-to-date and up 5.6% over the past month. The vigorous rebound highlights just how oversold the Swedish krona is (panel 1). The Swedish economy grew 1.4% in Q2 from the previous three months, rebounding from a 0.8% contraction in the first quarter. This is impressive, given high energy prices and a slowdown in global economic activity. Going forward, growth is likely to slow. In July, the services and manufacturing PMIs declined, and consumer confidence fell sharply to the lowest reading in almost 30 years. Retail sales were down 1.2% month-on-month in June. The housing market is also feeling the pain of rising borrowing costs (panel 2). The Riksbank’s latest estimate sees a 16% decline in prices by the end of next year. For now, inflation is still accelerating in Sweden. CPIF, the Riksbank’s preferred measure, increased from 7.2% to 8.5% in June. Headline inflation rose from 7.3% to 8.7% (panel 3). Headline inflation is likely to decline in July, given the drop in the price component of the PMIs, but inflation will remain well above target. This will keep real rates weak (panel 4). This suggests that the Riksbank is facing the same conundrum as the ECB: accelerate policy tightening and tip the economy towards recession or remain accommodative and risk inflation becoming more entrenched. Our bias is that the Riksbank is likely to frontload rate hikes as currently priced in the OIS curve, with a 50 bps hike in September, ahead of major labor union wage negotiations (panel 5). Much like the NOK, the Swedish krona rebounded strongly in the past month on global risk-on sentiment. Fundamentally, the krona remains more vulnerable to external shocks due to higher energy dependency and a strong dollar. Chester Ntonifor Foreign Exchange Strategist chestern@bcaresearch.com Artem Sakhbiev Research Associate artem.sakhbiev@bcaresearch.com Thierry Matin Research Associate thierry.matin@bcaresearch.com Trades & Forecasts Strategic View Cyclical Holdings (6-18 months) Tactical Holdings (0-6 months) Limit Orders Forecast Summary
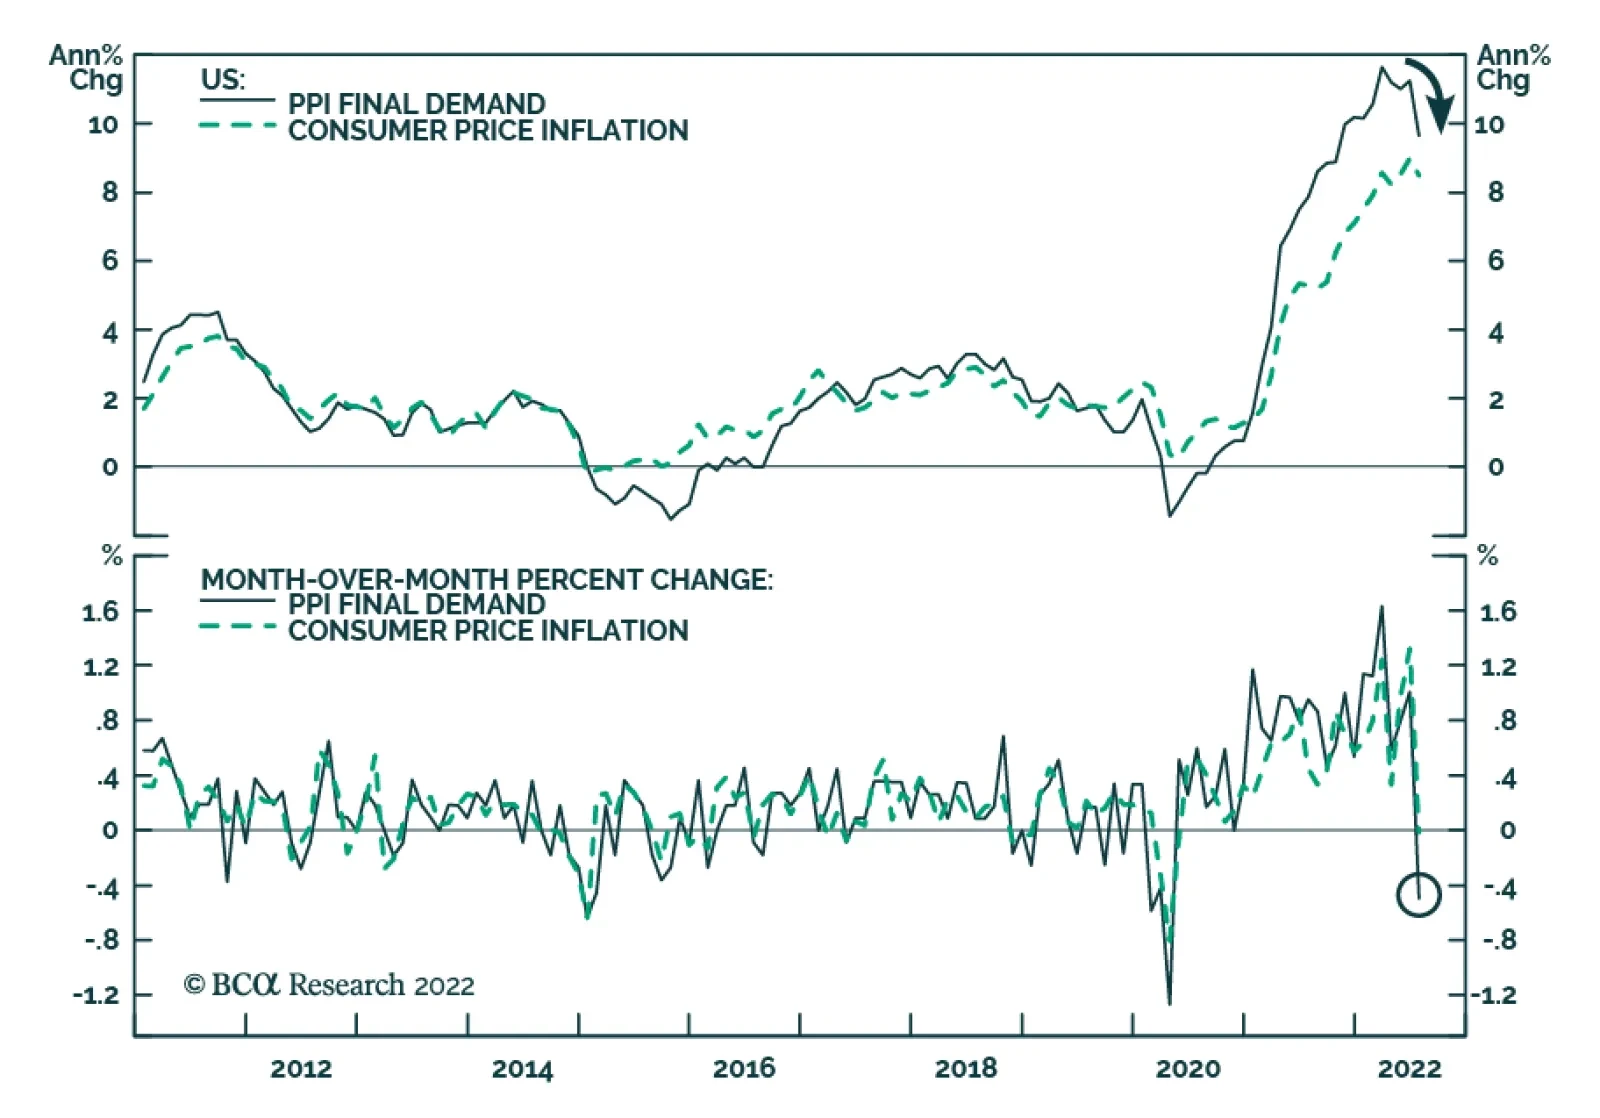
US producer prices declined in July, corroborating the signal from the CPI release that inflationary pressures are moderating. PPI final demand inflation contracted by 0.5% m/m in July following a 1.0% increase in June, and below expectations of…
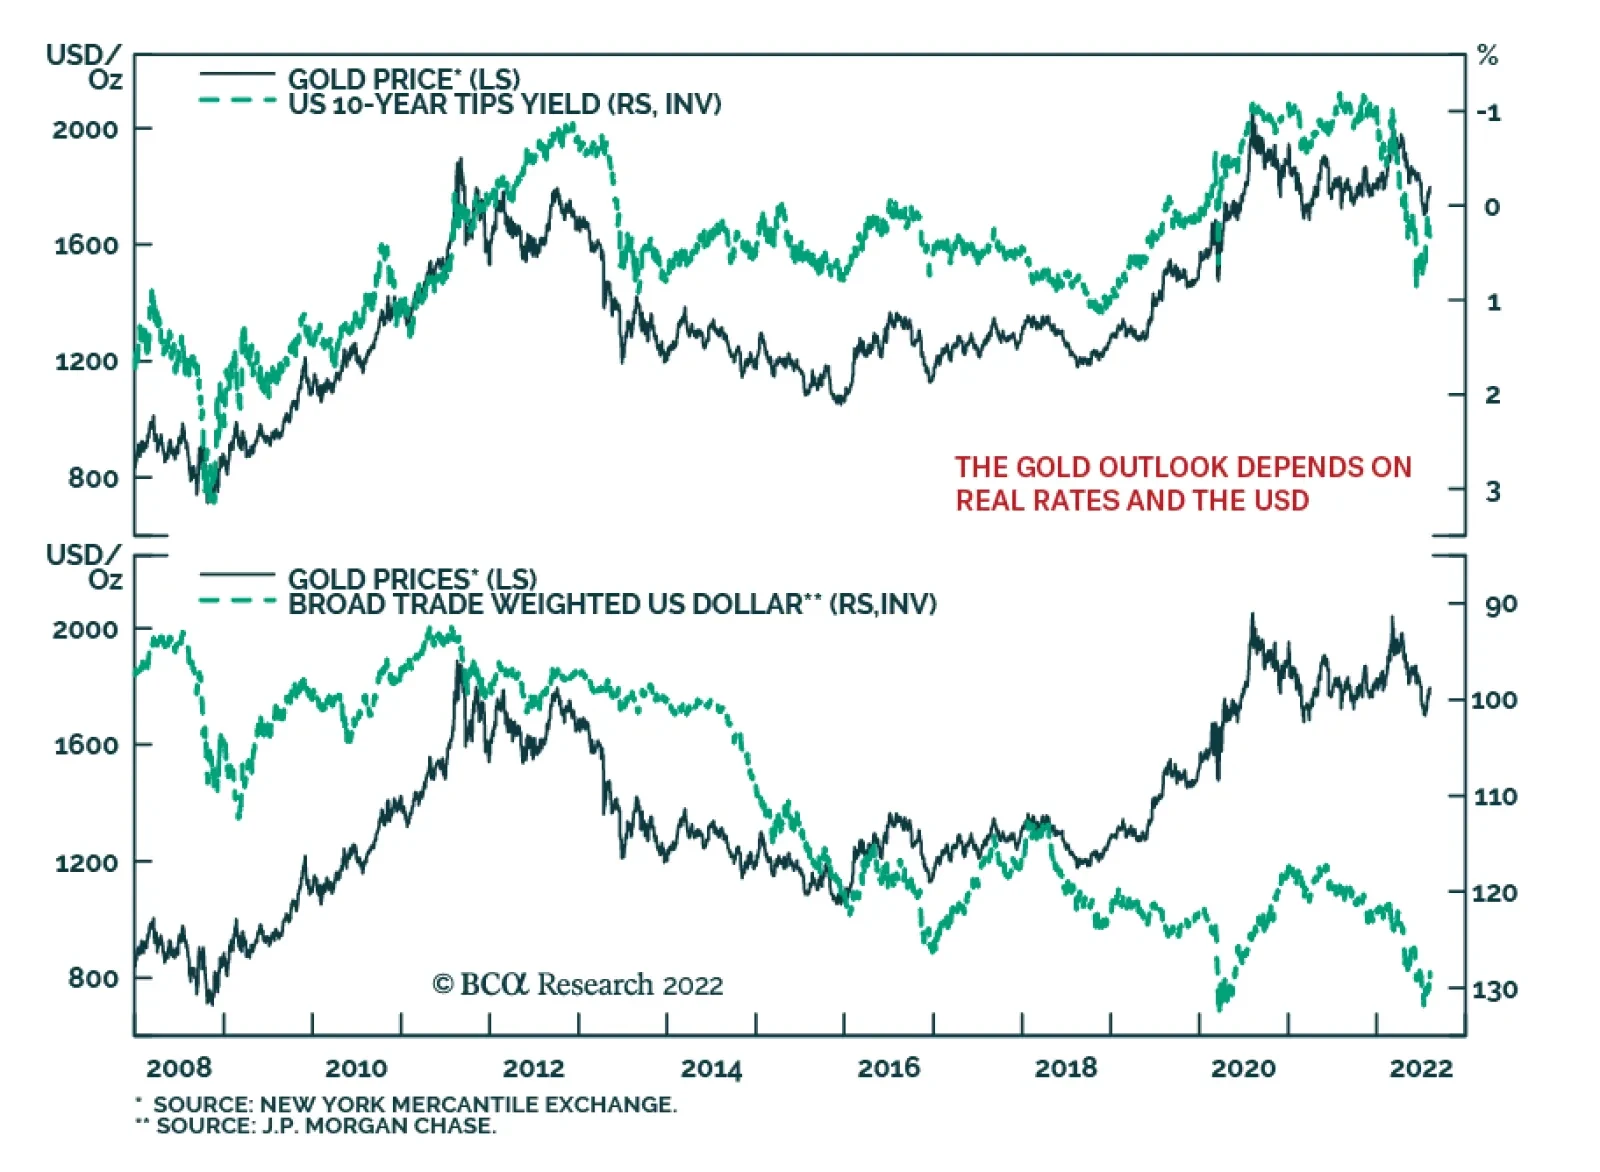
Rising real rates and a strengthening US dollar created formidable headwinds for gold in the first half of the year, offsetting tailwinds from soaring inflation and heightened geopolitical risks. Thus, gold ended the first half of the year at…
Executive Summary Oil Markets Remain Tight
Oil Markets Remain Tight
Oil Markets Remain Tight
US and Iranian negotiators received an EU proposal for reviving the Iran nuclear deal on Monday, which could return ~ 1mm b/d of oil to markets. The EU’s embargo of Russian seaborne crude imports, which commences December 5, will remove 90% of seaborne imports of Russian crude (~ 2.3mm b/d) by year-end. In February 2023, another 800k b/d of refined products will be embargoed. December also will usher in insurance and reinsurance sanctions on shipping Russian oil – arguably the strongest sanctions the EU, UK and US can impose. Without those Iranian barrels, the determination of the EU, UK and US to enforce a Russian oil embargo will be suspect. We give odds of 60% to a US-Iran deal getting done in the near term. Our Geopolitical Strategy maintains the likelihood of a deal is 40% at best. Bottom Line: Oil markets are pricing in the likelihood of large energy supply dislocations over the next couple of months. The evolution of prices hinges upon the degree to which the EU’s embargo on Russian oil imports is implemented. A revived Iran nuclear deal with the West would offset some of the embargoed Russian oil. Even so, oil balances still will remain tilted to deficit conditions in 2023. We continue to expect Brent will move above our 2022 $110/bbl expectation by 4Q22, and average $117/bbl next year. Feature US and Iranian negotiators received a proposal from EU negotiators for reviving the Iran nuclear deal on Monday.1 If the US and Iran can agree, the door opens for 1mm b/d of Iranian oil to return to markets. These barrels are becoming increasingly important to the EU, especially following the suspension of southerly flows of oil on Russia’s Druzhba pipeline due to a payment dispute.2 Brent popped ~ $1.50/bbl Tuesday morning as the Druzhba news broke, and the backwardation in the forward market increased (Chart 1). Brent gave back these early gains by the end of trading, following news a Hungarian refiner transferred the fee required to use the Ukrainian section of the pipeline.3 Chart 1Oil Markets Remain Tight
Oil Markets Remain Tight
Oil Markets Remain Tight
Complicated Motives On All Sides The EU obviously has an interest in freezing Iran’s nuclear program and accessing more Iranian fossil fuels while it is locked in an energy struggle with Russia – hence the its proposal to revive the Iran nuclear deal. However, the US and Iranian positions are more complicated. Iranian’s Supreme Leader Ali Khamenei has an interest in removing the US’s economic sanctions – and in obtaining deliverable nuclear weapons, notes Matt Gertken, BCA Research’s chief geopolitical strategist. Khamenei’s plan is to develop a nuclear weapon so that Iran can deter any aggression from a future US administration or the Abraham alliance. This is the path to regime survival, power succession, and national security. Hence Iran will not freeze its nuclear program over the long run. But Khamenei may wish to buy time while the Democrats still run the White House. Chart 2KSA, UAE Preserving Spare Capacity
Oil: It Ain't Over Till It's Over
Oil: It Ain't Over Till It's Over
We’ve noted repeatedly the Biden administration has been pressing the Kingdom of Saudi Arabia (KSA) and the United Arab Emirates (UAE) – the only states in OPEC 2.0 able to raise output and maintain production at higher levels – to increase output for the better part of this year. These efforts yielded only a 100k b/d production increase earlier this month. KSA and the UAE insist they are close to the maximum levels of oil they can supply to the market, given their current production and the need to maintain minimal spare capacity (Chart 2).4 KSA’s max capacity is 12mm b/d. The Kingdom will be producing at or slightly above 11mm b/d later this year to offset declines in non-core OPEC 2.0 production. KSA’s trying to get its max capacity to 13mm b/d, but that will take until 2027, according to the state oil company ARAMCO. UAE’s max capacity is 4mm b/d. It will be producing at or close to 3.5mm b/d this year, and after that they’ll want to hang on to that last bit as spare capacity. UAE’s trying to get its spare capacity to 5mm b/d, but that’s going to take until 2030, according to its state oil company ADNOC. There’s an increasing risk to the Russian output arising from the EU embargo scheduled to take effect December 5, and sanctions on providing insurance and reinsurance to ships carrying Russian material. If the EU/UK/US embargo is successful and results in Russia being forced to shut in 2mm b/d by the end of next year, per our expectation, KSA and UAE spare capacity will not cover the loss of production, and falling output within OPEC 2.0. Given these dynamics – and the expectation at least some of the sanctions will stick after Dec. 5 – KSA and UAE have to hang on to those last barrels to be able to meet the increasingly likely loss of Russian shut-in production. Additional spare capacity is not available in the US shales, or in any of the other producing provinces outside OPEC 2.0 sufficient to cover the loss of Russian barrels. Indeed, output from OPEC 2.0 outside the core producers has been trending lower for years (Chart 3).5 Complicating a deal with Iran is the possibility it could re-open the breach between the US and KSA. If KSA wanted to express its displeasure with a US-Iran deal it wouldn’t need to do much to re-balance the market: If the Kingdom does not offset production losses by the rest of OPEC 2.0, or step up to cover, e.g., Libyan production – now back on the market with just under 500k b/d – global supply falls and prices rise, all else equal.6 Chart 3KSA, UAE Are Core OPEC 2.0
Oil: It Ain't Over Till It's Over
Oil: It Ain't Over Till It's Over
Our Geopolitical Strategy gives 40% odds of an Iran deal and 60% odds that negotiations fall apart (or drag on without resolution). We make the odds higher – 60% chance of success – given the compelling interest of the Biden administration to get more oil into the market going into midterms in November, and a general interest in the West to offset potential losses of Russian volumes to sanctions that kick in in December. The difference in these views hinges on what Iran will do, as the Biden administration is seeking a deal. Sanctions Kicking In In December The EU is set to roll into its embargo of Russian oil imports on December 5. If fully implemented, ~ 2.3mm b/d of seaborne imports of Russian crude oil will be excluded from EU markets by year-end. Beginning in February, another 800k b/d of refined products will be embargoed. EU, UK and US shipping insurance and reinsurance sanctions also are set to kick in in December. These arguably are the strongest sanctions available to the West in its effort to take Russian oil and refined products off the market (no insurance means no shipping). The EU recently relaxed sanctions on buying and transporting Russian crude oil, which will allow additional volumes of oil to be purchased and transported to end-use markets.7 While this will let a little more Russian oil into the market in the near term, we believe it opens the possibility of additional exceptions being made by the EU to make more oil available, if prices move sharply higher on the back of increasing supply scarcity. The EU and US are looking a bit wobbly on the insurance and reinsurance bans due to kick in in December.8 If they relax or forego these sanctions in some fashion, more Russian crude and products will flow to market in 4Q22 than currently is anticipated. This would undermine US efforts to secure a price cap on Russian oil sales. Slower sanction enforcement is a path available to Biden that does not involve bowing to Iran’s various demands. Some, but not all, of the Russian volumes lost to EU exports will continue to be scooped up by China and India, which have become the largest buyers of Russian oil following the sanctions imposed by the West after the invasion of Ukraine.9 India loaded 29.5mm barrels of Russian crude in July – a record – while China loaded 18.1mm barrels. These levels likely will fall, but these two states will remain big buyers of Russian crude and products going forward. Household Budgets Will Remain Strained High energy prices – particularly for gasoline and diesel fuel – and falling real incomes have eaten into US household budgets, and are a key factor for Biden’s low approval ratings (Chart 4). July US CPI was unchanged from June and was 8.5% higher y-o-y. While the gasoline price index dropped from June, it remained one of the main contributors to the high energy index. (Chart 5).10 Based on the sharp increase in gasoline prices over the first six months of this year, we estimate the cost of running a car is 50% higher in 1H22 vs. 1H21 in the US. Chart 4Wealth Destruction Key To Low Biden Approval
Oil: It Ain't Over Till It's Over
Oil: It Ain't Over Till It's Over
Chart 5Energy Driving High US Prices
Oil: It Ain't Over Till It's Over
Oil: It Ain't Over Till It's Over
US gasoline and distillate prices have rolled over since mid-June, driven by high refined-product prices, which weakened demand, and fear of global recession as central banks tighten monetary policy. Higher Russian crude output in 1H22 – up 3.6% to ~ 10.1mm b/d – partly contributed to weaker product prices. However, this trend likely will reverse: Russian crude output in 2Q22 was down 1.1% y/y to 9.7mm b/d, based on our estimates. We expect prices of gasoline and diesel fuel to remain at elevated levels, given low inventories (Chart 6), and a second consecutive year of lower US refining capacity (Chart 7). Higher crude oil prices brought about by Russian oil and product embargoes will feed into these refined product prices, pushing them higher. Chart 6Low Product Stocks…
Oil: It Ain't Over Till It's Over
Oil: It Ain't Over Till It's Over
Chart 7…And Refining Capacity Are Bullish For Petrol Products
Oil: It Ain't Over Till It's Over
Oil: It Ain't Over Till It's Over
There is scope for an increase in gasoline demand over the rest of the driving season, while elevated US and overseas distillate demand will support diesel and heating oil prices. The eurozone’s record high inflation in July was driven by energy prices (Chart 8), indicating high energy prices are a problem for households worldwide. According to the Household Electricity Price Index, residential electricity prices in EU capitals were more than 70% higher in 1H22 y/y. The IMF expects high fuel prices will increase EU households’ share of energy expenditure by 7% in 2022.11 In response to high energy prices, governments are enacting policies such as price caps and direct transfers to lower the damage to household wealth.12 An unintended consequence of this will be high prices for longer, as consumers will not register the signal the market is sending via higher prices to encourage lower demand. This will result in continued draws on inventories. Chart 8High Energy Prices Responsible For Eurozone Inflation
High Energy Prices Responsible For Eurozone Inflation
High Energy Prices Responsible For Eurozone Inflation
Investment Implications With EU sanctions scheduled to become effective December 5, oil markets are focused on supply measures that could sharply reduce Russian oil exports. This makes the US-Iran negotiations to revive the Iran nuclear deal critically important. Agreement to restore the deal could return 1mm b/d of oil to markets at a time when supplies are at risk of contracting sharply going into 2023. Failure to restore these volumes will tighten supply significantly if the EU’s embargo of Russian oil imports is successful. We give the restoration of the Iran nuclear deal a 60% chance of success. In and of itself, the return of Iranian oil exports will not offset all of the potential loss of Russian crude oil exports to the EU. That said, the evolution of crude oil prices hinges upon the degree to which the EU’s embargo on Russian oil imports is implemented. There's a subtle point to be aware of in the evolution of US-Iran negotiations: The Biden administration could just turn a blind eye to Iranian crude sales, without agreeing to revive the nuclear deal being negotiated. Signing a deal, on the other hand, would be more positive for supply than merely not contesting Iranian's renewed exports of 1mm b/d of crude. It is worthwhile bearing in mind that the point of the deal is that Iran pauses its nuclear program, which reduces war risk in the medium term, or as long as deal is in force. Reducing the level of agita in the region, at least for a couple of years, is a net benefit. Our geopolitical strategist Matt Gertken notes, "If Iranians sign a deal, then they are endorsing Biden and the Democratic Party for 2024, meaning they want a Democratic White House in the US through 2028. There would be no reason to sign it unless you plan to implement at least through 2024." We remain bullish oil, and continue to expect Brent to trade above $110/bbl on average this year, and $117/bbl next year. We remain long the XOP ETF to retain our exposure to oil and gas E+Ps. Robert P. Ryan Chief Commodity & Energy Strategist rryan@bcaresearch.com Ashwin Shyam Research Analyst Commodity & Energy Strategy ashwin.shyam@bcaresearch.com Paula Struk Research Associate Commodity & Energy Strategy paula.struk@bcaresearch.com Commodities Round-Up Energy: Bullish The EIA expects US natural gas inventories to finish the injection season at ~ 3.5 Tcf – 6% below the five-year average – at the end of October (Chart 9). LNG exports are expected to average 11.2 Bcf/d, which, if realized, will be 14% over 2021 levels. The EIA increased its estimate of LNG exports on the back of an earlier-than-expected return of Freeport LNG exports. For 2023, the EIA expects US LNG exports will average 12.7 Bcf/d. Close to 70% of the 57 bcm of US LNG exports are being shipped to Europe, where it is helping offset the cutoff of Russian gas supplies following the war in Ukraine. In 1H22, the US became the world’s largest exporter of LNG. Dry gas production in the US is expected to average just under 97 Bcf/d in 2022, a 3% increase over 2021 levels. Base Metals: Bullish Total Chinese copper imports for July were up 9.3% at ~464kt for July, despite economic weakness and a property market slowed by companies' payment defaults and lower consumer confidence in real estate groups. Copper in SHFE warehouses were at 35kt which is 65% lower y/y as of the week ending August 5th, while stocks in China’s copper bonded inventories were 40% lower y/y at 262kt for the month of June. Low copper prices and Chinese stocks, and high imports indicate that the world’s largest copper consumer is capitalizing on weak prices to restock low inventories. Precious Metals: Bullish The World Gold Council reported gold ETF outflows for the third consecutive month in July at 80.1 tons (Chart 10) due to low gold prices, a strong USD and a hawkish Fed. The latest July US CPI data was unchanged from June, as high prices due to pandemic induced supply chain bottlenecks eased. Inflation remains well above target. Despite the mildly positive inflation data, we expect the Fed to hike interest rates again in September. The magnitude of this hike will depend on the August US CPI and employment prints, given the Fed’s data dependency. By year-end, if the Russian oil embargo and insurance bans on shipping vessels are implemented in their current form, high crude oil prices will feed into inflation, and the Fed will be forced to remain aggressive. Chart 9
Oil: It Ain't Over Till It's Over
Oil: It Ain't Over Till It's Over
Chart 10
Oil: It Ain't Over Till It's Over
Oil: It Ain't Over Till It's Over
Footnotes 1 Please see Agreement on nuclear deal within reach but obstacles remain published by politico.com on August 8, 2022. 2 Please see Russia suspends oil exports via southern leg of Druzhba pipeline due to transit payment issues published by reuters.com on August 9, 2022. 3 Please see Oil drops on Druzhba pipeline news and U.S. inflation expectations published by reuters.com on August 10, 2022. According to the International Association of Oil Transporters, the Druzhba pipeline capacity is ~ 1.3mm b/d. In July, its southern leg supplying Hungary, the Czech Republic and was carrying ~ 230k b/d, according to OilX, a satellite service monitoring oil and shipping movements globally. 4 Please see Tighter Oil Markets On The Way, which we published on July 21, 2022, for additional detail. 5 Please see footnote #4. 6 The background factor in this situation is Russia’s involvement in Libya’s civil disorder. We noted in our July 14, 2022 report Russia Pulls Oil, Gas Supply Strings: “Sporadic force majeure declarations and output losses in Libya, where Russian mercenaries actively support Khalifa Haftar’s Libyan National Army (LNA), continue to make supply assessments difficult.” 7 Please see How the EU Will Allow a Slight Increase in Russian Oil Exports published by Bloomberg.com on August 1, 2022. 8 Please see US warns of surge in fuel costs as it renews push for Russian oil price cap published by ft.com on July 26, 2022. 9 Please see Russian crude prices recover on strong India, China demand, and Column-Russian crude is more reliant on India and China, but signs of a peak: Russell | Reuters, published by reuters.com on August 7 and August 9, 2022. 10 After fuel oils, the 44% y-o-y increase in the gasoline price index was the largest contributor to the increase in the energy index. 11 Please see Surging Energy Prices in Europe in the Aftermath of the War: How to Support the Vulnerable and Speed up the Transition Away from Fossil Fuels, published by the IMF on July 29, 2022. 12 For an example of such policy, please see State aid: Commission approves Spanish and Portuguese measure to lower electricity prices amid energy crisis Investment Views and Themes Strategic Recommendations Trades Closed in 2022
Executive Summary Unit Labor Costs, Not Oil Prices, Are The Key To US Core Inflation
Unit Labor Costs, Not Oil Prices, Are The Key To US Core Inflation
Unit Labor Costs, Not Oil Prices, Are The Key To US Core Inflation
Inflation is not about oil, food or used car prices. Looking at prices of individual components of a consumer basket is akin to missing the forest for the trees. Despite the latest drop in US headline inflation, various core CPI measures continue trending up and registered considerable month-on-month rises in July. Wages and, more specifically, unit labor costs are the true measure of genuine and persistent inflation. US wage growth is very elevated, and the pace of unit labor cost gains has surged to a 40-year high. The conditions for sustainable and persistent disinflation in the US are not yet present. US inflation will prove to be much stickier and more entrenched than many market participants presently believe. The recovery in China will be U- rather than V-shaped, with risks tilted to the downside. The mainland’s property market breakdown is structural, not cyclical. Excesses are very large, and problems are snowballing, rendering the enacted policy stimulus insufficient. Bottom Line: US core inflation lingering above 4% and easing financial conditions will compel the Fed to continue hiking rates. This will cap global risk asset prices and put a floor under the US dollar. We continue to recommend an underweight allocation to EM in global equity and credit portfolios. Consistently, we are also reluctant to chase EM currencies higher. Feature The bullish macro narrative circulating in the investment community is that conditions for a cyclical rally in global risk assets have fallen into place. Specifically: US inflation will drop sharply as US growth has crested and commodity prices have plunged; The Fed is nearing the end of a tightening cycle; China has stimulated sufficiently, and its economy is about to recover, which will boost economic conditions among its trading partners in general and EM in particular. These assumptions along with the fact that the S&P 500 index has found support at a 3-year moving average – a proven line of defense – suggest that US share prices have likely bottomed (Chart 1). Are we witnessing déjà vu of the 2011, 2016, 2018 and 2020 market bottoms? Chart 1Déjà Vu? Is 2022 Like The 2011, 2016 And 2018 Bottoms In The S&P 500?
Déjà Vu? Is 2022 Like The 2011, 2016 And 2018 Bottoms In The S&P 500?
Déjà Vu? Is 2022 Like The 2011, 2016 And 2018 Bottoms In The S&P 500?
We have reservations about all of the above fundamental conjectures. We elaborate on these reservations in this report. On the whole, we contend that the current environment is different, and the roadmaps of all post-2009 equity market bottoms are not necessarily currently applicable. BCA’s Emerging Markets Strategy team believes that (1) US consumer price inflation is much more entrenched and will prove stickier than is commonly believed; and (2) the Chinese property market’s breakdown is structural, not cyclical; hence, the recovery will not gain traction easily. Is This The End Of The US Inflation Problem? Not Quite This week’s US inflation data confirmed that headline CPI inflation has probably peaked: prices in several categories plunged. However, inflation is not about oil, food or used car prices. Chart 2 reveals that historically there have been several episodes whereby core inflation remains elevated despite plunging oil prices. Chart 2US Core Inflation Does Not Always Follow Oil Prices
US Core Inflation Does Not Always Follow Oil Prices
US Core Inflation Does Not Always Follow Oil Prices
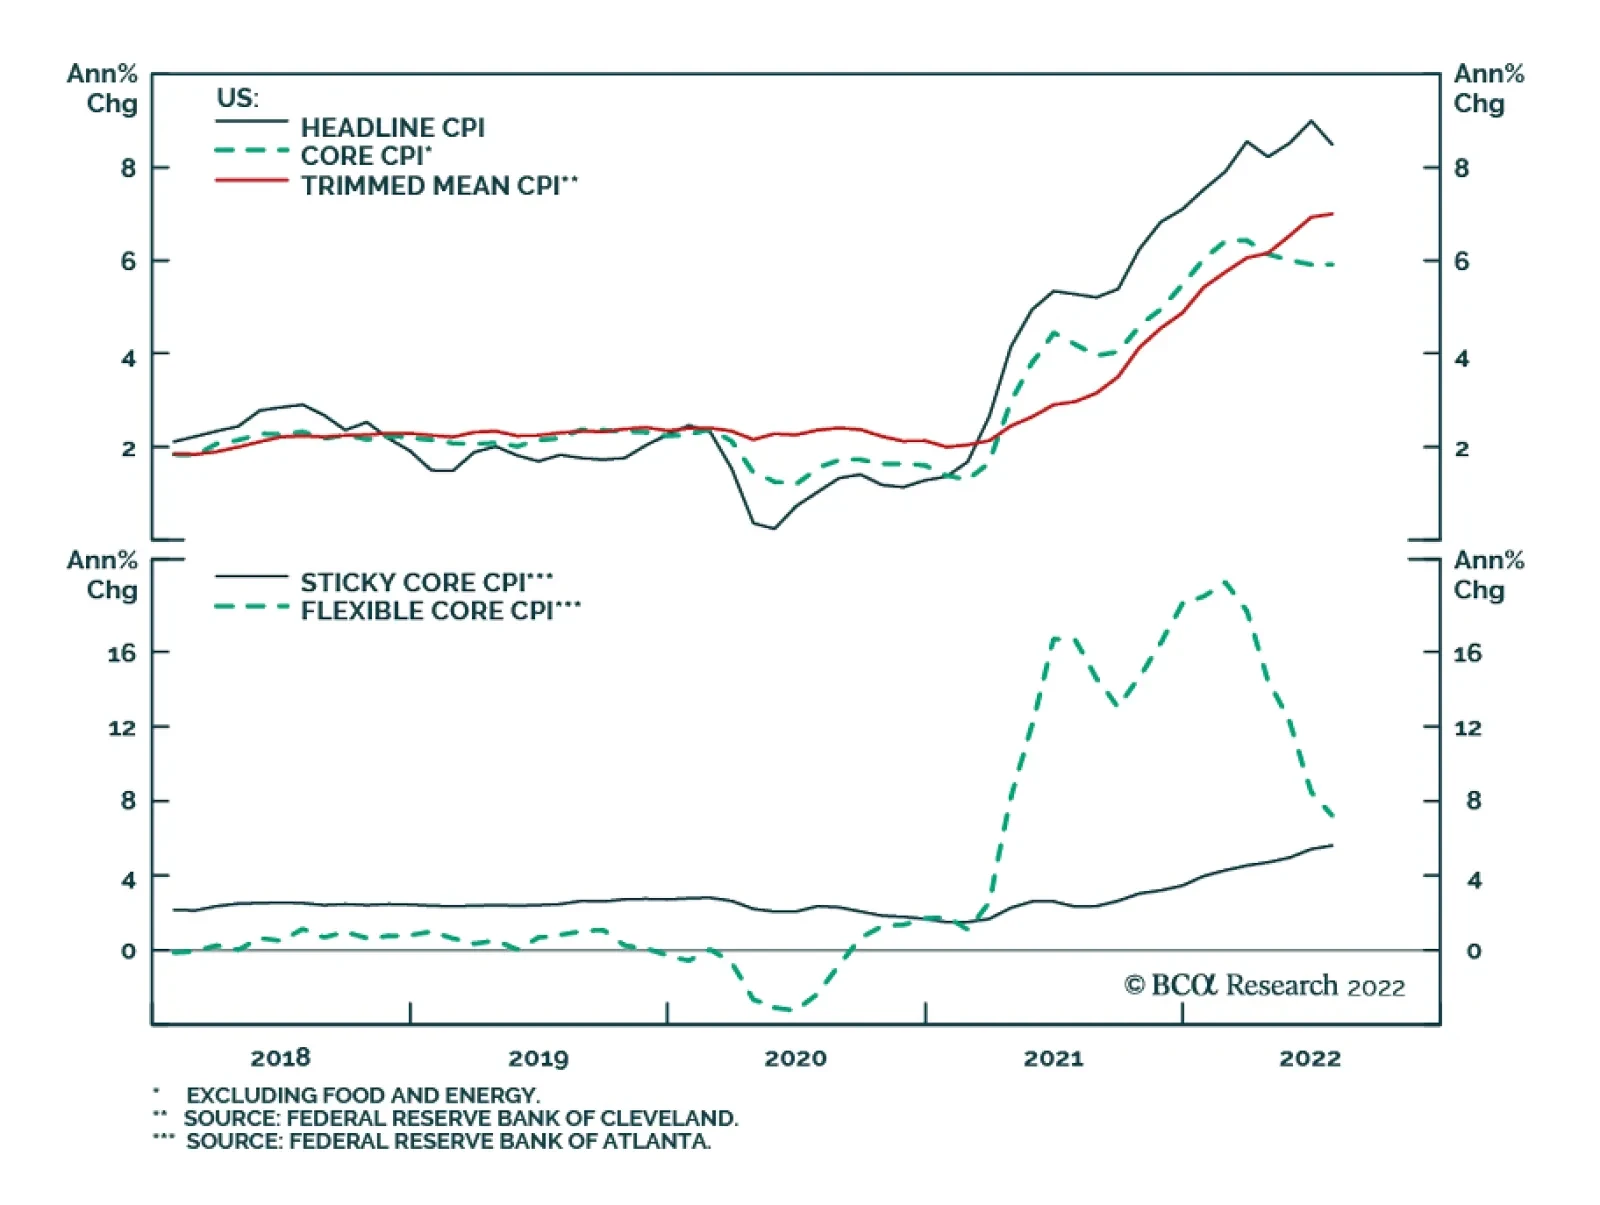
Looking at price dynamics among the individual components of the CPI basket is akin to missing the forest for the trees. Inflation is a very inert and persistent phenomenon. Underlying inflation does not change its direction often and/or quickly. That is why we believe that it is premature to celebrate the end of the US inflation problem. A few observations on this matter: Despite the drop in US headline inflation, various core CPI measures − like trimmed-mean CPI, median CPI and core sticky CPI − all continue trending up and registered substantial month-on-month rises in July (Chart 3). The range of core inflation based on these annual and month-month annualized rates is between 4-7%. In brief, the rate of genuine/sticky inflation is well above the Fed’s 2% target. Given its unconditional commitment to bringing inflation down to 2%, the Fed will continue hiking interest rates ceteris paribus. Chart 3US Core CPI Measures Are Still Very High
US Core CPI Measures Are Still Very High
US Core CPI Measures Are Still Very High
Chart 4US Wages Growth Has Been Surging
US Wages Growth Has Been Surging
US Wages Growth Has Been Surging
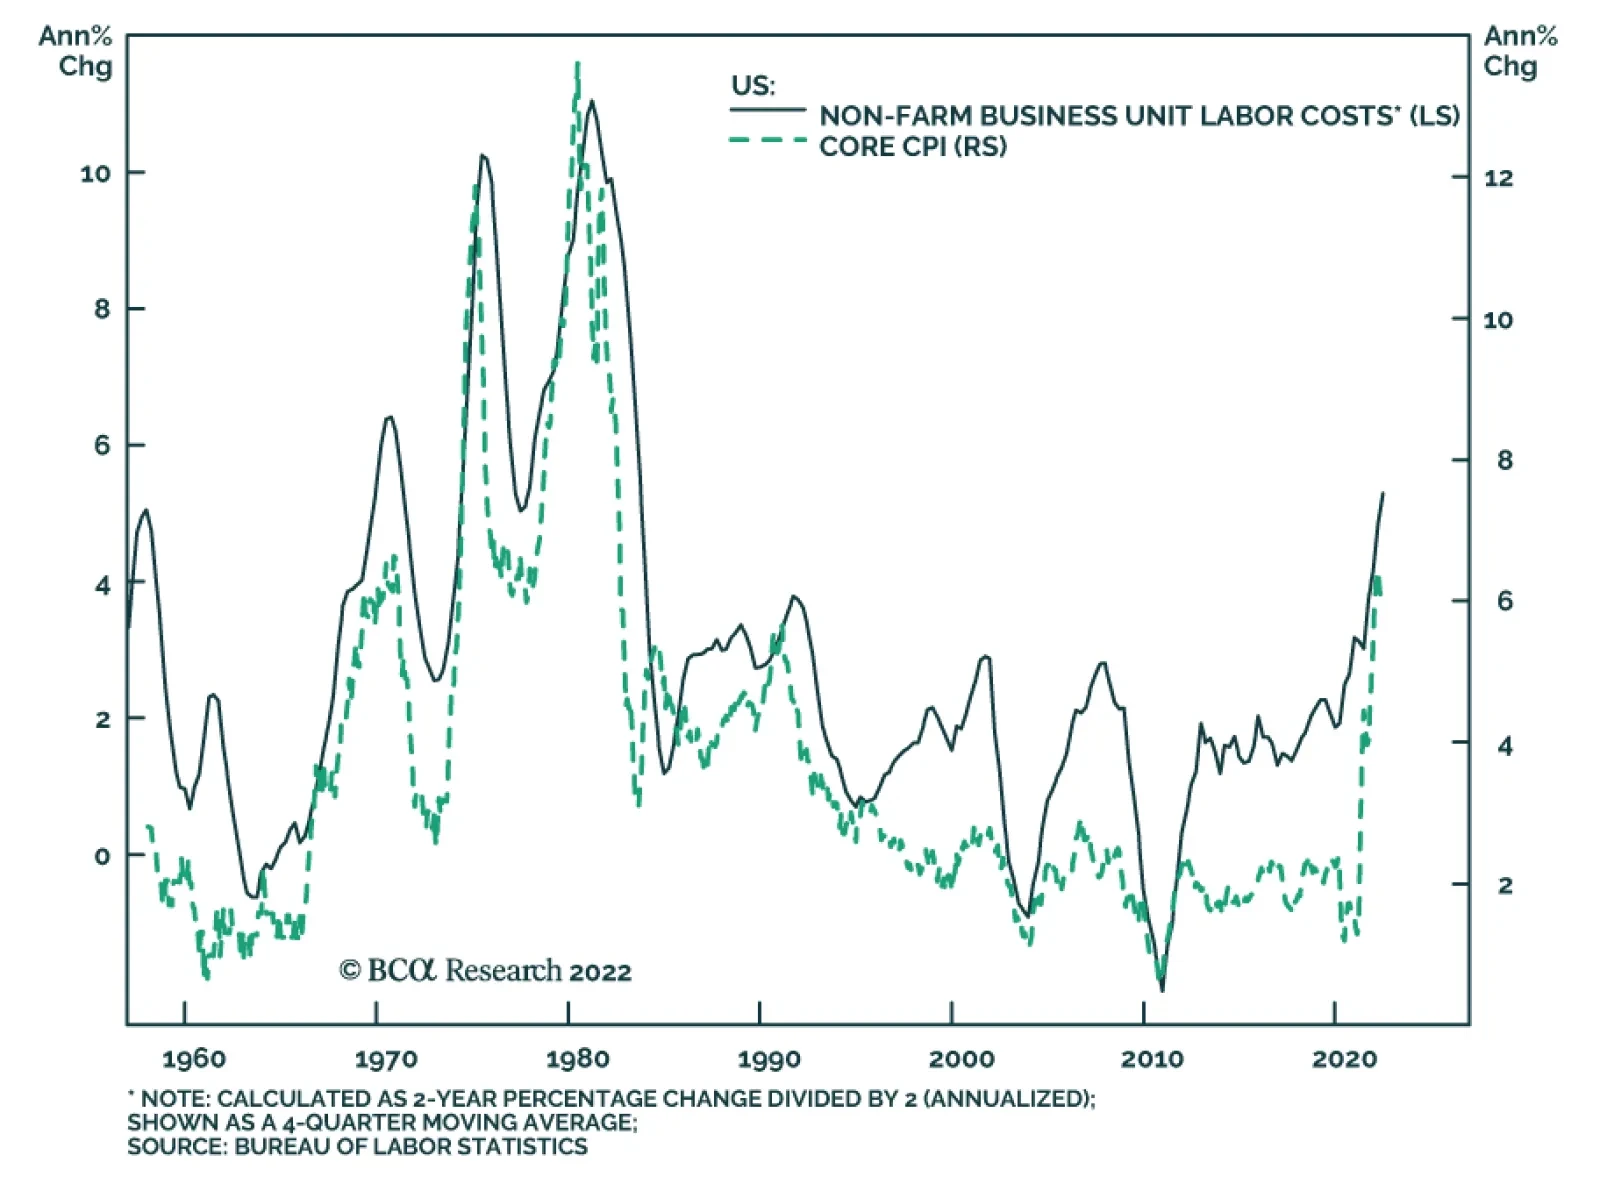
We continue to emphasize that wages and, more specifically, unit labor costs are the true measures of persistent and genuine inflation. We have written at length about why wages and unit labor costs are more important to inflation than oil or food prices. US wage growth is very elevated and is accelerating (Chart 4). Unit labor costs, calculated as hourly wages divided by productivity, have also been surging to a 40-year high (Chart 5, top panel). Chart 5Unit Labor Costs, Not Oil Prices, Are The Key To US Core Inflation
Unit Labor Costs, Not Oil Prices, Are The Key To US Core Inflation
Unit Labor Costs, Not Oil Prices, Are The Key To US Core Inflation
The reason for this very strong wage growth and swelling unit labor costs is the very tight labor market. The bottom panel of Chart 5 demonstrates that labor demand is still outpacing labor supply by a wide margin. Hence, wage inflation will not subside until the unemployment rate rises meaningfully. Bottom Line: Conditions for sustainable and persistent disinflation in the US are not yet present. Inflation will prove to be much stickier and more entrenched than many market participants presently believe. Core inflation lingering above 4% and easing financial conditions will compel the Fed to continue hiking rates. This will cap risk asset prices and put a floor under the US dollar. China: Is This Time Different? If one believes that China’s current business cycle is similar to all previous ones seen since 2009, odds are that a buying opportunity in China-related financial markets is at hand. Chart 6 illustrates that the credit and fiscal spending impulse leads the business cycle by about nine months. Given that this impulse bottomed late last year, a trough in the Chinese business cycle is due. Chart 6Is A Recovery In China's Business Cycle Imminent?
Is A Recovery In China's Business Cycle Imminent?
Is A Recovery In China's Business Cycle Imminent?
It is always risky to suggest that this time is different. Nevertheless, at the risk of being wrong, we contend that a combination of (1) property markets woes, (2) an impending export contraction, and (3) the dynamic zero-COVID policy will reduce the multiplier effect of current stimulus measures. Hence, a meaningful recovery in economic activity will likely fail to materialize in the coming months. The challenges facing the mainland property market are now well known. Yet, excesses are very large, and problems are snowballing, making policy stimulus insufficient. In particular: Authorities are contemplating bailout funds for property developers in the range of RMB 300-400 billion to enable them to complete housing that has been pre-sold. This is not sufficient financing for overall property construction. Table 1How Large Are Property Developers Bailout Funds?
Déjà Vu?
Déjà Vu?
Table 1 illustrates that these amounts are equal to just 3-4% of annual fixed-asset investment in real estate excluding land purchases, 1.5-2% of total financing of developers, and 3-4% of the advance payments that property developers received for pre-sold housing in 2021. Property developers will not be receiving any cash upon the completion and delivery of presold housing units because they were paid in advance. Hence, without liquidating their other assets, homebuilders cannot repay the bailout financing. Consequently, only state financing can work here because, from the viewpoint of providers of this financing, this scheme de-facto means throwing good money after bad. The property industry in China is extremely fragmented. This makes bailouts difficult to organize and execute. There are officially about 100,000 property developers in China. The overwhelming majority of them are not state-owned companies. Plus, the two largest property developers, Evergrande (before defaulting) and Country Garden, had only 3.8% and 3.3% of market share respectively in 2020. The failure of homebuilders to complete and deliver pre-sold housing units could unleash a death spiral for them. In recent years, 90% of housing units have been pre-sold, i.e., buyers made advance payments/prepayments, often taking out mortgages (Chart 7, top panel). Witnessing the inability of developers to deliver on presold units, a rising number of people may decide to wait to buy. The largest source of developers’ financing – advance payments for pre-sold housing units – might very well dry up. This source has accounted for 50% of real estate developers’ total financing in recent years (Chart 7, bottom panel). In brief, a vicious cycle is possible. The lack of financing for homebuilders bodes ill for construction activity (Chart 8). Chart 7China: Housing Presales And Pre-Payments Are Critical To Developers
China: Housing Presales And Pre-Payments Are Critical To Developers
China: Housing Presales And Pre-Payments Are Critical To Developers
Chart 8Lack Of Homebuilder Financing = Shrinking Construction Activity
Lack Of Homebuilder Financing = Shrinking Construction Activity
Lack Of Homebuilder Financing = Shrinking Construction Activity
Chart 9Chinese Property Developers Are Extremely Leveraged
Chinese Property Developers Are Extremely Leveraged
Chinese Property Developers Are Extremely Leveraged
Besides, property developers are very leveraged with an assets-to-equity ratio close to nine (Chart 9). They have grown accustomed to borrowing heavily to accumulate real estate assets. They have been starting but not completing construction (Chart 10, top panel). We have been referring to this phenomenon as the biggest carry trade in the world. The bottom panel of Chart 10 shows two different measures of residential floor space inventories held by property developers. One measure subtracts completed floor space from started floor space, and another one deducts sold floor space from started floor space. On both measures, residential inventories are enormous. In theory, they could raise funds by selling their real estate assets. However, if they all try to sell simultaneously, there will not be enough buyers, and asset prices will plunge, which could lead to a full-blown debt deflation spiral. The last time the real estate market was similarly distressed in 2014-15, the central bank launched the Pledged Supplementary Lending (PSL) facility. This was effectively a QE program to monetize housing. This was the reason why housing recovered strongly in 2016-2017. There is currently no such program up for discussion. On the whole, odds are that the current property market breakdown is structural, not cyclical. Financial markets – the prices of stocks and USD bonds of property developers – convey a similar message and continue to plunge (Chart 11). Chart 10Excessive Property Inventories
Excessive Property Inventories
Excessive Property Inventories
Chart 11No Green Light From Property Stocks And Corporate Bond Prices
No Green Light From Property Stocks And Corporate Bond Prices
No Green Light From Property Stocks And Corporate Bond Prices
Chart 12There Has Been No Recovery In China Without A Revival in Real Estate
There Has Been No Recovery In China Without A Revival in Real Estate
There Has Been No Recovery In China Without A Revival in Real Estate
Without an improvement in the housing market, a meaningful business cycle recovery is unlikely in China. Chart 12 illustrates that all recoveries in the Chinese broader economy since 2009 occurred alongside a revival in property sales. The importance of the property market goes beyond its size. Rising property prices lift household and business confidence, boosting aggregate spending and investment. The sluggish housing market and falling house prices will impair consumer and business confidence. This, along with uncertainty related to the dynamic zero-COVID policy, will dent consumer spending and private investments. Finally, the upcoming contraction in Chinese exports will dampen national income growth. Taken together, the multiplier effect of stimulus in the upcoming months will be lower than it has been in previous periods of stimulus. There are two areas that will see meaningful improvement in the coming months: infrastructure spending and autos. BCA’s China Investment Strategy service discussed the outlook for auto sales in a recent report. Chart 13Green Shoots In China's Infrastructure Investment
Green Shoots In China's Infrastructure Investment
Green Shoots In China's Infrastructure Investment
On the infrastructure front, there has been mixed evidence of an improvement in activity. The top and middle panels of Chart 13 demonstrate that Komatsu machinery’s operational hours and the number of approved infrastructure projects might be bottoming. However, the installation of high-power electricity lines has fallen to a 15-year low (Chart 13, bottom panel). As we elaborated in last month’s report, the new financing/stimulus for infrastructure development will not result in new investments. Rather, it will by and large offset the drop in local government (LG) revenues from land sales this year. In short, there is little new stimulus for infrastructure beyond what was approved in the budget plan earlier this year. Bottom Line: The recovery in China will be U- rather than V-shaped, with risks tilted to the downside. Investment Recommendations Our bias is that the rebound in global risk assets could last for a few more weeks. The basis is that investor positioning in risk assets was very light when this rebound began. Plus, falling oil prices could reinforce the idea among investors that US inflation is no longer a problem. Looking beyond the next several weeks, the outlook for global and EM risk assets is dismal. Markets will realize that the Fed cannot halt its tightening with core inflation well above 4-5%. Hawkish Fed policy and contracting global trade will boost the US dollar and weigh on cyclical assets. We continue to recommend an underweight allocation to EM in global equity and credit portfolios. Consistently, we are also reluctant to chase EM currencies higher. EM local bonds offer value, as we have argued over the past couple of months, but for now we prefer to focus on yield curve flattening trades. We continue betting on yield curve flattening/inversion in Mexico and Colombia and are long Brazilian 10-year domestic bonds while hedging the currency risk. In addition, we recommend investors continue receiving 10-year swap rates in China and Malaysia. Arthur Budaghyan Chief Emerging Markets Strategist arthurb@bcaresearch.com Strategic Themes (18 Months And Beyond) Equities Cyclical Recommendations (6-18 Months) Cyclical Recommendations (6-18 Months)
US headline CPI eased to a lower-than-expected 8.5% y/y in July, from a four-decade high of 9.1% in June. The index was flat on a month-on-month basis amid lower gasoline prices (which fell by 7.7% m/m). This follows a 1.3% m/m jump in headline inflation in…
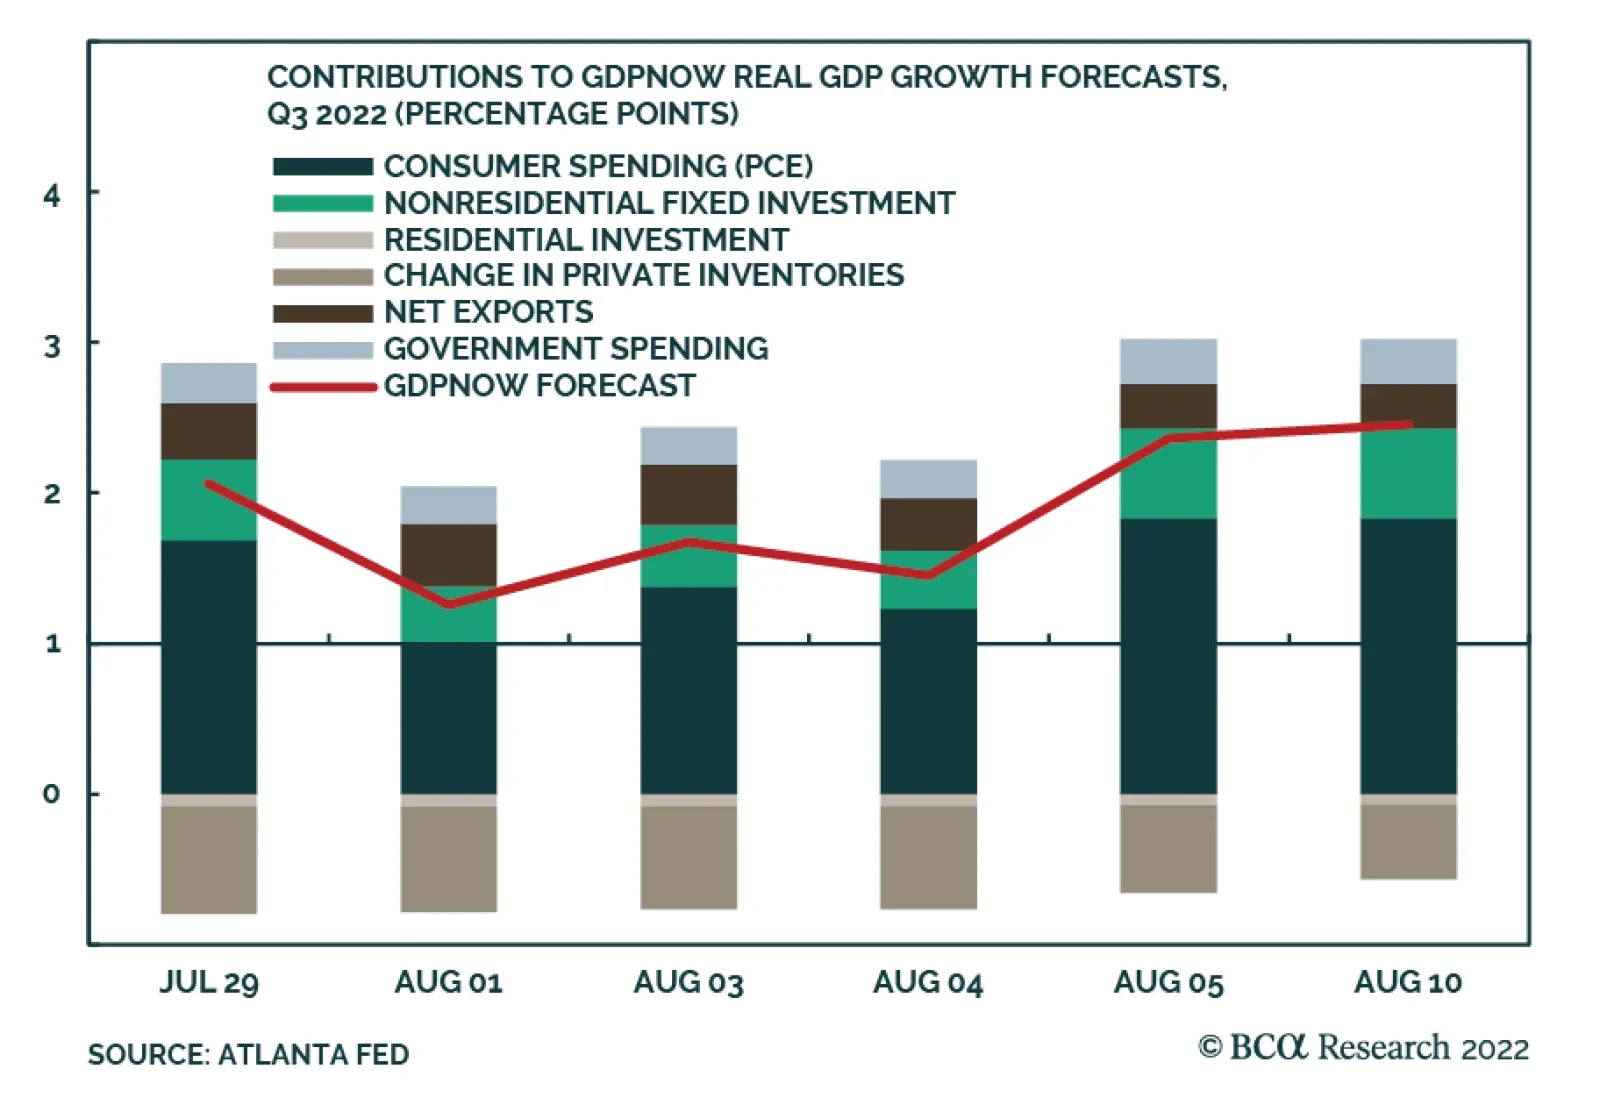
The latest update from the Atlanta Fed’s GDPNow model estimates US real GDP growth of 2.5% in Q3 – up from last week’s 1.4%. The robust July employment report and, to a lesser extent, the July CPI release (see The Numbers) boosted the model’s forecasts for…
Executive Summary Realized Real Interest Rates Must Rise
Realized Real Interest Rates Must Rise
Realized Real Interest Rates Must Rise
Policymakers must continue engineering higher real interest rates, and tighter financial conditions, to help cool off growth and bring down overshooting inflation. This will inevitably lead to inverted yield curves across most of the developed world, following the recent trend of US Treasuries. US growth expectations remain overly pessimistic, which opens up the potential for more near-term bond-bearish upside data surprises like the July employment and ISM Services reports. The Bank of England – under increasing political pressure for its relatively timid response to the massive UK inflation overshoot – is now forecasting a long policy-induced recession as the only way to tame UK inflation expected to reach 13% by year-end. Expect UK Gilts to be a relative outperformer within developed bond markets over the next 12-18 months. Bottom Line: Stay overweight UK Gilts versus US Treasuries in global bond portfolios, but increase exposure to yield curve flattening in both countries. The Fed and Bank of England are both on course to push monetary policy into restrictive, growth-damaging territory. Don’t Get TOO Comfortable Taking Risk In a bit of a summer surprise, global financial markets have been staging a mild recovery from the stagflationary doom that prevailed during the first half of 2022. In the US, the S&P 500 index is up 14% from the year-to-date intraday low reached on June 16, with the VIX index back down to low-20s zone last seen in April (Chart 1). High-yield corporate bond spreads in the US and euro area are down 97bps and 36bps, respectively, since that mid-June trough in US equities. Even emerging market equities and credit – the most unloved of asset classes in 2022 – have stabilized. Related Report Global Fixed Income StrategyIt’s Time To Flip The Script - Upgrade UK Gilts Some of this risk rally is surely short-covering, but there are some valid reasons to be less pessimistic on growth-sensitive risk assets. In the US, where the back-to-back contractions in GDP in the first two quarters of the year have stoked recession fears, the latest data releases have seen upside surprises suggesting an expanding, not contracting, economy (Chart 2). The July ISM non-manufacturing (services) index rose +1.4 points in July to 56.7, a broad-based move that included increases in Production, New Orders and New Export Orders. Core durable goods orders rose +0.5% in June for the second straight month. The biggest surprise was the July Payrolls report, which showed a whopping +528,000 increase in employment – over twice the expected gain of +250,000 – with a downtick in the unemployment rate to 3.5%. Chart 1Stepping Back From The Recessionary Abyss
Stepping Back From The Recessionary Abyss
Stepping Back From The Recessionary Abyss
Chart 2The US Recession Talk May Have Been Premature
The US Recession Talk May Have Been Premature
The US Recession Talk May Have Been Premature
Chart 3Goods Inflation Pressures Easing
Goods Inflation Pressures Easing
Goods Inflation Pressures Easing
There was also some good news on the inflation front in the latest US data. The Prices Paid components of both the ISM manufacturing and non-manufacturing indices showed big declines, 18.5pts and 7.8pts respectively, in July, continuing the downtrends that began in the latter half of 2021 (Chart 3). This is not just a US story. The Prices Paid components of the S&P Global manufacturing PMIs in the euro area, the UK, Japan and China have also been falling. Lower global commodity prices, particularly for oil, are playing a large role in the pullback in reported business input costs. The Supplier Deliveries components of both ISM reports also fell on the month, continuing a trend seen throughout 2022 as global supply chain pressures have eased. Combined with the drop in the Prices Paid data, global PMIs are sending a strong message - inflationary pressures on the traded goods side of the global economy are finally easing. Slower goods inflation, however, does not provide an all-clear for risk assets on a cyclical basis. Non-goods price pressures are showing little sign of peaking across most of the developed world. Labor markets remain tight, and both wage inflation and services inflation rates continue to accelerate in the major economies of the US, UK and euro area at a pace well above central bank inflation targets (Chart 4). Until these domestic sources of inflation show signs of peaking, central banks will continue to push up policy rates to slow growth, generate higher unemployment and, eventually, bring domestically driven inflation back down to central bank targets. Expect the so-called Misery Index, summing headline inflation and the unemployment rate, to remain elevated across the major developed economies until negative real interest rates begin to rise through a combination of more nominal rate hikes and, eventually, slower inflation (Chart 5). Chart 4Domestic Inflation Pressures Accelerating
Domestic Inflation Pressures Accelerating
Domestic Inflation Pressures Accelerating
Chart 5Realized Real Interest Rates Must Rise
Realized Real Interest Rates Must Rise
Realized Real Interest Rates Must Rise
As we discussed in last week’s report, bond markets were getting way ahead of themselves in pricing in aggressive rate cuts in 2023, especially in the US. This was setting up for a potential move higher in yields on any positive data news. Within the “Big 3” developed economies, US Treasuries look most vulnerable to a rebound in bond yield momentum, judging by what looks like a true bottom in the mean-reverting Citigroup US Data Surprise Index (Chart 6). The flow of data surprises is more mixed in the euro area and UK and is not yet at the stretched extremes that would signal a sustainable increase in bond yields. Taken at face value, this fits with our current recommendation to underweight the US, and overweight core Europe and the UK, within global government bond portfolios. With central banks now on track to push policy rates into restrictive territory, there is the potential for additional flattening of already very flat yield curves across the Big 3. Forward rates are not priced for additional curve flattening in those markets, looking at both the 2-year/10-year and 5-year/30-year government bond curves (Chart 7). This makes positioning for more curve flattening in the US, UK and euro area a positive carry trade by leaning against the pricing of forward rates. Chart 6Greater Potential For Bond-Bearish Data Surprises In The US
Greater Potential For Bond-Bearish Data Surprises In The US
Greater Potential For Bond-Bearish Data Surprises In The US
Chart 7Increase Exposure To Curve Flattening In The 'Big 3'
Increase Exposure To Curve Flattening In The 'Big 3'
Increase Exposure To Curve Flattening In The 'Big 3'
We are adjusting the positioning within the BCA Research Global Fixed Income Strategy Model Bond Portfolio this week to benefit from the trend towards additional curve flattening in the US, the UK and core Europe (Germany and France). With the 2-year/10-year curve already inverted by -45bps in the US, we see better value by adding flattening exposure between the 5-year and 30-year points – a curve segment that is not yet in inversion. In the UK and euro area, we see a case for positioning for flattening across the entire yield curve. Bottom Line: Stay overweight both UK Gilts and core European government bonds versus US Treasuries in global bond portfolios, but increase exposure to yield curve flattening in all countries. The Fed and Bank of England are both clearly on course to push monetary policy into restrictive, growth-damaging territory, and the ECB may be forced to do the same. Painful Honesty From The Bank Of England The Bank of England (BoE) delivered its largest rate hike since 1995 last week, raising Bank Rate by 50bps to 1.75%. Planned sales of UK Gilts accumulated by the BoE during the quantitative easing phase of pandemic stimulus, at a pace of £10bn per quarter starting in September, were also announced. While those moves were largely expected by markets, the BoE’s new set of economic forecasts contained quite a shocker – an expectation of recession starting in Q4 of this year, running through the end of 2023 (Chart 8). The UK unemployment rate is expected to rise substantially from the current 3.8% to 6.3% by Q3/2025. Chart 8Brutal Honesty In The Latest BoE Forecasts
Brutal Honesty In The Latest BoE Forecasts
Brutal Honesty In The Latest BoE Forecasts
Chart 9Energy Prices Driving BoE Inflation Forecasts
Energy Prices Driving BoE Inflation Forecasts
Energy Prices Driving BoE Inflation Forecasts
We are hard pressed to remember the last time a major central bank announced a forecast of a prolonged economic downturn as part of its baseline scenario to bring inflation to its target. Such is the predicament that the BoE finds itself in, with headline UK inflation expected to soar to 13% by the end of 2022 – a mere 11 percentage points above the central bank’s inflation target. The BoE has been forced to sharply ratchet up that expected peak in UK inflation at both the May and August policy meetings this year. This is largely due to the massive increase in UK energy prices with the Energy component of the UK CPI index up over 50% in year-over-year terms. According to analysis published in the BoE August 2022 Monetary Policy Report, the direct impact of higher energy prices was projected to account for roughly half of that expected 13% peak in UK inflation this year (Chart 9). At the same time, falling energy prices embedded into futures curves are expected to full unwind that effect in 2023. The BoE’s recession call is also conditioned on a market-implied path for interest rates, with a 2023 peak in Bank Rate of just over 3% priced into the UK OIS curve. Looking beyond the energy price surge, there are signs that the BoE will not have to tighten as aggressively as interest rate markets are currently expecting. Our BoE Monitor, constructed using growth, inflation and financial market variables that would typically pressure the central bank to tighten or loosen monetary policy, has clearly peaked (Chart 10). All three components of the Monitor have rolled over, although inflation pressures remain the strongest contributor to the elevated absolute level of the Monitor. From a growth perspective, there are many reasons to expect the UK economy to enter a recession without much more prodding from BoE rate hikes (Chart 11): Chart 10Our BoE Monitor Sees Easing Cyclical Pressure To Raise Rates
Our BoE Monitor Sees Easing Cyclical Pressure To Raise Rates
Our BoE Monitor Sees Easing Cyclical Pressure To Raise Rates
Chart 11A Broad-Based Slowing Of UK Growth
A Broad-Based Slowing Of UK Growth
A Broad-Based Slowing Of UK Growth
Both the S&P Global manufacturing and services PMIs are on target to soon fall below the 50 level that indicates positive growth (top panel) Consumer confidence has collapsed as surging inflation has overwhelmed household income growth, leading to a contraction in retail sales volume growth (middle panel) The BoE’s Agents’ Survey of individual businesses shows a sharp deterioration in business investment spending plans (bottom panel). Yet even with growth clearly slowing already, the sheer magnitude of the inflation overshoot is forcing markets to discount a fairly aggressive path for UK interest rates over the next year. This is not only evident in the OIS curve, but also in the BoE’s own Market Participants Survey (MPS) of UK investors. According to the just released August MPS, the median expectation is for Bank Rate to peak at 2.5% next year (Chart 12). This is a sizeable increase from the previous expected peak of 1.75% from the last MPS in May, but is still below the discounted peak in rates from the OIS curve of 3.1%. The bigger news is that the, according to the August MPS, the median survey participant now believes that the neutral range for Bank Rate is now 2-2.5%, up from the 1.5-2.0% range in the May MPS. Therefore, the August MPS forecasted peak Bank Rate of 2.5% is only at the high end of neutral and not restrictive. Yet both the OIS curve and the August MPS expect the BoE to immediately pivot from rate hikes to rate cuts in the second half of 2023. Chart 12UK Interest Rate Markets Have Adjusted Neutral Rate Expectations
UK Interest Rate Markets Have Adjusted Neutral Rate Expectations
UK Interest Rate Markets Have Adjusted Neutral Rate Expectations
Chart 13The BoE Is Facing Severe Public Scrutiny
The BoE Is Facing Severe Public Scrutiny
The BoE Is Facing Severe Public Scrutiny
The notion that the BoE would pivot so quickly next year, when their own forecasts still call for UK inflation to be over 9% in the third quarter of 2023, seem somewhat optimistic. Especially with the BoE under tremendous public and political pressure because of runaway UK inflation. The leading candidate to become the next UK Prime Minister, Foreign Secretary Liz Truss, has already gone on record stating that she would look to change the BoE’s remit as Prime Minister to focus solely on keeping inflation low. Meanwhile, the latest BoE Inflation Attitudes Survey shows more respondents are now dissatisfied with the BoE than satisfied (Chart 13). 1-year-ahead inflation expectations from that same survey are now at 4.6%, while 5-year/5-year forward breakevens from UK index-linked Gilts are still at 3.8%. With inflation expectations still so elevated, and with the BoE’s own forecasts calling for headline UK inflation to not fall back to the 2% BoE target until Q3/2024, it is unlikely that the BoE will revert to rate cuts as quickly as markets expect – especially given the accelerating wage dynamics in the UK labor market. According to the BoE’s measure of “underlying” wage growth, which adjusts headline wage inflation data for pandemic effects from furloughs and shifting labor composition, wages are growing at a 4.2% year-over-year rate (Chart 14). The BoE’s own modeling work indicates that 2.9 percentage points of that wage growth is due to the level of short-term inflation expectations, with only 0.9 percentage points coming from productivity growth. Thus, the BoE cannot let its foot off the monetary brake until short-term inflation expectations fall substantially from current elevated levels – especially with employment indicators still pointing to a very tight supply-constrained, post-COVID UK labor market. Chart 14A Wage-Price Spiral In The UK?
Misery Loves Company
Misery Loves Company
Given that interplay of rising headline inflation, elevated inflation expectations and tight labor markets, the BoE will likely be forced to begin unwinding the current rate hiking cycle later than markets expect. This will eventually lead to an inversion of the UK Gilt yield curve as the BoE pushes policy rates to restrictive territory and the UK economy falls into recession faster than other countries (like the US). Chart 15Stay Overweight UK Gilts, With A Curve Flattening Bias
Stay Overweight UK Gilts, With A Curve Flattening Bias
Stay Overweight UK Gilts, With A Curve Flattening Bias
We still believe that the Fed is more likely than the BoE to fully follow through on market-discounted rate hikes over the next year, which was a major reason why we upgraded our cyclical recommendation on UK Gilts to overweight back in May. However, with the BoE now under more pressure to wring high inflation out of the UK economy by keeping policy tighter for longer, we also see value in positioning for that eventual inversion of the UK Gilt curve (Chart 15). We see the sequencing as being inversion first, and relative Gilt outperformance later, although we do not expect the relative performance of Gilts to worsen with the UK economy set to enter recession before other major economies. Importantly, the forward rates in the Gilt curve are still priced for a somewhat steeper yield curve, making curve flattening trades along the entire curve attractive as positive carry trades that pay you to wait for the eventual policy driven inversion. The 2-year/10-year and 2-year/30-year flatteners look particularly attractive from that carry-focused perspective. Bottom Line: The BoE– under increasing political pressure for its relatively timid response to the massive UK inflation overshoot – is now forecasting a long policy-induced recession as the only way to tame UK inflation expected to reach 13% by year-end. Expect UK Gilts to be a relative outperformer within developed bond markets over the next 12-18 months, and enter positive carry Gilt curve flatteners now to benefit from the inevitable inversion of the curve. Robert Robis, CFA Chief Fixed Income Strategist rrobis@bcaresearch.com GFIS Model Bond Portfolio Recommended Positioning Active Duration Contribution: GFIS Recommended Portfolio Vs. Custom Performance Benchmark
Misery Loves Company
Misery Loves Company
The GFIS Recommended Portfolio Vs. The Custom Benchmark Index Global Fixed Income - Strategic Recommendations* Cyclical Recommendations (6-18 Months)
Misery Loves Company
Misery Loves Company
Nonfarm productivity contracted by 4.6% on an annualized q/q basis in Q2, following a downwardly revised 7.4% decline in the previous quarter, and marking the largest two-quarter contraction in productivity on record. Meanwhile, Unit Labor Costs (ULC) grew by…