Developed Countries
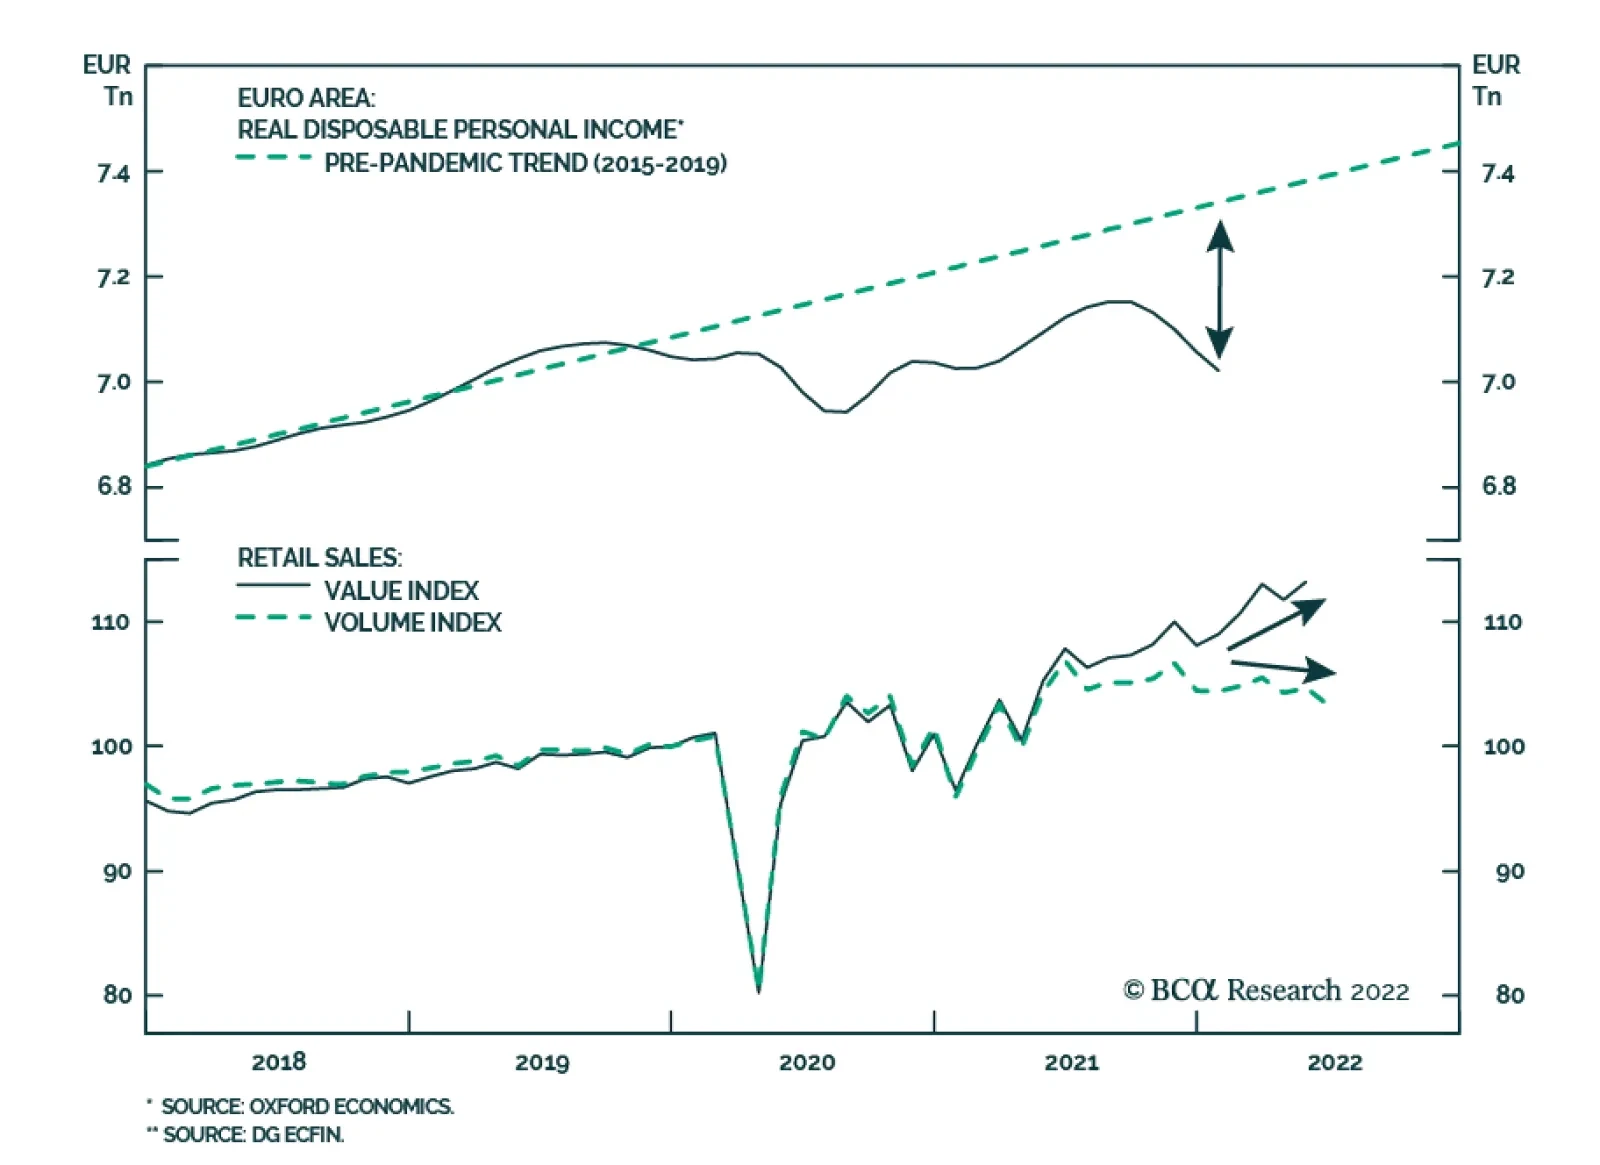
Eurozone retail sales disappointed in June. The 3.7% y/y contraction in sales volumes marks the first annual decline since February 2021 and is significantly worse than expectations of a 1.7% decrease. Similarly, the 1.2% m/m drop disappointed expectations…
Following the recent sharp post-FOMC rally, BCA Research’s Global Investment Strategy service has shifted their 12-month equity recommendation from overweight to neutral. They expect stock prices to rise further during the remainder of the year as US…

Executive Summary Government bond yields worldwide are falling due to fears of a global recession that will lead to monetary easing in 2023. This pricing is too optimistic with inflation likely to remain well above central bank targets next year. Even though US real GDP contracted modestly in the first half of 2022, the broader flow of US economic data is more consistent with an economy that is slowing substantially but not yet in recession. The Fed welcomes sharply slower growth to deal with high inflation, but will not unwind the 2022 rate hikes as quickly as markets expect given sticky core/wage inflation. The Fed rate cuts now discounted for 2023 will likely not be delivered. No Major Recessionary Signal From Global Yield Curves … Yet
No Major Recessionary Signal From Global Yield Curves . . . Yet
No Major Recessionary Signal From Global Yield Curves . . . Yet
Bottom Line: Falling global bond yields have helped stabilize risk assets – a path that will eventually lead to a rebound in yields if easier financial conditions help avoid a deep recession. Stay neutral overall duration exposure in global bond portfolios. The Great Recession Debate Begins Global bond yields have seen substantial declines over the past few weeks, as the market narrative has quickly changed from surging inflation and rate hikes to imminent recession and eventual rate cuts (Chart 1). The truth is somewhere in the middle, with global inflation in the process of peaking and global growth slowing rapidly but not yet in full-blown recession. Related Report Global Fixed Income StrategyMixed Messages & Range-Bound Bond Yields Bond markets are expecting central banks, most importantly the Fed, to quickly abandon the fight against high inflation for a new battle to tackle decelerating economic growth. The problem for investors is that weaker growth is needed – and, indeed, welcomed by policymakers - to create economic slack to help bring down elevated inflation. There is little evidence of such a disinflationary slack being created, with unemployment rates still near cyclical lows in the US, Europe and most of the developed world. The link between longer-term bond yields and shorter-term interest rate expectations remains strong in an environment of very flat government yield curves. For example, in the US, the 10-year Treasury yield has fallen from a peak of 3.47% in mid-June to 2.67% at the end of July. Over the same period, the 1-month interest rate, two-years ahead priced into the US overnight index swap (OIS) curve fell from a peak of 3.1% to 2.1% (Chart 2). Chart 1A Downward Adjustment Of Interest Rate Expectations
A Downward Adjustment Of Interest Rate Expectations
A Downward Adjustment Of Interest Rate Expectations
Chart 2A Lower Trajectory For Rates Priced In As Growth Slows
A Lower Trajectory For Rates Priced In As Growth Slows
A Lower Trajectory For Rates Priced In As Growth Slows
An even more dramatic decline in yields has been seen in Europe. The 10-year German Bund yield has fallen from a mid-June peak of 1.75% to 0.83% at the end of July, while the 1-month/2-year forward European OIS rate fell from 2.5% to 1.1%. The 2-year German yield, most sensitive to ECB rate hike expectations, also fell dramatically from 1.15% to 0.24%. There have also been substantial declines in bond yields and rate expectations in the UK, Canada and Australia over the past six weeks. As central banks continue to raise policy rates towards levels perceived to be at least neutral, if not mildly restrictive, there should a stronger correlation between future rate hike expectations and longer-term bond yields. Put another way, yield curves tend to flatten and eventually invert as policymakers move rates to levels that should slow growth and, eventually, reduce inflation. Currently, the “global” 2-year/10-year government bond yield curve, using Bloomberg Global Treasury index data, is slightly inverted at -13bps (Chart 3). More deeper curve inversions typically precede major contractions in global growth and equity prices. Chart 3No Major Recessionary Signal From Global Yield Curves . . . Yet
No Major Recessionary Signal From Global Yield Curves . . . Yet
No Major Recessionary Signal From Global Yield Curves . . . Yet
At the moment, global equities have performed in line with deeper curve inversions and contracting growth, with the MSCI World equity index down -7% on a year-over-year basis (bottom panel). Yet actual global growth is not yet in contraction. Global industrial production, while slowing, is still growing at a +3% year-over-year rate. The global manufacturing PMI remains above 50, indicative of a still-expanding manufacturing sector. Euro area, which is widely believed to already be in recession, saw real GDP growth (non-annualized) of +0.5% and +0.7%, respectively, in Q1 and Q2 of this year. Meanwhile, US real GDP shrank modestly over the first half of 2022, down only -0.6% (non-annualized) over Q1 and Q2, but with no corroborating evidence of recession from the labor market with the headline unemployment rate falling from 4.0% to 3.6% over that same period. Further adding to the confusing mix of signals between yield curves and growth is that the curve inversion at the global level is not yet evident across all countries. For example, the 2-year/10-year curve is inverted in the US and Canada, countries where central banks have been more aggressive on hiking rates in 2022 (Chart 4A) Yet in both countries, there have only been moderate declines in leading economic indicators and composite PMIs (combining manufacturing and services). In contrast, the 2-year/10-year curve in Germany and the UK – where the ECB and Bank of England have delivered fewer rates than the Fed and Bank of Canada – remains positively sloped but with similar moderate declines in leading economic indicators and composite PMIs to those seen in the US and Canada (Chart 4B). Chart 4AA Policy-Driven Slowdown In North America
A Policy-Driven Slowdown In North America
A Policy-Driven Slowdown In North America
Chart 4BAn Energy-Driven Slowdown In Europe
An Energy-Driven Slowdown In Europe
An Energy-Driven Slowdown In Europe
Chart 5Central Banks Cannot Pivot Dovishly Against This Backdrop
Central Banks Cannot Pivot Dovishly Against This Backdrop
Central Banks Cannot Pivot Dovishly Against This Backdrop
The deceleration of growth seen so far in this countries is nowhere near enough for central banks to begin contemplating a pivot away from hawkish rate hikes in 2022 to dovish rate cuts in 2023/24, as markets are now discounting. Inflation rates remain far too elevated, and labor markets remain far too tight, for policymakers to switch from the brake pedal to the gas pedal (Chart 5). This exposes global bond yields to a rebound from recent lows as central banks disappoint the market’s growing belief that policymakers’ focus will turn to growth from inflation. The language from recent central bank policy decisions, from the ECB’s 50bp hike on July 21 to the Fed’s 75bp hike last week to yesterday’s 50bp hike by the Reserve Bank of Australia, has been consistent, calling for a continued need to tighten policy. All three central banks essentially abandoned forward guidance, but described future rate moves as being “data dependent”, particularly inflation data. There is likely to be some relief from elevated inflation rates over the next few months. There have already been substantial declines in the growth of commodity prices, with the CRB Raw Industrials index now contracting in year-over-year terms (Chart 6). Global shipping costs and supplier delivery times have also declined, as evidence of some easing of supply chain disruptions that is helping bring down goods inflation. Yet given the starting point of such high headline inflation rates – at or above 9% in the US, UK and euro area – it is unlikely that there will be enough disinflation from the commodity/goods space to quickly bring inflation down by enough for central banks to breathe easier. This is especially true given that stickier domestically generated inflation stemming from wages and services will remain well above central bank targets over at least the next year, or at least until there is a substantial increase in slack-producing unemployment (i.e. a recession). What does all this mean for our view on the direction of global bond yields? We still see the current environment as more consistent with broad trading ranges for yields, rather than the start of a new major downtrend or uptrend. Europe was the one exception to this view, given how markets were pricing in a rise in ECB policy rates that was too aggressive, but even that has now corrected after the dramatic collapse in core European yields from the mid-June peak. Our Global Duration Indicator has been calling for a loss of cyclical upward momentum of bond yields in the latter half of 2022, which is now starting to play out (Chart 7). That indicator is focused on growth indicators like our global leading economic indicator and the ZEW expectations index for the US and Europe, all of which have been declining for the past several months. Chart 6Global Inflation Is Peaking
Global Inflation Is Peaking
Global Inflation Is Peaking
Chart 7Stay Neutral On Global Duration Exposure
Stay Neutral On Global Duration Exposure
Stay Neutral On Global Duration Exposure
However, there is a potential note of economic optimism from another key component of the Global Duration Indicator - the diffusion index of our global leading economic indicator, which measures the number of countries with rising leading indicators versus those with falling ones. That diffusion index has hooked up as the leading economic indicators of some important countries that are typically leveraged to global growth – China, Japan, Brazil, Korea and Malaysia – have started to move higher. If this trend continues in the months ahead, our Duration Indicator may signal a reacceleration of global bond yield momentum in the first half of 2023 as the global growth outlook improves. Bottom Line: Bond markets are overreacting to slowing global growth momentum by pricing in a quick reversal of 2022 rate hikes in 2023 across the developed world. Do not chase bond yields lower. The Fed Will Respond To Inflation Before Recession The Q2/2022 US GDP report showed an annualized decline of -0.9%, following on the annualized -1.6% fall in Q1 real GDP (Chart 8). This fulfills the so-called “technical definition” of a recession widely cited by the financial media. However, the official arbiters of recession dating – the National Bureau of Economic Research, or NBER – use a broader list of data to identify recessions that focus on income growth, employment and industrial production. None of those indicators contracted in the first half of the year, when the GDP-defined recession allegedly took place. We are sympathetic to the view that the US has not yet entered recession. However, recession odds are increasing, with many reliable cyclical data series slowing to a pace that has preceded past recessions. In Chart 9, we show a “cycle-on-cycle” comparison of the latest readings on some highly cyclical US economic data with readings from past recessions dating back to the late 1970s. In the chart, the data series are lined up such that the vertical line represents the NBER-designated start date of each recession, starting with the 1979/80 recession up to the 2008 recession. We show both the average path for each series across all of those recessions (the dotted line) and the range of outcomes from each recession (the shaded zone). Given the unique nature of the 2020 COVID recession, which was limited to just one quarter of collapsing activity due to pandemic lockdowns rather than typical business cycle forces, we did not include that episode in this chart. Chart 8No US Growth In H1/2022
No US Growth In H1/2022
No US Growth In H1/2022
The selected variables in this cycle-on-cycle analysis are: The year-over-year growth of the Conference Board leading economic indicator The ISM manufacturing index The University Of Michigan consumer expectations index The year-over-year growth of housing starts The year-over-year growth rate of non-financial (top-down) corporate profits. Chart 9The US Is Definitely Flirting With Recession
The US Is Definitely Flirting With Recession
The US Is Definitely Flirting With Recession
All five series selected have slowed over past several months, consistent with the run-up to previous recessions. However, in terms of timing, not all of the indicators shown are at levels that would be consistent with the US already being in a recession, as the real GDP contractions in Q1 and Q2 would suggest. Typically, the ISM index falls below 50 at the start of the recession, while the growth in the leading indicator turns negative about six months before the start of the recession. The current readings on both are still modestly above levels seen at the start of those past recessions. Corporate profit growth typically contracts for a full year ahead of recessions, and the latest complete reading available from Q1 was still showing positive, albeit slowing, growth. Chart 10The Fed Is OK With This Outcome, Given High Inflation
The Fed Is OK With This Outcome, Given High Inflation
The Fed Is OK With This Outcome, Given High Inflation
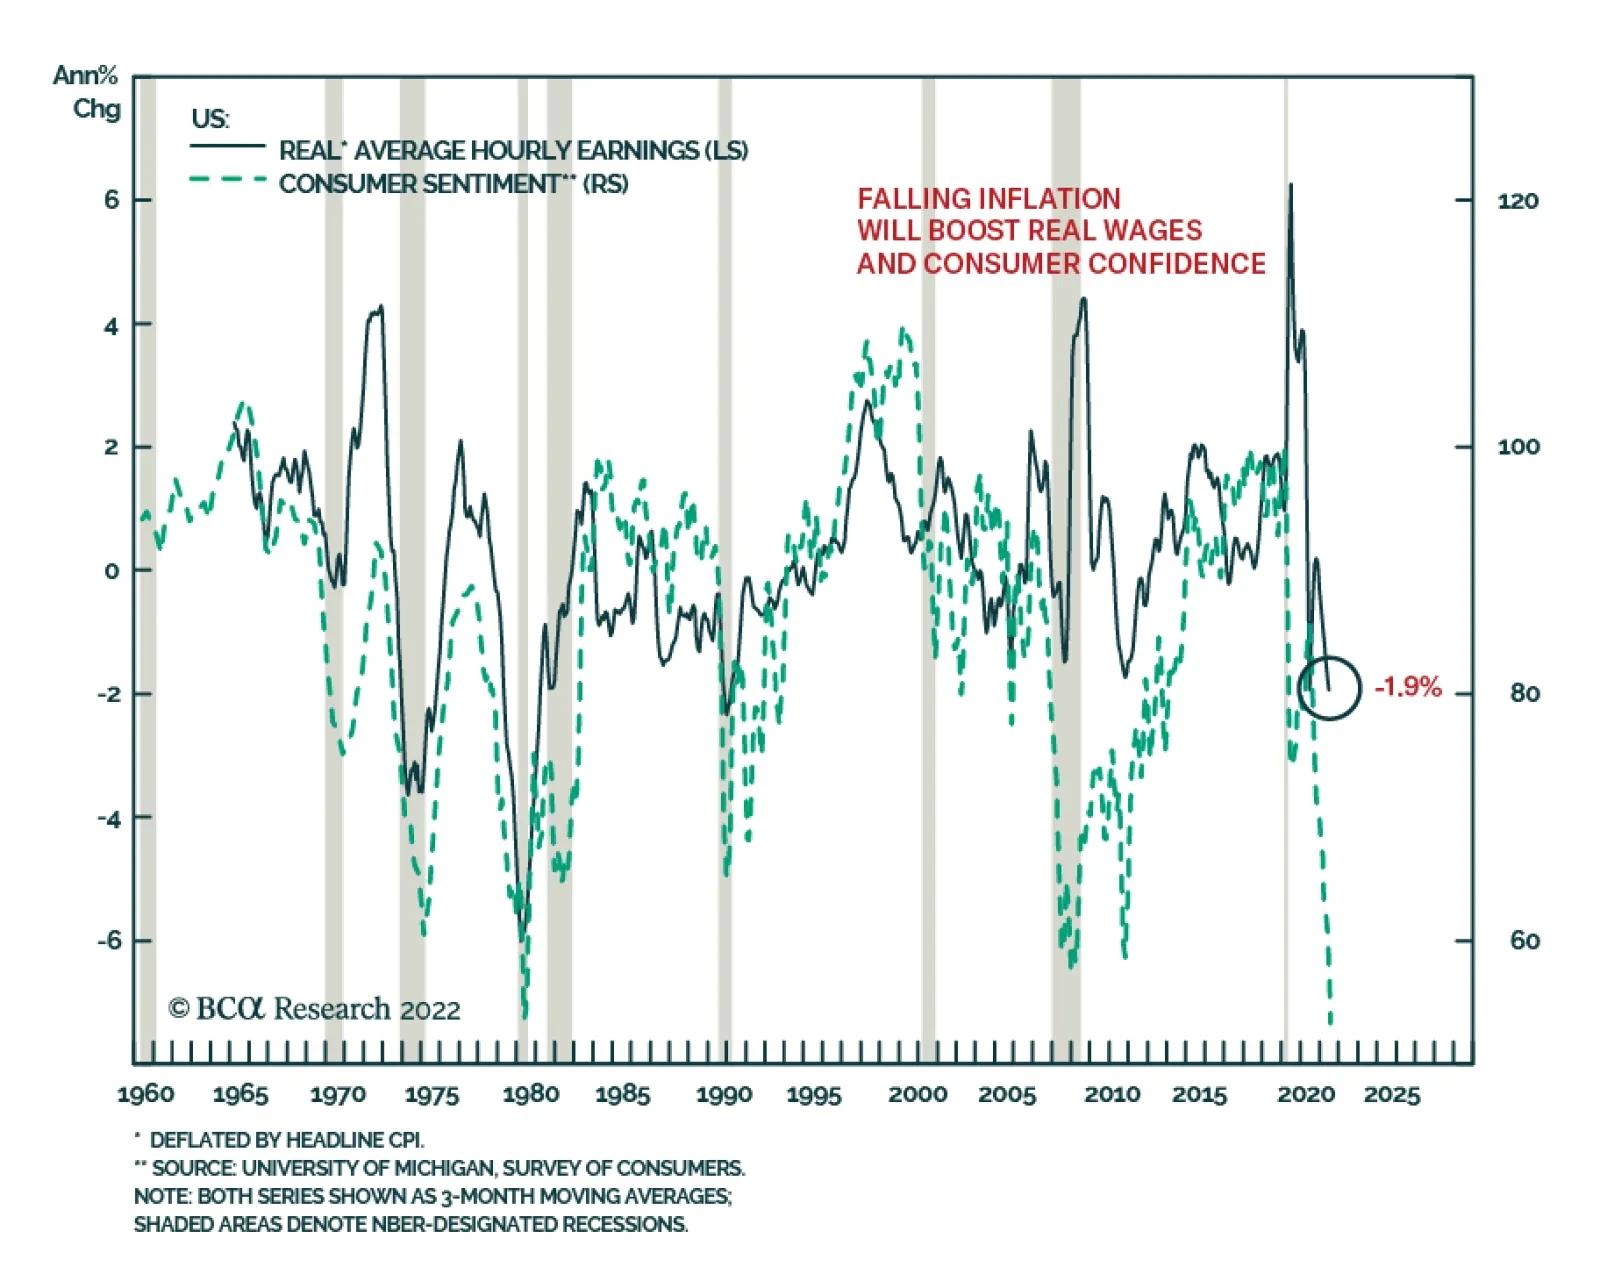
Some of the indicators shown are looking recessionary. The current contraction in the growth of housing starts is in line with the timing from the average of past recessions. The same can be said for falling consumer expectations, although the latest decline is particularly severe compared to past recessions. From the point of view of investors, the semantics over the “official” declaration of a recession are irrelevant. There has already been a major pullback in US equity markets and widening of US corporate credit spreads as investors have priced in substantially slower growth – and the Fed tightening that is helping engineer that economic outcome. The pullback in risk assets has tightened US financial conditions, exacerbating the hit to business and consumer confidence from high inflation and declining real incomes (Chart 10). Equity and credit markets did stage healthy recoveries in the month of June as markets began to price out Fed rate hikes in response to the US potentially entering recession. However, Fed rate hikes have already flattened the US Treasury curve, which has raised the odds of a US recession NEXT year. According to the New York Fed’s recession probability model, the current spread between the 10-year US Treasury yield and the 3-month US Treasury bill rate of 23bps translates to a 26% probability of a US recession occurring one year from now (Chart 11). That model uses data going back to the 1960s, which includes the Volcker-era Fed tightenings in the 1970s that resulted in dramatic increases in real US interest rates and steep inversions of the US Treasury curve. Using the post-1980 range of recession probabilities, ranging from 0-50%, the latest 26% probability is more like a 50/50 bet on a 2023 US recession. Chart 11A US Recession Is More Likely In 2023, Says The UST Curve
A US Recession Is More Likely In 2023, Says The UST Curve
A US Recession Is More Likely In 2023, Says The UST Curve
The Fed will need to continue delivering rate hikes until there is evidence that core inflation has peaked and will begin the path of falling back to the Fed’s 2% target. That is certainly not a story for 2022, or even for 2023, given the rapid acceleration of US wage growth (Chart 12). If the Fed were to begin pivoting away from rate hikes now, with the Atlanta Fed Wage Tracker and the Employment Cost Index accelerating at a 5-7% pace, the result would be an unwanted increase in inflation expectations. Chart 12The Fed Must Stay Hawkish With Labor Costs Still Accelerating
The Fed Must Stay Hawkish With Labor Costs Still Accelerating
The Fed Must Stay Hawkish With Labor Costs Still Accelerating
The Fed is fighting hard to regain the inflation-fighting credibility lost in 2022 when “Team Transitory” ruled the FOMC and policy did not respond to rapidly rising inflation. The Fed’s aggressive rate hikes in 2022 have helped restore some of that credibility with bond markets, judging by the pullback in longer-term CPI-based TIPS breakevens seen in recent months, which are now back in line with the 2.3-2.5% range we have deemed consistent with the Fed’s 2% PCE inflation target (Chart 13). The evidence from survey-based measures of inflation expectations is a bit mixed, but still consistent with improved Fed credibility. The New York Fed’s Consumer Survey shows 1-year-ahead inflation expectations still elevated at 6.8%, but the 3-year-ahead expectation has drifted back below 4% (bottom panel). The University of Michigan 5-10 year consumer inflation expectation is even lower, falling to 2.8% in July from 3.1% in June. The Fed will not risk those hard-earned declines in longer-term inflation expectations by turning dovish too quickly – especially as it is not year clear if the US is even in a recession. Investors betting on a dovish pivot by the Fed before year end, leading to substantial rate cuts in 2023, are likely to be disappointed. In our view, this is setting up a potential opportunity to reduce US duration exposure to position for a rebound in Treasury yields. However, a meaningful increase in yields will be difficult to achieve, as yields are still adjusting to downside data surprises and duration positioning among investors is still below benchmark, according to the JPMorgan client duration survey (Chart 14). We suggest staying neutral on US duration exposure, for now, until the technical backdrop becomes more conducive to higher yields. Chart 13Mixed Messages On US Inflation Expectations
Mixed Messages On US Inflation Expectations
Mixed Messages On US Inflation Expectations
Chart 14Stay Neutral On US Duration - For Now
Stay Neutral On US Duration - For Now
Stay Neutral On US Duration - For Now
Bottom Line: US recession odds have increased, but the economy is not yet in recession. The Fed welcomes sharply slower growth to deal with high inflation, but will not unwind the 2022 rate hikes as quickly as markets expect given sticky core/wage inflation. The Fed rate cuts now discounted for 2023 will likely not be delivered. Treasury yields are more likely to stay rangebound over the next 3-6 months than move lower. Robert Robis, CFA Chief Fixed Income Strategist rrobis@bcaresearch.com GFIS Model Bond Portfolio Recommended Positioning Active Duration Contribution: GFIS Recommended Portfolio Vs. Custom Performance Benchmark
Dovish Central Bank Pivots Will Come Later Than You Think
Dovish Central Bank Pivots Will Come Later Than You Think
The GFIS Recommended Portfolio Vs. The Custom Benchmark Index Global Fixed Income - Strategic Recommendations*
Dovish Central Bank Pivots Will Come Later Than You Think
Dovish Central Bank Pivots Will Come Later Than You Think
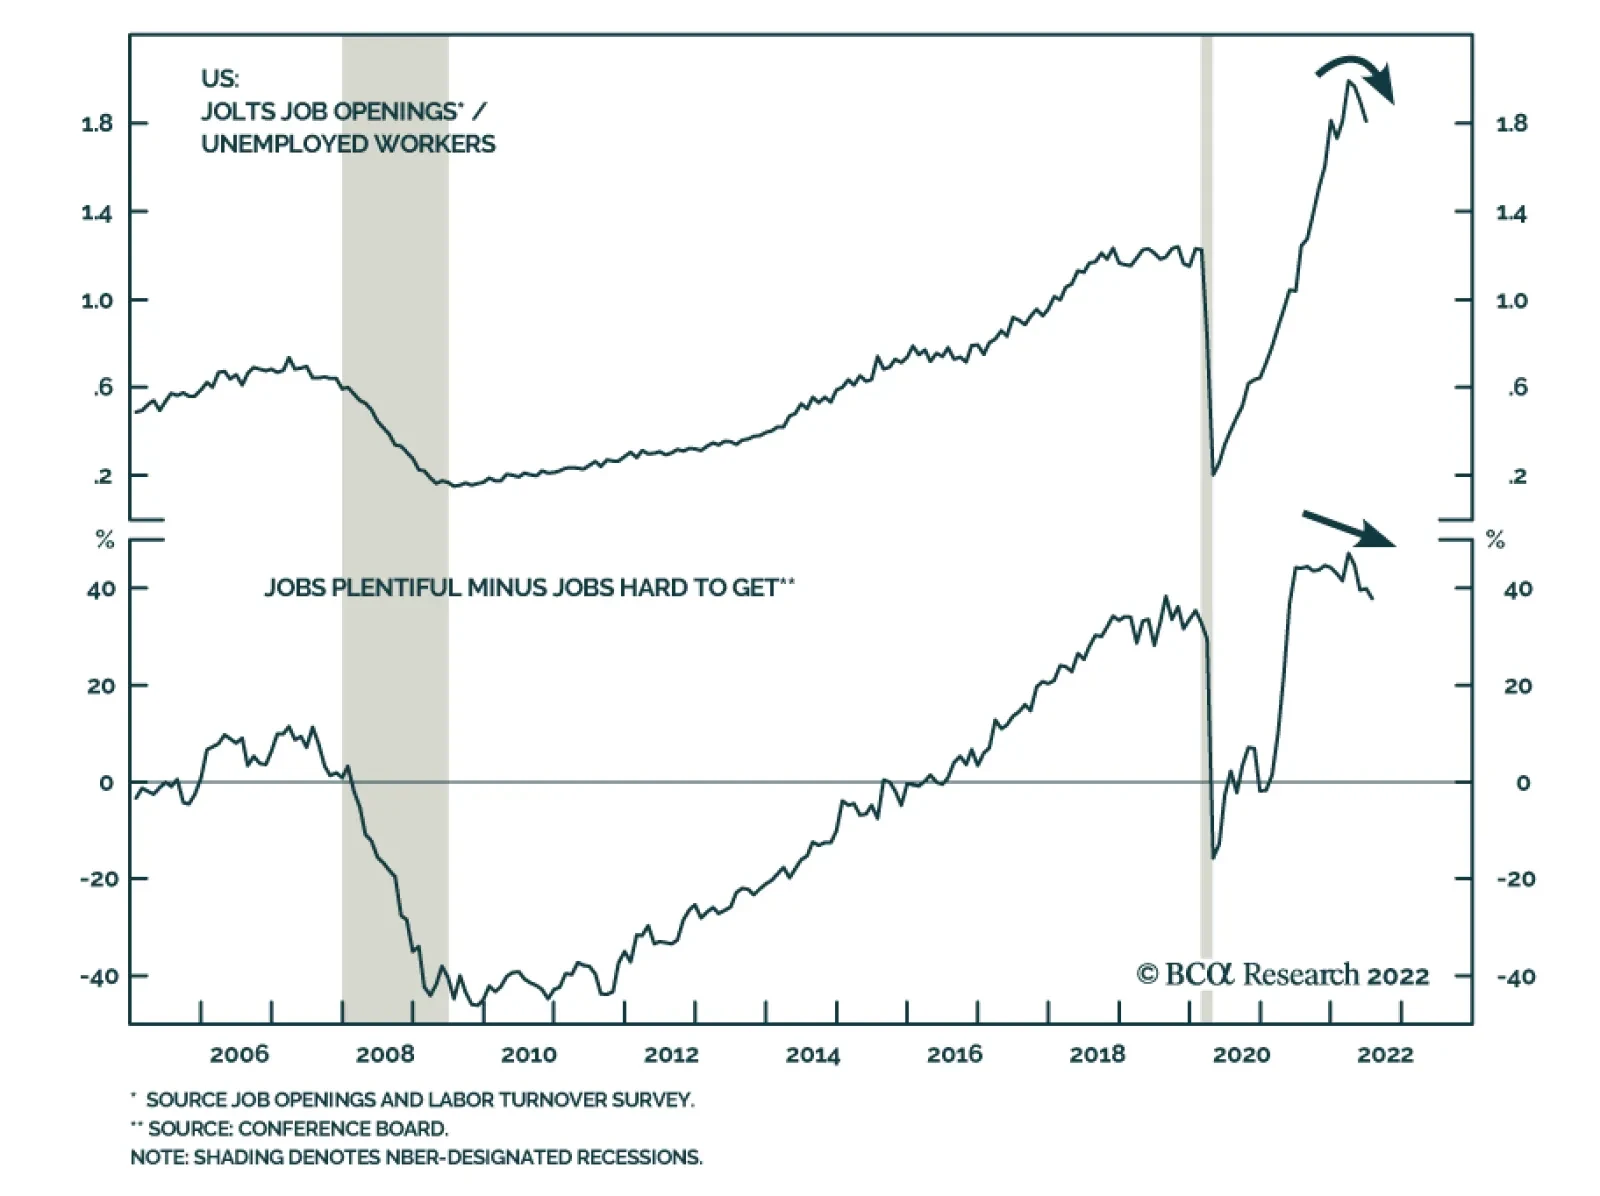
The US JOLTS report showed the number of job openings decreased to a lower-than-expected 10.7 million in June, from 11.3 million in May, marking a third consecutive month of decline and the smallest increase since September 2021. Retail trade accounted for…
As expected, the Reserve Bank of Australia raised the cash rate by 50bps on Tuesday to 1.85%, marking its fourth consecutive monthly rate hike. The cumulative increase of 175bps since May reflects efforts to contain inflationary pressures. Both headline CPI…
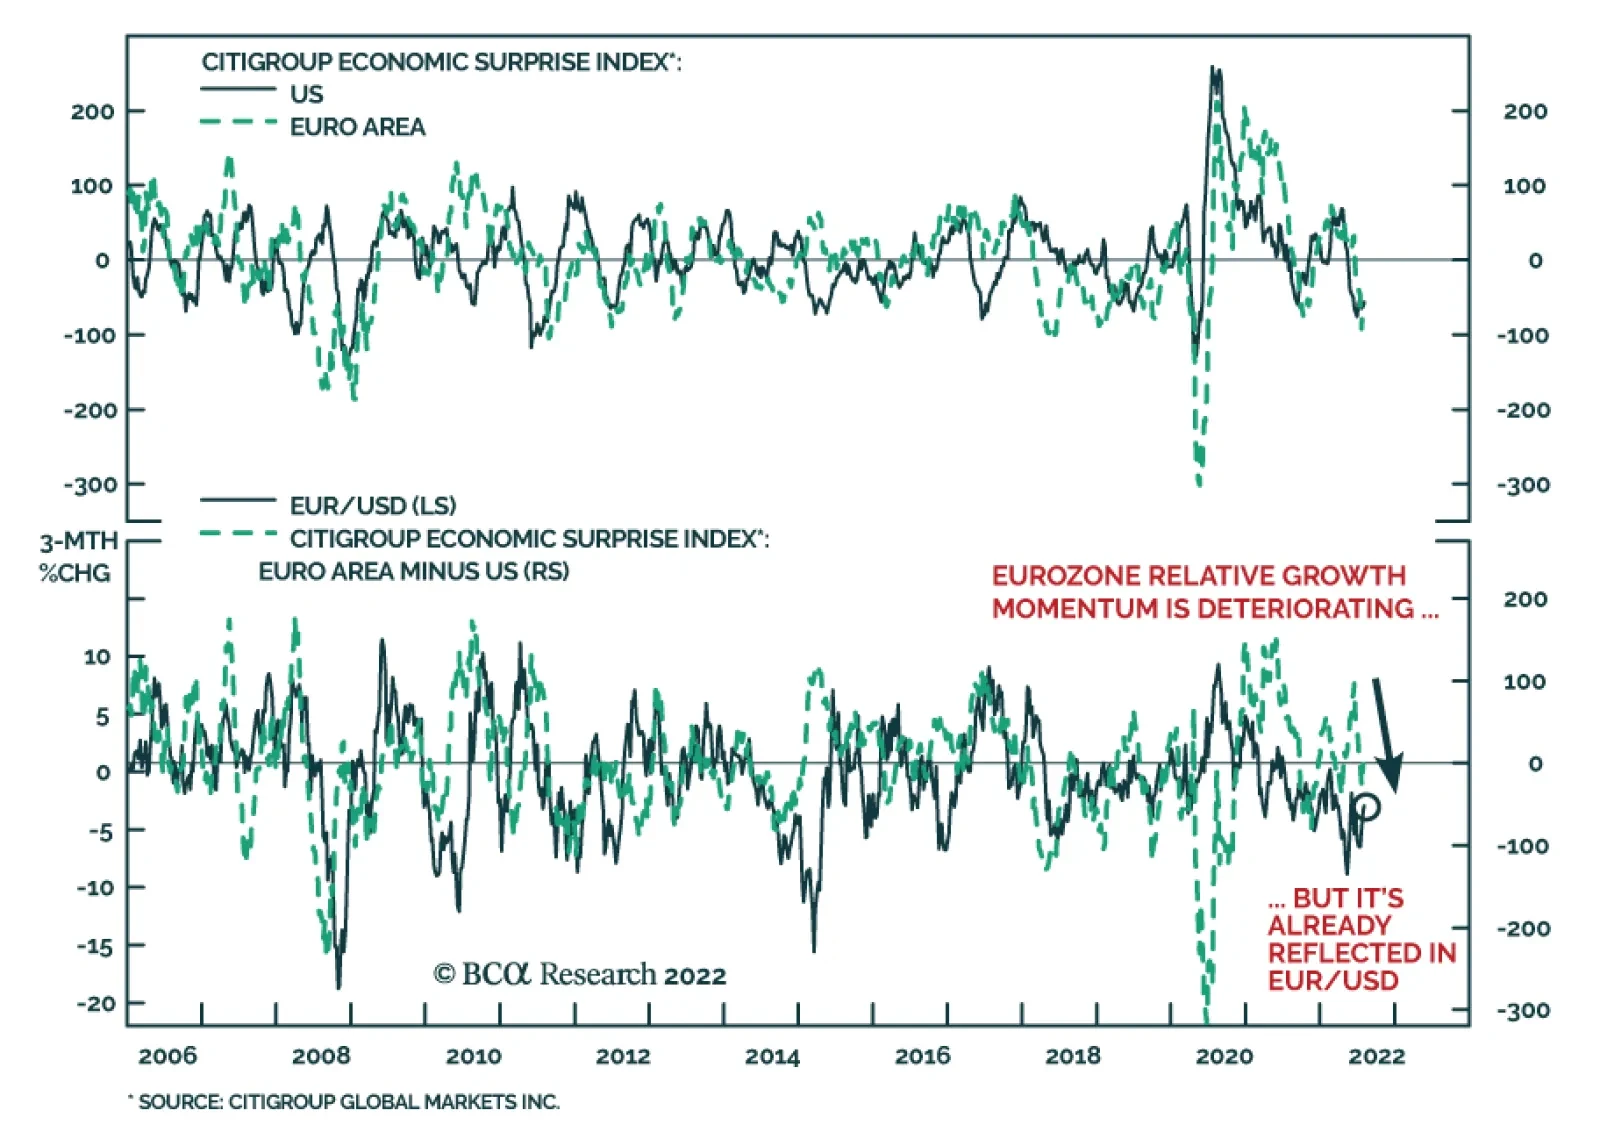
The Citigroup economic surprise indices for the US and the Euro Area are both deep in negative territory. Although the US index was first to cross below 0 in mid-May, the Eurozone measure turned negative towards the end of June and has recently been…
BCA Research’s Geopolitical Strategy service concludes that the US-China confrontation over Taiwan could cause a dramatic escalation in strategic tensions. Speaker of the US House of Representatives Nancy Pelosi arrived in Taiwan on Tuesday, defying…
Highlights Chart 1Are Expectations Too Dovish?
Are Expectations Too Dovish?
Are Expectations Too Dovish?
The bond market is now priced for the fed funds rate to peak at 3.44% in January and then head back down to 2.79% by the end of 2023 (Chart 1). We strongly push back against the idea that the Fed will be cutting rates in 2023. While inflation will fall during the next few months, strong wage growth suggests that it will be sticky above the Fed’s 2% target for some time. What’s more, comments from yesterday’s ISM PMI release show that “companies continue to hire at strong rates”. Our sense is that it will be difficult to push the unemployment rate up significantly even as economic activity slows. Given that inflation is likely to fall during the next few months, we recommend keeping portfolio duration ‘at benchmark’ for the time being. However, we are now actively looking for an opportunity to reduce portfolio duration and we could change our recommended allocation in the near term. Stay tuned. Feature Table 1 Recommended Portfolio Specification Table 2Fixed Income Sector Performance
Don't Bet On A Fed Pivot
Don't Bet On A Fed Pivot
Table 3A Corporate Sector Relative Valuation And Recommended Allocation* Table 3BCorporate Sector Risk Vs. Reward*
Don't Bet On A Fed Pivot
Don't Bet On A Fed Pivot
Investment Grade: Underweight Chart 2Investment Grade Market Overview
Investment Grade Market Overview
Investment Grade Market Overview
Investment grade corporate bonds outperformed the duration-equivalent Treasury index by 109 basis points in July, bringing year-to-date excess returns up to -274 bps. The average index option-adjusted spread tightened 11 bps on the month and it currently sits at 144 bps. Similarly, our quality-adjusted 12-month breakeven spread moved down to its 54th percentile since 1995 (Chart 2). A report from a few months ago made the case for why investors should underweight investment grade corporate bonds on a 6-12 month investment horizon.1 The main rationale for this recommendation is that the slope of the Treasury curve suggests that the credit cycle is in its late stages. Corporate bond performance tends to be weak during periods when the yield curve is very flat or inverted. Despite our underweight 6-12 month investment stance, we wouldn’t be surprised to see spreads narrow further during the next couple of months as inflation finally shows signs of rolling over. That said, the persistent removal of monetary accommodation and inverted yield curve will limit how much spreads can compress. A recent report dug deeper into the corporate bond space and concluded that investment grade-rated Energy bonds offer exceptional value on a 6-12 month horizon.2 That report also concluded that long maturity investment grade corporates are attractively priced relative to short maturity bonds. High-Yield: Neutral Chart 3High-Yield Market Overview
High-Yield Market Overview
High-Yield Market Overview
High-Yield outperformed the duration-equivalent Treasury index by 434 basis points in July, bringing year-to-date excess returns up to -493 bps. The average index option-adjusted spread tightened 100 bps on the month to reach 469 bps, 100 bps above the 2017-19 average and 62 bps below the 2018 peak. The 12-month spread-implied default rate – the default rate that is priced into the junk index assuming a 40% recovery rate on defaulted debt and an excess spread of 100 bps – moved lower in July. It currently sits at 6.2% (Chart 3). As is the case with investment grade, there’s a good chance that high-yield spreads can continue their relief rally during the next couple of months as inflation falls. Due to the flatness of the yield curve, we think it will be difficult for spreads to move below the average seen during the last tightening cycle (2017-19). However, even a move back to average 2017-19 levels would equate to roughly 5% of excess return for the junk index if it is realized over a six month period. This potential return is the main reason to prefer high-yield over investment grade in a US bond portfolio. While we maintain a neutral (3 out of 5) allocation to high-yield for now, we will be inclined to downgrade the sector if spreads tighten to the 2017-19 average or if core inflation falls back to 4%.3 MBS: Underweight Chart 4MBS Market Overview
MBS Market Overview
MBS Market Overview
Mortgage-Backed Securities outperformed the duration-equivalent Treasury index by 129 basis points in July, bringing year-to-date excess returns up to -44 bps. We discussed the outlook for Agency MBS in a recent report.4 We noted that MBS’s poor performance in 2021 and early-2022 was driven by duration extension. Fewer homeowners refinanced their loans as mortgage rates rose, and the MBS index’s average duration increased (Chart 4). But now, the index’s duration extension is at its end. The average convexity of the MBS index is close to zero (panel 3), meaning that duration is now insensitive to changes in rates. This is because hardly any homeowners have the incentive to refinance at current mortgage rates. The implication is that excess MBS returns will be stronger going forward. That said, we still don’t see enough value in MBS spreads to increase our recommended allocation. The average index spread for conventional 30-year Agency MBS remains close to its lowest level since 2000 (panel 4). At the coupon level, we observe that low-coupon MBS have much higher duration than high-coupon MBS and that convexity is close to zero for the entire coupon stack. This makes the relative coupon trade a direct play on bond yields. We had been recommending that investors favor low-coupon (1.5%-2.5%) MBS over high-coupon (3%-4.5%) MBS to take advantage of falling bond yields (bottom panel). Now that bond yields have fallen, we think it is wise to take profits on this position and shift to a neutral allocation across the coupon stack. Emerging Market Bonds (USD): Underweight Chart 5Emerging Markets Overview
Emerging Markets Overview
Emerging Markets Overview
Emerging Market bonds outperformed the duration-equivalent Treasury index by 31 basis points in July, bringing year-to-date excess returns up to -708 bps. EM Sovereigns outperformed the Treasury benchmark by 155 bps on the month, bringing year-to-date excess returns up to -784 bps. The EM Corporate & Quasi-Sovereign Index underperformed by 45 bps, dragging year-to-date excess returns down to -659 bps. The EM Sovereign Index outperformed the duration-equivalent US corporate bond index by 53 bps in July. The yield differential between EM sovereigns and duration-matched US corporates remains negative (Chart 5). As such, we continue to recommend a maximum underweight allocation to EM sovereigns. The EM Corporate & Quasi-Sovereign Index underperformed duration-matched US corporates by 116 bps in July. The index continues to offer a significant yield advantage versus duration-matched US corporates (panel 4). As such, we continue to recommend a neutral (3 out of 5) allocation to the sector. EM currencies continue to struggle versus the US dollar (bottom panel), and depreciating exchange rates will continue to act as a headwind for USD-denominated EM bond performance. Our Emerging Market Strategy service expects continued near-term weakness in EM currencies.5 Municipal Bonds: Overweight Chart 6Municipal Market Overview
Municipal Market Overview
Municipal Market Overview
Municipal bonds underperformed the duration-equivalent Treasury index by 2 basis points in July, dragging year-to-date excess returns down to -169 bps (before adjusting for the tax advantage). We view the municipal bond sector as better placed than most to cope with the recent bout of spread volatility. As we noted in a recent report, state & local government revenue growth has been strong, but governments have been slow to hire.6 The result is that net state & local government savings are incredibly high (Chart 6) and it will take some time to deplete those coffers, even as economic growth slows and federal fiscal thrust turns to drag. On the valuation front, munis have cheapened up relative to both Treasuries and corporates during the past few months. The 10-year Aaa Muni / Treasury yield ratio is currently 85%, up significantly from its 2021 trough of 55%. The yield ratio between 12-17 year munis and duration-matched corporate bonds is also up significantly off its lows (panel 2). We reiterate our overweight allocation to municipal bonds within US fixed income portfolios, and we continue to have a strong preference for long-maturity munis. The yield ratio between 17-year+ General Obligation Municipal bonds and duration-matched US corporates is 89%. The same measure for 17-year+ Revenue bonds stands at 95%, just below parity even without considering municipal debt’s tax advantage. Treasury Curve: Buy 2-Year Bullet Versus Cash/5 Barbell Chart 7Treasury Yield Curve Overview
Treasury Yield Curve Overview
Treasury Yield Curve Overview
The Treasury curve bull-flattened out to the 10-year maturity point in July. The 2-year/10-year Treasury slope flattened 28 bps on the month while the 5-year/30-year slope steepened 17 bps. The 2/10 and 5/30 slopes now stand at -22 bps and +30 bps, respectively. We closed our position long the 5-year bullet versus a duration-matched 2/10 barbell in a recent report.7 The reason for the move is that the 5-year note no longer offers a yield advantage versus the 2/10 barbell. That 2/5/10 butterfly spread has continued to compress during the past three weeks, and it now sits at -10 bps (Chart 7). In that same report we initiated a new recommendation: buy the 2-year bullet versus a duration-matched barbell consisting of cash and the 5-year note. This position offers a much more attractive yield advantage of 51 bps (bottom panel). Our new position will deliver strong returns if the 2-year/5-year Treasury slope steepens, something that is likely to occur if the market prices out the rate cuts that are currently discounted for next year. This would be in line with our base case expectation. However, if our base case is wrong and a deep recession forces the Fed to cut rates during the next 6-12 months, then our position should also benefit from a bull-steepening of the 2/5 slope. TIPS: Neutral Chart 8TIPS Market Overview
TIPS Market Overview
TIPS Market Overview
TIPS outperformed the duration-equivalent nominal Treasury index by 270 basis points in July, bringing year-to-date excess returns up to +256 bps. The 10-year TIPS breakeven inflation rate rose 20 bps on the month, moving back above the Fed’s 2.3% - 2.5% comfort zone (Chart 8). Meanwhile, our TIPS Breakeven Valuation Indicator now shows that TIPS are modestly cheap versus nominals (panel 2). We upgraded TIPS from underweight to neutral in a recent report.8 In that report we noted that TIPS valuation had improved considerably in recent months as the cost of inflation compensation embedded in the market trended down. For example, the 1-year CPI swap rate currently sits at 3.94%, down from a peak of 5.9% in June. Given our expectation that core inflation will be sticky around 4%, the cost of inflation compensation looks a lot more compelling than it did even a month ago. We also closed our long-standing recommendation to short 2-year TIPS in a report published two weeks ago.9 We made this change after the 2-year TIPS yield moved into positive territory for the first time since 2020, up from a 2021 low of -3.07% (bottom panel). We are not yet ready to upgrade TIPS to overweight, despite much improved valuation, because headline inflation is much more likely to trend lower than higher during the next few months. That said, if current valuations persist, we will likely be looking to upgrade TIPS once more before the end of the year. ABS: Overweight Chart 9ABS Market Overview
ABS Market Overview
ABS Market Overview
Asset-Backed Securities underperformed the duration-equivalent Treasury index by 10 basis points in July, dragging year-to-date excess returns down to -52 bps. Aaa-rated ABS underperformed by 10 bps on the month, dragging year-to-date excess returns down to -43 bps. Non-Aaa ABS underperformed by 11 bps on the month, dragging year-to-date excess returns down to -104 bps. During the past two years, substantial federal government support for household incomes caused US households to build up an extremely large buffer of excess savings. Nowhere is this more evident than in the steep drop in the amount of outstanding credit card debt that was witnessed in 2020 and 2021 (Chart 9). In 2022, consumers have started to re-lever. The personal savings rate was just 5.1% in June and the amount of outstanding credit card debt has recovered to its pre-COVID level (bottom panel). But while household balance sheets are starting to deteriorate, they remain exceptionally strong in level terms. In other words, it will be some time before we see enough deterioration to cause a meaningful uptick in consumer credit delinquencies. Investors should remain overweight consumer ABS and should take advantage of the high quality of household balance sheets by moving down the quality spectrum, favoring non-Aaa rated securities over Aaa-rated ones. Non-Agency CMBS: Overweight Chart 10CMBS Market Overview
CMBS Market Overview
CMBS Market Overview
Non-Agency Commercial Mortgage-Backed Securities outperformed the duration-equivalent Treasury index by 19 basis points in July, bringing year-to-date excess returns up to -175 bps. Aaa Non-Agency CMBS outperformed Treasuries by 18 bps on the month, bringing year-to-date excess returns up to -123 bps. Non-Aaa Non-Agency CMBS outperformed by 22 bps on the month, bringing year-to-date excess returns up to -319 bps. CMBS spreads remain wide compared to other similarly risky spread products and are currently slightly above their historic averages. Further, last week’s Q2 GDP report confirmed that commercial real estate (CRE) investment remains weak (Chart 10). Weak investment will continue to support CRE price appreciation which will benefit CMBS spreads. Agency CMBS: Overweight Agency CMBS underperformed the duration-equivalent Treasury index by 24 bps in July, dragging year-to-date excess returns down to -15 bps. The average index option-adjusted spread widened 9 bps on the month. It currently sits at 54 bps, close to its long-term average (bottom panel). Agency CMBS spreads also continue to look attractive compared to other similarly risky spread products. Stay overweight. Appendix A: The Golden Rule Of Bond Investing We follow a two-step process to formulate recommendations for bond portfolio duration. First, we determine the change in the federal funds rate that is priced into the yield curve for the next 12 months. Second, we decide – based on our assessments of the economy and Fed policy – whether the change in the fed funds rate will exceed or fall short of what is priced into the curve. Most of the time, a correct answer to this question leads to the appropriate duration call. We call this framework the Golden Rule Of Bond Investing, and we demonstrated its effectiveness in the US Bond Strategy Special Report, “The Golden Rule Of Bond Investing”, dated July 24, 2018. Chart 11 illustrates the Golden Rule’s track record by showing that the Bloomberg Barclays Treasury Master Index tends to outperform cash when rate hikes fall short of 12-month expectations, and vice-versa. At present, the market is priced for 78 basis points of rate hikes during the next 12 months. Chart 11The Golden Rule's Track Record
The Golden Rule's Track Record
The Golden Rule's Track Record
We can also use our Golden Rule framework to make 12-month total return and excess return forecasts for the Bloomberg Barclays Treasury index under different scenarios for the fed funds rate. Excess returns are relative to the Bloomberg Barclays Cash index. To forecast total returns we first calculate the 12-month fed funds rate surprise in each scenario by comparing the assumed change in the fed funds rate to the current value of our 12-month discounter. This rate hike surprise is then mapped to an expected change in the Treasury index yield using a regression based on the historical relationship between those two variables. Finally, we apply the expected change in index yield to the current characteristics (yield, duration and convexity) of the Treasury index to estimate total returns on a 12-month horizon. The below tables present those results, along with excess returns for a front-loaded and a back-loaded rate hike scenario. Excess returns are calculated by subtracting assumed cash returns in each scenario from our total return projections.
Don't Bet On A Fed Pivot
Don't Bet On A Fed Pivot
Appendix B: Butterfly Strategy Valuations The following tables present the current read-outs from our butterfly spread models. We use these models to identify opportunities to take duration-neutral positions across the Treasury curve. The following two Special Reports explain the models in more detail: US Bond Strategy Special Report, “Bullets, Barbells And Butterflies”, dated July 25, 2017, available at usbs.bcaresearch.com US Bond Strategy Special Report, “More Bullets, Barbells And Butterflies”, dated May 15, 2018, available at usbs.bcaresearch.com Table 4 shows the raw residuals from each model. A positive value indicates that the bullet is cheap relative to the duration-matched barbell. A negative value indicates that the barbell is cheap relative to the bullet. Table 4Butterfly Strategy Valuation: Raw Residuals In Basis Points (As Of July 29, 2022)
Don't Bet On A Fed Pivot
Don't Bet On A Fed Pivot
Table 5 scales the raw residuals in Table 4 by their historical means and standard deviations. This facilitates comparison between the different butterfly spreads. Table 5Butterfly Strategy Valuation: Standardized Residuals (As Of July 29, 2022)
Don't Bet On A Fed Pivot
Don't Bet On A Fed Pivot
Table 6 flips the models on their heads. It shows the change in the slope between the two barbell maturities that must be realized during the next six months to make returns between the bullet and barbell equal. For example, a reading of 34 bps in the 5 over 2/10 cell means that we would only expect the 5-year to outperform the 2/10 if the 2/10 slope steepens by more than 34 bps during the next six months. Otherwise, we would expect the 2/10 barbell to outperform the 5-year bullet. Table 6Discounted Slope Change During Next 6 Months (BPs)
Don't Bet On A Fed Pivot
Don't Bet On A Fed Pivot
Appendix C: Excess Return Bond Map The Excess Return Bond Map is used to assess the relative risk/reward trade-off between different sectors of the US bond market. It is a purely computational exercise and does not impose any macroeconomic view. The Map’s vertical axis shows 12-month expected excess returns. These are proxied by each sector’s option-adjusted spread. Sectors plotting further toward the top of the Map have higher expected returns and vice-versa. Our novel risk measure called the “Risk Of Losing 100 bps” is shown on the Map’s horizontal axis. To calculate it, we first compute the spread widening required on a 12-month horizon for each sector to lose 100 bps or more relative to a duration-matched position in Treasury securities. Then, we divide that amount of spread widening by each sector’s historical spread volatility. The end result is the number of standard deviations of 12-month spread widening required for each sector to lose 100 bps or more versus a position in Treasuries. Lower risk sectors plot further to the right of the Map, and higher risk sectors plot further to the left. Chart 12Excess Return Bond Map (As Of July 29, 2022)
Don't Bet On A Fed Pivot
Don't Bet On A Fed Pivot
Ryan Swift US Bond Strategist rswift@bcaresearch.com Footnotes 1 Please see US Bond Strategy / Global Fixed Income Strategy Special Report, “Turning Defensive On US Corporate Bonds”, dated April 12, 2022. 2 Please see US Bond Strategy / Global Fixed Income Strategy Special Report, “Looking For Opportunities In US & European Corporates After The Recent Selloff”, dated May 31, 2022. 3 For more details on this call please see US Bond Strategy Weekly Report, “When The Dual Mandates Clash”, dated June 28, 2022. 4 Please see US Bond Strategy Weekly Report, “The Bond Market Implications Of A 5% Mortgage Rate”, dated April 26, 2022. 5 Please see Emerging Markets Strategy Charts That Matter, “Beware Of Another Downleg In Risk Assets”, dated June 30, 2022. 6 Please see US Bond Strategy Weekly Report, “Echoes Of 2018”, dated May 24, 2022. 7 Please see US Bond Strategy / Global Fixed Income Strategy Weekly Report, “A Low Conviction US Bond Market”, dated July 12, 2022. 8 Please see US Bond Strategy / Global Fixed Income Strategy Weekly Report, “A Low Conviction US Bond Market”, dated July 12, 2022. 9 Please see US Bond Strategy Weekly Report, “Three Conjectures About The US Economy”, dated July 19, 2022. Recommended Portfolio Specification Other Recommendations Treasury Index Returns Spread Product Returns
The ISM PMI suggests that manufacturing activity continued to expand at a steady pace in July. The headline index was broadly unchanged at 52.8 (versus 53.0 in June). This figure is in line with the S&P Global’s US Manufacturing PMI’s 52.2 print (see The…
Executive Summary Biden Can Take Risks Ahead Of Midterms
The Fourth Taiwan Strait Crisis
The Fourth Taiwan Strait Crisis
News reports suggest House Speaker Nancy Pelosi will travel to Taiwan and meet with Taiwanese President Tsai Ing-wen in the coming days. China has promised military counter-measures if she visits. Structural factors suggest US-China tensions over Taiwan could explode: China’s reversion to autocracy and hawkish foreign policy, Taiwan’s assertion of autonomy, and the US’s political instability and foreign policy reactiveness. Cyclical factors also suggest that tensions could escalate: China’s instability in the wake of Covid-19, the ramifications of Russia’s invasion of Ukraine, the budding Russo-Chinese alliance, the Biden administration’s domestic political vulnerability, and the Xi administration’s domestic political vulnerability. In particular, Xi cannot back down. A diplomatic crisis or military showdown is likely in the short run but not yet a full-scale war. Taiwan is harder to invade than Ukraine, the US is not attempting a radical boost to Taiwan’s military, Taiwan is not moving toward formal independence, and the Chinese economy is not yet collapsing beyond all hope. However, over the long run we fear that a Taiwan war is more likely than not. Tactically investors should prefer government bonds to equities, US equities to global, defensive sectors to cyclicals, and safe havens to risky assets. Investors should short Chinese and Taiwanese currencies and assets. Tactical Recommendation Inception Date Return LONG US SEMICONDUCTOR & SEMI EQUIPMENT / TAIWAN EQUITIES 2022-06-23 14.6% LONG KOREA/ SHORT TAIWAN EQUITIES 2020-03-27 -23.5% Bottom Line: Tactically investors should buy safe-haven assets and await a resolution of the US-China confrontation over Taiwan, which could cause a dramatic escalation in strategic tensions. Feature A fourth Taiwan Strait crisis is likely upon us. Speaker of the US House of Representatives Nancy Pelosi will visit Taiwan during her travel around Asia Pacific this week, according to the Wall Street Journal on August 1. Chinese President Xi Jinping warned US President Joe Biden in a phone conversation on July 28 that “those who play with fire will eventually get burned,” referring specifically to US relations with Taiwan. Chinese foreign ministry officials have threatened “forceful” countermeasures if Pelosi visits the island, explicitly saying that the People’s Liberation Army would respond in some way. There is still some uncertainty over whether Pelosi will go. She delayed the trip in April. Rumors emerged over July that she would resume but President Joe Biden suggested on July 20 that US military officials opposed the trip, believed the timing to be inappropriate. Taiwan was not mentioned in Pelosi’s official itinerary published on July 31, which includes Singapore, Japan, South Korea, and Malaysia. But the Wall Street Journal report has been corroborated by US and Taiwanese officials. Assuming Pelosi goes, China will respond with some military show of force. The US may pretend that one hand (the White House, the Department of Defense) does not know what the other hand is doing (the House of Representatives). But China will not be convinced. There are three major reasons that we have predicted a fourth Taiwan Strait crisis: 1. China’s reversion to autocracy and foreign policy hawkishness: After the Great Recession, China was forced into a painful downshift in potential economic growth, stemming from a contracting labor force, excessive debt, and changes in the international economy (Chart 1). As economic growth has slowed, China has pursued political centralization, economic mercantilism, military modernization, and foreign policy assertiveness, offering nationalism as a distraction from the disappointments of the new middle class. While China may not be ready to launch a full-scale invasion of Taiwan, it is willing to do so if the Communist Party regime’s survival is at stake. Chart 1China's Slowdown Leads To Hawkishness
China's Slowdown Leads To Hawkishness
China's Slowdown Leads To Hawkishness
2. Taiwan’s reassertion of autonomy: Taiwanese people began to sour on mainland China with the Great Recession and increasingly developed an independent identity (Chart 2). China’s growing economic influence, combined with Xi Jinping’s re-centralization of power across Greater China, provoked a backlash in Taiwan beginning in 2013 that culminated in the nominally pro-independence Democratic Progressive Party gaining full control of the island in 2016. The US-China trade war, China’s imposition of control over critical buffer spaces (including the South China Sea and Hong Kong), and US export controls on advanced technologies thrust Taiwan into the middle of a strategic confrontation. While Taiwan is not seeking war or formal political independence, it is seeking closer ties with the US and democratic allies to protect against Beijing’s encroachment. 3. US political instability and foreign policy reaction: The Great Recession brought the US’s latent political instability from a simmer to a boil. The Washington establishment withdrew from the war on terrorism only to face discontent at home and strategic competition from China and Russia. China intensified its acquisition of US technology while North Korea obtained a nuclear arsenal under China’s watch. A surge in populism led the US to initiate a trade war against China and to impose restrictions on critical technologies to slow China’s modernization. While the US political factions bickered over domestic policy, they both tapped into a popular consensus on economic nationalism and hawkishness toward China (Chart 3). While the US is struggling to curb Russia and Iran, its greatest long-term challenge stems from China and it is increasingly focused on containing China’s economy and strategic ambitions. Chart 2Taiwanese Souring On China
The Fourth Taiwan Strait Crisis
The Fourth Taiwan Strait Crisis
Chart 3US Hawkish Consensus On China
The Fourth Taiwan Strait Crisis
The Fourth Taiwan Strait Crisis
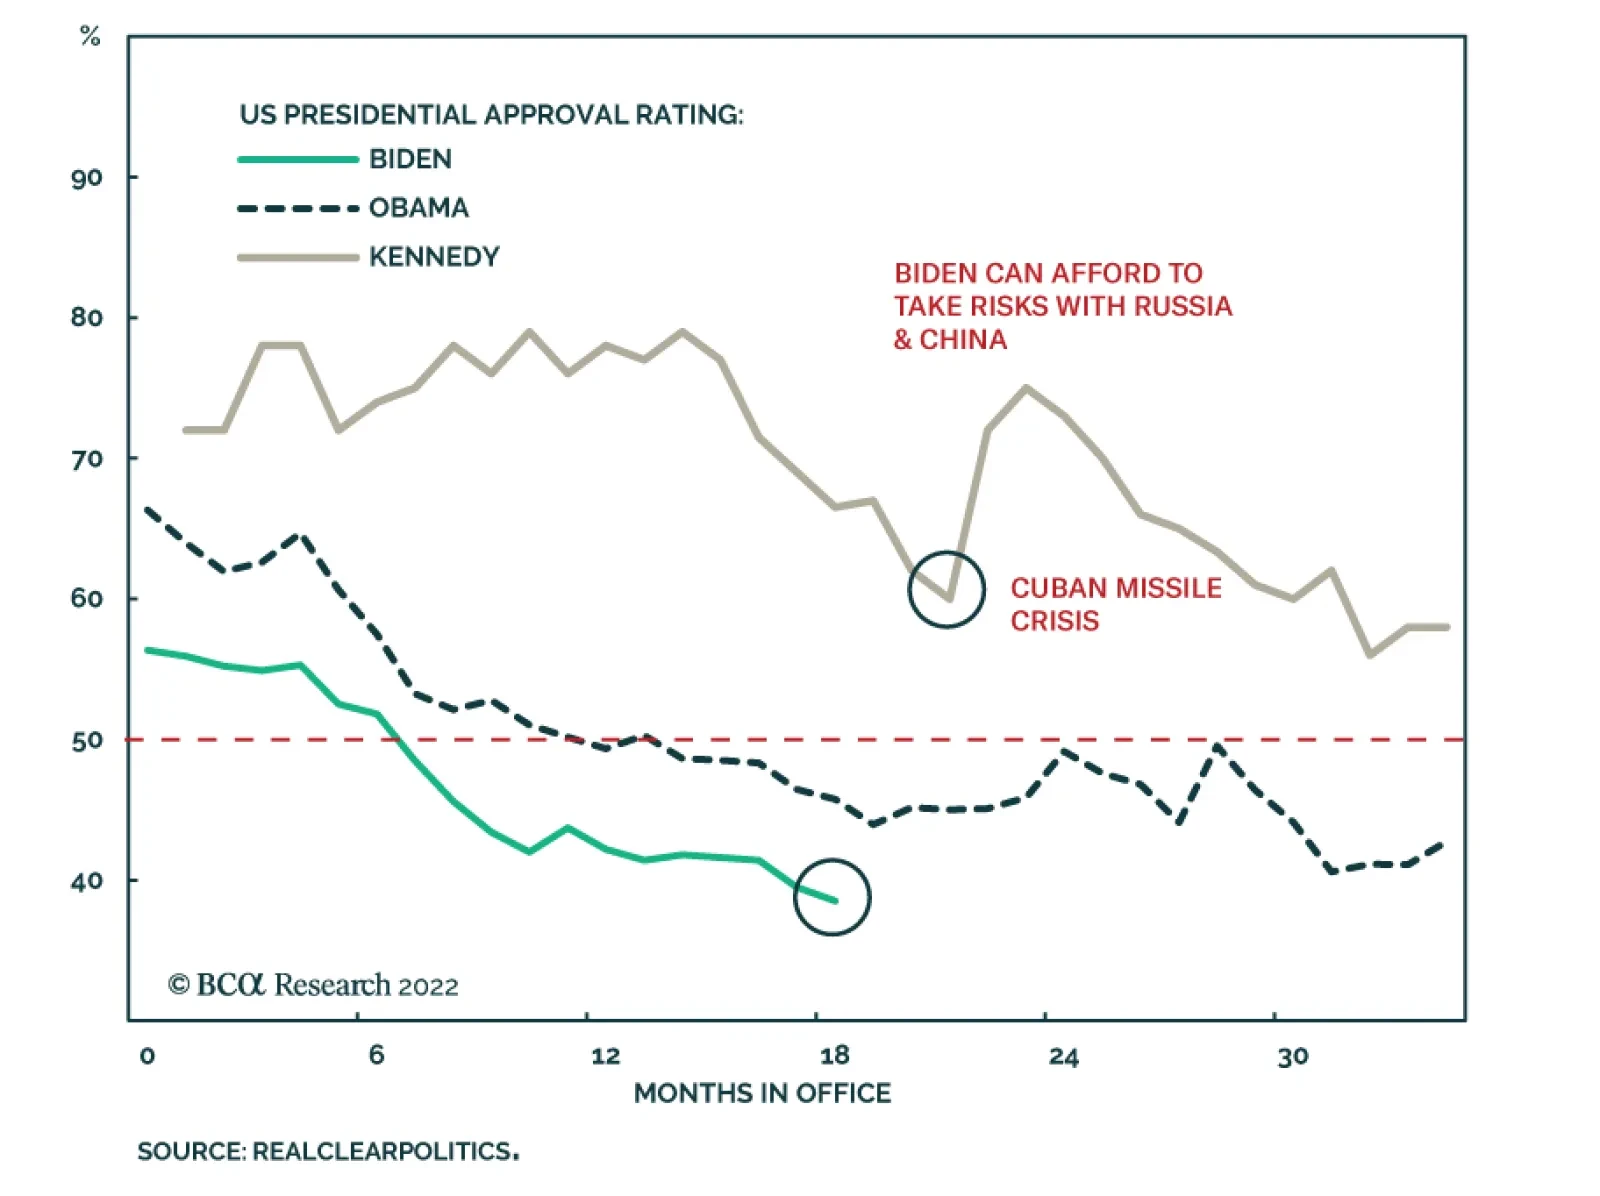
In addition, there are important cyclical reasons why investors should take very seriously the risk of a major geopolitical crisis emanating from Taiwan in the short run: The Covid-19 pandemic intensified US (and global) distrust of China and accelerated the divorce of the US and Chinese economies. It also threw the Chinese economy into a downward spin, threatening Xi Jinping’s personal security and the Communist Party’s regime security. Hypo-globalization reduces critical economic constraints on military conflict. The Ukraine war highlighted the willingness of ambitious strongman regimes to go to war to prevent neighboring countries from allying with the United States. Taiwan is critical to Chinese security just as Ukraine is critical to Russian. Taiwan, like Ukraine, lacks a mutual defense treaty with the US and yet is attempting to create a de facto treaty through political, economic, and military cooperation – a scenario that will incentivize Chinese military action if it ever believes the US will take irrevocable steps to increase its commitment to defend Taiwan. At the same time, the US will try to deter China more effectively, since its deterrence failed in the case of Ukraine, which entails upgrading the Taiwanese relationship. Hence China will feel threatened and accuse the US of altering the status quo. Russo-Chinese alliance prevents US-China reengagement. Russia threw itself into China’s arms by cutting off natural gas to Europe. China cannot reject Russia’s overture because it needs Russia’s alliance to break through American strategic containment in the coming years. China needs Russia’s natural resources and its cooperation in gaining economic access to Central Asia and the Middle East. The US cannot pursue strategic détente with China if China is allying with Russia, since a Russo-Chinese alliance poses an unprecedented threat to American global influence and security (Chart 4). The Democratic Party is desperate to mitigate looming election losses. President Biden’s approval rating has fallen to 39%, while headline inflation hits 9% and the economy slips into a technical recession. The Republican Party is lined up for a victory in the midterm elections, yet Democrats view the populist Republicans as an existential threat. Hence Biden and Democratic leaders like Pelosi are willing to take significant risks to salvage the election, including provoking foreign rivals. The administration is contemplating tougher export controls on China’s access to semiconductor manufacturing equipment and Congress is passing bipartisan legislation to make the US more competitive against China. Any major confrontation abroad would generate a patriotic rally among voters, as did the Cuban Missile Crisis in 1962, which saved the Democrats from heavy losses in the midterms that year (Chart 5). China’s domestic politics support a foreign confrontation. As Xi attempts to cement another five-to-ten years in power at the twentieth national party congress this fall, the pandemic restrictions, political repression, property bust, and economic slowdown ensure that he has little good news to celebrate at home. He could benefit from taking an aggressive stance against the imperialist Americans over Taiwan – and he cannot afford to back down or lose face. Ultimately China’s regime legitimacy is at stake in Taiwan so it is willing to take greater risks than the United States. Chart 4US Cannot Engage With Russo-Chinese Behemoth
US Cannot Engage With Russo-Chinese Behemoth
US Cannot Engage With Russo-Chinese Behemoth
Chart 5Biden Can Take Risks Ahead Of Midterms
The Fourth Taiwan Strait Crisis
The Fourth Taiwan Strait Crisis
All of the above demonstrates that investors should not be complacent but should take risk off the table until the Pelosi trip blows over. A major diplomatic or geopolitical crisis will occur if Pelosi indeed visits Taiwan, for China will be required to react to uphold the credibility of its warnings, and Beijing will have a national and political interest in overreacting rather than underreacting. The Americans will then have a national and political interest in preserving their own credibility. This dynamic could lead to a major escalation in strategic tensions. Could a crisis lead to full-scale war? Yes it could but most likely it will not – at least not yet. Here are some important limitations, which investors should monitor closely. If these are reduced or overcome, then a larger conflict becomes more probable: Taiwan is harder to invade than Ukraine. Taiwan is an island and islands that are politically unified can only be subdued with enormous cost of blood and treasure even by the most powerful armies. Taiwan is critical to the global economy, unlike Ukraine. While it lacks defense treaties, it has stronger strategic partnerships than Ukraine did. The Chinese military has not fought an expeditionary war since Vietnam in 1979. The US sent aircraft carriers to the Taiwan Strait in each of the previous three crises since the 1950s, signaling that it is willing to defend Taiwan, and currently has at least two aircraft carriers in Asia Pacific (Map 1). China needs to be prepared for potential American and Japanese intervention if it is to attack Taiwan, which requires an advanced triad of nuclear arms. Map 1US Aircraft Carriers Suggest Taiwan Risk Is Substantial
The Fourth Taiwan Strait Crisis
The Fourth Taiwan Strait Crisis
The US is not sending any game-changing offensive weapon systems. Instead the US is sending a mere politician. China opposes anything resembling state-to-state relations but Taiwan’s defensive capability would not be improved. Hence China would not be forced to take aggressive military action. Instead China is attempting to set a very low bar for intervening in US-Taiwan political relations. Beijing can intervene in a way that enforces the new line but remains beneath the threshold of war. Going forward, US arms sales to Taiwan will be a much riskier affair and the delivery of a weapons system could trigger conflict (Chart 6). Chinese economy is not (yet) beyond help. China still has authoritarian powers to manipulate the domestic economy, suggesting that policy makers will intervene to slow down the property bust and stimulate activity. After Xi Jinping consolidates power, we expect a pro-growth strategy to be unveiled that will lead to a stabilization of growth in 2023. This is necessary for Xi to maintain domestic stability, which is existential to the regime and its long-term security. If stimulus and interventions fail utterly and China collapses into a full-blown financial crisis, then China will lose the ability to improve its security over the long run and the risk of conflict with foreign powers will rise. But as long as China’s economy is not collapsing, China maintains the prospect of building its influence and power over time and conquering Taiwan through absorption rather than extremely risky armed conflict (Chart 7). Chart 6US Arms Sales Could Trigger A Real Conflict
US Arms Sales Could Trigger A Real Conflict
US Arms Sales Could Trigger A Real Conflict
Chart 7More Economic Stimulus Is Coming
More Economic Stimulus Is Coming
More Economic Stimulus Is Coming
Taiwan is not moving toward formal independence. The Tsai Ing-wen administration is nominally in favor of independence but has chosen rhetorical sleight of hand over any formal change to Taiwan’s status. Taiwanese people support the status quo knowing that they will live in a war zone if they declare independence. The long-term problem stems from the fact that a clear majority opposes unification with the mainland (Chart 8). Taiwan and the US face elections in 2022 and 2024. If the Kuomintang stages a comeback in Taiwanese politics, or the Democrats win reelection in 2024, then China still has the ability to pursue its aims through diplomacy. Whereas if the Democratic Progressive Party remains in full control of Taiwan, and the Republicans regain the White House, Beijing may conclude that little can be gained through diplomacy. Especially if these US and Taiwanese parties proceed to press their interests aggressively. Chart 8Taiwanese Not Declaring Independence
The Fourth Taiwan Strait Crisis
The Fourth Taiwan Strait Crisis
Hence the most likely outcome if Pelosi visits Taiwan is a US-China geopolitical crisis of some sort but not a full-scale war. A crisis short of war could establish a new set of red lines over Taiwan that could govern the US-China relationship in the medium term with reduced uncertainty. But it would bring very bad news in the short run and lead to a permanent deterioration in US-China relations and global stability over the long run, which markets must price first. Bottom Line: Tactically investors should prefer government bonds to equities, US equities to global, defensive sectors to cyclicals, and safe havens to risky assets. Stay short Chinese and Taiwanese currencies and assets. While semiconductor stocks stand at risk, investors should favor US semiconductor companies over Chinese and Taiwanese (Chart 9). Chart 9Investors Should Seek Safe Havens
Investors Should Seek Safe Havens
Investors Should Seek Safe Havens
Matt Gertken Chief Geopolitical Strategist mattg@bcaresearch.com Strategic Themes Open Tactical Positions (0-6 Months) Open Cyclical Recommendations (6-18 Months) Regional Geopolitical Risk Matrix