Developed Countries
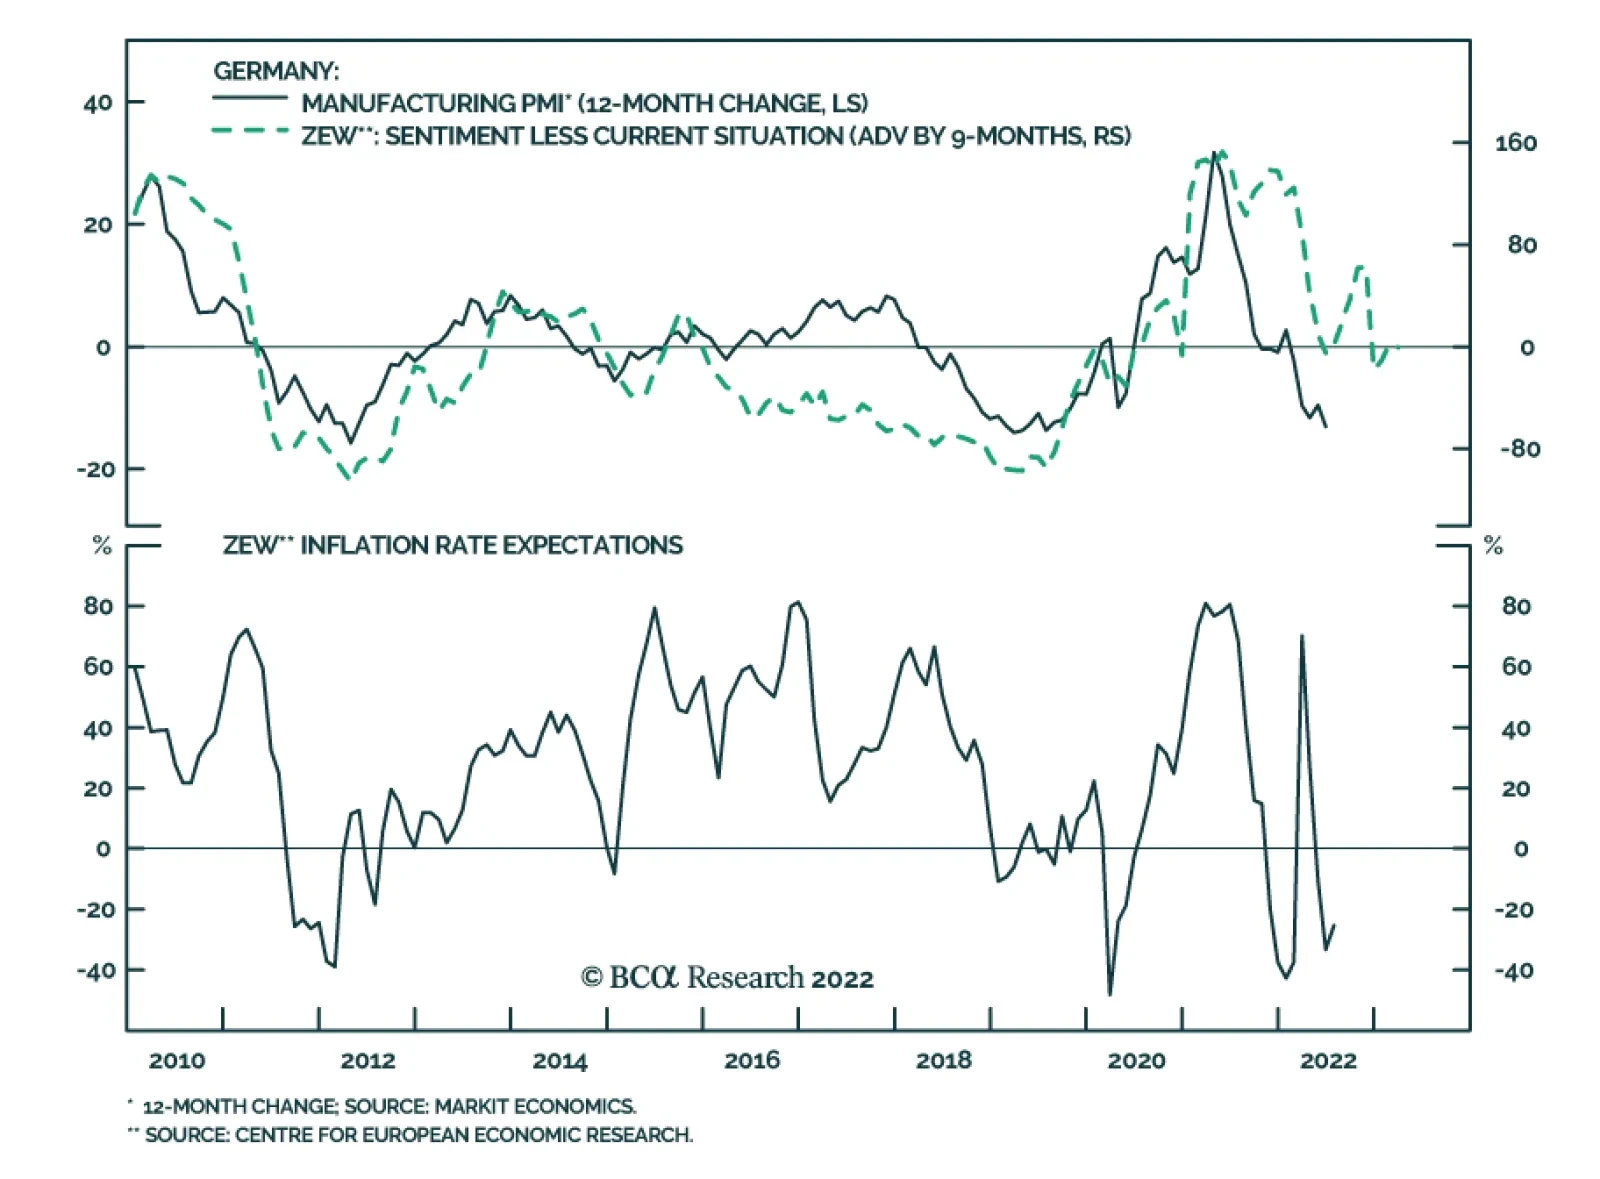
The ZEW survey of investor sentiment sent a cautionary signal on Tuesday. German sentiment slumped in July to the lowest level since 2011. The current situation and expectations indices dropped by 18.2 and 25.8 points, respectively – falling significantly…
A decision is expected shortly on whether President Joe Biden will roll back some of the Trump-era tariffs on imports from China. Voices within President Biden’s administration are divided. US Treasury Secretary Janet Yellen is among those in favor of…
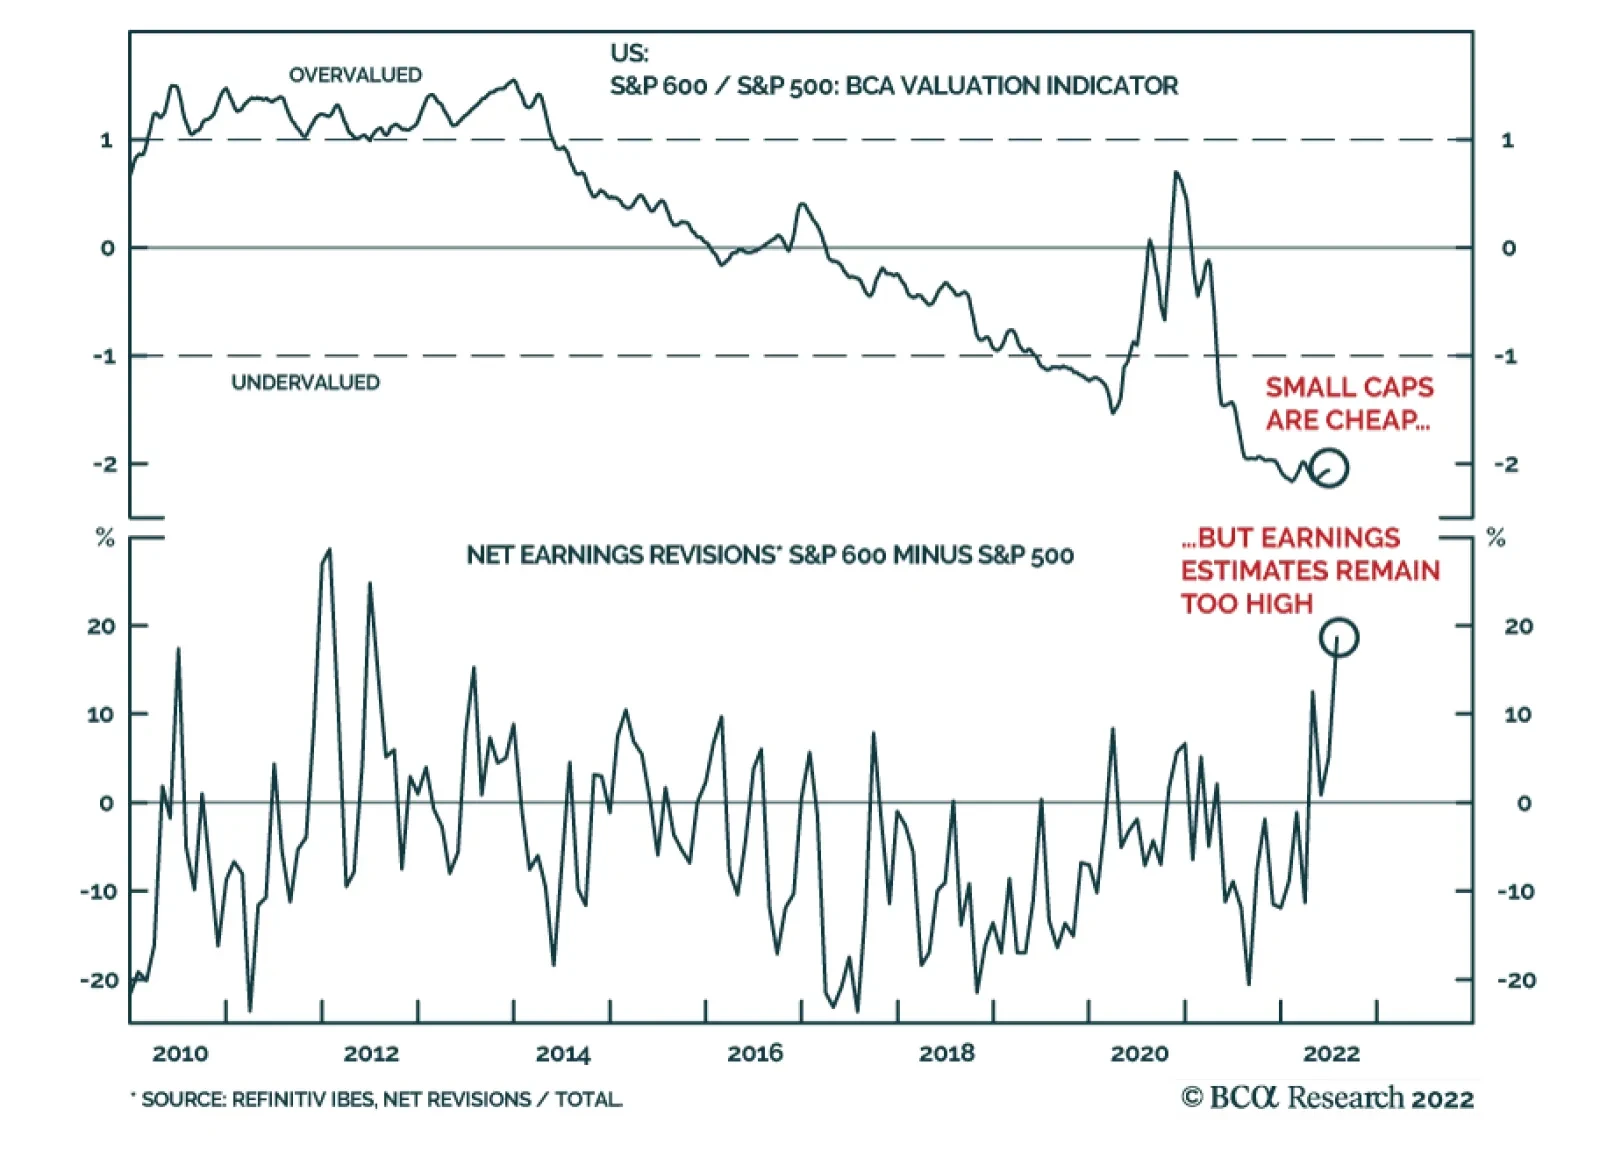
Small caps have been underperforming their large cap counterparts since October 2021. Indeed, these highly cyclical stocks tend to underperform larger companies when the business cycle slows down. Their relatively higher allocation to regional banks also…
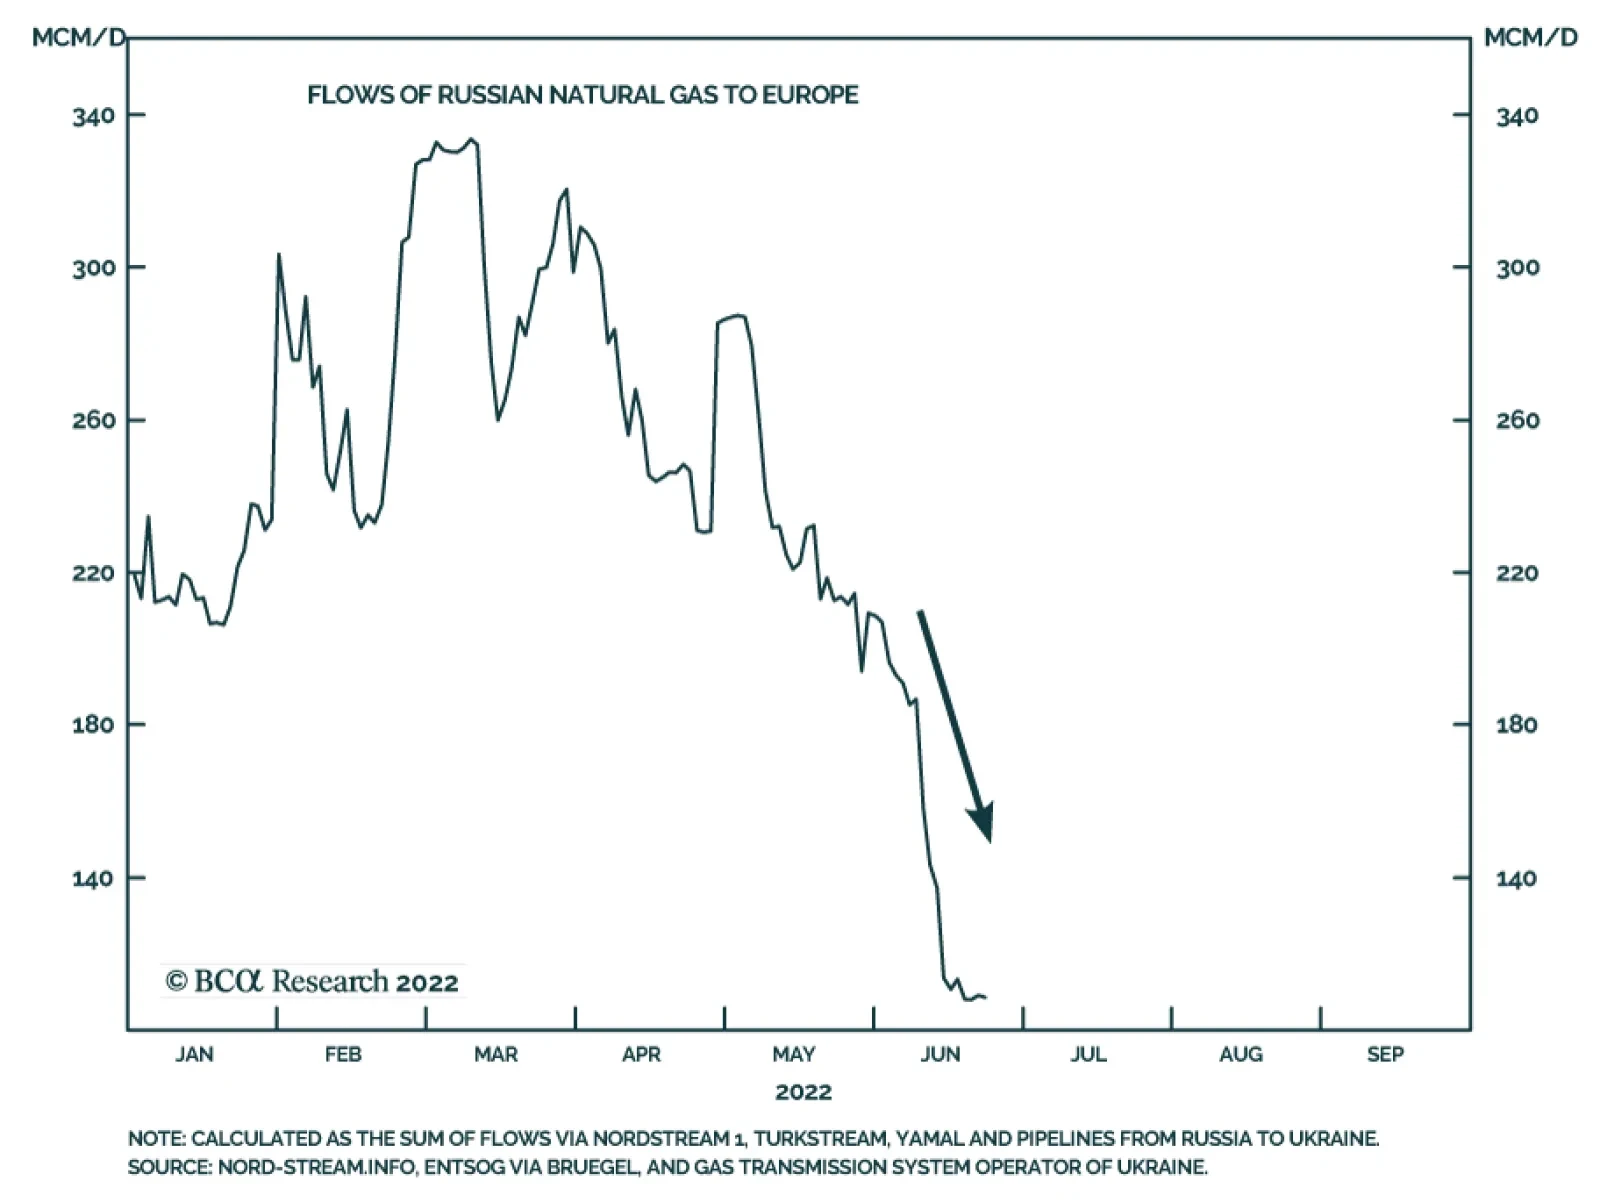
While recession fears have spread to industrial metals and oil markets, natural gas prices have been soaring. Dutch Title Transfer Facility (TTF) natural gas prices are up roughly 100% since June 1 and over 350% y/y. Supply-side disruptions continue to…

Executive Summary Bond investors can’t seem to decide whether the US economy is in the midst of an inflationary boom or hurtling toward recession. Our sense is that, while US economic growth is clearly slowing, we don’t see the unemployment rate rising enough for the Fed to abandon its tightening cycle any time soon. The 5-year US Treasury yield has tightened relative to the rest of the curve in recent weeks, and the 2-year maturity now looks like the most attractive spot for investors. TIPS breakeven inflation rates have also declined markedly in recent weeks, and TIPS no longer look expensive on our models. TIPS Are No Longer Expensive
TIPS Are No Longer Expensive
TIPS Are No Longer Expensive
Bottom Line: US bond investors should keep portfolio duration close to benchmark. They should also shift Treasury curve allocations from the 5-year maturity to the 2-year maturity and upgrade TIPS from underweight to neutral. Whipsaw Inflationary boom or recession? US bond investors can’t seem to decide and yields are swinging back and forth depending on the latest economic data. Just in the past month we’ve seen the 10-year US Treasury yield peak at 3.49%, fall to 2.82% and then finally move back above 3% following last week’s strong employment report. Not surprisingly, implied interest rate volatility is the highest it’s been since the Global Financial Crisis (Chart 1). Our sense is that, while US economic growth is clearly slowing, we don’t see the unemployment rate rising enough for the Fed to abandon its tightening cycle any time soon. This is especially true because the Fed will tolerate a significant rise in the unemployment rate as long as inflation stays above target.1 Turning to the evidence, decelerating US economic activity is apparent in the manufacturing and non-manufacturing PMIs, which are both falling rapidly from high levels (Chart 2). Though both indexes remain firmly above the 50 boom/bust line, trends in financial conditions suggest that they could dip below 50 within the next few months. Chart 1A Highly Volatile Rates Market
A Highly Volatile Rates Market
A Highly Volatile Rates Market
Chart 2US Growth Is Slowing
US Growth Is Slowing
US Growth Is Slowing
The employment components of both indexes are already in contractionary territory (Chart 2, bottom panel), but this is due to concerns about labor supply, not demand. For example, last week’s ISM non-manufacturing PMI release included three representative quotes from respondents about labor market conditions.2 All three quotes reference concerns about labor supply: Unable to fill positions with qualified applicants. Extremely hard to find truck drivers. Demand for talent is higher, but availability of candidates to fill open roles continues to keep employment levels from increasing. This doesn’t sound like an economy that is on the cusp of surging unemployment, and this is exactly what the Fed is counting on. The Fed’s hope is that slower demand will bring down the large number of job openings without leading to a significant increase in layoffs or a significant rise in the unemployment rate. In that regard, it is notable that job openings ticked down in May, both in absolute terms and relative to the number of unemployed. Meanwhile, the rates of hiring and layoffs held steady (Chart 3). Chart 3Some Hope For A Soft Landing
Some Hope For A Soft Landing
Some Hope For A Soft Landing
Investment Implications Our investment strategy hinges on two key economic views related to the labor market and inflation. First, while a surge doesn’t seem imminent, slowing economic activity means that the unemployment rate is more likely to edge higher between now and the end of the year than it is to fall. Second, as we’ve written in previous reports, US inflation has a relatively easy path back to its underlying trend of approximately 4%.3 After that, it will be more difficult for policymakers to bring inflation from 4% back down to 2%, and we could see the Fed push rates above 4% next year to accomplish this task. Taken together, these two views suggest that growth will be slowing and inflation falling between now and the end of the year. This combination could easily push bond yields lower, especially if recession worries flare up again. High frequency bond yield indicators such as the CRB Raw Industrials / Gold ratio and the relative performance of cyclical versus defensive equities also suggest that bond yields have room to fall (Chart 4). That said, the market is currently priced for the fed funds rate to peak at 3.74% in May 2023 and to fall back to 3.19% by the end of 2023. We see strong odds that inflation will be sticky enough (and the labor market resilient enough) for the Fed to push rates above those levels next year. This leaves us with an ‘at benchmark’ stance on portfolio duration for the time being, with an inclination to turn more bearish on bonds later this year if our base case forecast pans out. More specifically, we would likely reduce portfolio duration if the 10-year Treasury yield falls back to 2.5% or if inflation reverts to its 4% underlying trend. Conversely, we will turn more bullish on bonds if we see signs in the labor market data that point to a Fed pause (or Fed rate cuts) being necessary. For now, growth in nonfarm employment and aggregate weekly payrolls (wages x hours x employment) suggest we aren’t close to this outcome (Chart 5). Chart 4High-Frequency Bond Yield Indicators
High-Frequency Bond Yield Indicators
High-Frequency Bond Yield Indicators
Chart 5The US Labor Market Is Strong
The US Labor Market Is Strong
The US Labor Market Is Strong
Sliding Down The Yield Curve Since early April we’ve been recommending that investors position long the 5-year Treasury note and short a duration-matched barbell consisting of the 2-year and 10-year notes to take advantage of a US yield curve that was quite steep out to the 5-year maturity point and quite flat beyond that. That trade is now played out. The 5 over 2/10 butterfly spread has tightened back to zero and the 2-year note is now the most attractively priced security on the US Treasury curve. Chart 6 shows that the spread between the 2-year note and a duration-matched barbell consisting of cash and the 5-year note offers an extraordinary yield advantage of 92 bps. What’s more, Table 1 shows that, with the exception of the unloved 20-year bond, the 2-year note offers the most attractive 12-month carry on the curve, largely a result of the 18 bps of rolldown attributable to the still-steep slope between the 1-year and 2-year maturity points. Chart 6Shift Into 2s
Shift Into 2s
Shift Into 2s
Table 112-Month Carry Across The US Treasury Curve
A Low Conviction US Bond Market
A Low Conviction US Bond Market
This large shift in relative pricing compels us to close our prior position (long 5-year bullet versus 2/10 barbell) and open a new position: long the 2-year note and short a duration-matched cash/5 barbell. This new position (long 2yr over cash/5) offers attractive 12-month carry, but given the current volatile interest rate environment, it should mainly be expected to profit in the event of a steepening of the 2/5 Treasury slope. With that in mind, it’s notable that the 2/5 slope recently inverted. Inversions of the 2/5 slope are historically rare. They tend to occur near the end of Fed tightening cycles and, with the exception of the early-1980s, they tend to not last that long (Chart 7). Chart 72/5 Inversions Are Rare And Fleeting
2/5 Inversions Are Rare And Fleeting
2/5 Inversions Are Rare And Fleeting
Going forward, we see three plausible scenarios for the 2/5 slope during the next 6-12 months. First, the Fed achieves something close to the soft landing it is aiming for. Inflation starts to fall and the unemployment rate edges higher. However, unemployment never reaches levels that necessitate a complete reversal of Fed tightening. The 2/5 Treasury slope bear-steepens in this scenario as the market discounts that the Fed will have to push rates above 4% to hit its inflation target. Second, a deep recession and complete reversal of Fed tightening occur much more quickly than we anticipate. The 2/5 Treasury slope would bull-steepen in this scenario as the front-end of the curve is pulled down by the Fed’s pivot. Third, inflation shows no signs of reversing course. Long-dated inflation expectations jump and the Fed determines that it has no choice but to follow the example of Paul Volcker and tighten, even if the economy falls into a deep recession. As was the case in the early-1980s, the 2/5 Treasury slope could become deeply inverted in this scenario. Our sense is that the first two scenarios are much more likely than the third. We have written in prior reports about how the current spate of inflation is much different than what was seen in the early 1980s.4 This makes us willing to bet against a prolonged deep inversion of the 2/5 slope. Bottom Line: US Treasury curve investors should exit their positions long the 5-year bullet versus a duration-matched 2/10 barbell. They should initiate a position long the 2-year bullet versus a duration-matched cash/5 barbell. Upgrade US TIPS To Neutral Finally, we note that TIPS breakeven inflation rates have declined markedly during the past month. The 10-year TIPS breakeven inflation rate is currently 2.38%, near the lower-end of the Fed’s 2.3%-2.5% target range, and the 5-year/5-year forward TIPS breakeven inflation rate is a mere 2.12%, well below target (Chart 8). We also note that the 5-year/5-year forward TIPS breakeven inflation rate is back below survey estimates of what inflation will be 5-10 years in the future (Chart 8, bottom panel). Chart 8TIPS Breakevens
TIPS Breakevens
TIPS Breakevens
We have been recommending an underweight position in TIPS versus nominal US Treasuries since early April, but the recent valuation shift means it’s time to add some exposure. Critically, our TIPS Breakeven Valuation Indicator has also increased to +0.6, moving into “TIPS cheap” territory (Chart 9). Historically, the 10-year TIPS breakeven inflation rate has averaged an increase of 28 bps in the 12 months following a reading between +0.5 and +1.0 from our Indicator (Table 2). Chart 9TIPS Are No Longer Expensive
TIPS Are No Longer Expensive
TIPS Are No Longer Expensive
Table 2TIPS Breakeven Valuation Indicator Track Record
A Low Conviction US Bond Market
A Low Conviction US Bond Market
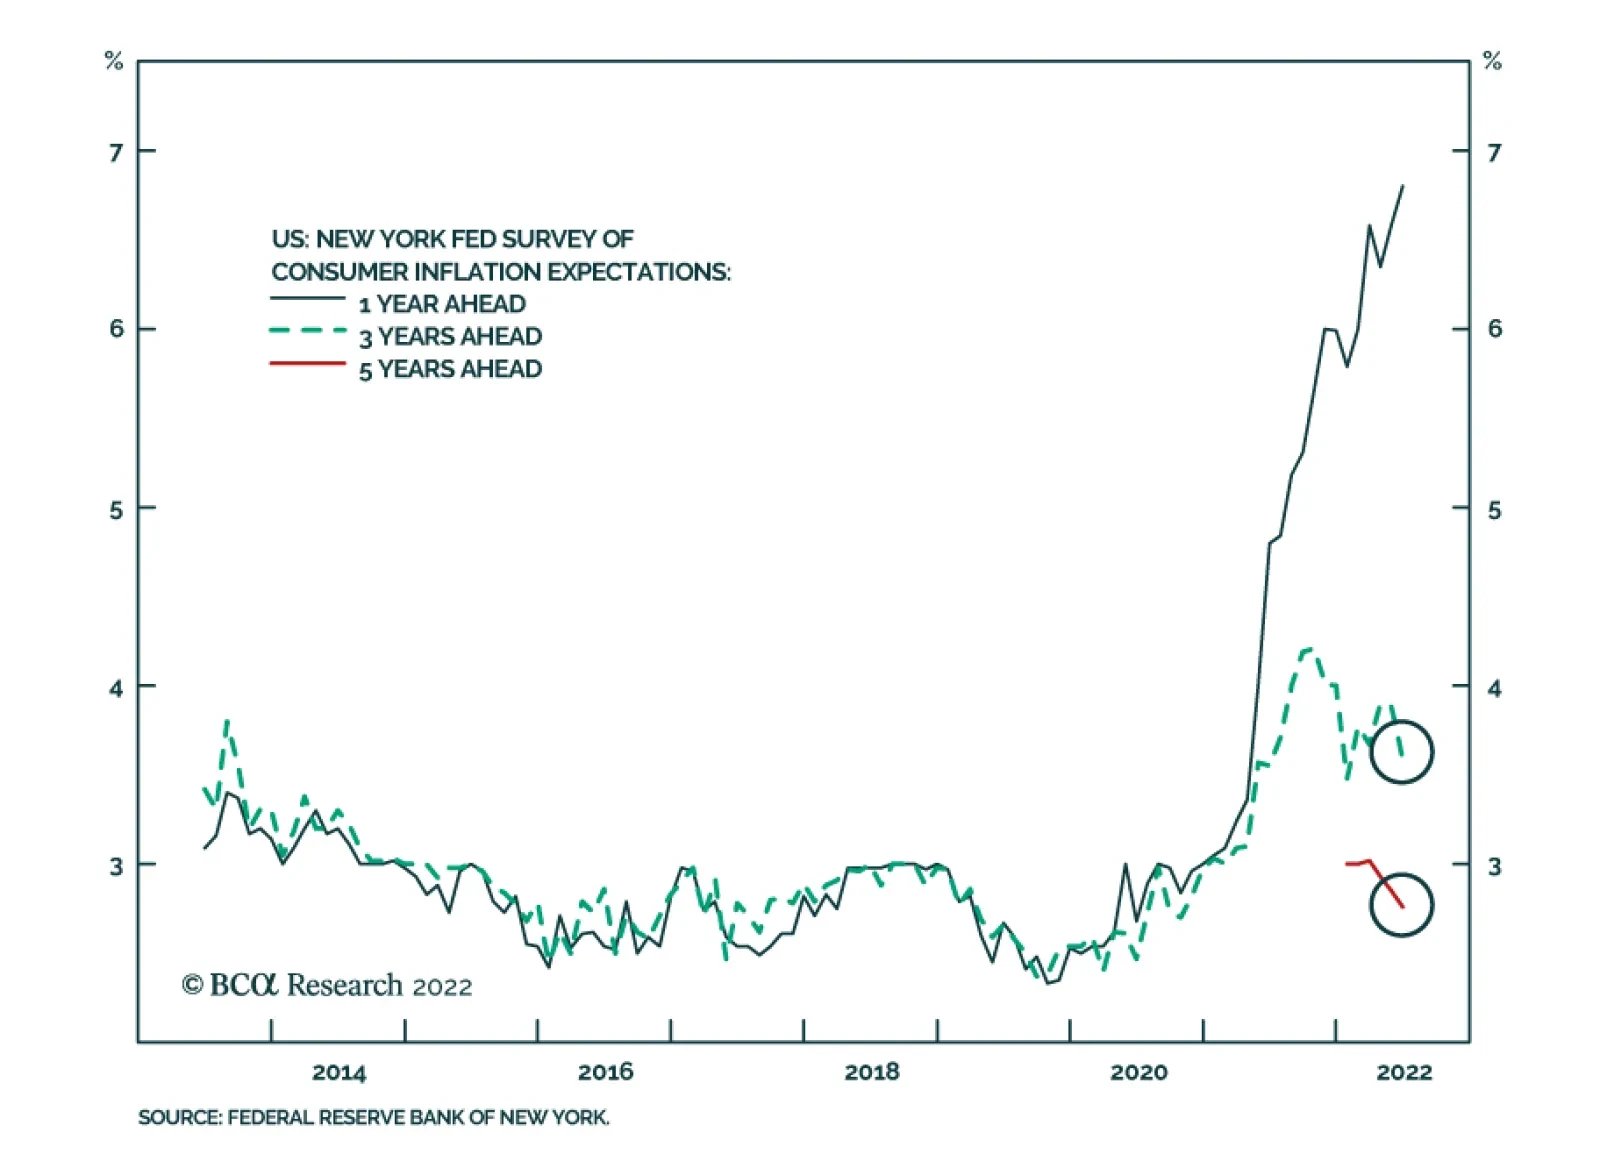
The drop in TIPS breakeven inflation rates has been most prominent at the front-end of the curve. The 2-year TIPS breakeven inflation rate is down to 3.22% from a peak of 4.93%. The high correlation between short-maturity TIPS breakevens and realized CPI inflation means that short-dated breakevens can fall further as inflation continues to trend down, but already we see that 3.22% looks like a much more reasonable estimate of average inflation for the next two years than did the 4.93% peak. While we advise investors to upgrade TIPS from underweight to neutral relative to nominal US Treasuries, we continue to recommend an outright short position in 2-year TIPS. The 2-year TIPS yield has risen sharply since its 2021 low (Chart 10), but recent comments from Fed officials imply that the Fed would like to see positive real yields across the entire curve before it declares monetary policy sufficiently restrictive.5 This means that there is still some room for the 2-year TIPS yield to increase, from its current level of -0.10% back into positive territory. Such a move should also lead to more flattening of the 2/10 TIPS curve, and we continue to recommend holding that position as well (Chart 10, bottom panel). Chart 10Stay Short 2-Year TIPS
Stay Short 2-Year TIPS
Stay Short 2-Year TIPS
Bottom Line: Investors should upgrade TIPS from underweight to neutral relative to nominal US Treasuries but maintain outright short positions in 2-year TIPS. 2/10 TIPS curve flatteners and 2/10 inflation curve steepeners also continue to make sense. Ryan Swift US Bond Strategist rswift@bcaresearch.com Footnotes 1 For more details on how to think about the tradeoff between the Fed’s inflation and employment goals please see US Bond Strategy Weekly Report, “When The Dual Mandates Clash”, dated June 28, 2022. 2 https://www.ismworld.org/supply-management-news-and-reports/reports/ism-report-on-business/services/june/ 3 Please see US Bond Strategy / Global Fixed Income Strategy Weekly Report, “No End In Sight For Fed Tightening”, dated June 21, 2022. 4 Please see US Bond Strategy Weekly Report, “No Relief From High Inflation”, dated June 14, 2022. 5 Please see US Bond Strategy Weekly Report, “When The Dual Mandates Clash”, dated June 28, 2022. Recommended Portfolio Specification Other Recommendations Treasury Index Returns Spread Product Returns
Stronger-than-expected job gains in June increase the odds that the Fed will lift interest rates by another 75bps when it meets again in two weeks. Data released this week will either cement the case for another mega hike, or instead provide support for a…
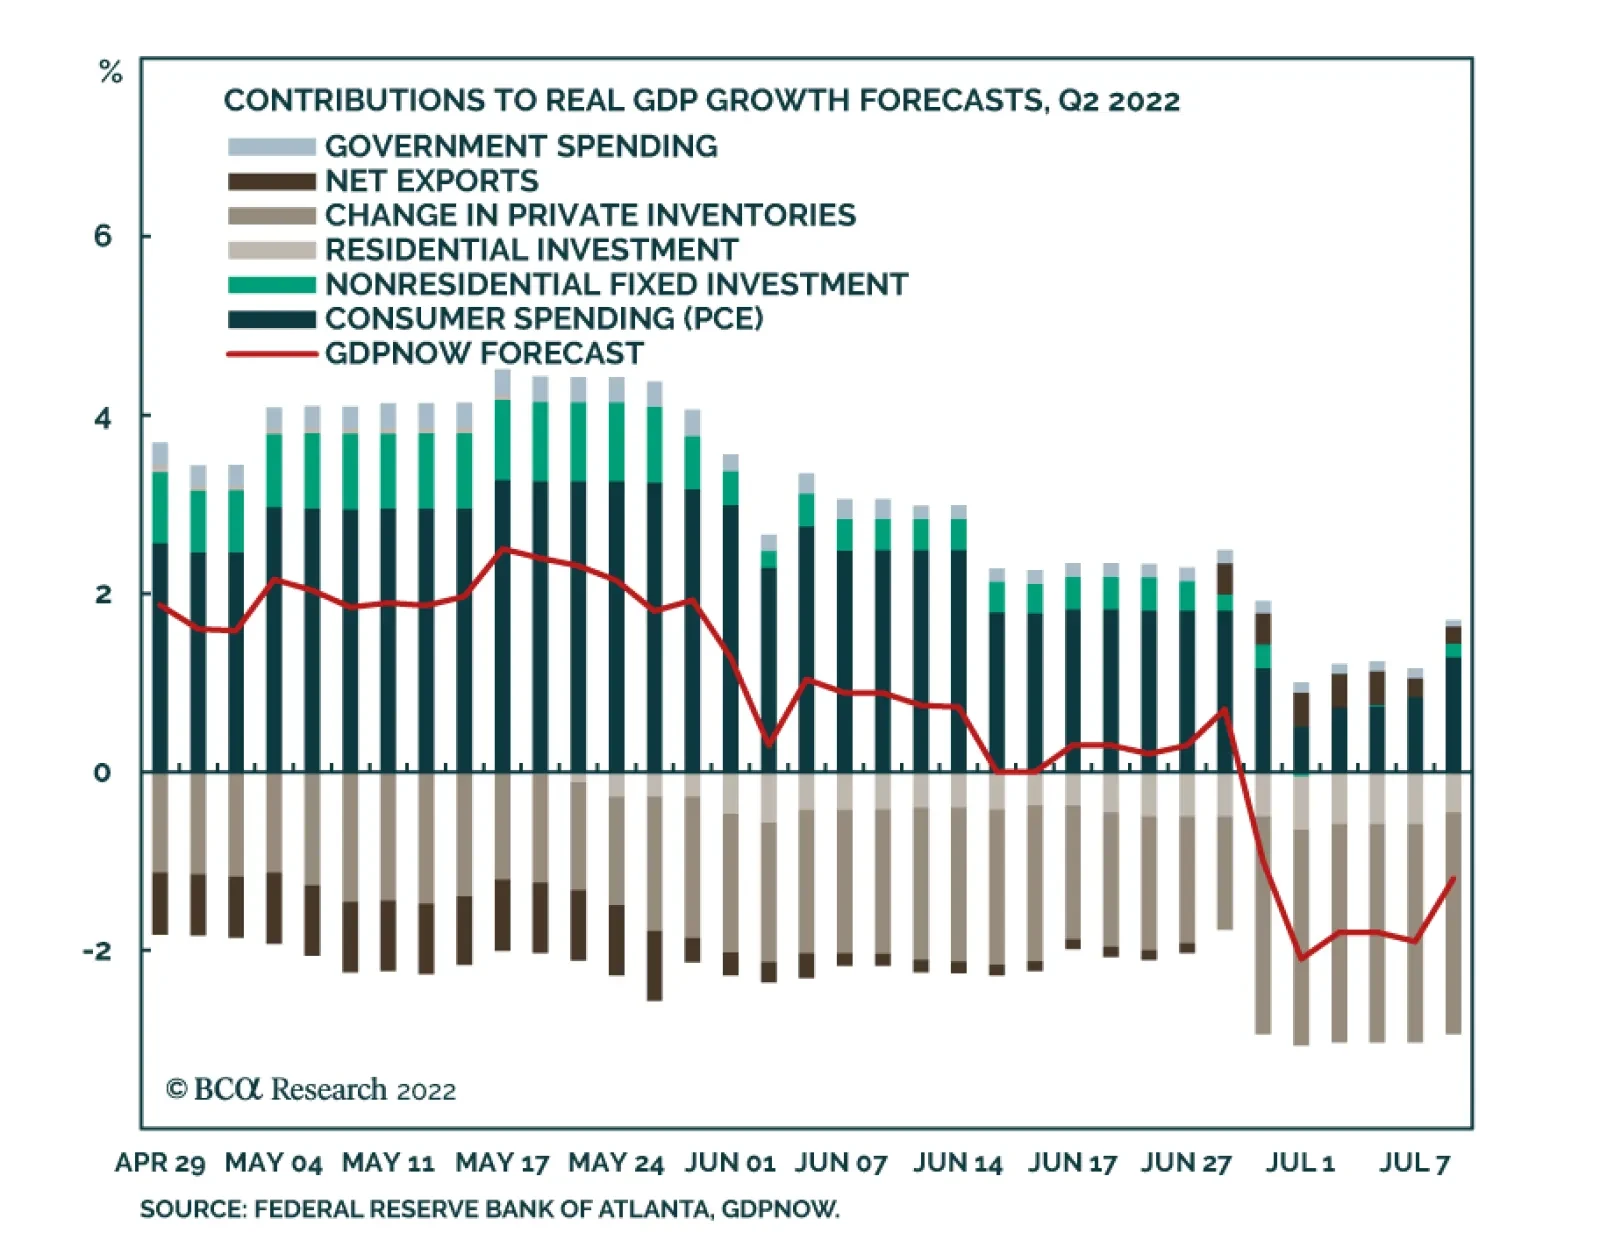
The Atlanta Fed’s GDPNow model is sending an extremely pessimistic signal about the US economy. Since mid-May, its estimates of Q2 GDP growth have been consistently deteriorating. Although June’s robust non-farm payroll release led to an upward revision, the…
According to BCA Research’s European Investment Strategy service, while EUR/USD possesses ample upside over the coming 12 months, there is roughly a 1/3 chance that it will plunge to 0.9 by the winter. The euro benefits from important tailwinds that…
Executive Summary Don’t Try Catching Falling Euros
Don"t Try Catching Falling Euros
Don"t Try Catching Falling Euros
The euro is inexorably moving toward parity. However, many positives could still save EUR/USD, a cheap currency that will benefit if the fears of a global recession recede and if European inflation peaks by the fall. Nonetheless, many fundamental risks still weigh on the euro, including the dollar’s momentum and the continuing ructions in the European energy market. Moreover, technical vulnerabilities are likely to amplify the potential weakness in the euro. There is greater than a 30% chance that EUR/USD will fall to 0.9 or below. As a result, it is preferable to stay on the sidelines and opt for a neutral stance on the EUR/USD. Selling EUR/JPY offers a more attractive reward-to-risk ratio than EUR/USD. The GBP remains under threat. Bottom Line: Don’t be a hero. At this juncture, the EUR/USD outlook remains particularly uncertain. While EUR/USD possesses ample upside over the coming 12 months, there is roughly a 1/3 chance that it will plunge to 0.9 by the winter. Investors should sell EUR/JPY instead. The euro’s race toward parity continues. From May 12 to July 1, EUR/USD attempted to form a triple bottom at 1.0375 that could have marked the end of this year’s decline. Alas, the euro did not hold that floor and now traders are inexorably pushing the common currency lower. The outlook for the euro is complex. At current levels, it is inexpensive and discounts many negative developments affecting both the global and European economies. However, the EUR/USD’s weakness is also a story of dollar strength, and the deteriorating global economic momentum remains the Greenback’s best friend, to the euro’s detriment. For now, we stick to our mantra of the past few months: don’t be a hero. The euro may soon bottom, but enough risks lie ahead that a move below 0.9 against the dollar should not be discarded. The risk-reward from bottom fishing is therefore poor. Instead, investors should sell EUR/JPY, for which downside remains ample. What We Like About The Euro… Despite the pervasive negativity engulfing the euro, there are plenty of positives that will soon help EUR/USD form a bottom. First, the euro is cheap on most metrics. The Purchasing Power Parity (PPP) model developed by BCA’s Foreign Exchange Strategists adjust for the different consumption baskets in the Eurozone and the US. It currently shows that EUR/USD trades 25% below fair value, its deepest discount since 2001. This degree of undervaluation is associated with a high probability of strong long-term returns for the euro (Chart 1). Based on interest rate parity and risk aversion, the euro also trades well below its fair value. Steep discounts are often followed by an imminent rebound in the currency (Chart 2). However, the euro hit a similar discount in January, but failed to rally because of the problems in the energy markets prompted by Russia’s invasion of Ukraine. Chart 1Strong Long-Term Returns based on PPP
Strong Long-Term Returns based on PPP
Strong Long-Term Returns based on PPP
Chart 2Oversold on Many Metrics
Oversold on Many Metrics
Oversold on Many Metrics
Second, the euro is oversold. Both BCA’s Intermediate-Term Technical Indicator and the Citi FX Euro PAIN Index are very depressed, which indicates pervasive negative sentiment toward the euro (Chart 2, bottom two panels). This kind of extremes in momentum are often followed by a euro rally. Chart 3Global Recession Fears Hurt EUR/USD
Global Recession Fears Hurt EUR/USD
Global Recession Fears Hurt EUR/USD
Third, global economic pessimism is widespread. EUR/USD is a pro-cyclical pair, which mostly reflects the counter-cyclicality of the dollar and the great liquidity of the euro. It is therefore not surprising that spikes in global recession concerns are associated with a weakening EUR/USD (Chart 3). The recent wave of depreciation happened contemporaneously with a spike in Google searches for the word “recession.” If these fears, which reached extreme levels, subside further in the months ahead, the euro may benefit greatly. Fourth, pessimism toward China may ease, which would lift the euro in the process. Last week, it was announced that Beijing is considering allowing local governments to sell RMB1.5 trillion of special government bonds in the second half of the year to fund infrastructure spending. The news caused a rebound in the AUD, Brazilian assets, and copper. Europe too would benefit from greater activity in China. Chart 4Chinese Salvation?
Chinese Salvation?
Chinese Salvation?
Chinese monetary conditions are also easing, which historically supports industrial activity in Europe relative to the US (Chart 4, top panel). The change in approach in the implementation of the zero-COVID policy is helping Chinese PMIs rebound, which will eventually translate into higher European shipments to China. Moreover, the rate of change of the performance of real estate stocks relative to the broad market has turned the corner, which may facilitate a stabilization of Chinese real estate transactions (Chart 4, second panel). Ultimately, the expanding excess reserves in the Chinese banking system point toward a stabilization of the performance of EUR/USD later this year (Chart 4, bottom panel). Fifth, our expectation that European inflation will peak by the autumn will prove the greatest help to the euro. The EUR/USD’s weakness over the past twelve months has coincided with a surge in European inflation surprises (Chart 5, top panel). This relationship reflects the negative impact on European real rates of both stronger realized and expected inflation (Chart 5, second panel). Investors understand that Europe’s inflation crisis is driven by a relative price shock in the energy market that greatly hurts economic activity in the Eurozone. Hence, even if they expect the ECB to increase interest rates, they believe policy rates will lag inflation because of Europe’s poor growth outlook. This is particularly true when compared to the US Fed. As a result, European real rates continue to lag far behind US ones and the European yield curve is steeper than that of the US, because traders foresee easier policy on the Eastern shores of the Atlantic (Chart 5, panel three and four). Chart 5Inflation Hurts the Euro
Inflation Hurts the Euro
Inflation Hurts the Euro
Chart 6Declining Inflation Expectations? Declining Inflation Expectations?
Declining Inflation Expectations? Declining Inflation Expectations?
Declining Inflation Expectations? Declining Inflation Expectations?
This situation is fluid and inflation expectations have begun to decrease. The recent easing in energy prices has contributed to a decline in long-term inflation expectations (Chart 6). We argued last week that the energy inflation is arithmetically set to decrease over the coming twelve months, which suggests further downside in inflation expectations is likely. Moreover, four of the five largest weights in the Eurozone HICP are running hot, but all are linked to commodity inflation, which confirms our bias that European inflation will soon peak (Chart 7). A top in both headline and core inflation will drag short- and long-term inflation expectations lower, which will help European real rates (Chart 8). Meanwhile, lower imported energy inflation will limit the damage to European economic activity, allowing the ECB to increase rates anyway. Chart 7Key HICP Components
Key HICP Components
Key HICP Components
Chart 8A durable Decline In Expected Inflation Depends On Realized Inflation
A durable Decline In Expected Inflation Depends On Realized Inflation
A durable Decline In Expected Inflation Depends On Realized Inflation
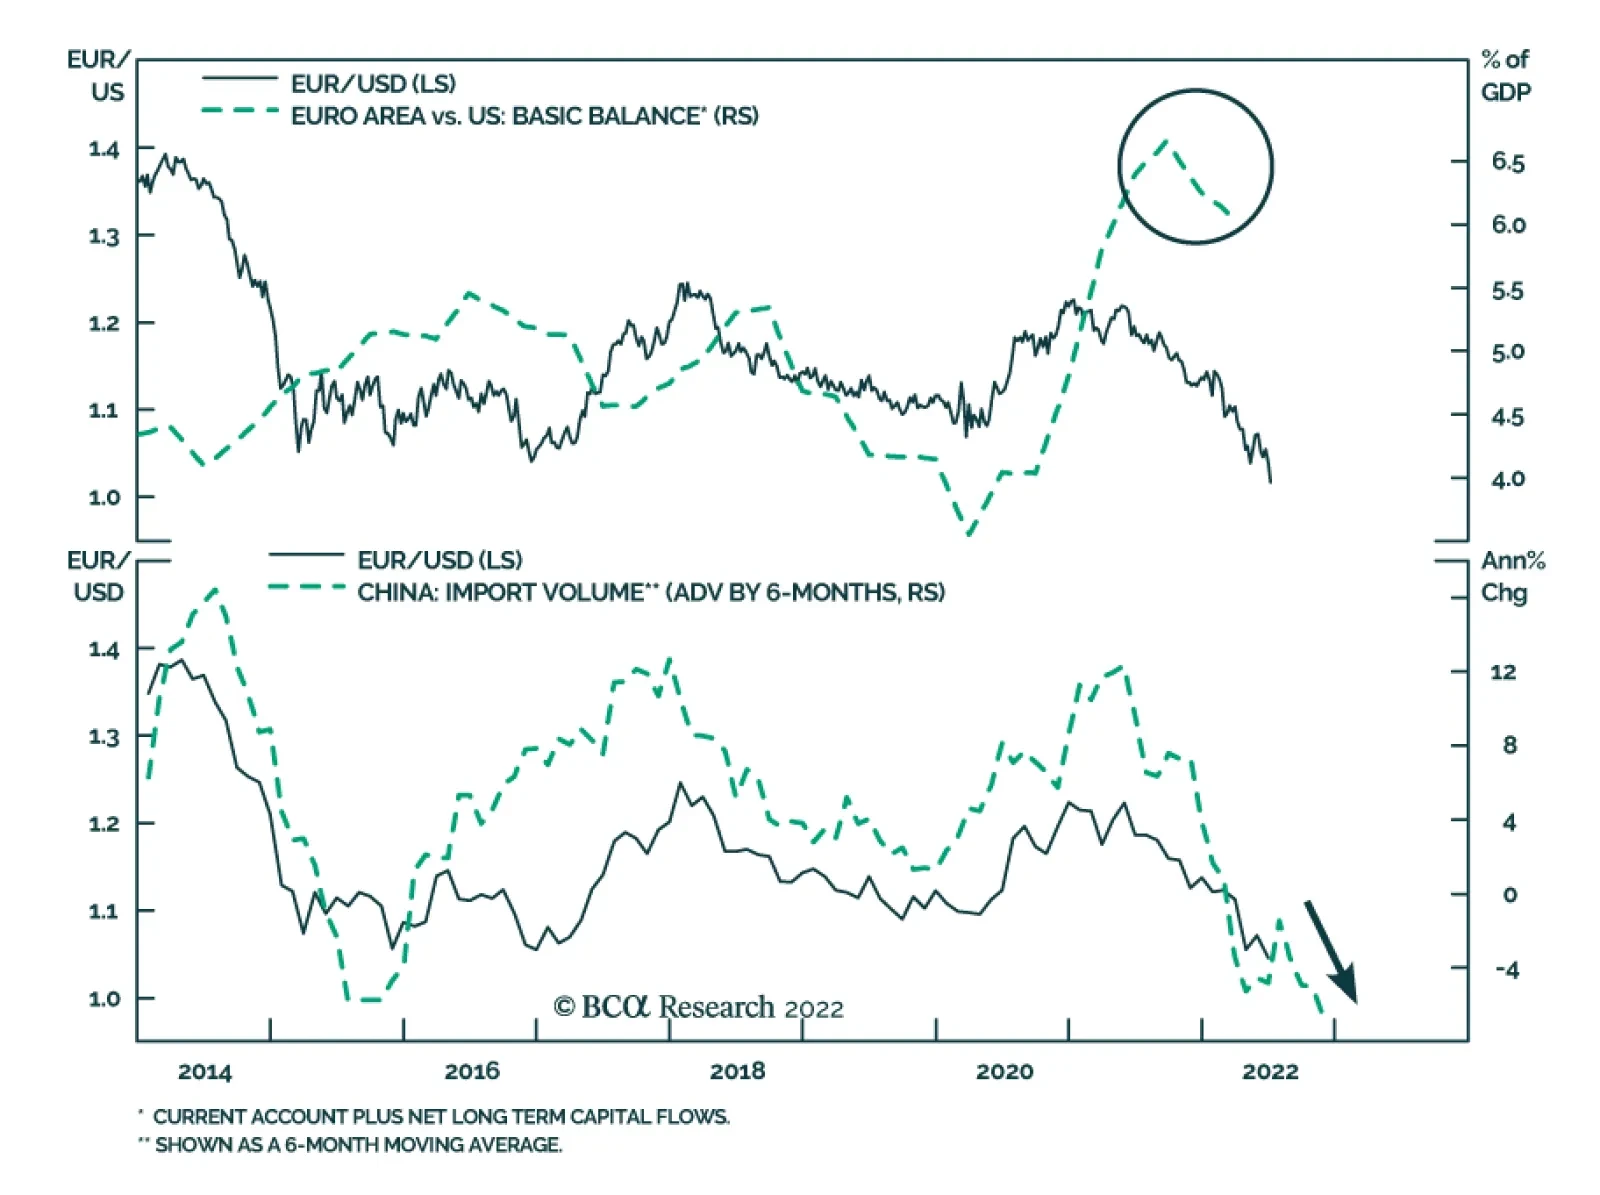
Chart 9Balance Of Payment Support
Balance Of Payment Support
Balance Of Payment Support
Bottom Line: The euro benefits from important tailwinds that suggest EUR/USD will be higher 12 to 18 months from now. It is cheap and oversold and the pervasive gloom among investors about the state of the global economy indicates that many negatives are already embedded in its pricing. Moreover, the Chinese economy could stabilize in the second half of 2022 and into 2023, which will hurt the dollar and boost the euro. Crucially, a peak in European inflation will allow European real rates to recover and curtail the handicap keeping EUR/USD under pressure, especially as the basic balance of payment remains in the euro’s favor (Chart 9). … And What We Don’t EUR/USD may benefit from some important tailwinds, but it is still burdened by massive handicaps. The first problem that will place downward pressure on the euro is that its weakness is not unique and that it reflects broad-based dollar strength (Chart 10). This is a problem for the euro because the dollar (and the yen) is the foremost momentum currency in the G10. Its strength begets further strength, and the momentum signal from moving average crossovers remains dollar-bullish. This headwind for the euro could even intensify in the coming months. JP Morgan EM FX Index is breaking down to new lows, which points to further tightening in EM financial conditions. Historically, tighter EM FCIs translate in both weaker Eurozone stock prices and a weaker EUR/USD, which reflects the closer link between the Euro Area and EM economies than between the US and EM (Chart 11). Chart 10The Dollar's Strength Is Broad-Based
The Dollar's Strength Is Broad-Based
The Dollar's Strength Is Broad-Based
Chart 11More Trouble In Store
More Trouble In Store
More Trouble In Store
This phenomenon is exacerbated by the underlying weakness in global economic activity. Arthur Budaghyan, BCA’s EM Chief Strategist, often reminds us that Asian exports remain soft. Additionally, the deterioration in US economic activity is likely to continue, as suggested by the weakness in the ISM new orders-to-inventories ratio and by the poor readings from the Regional Fed Surveys. Slowing US growth will generate a further decline in the business-sales-to-inventory ratio, which often coincides in a strong dollar and a weak euro. Chart 12Past Chinese Weaknesses Linger
Past Chinese Weaknesses Linger
Past Chinese Weaknesses Linger
The second problem for EUR/USD is that China’s economic outlook may be improving in the future, but, for now, the impact of the recent Chinese slowdown continues to hamper Europe. More specifically, the recent decline in Chinese import volumes is consistent with a euro-bearish backdrop for the remainder of this year (Chart 12, top panel). In fact, even if the CNY remains stable against the USD, this does not guarantee a positive outcome for the euro as the past weakness in Chinese import volumes is also consistent with a depreciating EUR/CNY (Chart 12, bottom panel) The third euro-negative force is the natural gas market. As we showed last week, Dutch natural gas prices must settle between EUR500-600/MWh this upcoming winter to have the same inflationary impact as they did over the past 18 months. This is unlikely to happen, even according to the direst forecasts of BCA’s Commodity and Energy strategists. However, there is a greater than 30% chance that Europe must ration electricity this winter, which would cause a violent output contraction. As a result, any fluctuation in natural gas flows in Europe will cause the market-based odds of a European recession to swing widely. Consequently, the negative correlation between EUR/USD and TTF prices observed over the past twelve months is likely to remain intact (Chart 13). Related Report European Investment StrategyQuestions From The Road The fourth issue hurting the euro is the US’s comparative isolation from the energy market’s travails. The US is a haven of relative economic stability today. Yes, its growth will slow further, but it is nonetheless set to outperform the Eurozone. The US is not under threat of rationing energy this winter. Moreover, the US terms of trades benefit from rising energy prices, unlike Europe (Chart 14). Furthermore, the US output gap is closing faster than that of in the Eurozone (Chart 14, bottom panel). As a result, the odds of dovish surprises by the ECB are much greater than those by the Fed. Chart 13Neutral Gas Is Still A Drag
Neutral Gas Is Still A Drag
Neutral Gas Is Still A Drag
Chart 14The US As A Haven Of Stability
The US As A Haven Of Stability
The US As A Haven Of Stability
The US’s relative resilience might also impact equity flows over the next few months in a euro-bearish fashion. US EPS have been stable relative to Euro Area ones, even in local currency terms. Interestingly, because relative EPS reflect broader economic forces, EUR/USD follows them (Chart 15). Thus, if the European economic outlook deteriorates further relative to that of the US, chances are high that Eurozone EPS estimates will be revised down relative to the US, which will coincide with a lower EUR/USD. In fact, the recent underperformance of Eurozone small-cap stocks (which are domestically focused) relative to European large-cap equities (which derive a greater proportion of their sales abroad) and US small-cap shares also confirms the worsening relative economic outlook between Europe and the US, and thus portend significant near-term risks to EUR/USD (Chart 16). Chart 15Follow Earnings Estimates
Follow Earnings Estimates
Follow Earnings Estimates
Chart 16Small Caps Indicate More EUR Selling
Small Caps Indicate More EUR Selling
Small Caps Indicate More EUR Selling
Chart 17An ECB Bungle Would Burden The Euro
An ECB Bungle Would Burden The Euro
An ECB Bungle Would Burden The Euro
The last major fundamental risk weighing on EUR/USD is the significant probability that the ECB will disappoint markets with respect to its anti-fragmentation tool to be announced in July. Investor expectations are lofty. However, internal divisions within the ECB Governing Council remain, and, most importantly, the ECB is hamstrung by previous ECJ and German Constitutional Court rulings on bond purchases. Thus, our base case remains that the development of an appropriate bond purchase program will be an iterative process resulting from a back-and-forth between market tensions and ECB responses. As a result, there are risks of further widening in Italian spreads as well as European corporate bond spreads. These developments would further hurt the euro (Chart 17). Chart 18Much Selling To Be Unleashed Sentiment Could Get More Negative
Much Selling To Be Unleashed Sentiment Could Get More Negative
Much Selling To Be Unleashed Sentiment Could Get More Negative
These fundamental problems with EUR/USD do not guarantee that the euro will punch below parity. After all, there are also plenty of positives with this currency. However, the risk of a violent selloff is elevated, at around 30%, because of underlying technical vulnerabilities. Global market liquidity has deteriorated in recent years, and this phenomenon is also impacting FX markets, resulting in sudden jumps being more frequent. Most crucially, the odds are high that automatic selling will be triggered if the euro tests parity, which would result in a cascading decline for a euro entering territory that has not been charted for the past 20 years. Specifically, speculators are marginally short the euro (Chart 18, top panel) and 1-month and 3-month risk reversals in the option markets are not yet at a capitulation point (Chart 18, bottom panel). Thus, if panic sets in, the euro could easily fall below 0.9, where the strongest supports lie. In essence, we worry that a sudden crash in the euro is becoming a growing threat. Bottom Line: The combination of the dollar’s momentum, the lagging impact of China’s economic woes, the risks to Europe’s energy supplies, the relative stability of the US economy, and the heightened chance that the ECB underdelivers with respect to its anti-fragmentation tool later next week all point to significant risks to the euro in the coming months. Moreover, the technical vulnerabilities present in the FX market suggest that, if further downside takes place, it will not only be large but also rapid. Investment Conclusions The dilemma between views and strategy is greatest with the euro today. There are many positives highlighted in this report that suggest that the euro has upside on a 12-month basis. However, the risks are abundant, and the potential downside in the coming six months not only carries a large probability, it is also likely to be pronounced if it takes place. As a result of this configuration, we fall back to the strategy we had adopted for European equities earlier this year: don’t be a hero. Even if the euro bottoms tomorrow, the risks are such that capital preservation remains paramount. Consequently, we recommend that investors stay on the sideline and maintain a neutral stance on EUR/USD. It is just as risky to try to bottom fish this pair as it is to chase it lower from current levels. Chart 19Sell EUR/JPY
Sell EUR/JPY
Sell EUR/JPY
Instead, we follow BCA’s Foreign Exchange Strategists recommendation to go short EUR/JPY as a bet with a lower risk-reward ratio. Global recession worries and weakening commodity inflation are likely to allow for greater downside in global yields, which often results in a lower EUR/JPY (Chart 19). Additionally, investors do not expect much out of the BoJ this year, but if recession risks intensify in Europe because of energy rationing this winter, there is room to curtail the interest rate pricing for the ECB embedded in the €STR curve. Furthermore, the JPY is the cheapest currency in the G10. Finally, investors wanting to build greater exposure to European currencies should do so via the Swiss franc. We argued three weeks ago that the CHF enjoys significant structural tailwinds because of the Swiss economy’s strong productivity. Additionally, the SNB is no longer intervening to limit the CHF upside, as demonstrated by the decline in its current deposits. Instead, a stronger Swiss franc is the most potent weapon in the SNB’s arsenal to combat inflation. Moreover, the CHF offers a hedge against both recession risks in the Eurozone and further widening in European spreads. Bottom Line: Don’t be a hero. EUR/USD’s outlook is uniquely uncertain now. While many factors point to positive returns on a 12-to-18 month basis, if the euro hits parity in response to the many clouds still hanging over Europe, technical factors could plunge this currency to EUR/USD 0.9 into a steep decline. Instead, the clearer call is to sell EUR/JPY. Investors who want to assume a European FX exposure today should do so through the Swiss franc, not the euro. A Few Words On The UK Last week, Prime Minister Boris Johnson resigned. The initial response of the pound was to rebound. This reaction should fade. BCA Geopolitical strategists argue that, even though the person sitting at 10 Downing Street is about to change, the fundamental problems with the UK remain the same. The Labour Party is ascending, but it will still have to deal with the Brexit aftermath, rising populism, and popular discontent across the country. The economy is still fragile and engulfed in an inflationary spiral. Meanwhile, the risks created by a looming Scottish independence referendum are much more significant than was the case in 2014. As a result, the pound is likely to remain under stress over the coming quarters. Mathieu Savary, Chief European Strategist Mathieu@bcaresearch.com Tactical Recommendations Cyclical Recommendations Structural Recommendations
Dear client, In lieu of July 18 publication, I will be hosting our quarterly webcast that I invite you to join. Our regular weekly publication will resume Monday, July 25. Kind Regards, Irene Tunkel Chief Strategist, US Equity Strategy Deploy Fresh Capital Into Growth At The Expense Of Value In early June, we closed our Growth/Value underweight by moving the ratio to benchmark allocation and crystallizing just under 9% in gains. At the time, we also wrote that we would upgrade Growth and downgrade Value once uncertainty about inflation and the Fed’s action recedes. Today, we believe that the time is ripe for making a move: We are upgrading Growth to overweight, and downgrade Value to underweight. The following are the reasons for a change in positioning: Chart 1Deploy Fresh Capital Into Growth At The Expense Of Value
Deploy Fresh Capital Into Growth At The Expense Of Value
Deploy Fresh Capital Into Growth At The Expense Of Value
Inflationary pressures will ease: There are early signs that inflation is about to turn - prices of energy and commodities are down 20% and 13% off their peaks respectively. A turn in inflation heralds a change in market leadership from Value to Quality and Growth (Chart 1). Chart 2
Deploy Fresh Capital Into Growth At The Expense Of Value
Deploy Fresh Capital Into Growth At The Expense Of Value
Economic growth is slowing: The market focus has shifted away from inflation and has turned towards worries about growth as is evident in the falling 10-year Treasury yield, which decreased from its peak at 3.5% to 3.0% over the past couple of weeks. The environment of slowing growth and falling rates is a tailwind for growth stocks. In a world where growth is becoming scarcer, companies that can deliver growth will shine. These are “growth” companies, i.e., large, stable companies with strong balance sheets that are able to generate positive cash flow and churn out strong earnings even under economic duress. Quality growth outperforms during slowdowns (Chart 2). Earnings Growth Expectations: Analysts expect earnings of Value to grow by over 10% over the next twelve months and Growth by 8.0%. While earnings growth expectations for value stocks appear more attractive, we believe that they will be downgraded. Value stocks are dominated by cyclicals (Chart 3), and as we wrote in the Tuesday's publication, this is the area of the market in which analysts have the least certainty in their estimates and downgrades are imminent. Growth is oversold relative to Value: The Growth/Value ratio is extremely oversold sitting at a level exceeded only during the dot-com crash and on par with the 1970-1980 inflationary era (Chart 4). Chart 3
Deploy Fresh Capital Into Growth At The Expense Of Value
Deploy Fresh Capital Into Growth At The Expense Of Value
Chart 4
Deploy Fresh Capital Into Growth At The Expense Of Value
Deploy Fresh Capital Into Growth At The Expense Of Value
Bottom Line: Slowing growth, impending turn in inflation, and attractive technicals are key reasons for our upgrade of Growth to overweight at the expense of Value.