Disasters/Disease

Dear Client, In addition to this week’s report, BCA Research will hold webcasts over the coming days to discuss the economic and financial outlook amid the myriad of uncertainties gripping global markets. I will take part in a roundtable discussion alongside my fellow BCA Strategists Arthur Budaghyan, Mathieu Savary, and Caroline Miller for a live webcast on Friday, March 13 at 8:00 AM EDT (12:00 PM GMT, 1:00 PM CET, 8:00 PM HKT). In addition, I will hold a webcast on Monday, March 16 at 12:00 PM EDT (4:00 PM GMT). Best regards, Peter Berezin, Chief Global Strategist Highlights A global recession is now a fait accompli. The only question is whether there will be a technical recession lasting a couple of quarters, or a more prolonged downturn that produces a sizeable increase in unemployment rates. We lean towards the former outcome. Unlike during most recessions, the decrease in labor demand will be mitigated by a decline in labor supply, as potentially millions of workers are confined to their homes. This will limit the rise in unemployment, at least initially. The pandemic is likely to prompt firms to increase inventory levels for fear of further disruptions to their supply chains. This should provide a short-term boost to output. While it is possible that spending will remain broadly depressed even after the panic subsides, this seems unlikely. Private-sector finances were reasonably strong going into the crisis, while ultra-low government bond yields will incentivize increased fiscal outlays. Spending on leisure travel and public entertainment will remain subdued well into 2021, but much of this demand will be redirected to other categories of discretionary consumer purchases, particularly in the online realm. Health care expenditures will also increase. The collapse in oil prices following the breakdown of OPEC 2.0 represents a positive supply shock for the global economy, albeit one that will have negative consequences for oil-extraction sectors. We tactically upgraded stocks on the morning of Friday, February 28. That was obviously a major mistake: While global equities did rally 7% higher after our upgrade, they have since given up all their gains (and then some). For now, we are maintaining a modest overweight recommendation to equities. However, this is a low-conviction view, and we would not dissuade more conservative investors from reducing risk exposure. We would only consider upgrading stocks to a high-conviction overweight if the S&P 500 dropped to 2250, or the number of new infections outside of China peaked. In the meantime, we are downgrading high-yield credit tactically, as the odds of earnings weakness prompting a near-term rise in default expectations warrant caution. What A Way To Start The Decade So far, the 2020s may not be roaring, but they are certainly not boring. At the outset of the crisis, there were three scenarios for the COVID-19 outbreak: 1) A regional epidemic largely confined to China; 2) a series of global outbreaks, successfully short-circuited by a combination of government intervention and voluntary “personal distancing” measures; 3) A full-blown pandemic that exposes a significant proportion of the planet to the virus. Unfortunately, the first scenario has been ruled out. Policymakers are now trying to achieve the second scenario. Successful containment would “flatten the curve” of new infections, while allowing the sick to receive better treatment than they would otherwise. It would also buy precious time to develop a vaccine and increase the output of face masks, hand sanitizers, and other products that could slow the spread of the disease. Health Versus Growth Ironically, while the second scenario is clearly preferable to a full-blown pandemic from a health perspective, it may be more damaging from the very narrow, technical perspective of GDP accounting. It all depends on how severe the measures to quash each outbreak need to be. If simple hygiene measures and social distancing turn out to be enough, the economic fallout will be minimal. If ongoing mass quarantines and business closures are necessary, the damage will be severe. History suggests that containment efforts can work. During the Spanish flu, US cities such as St. Louis, which took early action to slow the spread of the disease, ended up with far fewer deaths than cities such as Philadelphia which did not (Chart 1). Western Samoa did not impose any travel restrictions and lost a quarter of its population. American Samoa closed its border and suffered no deaths. Chart 1Containment Efforts Can Be Effective: The Case Of The Spanish Flu
Contagion
Contagion
Recent experience suggests that COVID-19 can be stopped, even after community contagion has set in. The number of new Chinese cases has fallen from 3,892 on February 5 to 31 on March 11. South Korea seems to be getting the virus under control. The number of new cases there has declined from 813 on February 29 to 242 (Chart 2). Japan and Singapore also appear to be succeeding in preventing the virus from spreading rapidly. Chart 2Coronavirus: The Authorities In East Asia Seem To Be In Control Of The Situation
Contagion
Contagion
What remains unclear is whether other countries can replicate East Asia’s experience. A recent Chinese study estimated that R-naught – the average number of people someone with the virus ends up infecting – fell from 3.86 at the outset of the outbreak to 0.32 following interventions (Chart 3).1 In other words, China was able to lower R-naught to one-third of what was necessary to stabilize the number of new infections. If one wanted to be optimistic, one could argue that other countries could get away with less heavy-handed measures, even if it is at the expense of a somewhat slower decline in the infection rate. Chart 3Severe Containment Measures Have Changed The Course Of The Wuhan Outbreak
Contagion
Contagion
Unfortunately, given how contagious the virus appears to be, it is unlikely that simple measures such as regularly washing one’s hands, avoiding large gatherings, and wearing a face mask in public when sick will suffice. Trade-offs will have to be made between growth and health. Moreover, if the virus becomes endemic in a few countries that do not have the institutional capacity to contain it, this could create a viral reservoir that produces repeated outbreaks in the wider world. The result could feel like a ghastly game of whack-a-mole. The Fatality Rate The degree to which countries pursue costly containment measures depends on how deadly the virus turns out to be. On the one hand, there is some evidence that the fatality rate from COVID-19 is lower than the 2%-to-3% that has been widely reported once mild or asymptomatic cases, which often go undetected, are taken into account. This may explain why South Korea, which has arguably done a better job of testing suspected patients than any other country, has reported a fatality rate of only 0.7%. Like the seasonal flu, the death rate from COVID-19 appears to be heavily tilted towards the elderly. In Italy, 89% of COVID-19 deaths have occurred among those who are 70 and older. On the ill-fated Diamond Princess cruise liner, not a single person under the age of 70 has died. The fatality rate for passengers on the ship older than 70 is 2.4%. The seasonal flu kills about 1% of those it infects over the age of 70. Based on this simple calculation, COVID-19 is more lethal, but not light-years more lethal, than the typical flu (and possibly less lethal than the flu is for young children). Unfortunately, these optimistic estimates assume that patients with COVID-19 can continue to receive appropriate care. As we saw in Wuhan, where the official death rate stands at 4.5% compared to 0.9% in the rest of China, and as we are now seeing in Italy, once the health care system becomes overwhelmed, death rates can rise sharply. Bottom Line: Containing the virus will be economically costly, but given the potentially large death toll from a full-blown pandemic, most countries will be willing to pay the price. A Global Recession Even before the virus became endemic outside China, we estimated that global growth would fall to zero on a quarter-over-quarter basis in Q1. As we cautioned back then, the risk to our forecast was tilted to the downside, and that has proven to be the case. We now expect the global economy to shrink not just in the first quarter but in the second quarter as well, as country after country experiences a surge in new infections. Two consecutive quarters of negative growth constitute a technical recession. Despite the drop in new cases in China over the past two weeks, most high-frequency measures of economic activity such as property sales, railway-loaded coal volumes, and traffic congestion have yet to return anywhere close to normal levels (Chart 4). In the US, hotel occupancy rates, movie ticket sales, and attendance at sporting events were all close to normal levels as of last week. However, that is changing quickly. Already, automobile traffic in Seattle, one of the cities most hard-hit by the virus, has fallen sharply (Chart 5). Chart 4China: It Will Take Time For Life To Return To Normal
Contagion
Contagion
Chart 5US: Staying Home More In Seattle Due To The Virus?
Contagion
Contagion
Qualitatively Different While a recession in the first half of 2020 is now unavoidable, the nature of this recession is likely to be quite different than in the past. To understand why, it is useful to review what causes most recessions. A typical recession involves a prolonged loss of aggregate demand. Such a loss of demand can result from either financial market overheating or economic overheating. Financial market overheating can occur if a credit-fueled asset bubble bursts, leaving people with less wealth struggling to pay off debt. For example, US residential investment fell from 6.6% of GDP in 2005 to 2.5% of 2010. Thus, even after the credit markets thawed, there was still a large hole in aggregate demand that needed to be filled. A similar, though less severe, loss of demand occurred when the bursting of the dotcom bubble led to severe cutbacks in IT spending. Economic overheating occurs when a lack of spare capacity puts upward pressure on inflation. Wary of accelerating prices, central banks slam on the brakes, raising interest rates into restrictive territory. This often results in a recession. In both types of recessions, there are usually second-round effects that can swamp the initial shock to aggregate demand. As spending falls, firms start to lay off workers. The resulting loss in household income leads to less spending. Even those who retain their jobs are apt to feel less confident, leading to an increase in precautionary savings. For their part, businesses tend to cut production as inventory levels swell. Things only return to normal once enough pent-up demand has accumulated and/or policy has become sufficiently stimulative to revive spending. Framed in this way, one can see that the current downturn differs from past downturns in at least three important respects. First, unlike during most recessions, the decrease in labor demand this time around will be partly mitigated by a decline in labor supply, as potentially millions of workers are confined to their homes. While this will not prevent many workers from temporarily losing income, it will limit the increase in unemployment, at least initially. We have already seen this in China, where GDP growth collapsed but companies are complaining about a shortage of migrant labor. Second, rather than falling, inventory levels may actually rise. Since companies will have to deal with pervasive supply shocks of unknown frequency, duration, and magnitude, their natural inclination will be to increase inventory levels for fear that they will not be able to access their supply chains when they need them. If recent reports of hoarding of toilet paper and bottled water are any guide, the same sort of behavior will show up among consumers. Again, in the short term, this additional demand will help to keep unemployment from rising as much as it would otherwise. Third, and perhaps most importantly, the ongoing crisis is the result of an exogenous shock rather than an endogenous slowdown. In fact, a variety of economic indicators such as US payrolls, the Chinese PMI, and German factory orders were all pointing to an acceleration in global growth before the crisis began. This suggests that growth could recover quickly once the panic subsides. While it is impossible to say with any degree of certainty how long it will take for the panic to end, it may not last as long as many fear. Investors should particularly pay attention to the situation in Italy. If the number of new cases peaks there, it could create a sense that other western countries will be able to get the virus under control. Second-Round Effects? Although it is possible that economies will remain depressed even after the panic subsides, this seems unlikely. Private-sector finances were reasonably strong going into the crisis. The private-sector financial balance – the difference between what companies and households earn and spend – is in surplus in most countries, including China (Chart 6). Chart 6The Private Sector Spends Less Than It Earns In Most Economies
Contagion
Contagion
Chart 7Lower Oil Prices Eventually Lead To Higher Growth
Lower Oil Prices Eventually Lead To Higher Growth
Lower Oil Prices Eventually Lead To Higher Growth
Granted, not all sectors are likely to prove equally resilient. Spending on leisure travel and public entertainment will remain subdued well into 2021. The collapse in oil prices following the breakdown of OPEC 2.0 will also wreak havoc on oil producers. In both cases, however, there will be offsetting benefits. Much of the demand for travel and entertainment will be redirected to other categories of discretionary consumer purchases, particularly in the online realm. And while lower oil prices will hurt producers, they represent a boon for consumers and companies that use petroleum as an input. In general, as Chart 7 illustrates, global growth usually accelerates following declines in oil prices. Fiscal Policy Will Turn More Stimulative Even before the crisis began, we argued that most governments should permanently increase fiscal deficits in order to raise the neutral rate of interest. At the current juncture, with a recession upon us and government bond yields at ultra-low levels, the failure to enact meaningful fiscal stimulus would be economic malpractice of the highest order. In addition to easing measures being rolled out by central bankers, our sense is that we will get a lot of fiscal stimulus, sooner rather than later. During most recessions, there is always a chorus of voices from people whose own jobs are secure about how a downturn is necessary to cleanse the system. This time around, it is obvious that the victims are not to blame. Politicians will not endear themselves to voters by denying the need for fiscal support to households struggling with medical bills and lost time from work and businesses facing bankruptcy. President Trump’s pledge this week to cut payroll taxes and increase transfers to those affected by the virus is just a taste of what’s to come. Investment Conclusions Chart 8Stock-To-Bond Ratio: A Lot Of The Bad News Has Already Been Priced In
Stock-To-Bond Ratio: A Lot Of The Bad News Has Already Been Priced In
Stock-To-Bond Ratio: A Lot Of The Bad News Has Already Been Priced In
We tactically upgraded stocks on the morning of Friday, February 28. That was obviously a major mistake: While global equities did rally 7% higher after our upgrade, they have since given up all their gains (and then some). In retrospect, we should have paid more attention to our own analysis in our report “Markets Too Complacent About The Coronavirus.” For now, we are maintaining a modest overweight recommendation to equities. The total return ratio between stocks and bonds has fallen by a similar magnitude as in the run-up to prior recessions, suggesting that much of the bad news has already been priced in (Chart 8). Nevertheless, significant downside risks remain, which is why we would characterize our equity overweight as a fairly low-conviction view. We would not dissuade more conservative investors from reducing risk exposure. As discussed above, containing the virus could lead to significant economic disruptions. We would only consider upgrading stocks to a high-conviction overweight if the S&P 500 dropped to 2250, or the number of new infections outside of China peaked. In the meantime, we are downgrading high-yield credit tactically, as the odds of earnings weakness prompting a near-term rise in default expectations warrant caution. Safe-haven government bond yields will probably not rise much from current levels, at least in the near term. The Fed cut rates by 50 basis points last week and will cut rates by another 50 basis points next week. Looking further out, however, bonds are massively overvalued and will suffer mightily as life returns to normal. Peter Berezin Chief Global Strategist peterb@bcaresearch.com Footnotes 1Chaolong Wang, Li Liu, Xingjie Hao, Huan Guo, Qi Wang, Jiao Huang, Na He, Hongjie Yu, Xihong Lin, Sheng Wei, and Tangchun Wu, “Evolving Epidemiology and Impact of Non-pharmaceutical Interventions on the Outbreak of Coronavirus Disease 2019 in Wuhan, China,”medrxiv.org, March 6, 2020. Global Investment Strategy View Matrix
Contagion
Contagion
MacroQuant Model And Current Subjective Scores
Contagion
Contagion
Strategic Recommendations Closed Trades
Highlights China should fare a global recession better than most G20 economies, given its large domestic market and powerful policy response. China is likely to frontload a large portion of its multi-year infrastructure investment projects to this year. We project a near 10% increase in infrastructure investments in 2020. While at the moment we do not have high conviction in the absolute trend in Chinese stock prices, we think Chinese equities will still passively outperform global benchmarks in a global recession. Feature Chart 1A Black Monday Triggered By A "Perfect Storm"
A Black Monday Triggered By A "Perfect Storm"
A Black Monday Triggered By A "Perfect Storm"
Investors are now pricing in a global recession, triggered by a worsening COVID-19 epidemic outside of China and a full-blown price war in the oil market. Global stocks tumbled by 7% on Monday March 9 while the US 10-year Treasury yield dropped to a record low (Chart 1). This extreme volatility reflects investors’ inability to predict how the epidemic will evolve or how long the oil price war will persist. If growth in the US and other major economies turns negative, then China’s disrupted supply side in Q1 will be met with weaker global demand in Q2 and even Q3. While our visibility is limited on the predominantly medically- or politically-oriented crisis, what we have conviction in forecasting at this point is that the Chinese economy will weather the storm better than most G20 economies. China’s policy response and the recovery in domestic demand will more than offset weaknesses from external demand. Thus Chinese stocks will likely outperform global benchmarks in the next 3 months and over a 6-12 month span, even though the absolute trend in both Chinese and global stock prices remains unclear over both these time horizons. A One-Two Punch In a recessionary scenario affecting the entire global economy, China would receive a one-two punch through shocks to both supply and demand tied to the COVID-19 outbreak and shrinking global demand. However, while a global recession would impact China’s export growth, it would not have the kind of bearing on China’s aggregate economy as it did in either 2008/2009 or 2015/2016. The reason is that the Chinese economy is less reliant on exports than it was in 2015 and considerably less than in 2008 (Chart 2). Domestic demand is now dominant, accounting for more than 80% of China’s economy, meaning that the country is less vulnerable to reductions in global demand. Chart 2The Chinese Economy Is Much Less Reliant On Exports
The Chinese Economy Is Much Less Reliant On Exports
The Chinese Economy Is Much Less Reliant On Exports
Chart 3Global Economy Showing Reflation Signs Before COVID-19
Global Economy Showing Reflation Signs Before COVID-19
Global Economy Showing Reflation Signs Before COVID-19
Our current assessment is that the shocks from the virus epidemic and oil price rout on global demand will be brief.Global manufacturing and trade were on a path to recovery prior to the crisis (Chart 3). China’s external and domestic demand rebounded sharply in December and likely have improved even further until late January when the COVID-19 outbreak took hold in China (Chart 4). Even though China’s trade figures in the first two months of 2020 were distorted by COVID-19 (Chart 5),1 a budding recovery in both China’s domestic and global demand before the outbreak suggests the epidemic should disrupt rather than completely derail the global economy. Moreover, a rebound in trade following the crisis will likely be powerful, as the short-term disruption in business activities will lead to a sizable buildup in manufacturing orders. A rebound in trade following the crisis will likely be powerful. Chart 4Chinese Exports Likely To Have Improved Further Until COVID-19 Hit
Chinese Exports Likely To Have Improved Further Until COVID-19 Hit
Chinese Exports Likely To Have Improved Further Until COVID-19 Hit
Chart 5Chinese Demand Likely To Pick Up Sharply In Q2
Chinese Demand Likely To Pick Up Sharply In Q2
Chinese Demand Likely To Pick Up Sharply In Q2
Bottom Line: China’s export growth will moderate if the virus outbreak prolongs and substantively weakens the global economy. However, the demand shock should have a relatively minor impact on China’s aggregate economy and the subsequent recovery should be robust. Infrastructure Investment Comes To Rescue, Again Chart 6Substantial Acceleration In Infrastructure Investment Likely In 2020
Substantial Acceleration In Infrastructure Investment Likely In 2020
Substantial Acceleration In Infrastructure Investment Likely In 2020
Infrastructure investment in China will likely ramp up significantly in 2020, which will mitigate the influence on the domestic economy from both COVID-19 and slowing global growth. The message from the March 4th Politburo Standing Committee2 chaired by President Xi Jinping further supports our view, that Chinese policymakers are committed to a major increase in infrastructure investment in 2020. Our baseline projection suggests a near 10% increase in infrastructure investment growth in 2020 (Chart 6). Local governments’ infrastructure investment plans for the next several years amount to about 34 trillion yuan.3 While local government budget and bond issuance will be approved at the annual National People’s Congress, which is delayed due to the epidemic, we have high conviction that a significant portion of the planned spending will be frontloaded this year. A significant portion of the multi-year infrastructure projects will likely be moved up to this year. In the first two months, local governments have frontloaded 1.2 trillion yuan worth of bonds, including nearly 1 trillion yuan of special-purpose bonds (SPBs). The consensus forecasts a total of 3-3.5 trillion yuan of SPBs to be issued in 2020, a 30% jump from 2019. Given tightened restrictions on the use of SPBs, we expect that 50% of the bonds will be invested in infrastructure projects, up from about 25% from 2019. This should contribute to about 10-15% of infrastructure spending in 2020. We are likely to also see significant additional funding channels to support infrastructure spending this year: Debt-swap program: With the aggressive easing by the PBoC in recent weeks, there is a high probability that another round of debt-swap program will materialize this year – a form of fiscal stimulus similar to the debt-to-bond swap program that the Chinese government initiated during the 2015-2016 cycle (Chart 7). As we pointed out in our report dated July 24, 2019, the Chinese authorities were formulating another round of local government off-balance-sheet debt swaps, which we estimated would be about 3-4 trillion.4 What was absent back then was a concerted effort from the PBoC to equip commercial banks with the required liquidity and further lower policy rate (Chart 8). Both monetary and policy conditions are now ripe for such a program to be rolled out. Chart 7Money Supply Likely To Pick Up Strongly At The Onset Of Substantial Stimulus
Money Supply Likely To Pick Up Strongly At The Onset Of Substantial Stimulus
Money Supply Likely To Pick Up Strongly At The Onset Of Substantial Stimulus
Chart 8Monetary Conditions Are Ripe For Major Money Base Expansion
Monetary Conditions Are Ripe For Major Money Base Expansion
Monetary Conditions Are Ripe For Major Money Base Expansion
Construction bond issuance: Borrowing through local government financing vehicles (LGFV) has climbed since the second half of last year. This follows two years of tightened regulations on local government borrowing. Net issuance of urban construction investment bonds (UCIB) reached 1.2 trillion in 2019, nearly doubling the amount from a year earlier. A total of 457 billion yuan in UCB has already been issued in the first two months of 2020, which indicates that the authorities are further relaxing LGFV borrowing. We think that net UCIB issuance could reach 1.5 trillion this year, a 25% increase compared with last year. Chart 9More Room To Widen Government Budget Deficit
More Room To Widen Government Budget Deficit
More Room To Widen Government Budget Deficit
Government budget: Funding from the central and local governments budgets accounts for about 15% of overall infrastructure financing. We think that the government budget deficit will likely expand by about 2% of GDP in 2020. As Chart 9 shows, this figure is a conservative estimate compared with the 3%+ widening in the budget deficit during the 2008 and 2015 easing cycles. Bottom Line: Fiscal efforts to support the economy will significantly escalate this year. Monetary conditions and policy directions have already paved the way for a 2015-2016 style credit expansion. We expect infrastructure investment to rise to about 10% in 2020 compared with 2019. Will The RMB Join The Devaluation Club? The RMB appreciated by more than 1% against the USD in the past week, fanned by the expectation that China will have a faster recovery than other countries. The latest round of interest rate cuts by central banks around the world also pushed yield-seeking investors to RMB assets (Chart 10). Still, it is highly unlikely that the PBoC will allow the RMB to continue to appreciate at this rate. When other economies are in a competitive currency devaluation cycle, a strong RMB will generate deflationary headwinds for China’s economy and will partially offset the PBoC’s easing efforts (Chart 11). Chart 10Too Much Too Fast?
Too Much Too Fast?
Too Much Too Fast?
Chart 11A Strong RMB Will Choke Off PBoC's Easing Efforts
A Strong RMB Will Choke Off PBoC's Easing Efforts
A Strong RMB Will Choke Off PBoC's Easing Efforts
If the upward pressure in the RMB persists, then Chinese policymakers will be more inclined to expand the money base. Chart 12PBoC Likely To Rapidly Expand Its Balance Sheet Again
PBoC Likely To Rapidly Expand Its Balance Sheet Again
PBoC Likely To Rapidly Expand Its Balance Sheet Again
We do not expect the PBoC to follow the US Federal Reserve and chase its policy rate even lower. However, if the upward pressure in the RMB persists, then Chinese policymakers will be more inclined to expand the money base. This further raises the probability that local government debt-swap programs will develop this year (Chart 12). The government may allow financial institutions to extend or swap maturing local government off-balance sheet debt with bank loans that carry lower interest rates and longer maturities. Or, it will simply move the debt to the PBoC’s balance sheet. Bottom Line: If upward pressure in the RMB endures, the PBoC will likely expand its balance sheet and make more room to buy local government debt, but it is unlikely to aggressively cut interest rates. Investment Conclusions Chart 13Chinese Stocks Will Likely Continue To Outperform, Even In A Global Recession
Chinese Stocks Will Likely Continue To Outperform, Even In A Global Recession
Chinese Stocks Will Likely Continue To Outperform, Even In A Global Recession
Our recent change in view5 concerning the willingness of Chinese authorities to “stimulate the economy at all costs” meant that Chinese stocks were likely to outperform the global benchmarks in a rising equity market. In a global recessionary, which is now a fait accompli, Chinese leadership’s willingness to stimulate the economy will only intensify. China’s large domestic economy also makes the country less vulnerable to a global demand shock. At this point in time we do not have high conviction in the absolute trend in either Chinese or global stock prices, as their near-term performance is predominantly driven by a medically- and politically-oriented crisis. However, as we expect the Chinese economy to outperform in a global recession, our overweight call on Chinese equities remains intact on both a 3-month and 12-month horizon, in relative terms (Chart 13). Jing Sima China Strategist jings@bcaresearch.com Footnotes 1 China had postponed January’s data release and instead, has combined the first two months of the year. 2 “We should select investment projects; strengthen policy support for land use, energy use, and capital; and accelerate the construction of major projects and infrastructure that have been clearly identified in the national plan.” http://cpc.people.com.cn/n1/2020/0305/c64094-31617516.html?mc_cid=2a979… 3 https://m.21jingji.com/article/20200306/504edc15217322ab37337da2ca35a49e.html?[id]=20200306/nw.D44010021sjjjbd_20200306_9-01.json 4 Please see China Investment Strategy Weekly Report " Threading A Stimulus Needle (Part 2): Will Proactive Fiscal Policy Lose Steam?," dated July 24, 2019, available at cis.bcaresearch.com 5 Please see China Investment Strategy Weekly Report "China: Back To Its Old Economic Playbook?," dated February 26, 2020, available at cis.bcaresearch.com Cyclical Investment Stance Equity Sector Recommendations
Dear Clients, This week we are issuing two Special Alerts on the Russo-Saudi market share war, one of which you have already received. Our weekly publication will proceed as usual on Friday, March 13. In this Special Alert, we update our view of the US election and address the urgent question of US fiscal stimulus. Upcoming reports will address the question of stimulus outside the United States. All very best, Matt Gertken Vice President Geopolitical Strategy Feature Turmoil has engulfed financial markets as a Russo-Saudi market share war erupts at the same time as panic over the coronavirus spreads from China to Europe and the United States. The US and global stock markets are nearing bear market territory while the 10-year Treasury and global bond yields plumb new lows and deeper negatives (Chart 1). Our key risk-off indicators have all broken down (Chart 2). Chart 1The Bear Awakens
The Bear Awakens
The Bear Awakens
Chart 2Global Risk-Off
Global Risk-Off
Global Risk-Off
While the daily new cases of the virus are far from peaking in the US, the Democratic Party nomination process has eliminated the downside risk of a left-wing populist presidency. Political risk in the US will shift to Congress, fiscal stimulus, the general election, and the “lame duck” risk now threatening President Trump. Trump Not Yet Doomed, But No Longer Favored The US election is now “too close to call,” with the risks tilted toward a Trump loss. Bear markets tend to coincide with recessions (Chart 3). Woe betide a president seeking reelection amid a recession. Chart 3Bear Markets Tend To Coincide With Recessions
Biden And Stimulus
Biden And Stimulus
We need to look to a previous era to identify precedents for Trump’s survival. William McKinley hung onto the office in 1900, Teddy Roosevelt in 1904, and Calvin Coolidge in 1924, all despite recessions.1 Rising unemployment will undo Trump’s re-election bid. In today’s terms, it is still possible that the virus panic will subside over the summer while a wave of global monetary and fiscal stimulus will kick in around September, creating a rebound that sends voters to the polls in an optimistic mood. But it is increasingly unlikely. Unemployment will rise as consumer confidence collapses in the face of the virus outbreak (Chart 4). This is deadly to a president with such narrow margins of victory in the key swing states. Chart 4Confidence Will Suffer, Layoffs To Ensue
Confidence Will Suffer, Layoffs To Ensue
Confidence Will Suffer, Layoffs To Ensue
Chart 5Trump’s Approval Heading South
Biden And Stimulus
Biden And Stimulus
Chart 6Republican Revival To Fall Back
Republican Revival To Fall Back
Republican Revival To Fall Back
The coronavirus scare is already derailing President Trump’s approval rating. It had only tentatively recovered from a very low level throughout his first term and is highly unlikely ever to breach 50% (Chart 5). The surge in voters identifying as Republicans – which had recently, remarkably, surpassed Democrats – will reverse (Chart 6). Our quant election model is “too close to call” but will soon signal Trump loss. Our quant model was already flashing that the election is “too close to call,” due to the negative impact of Trump’s trade war on key swing states like Michigan and Pennsylvania. The weight of a feather can shift Wisconsin into the Democratic camp and turn the election against Trump (Chart 7). The model will inevitably show Trump losing the election once state-level data starts to reflect the virus shock. Chart 7Our Quant Election Model Says “Too Close To Call” … But Virus Panic Will Cause Wisconsin To Switch
Biden And Stimulus
Biden And Stimulus
Bottom Line: The US election is too close to call at this point. With eight months to go, many things could still change, but a spike in unemployment will ruin Trump’s reelection bid. Biden, Not Sanders, Waiting In The Wings Chart 8Biden Has All But Clinched The Democratic Nomination
Biden And Stimulus
Biden And Stimulus
The bad news for Trump – but the good news for markets – is that former Vice President Joe Biden has solidified his status as presumptive nominee for the Democratic Party presidential candidate. Biden romped to victory in Michigan and Missouri on March 10 – and is virtually tied with Vermont Senator Bernie Sanders in Washington, a liberal state that should favor the self-professed democratic socialist Sanders. Biden now clearly leads the count of pledged delegates to the Democratic National Convention on July 13 – and voting patterns in the remaining primary elections would have to reverse entirely in order to give Sanders a 1,991-vote majority of delegates in the first round of voting in July (Chart 8). It is unlikely that Sanders can deprive Biden of a majority of delegates even though he will trounce Biden in the final debate on March 15. The important state elections on March 17 are all favorable to Biden: Arizona, Florida, Illinois, and Ohio. Our delegate projections show Biden winning an outright majority by May 12 (Chart 9). Chart 9Biden Set To Win Majority Of Democratic Delegates By Spring
Biden And Stimulus
Biden And Stimulus
Over the past year many clients have argued to us that neither Biden nor Sanders is electable. We have rejected this view on the basis that the economic cycle would most likely determine the election, since Trump had the misfortune of being a late-cycle president. The financial markets have dodged a bullet with Biden’s nomination since Sanders was capable of winning the nomination and now, with an impending recession, would be even odds (or favored) to take the White House. Chart 10Head-To-Head Polls Show Trump Vulnerability
Biden And Stimulus
Biden And Stimulus
Average head-to-head polls show both Biden and Sanders beating Trump in the battleground states. This always suggested that Trump was highly vulnerable. But on the margin Biden is more electable than Sanders: he polls better against Trump than any Democrat, while Trump polls worse against him than any Democrat. Biden has an Electoral College pathway to victory via Florida and Arizona, as well as via the Midwestern states where Sanders is also competitive (Chart 10). Democrats ultimately chose Biden because he seemed the most likely to beat Trump. He also has the best position on the issue most important after the economy, which is health care (Chart 11). This reputation comes from his association with both President Barack Obama and the Affordable Care Act (Obamacare). A contested convention, in which the Democratic Party splits and progressive voters sit out the election, was always unlikely and is now virtually foreclosed. As he clinches the nomination Biden will seek to win over the support of progressives by choosing a progressive running mate and adopting more left-leaning policies on issues like inequality and the environment. Chart 11Democrats Chose Biden To Win And Restore Obamacare
Biden And Stimulus
Biden And Stimulus
Chart 12Democratic Primary Turnout Strong In Vital Midwest
Biden And Stimulus
Biden And Stimulus
Voter turnout in the primary elections suggests that voters are fired up in the Midwest (Michigan, Minnesota) but more complacent in the South (Texas, North Carolina) (Chart 12). Primary elections are different from general elections, but a worsening economy will provoke higher turnout. At minimum these data reinforce the point above that Trump is highly vulnerable in the Midwestern “Blue Wall” that narrowly brought him to power. Bottom Line: Biden is not only electable but at this stage equally likely as Trump to sit in the Oval Office in 2021. This is a market-positive policy outcome compared with the alternative – a Sanders presidency – which was almost equally probable in the event of a recession. Financial markets will see Biden as less negative than Sanders on regulation and taxes, and less negative than Trump on trade and foreign policy. Fiscal Stimulus A major source of uncertainty surrounding the election is fiscal policy, as a Democratic victory implies an increase in taxes on households and businesses. Not only is there a spike in tax provisions set to expire (top panel, Chart 13), but President Trump’s signature Tax Cut and Jobs Act could be repealed if he loses or made permanent if he wins. Chart 13Fiscal Uncertainty Looms Over US
Fiscal Uncertainty Looms Over US
Fiscal Uncertainty Looms Over US
The short-term outlook is also in flux because the Trump administration is frantically trying to piece together an economic stimulus package to respond to the coronavirus shock. Democrats control the House of Representatives and have an incentive to delay and water down Trump’s stimulus proposals. However, they cannot be seen as playing politics with the nation’s health and livelihood and will ultimately agree to fiscal stimulus. This contradiction implies that financial markets will experience ongoing volatility as talks take place. Ultimately, Trump and the Democrats will cooperate, particularly as the financial constraint intensifies through market selling. Trump’s bid will be to stimulate the overall economy while House Speaker Nancy Pelosi and Senate Minority Leader Chuck Schumer will target the virus so as to keep the nation’s attention on health care without granting Trump a re-election fiscal bonus. The most significant short-term stimulus on offer would be a cut to payroll taxes. Trump’s preference may be to eliminate the entire 6% tax levied on worker income permanently, but he is more likely to get something on the magnitude of the 2011-12 temporary payroll tax cut (second panel, Chart 13). This was a two percentage point reduction in the tax (to 4%) for one year that ended up being extended for a second year. The size of the impact is roughly $75 billion for each percentage point for each year ($300 billion for two percentage points over two years). The risk is that the House Democrats may require modifications to Trump’s Tax Cut and Jobs Act that cause an impasse and financial markets to sell off before an agreement is reached.2 The Democrats, for their part, have a wish list of spending programs that they will insist on in exchange for a payroll tax cut. In particular they will seek to expand unemployment insurance for workers who lose their jobs in the impending slowdown, food stamps for unemployed and for children at home amid school closures, and mandatory paid leave (for parents with kids at home as well as sick people). The bill for such items can easily add up to $50-$100 billion in new spending. In addition, Congress and the White House have already approved an $8 billion virus mitigation package and additional packages of this size can happen quickly as the crisis requires. Trump is interested in another round of farm aid, given that China will fall short of its commodity purchases under the “phase one” trade deal, which could amount to $12-$15 billion. And Trump could always unilaterally rollback some of his tariffs on China or other trade partners. The combination of new spending and payroll tax cuts could bring the package to the $300-$400 billion range that Trump’s top economic adviser, Larry Kudlow, disapprovingly said was out of the question. It could easily amount to half of that. If the market continues to tank and the outlook for the US economy grows blacker, it will convince the Democrats that Trump is ruined unless they hurt their own image by appearing blatantly obstructionist amid a crisis. Bear in mind that the market wants a substantial stimulus not only because of the desire for a clear rebound in activity once the virus panic subsides, but also because the increasing odds of a Democratic victory in November mean that US tax rates will go up and corporate earnings will be revised downward. The country now faces a 50% chance of a 1%-2% fiscal tightening for each year in 2021-25 (Chart 14). Chart 14Biden Tax Hike Will Hit Corporate Earnings
Biden And Stimulus
Biden And Stimulus
Chart 15US Fiscal Thrust To Surprise To Upside
US Fiscal Thrust To Surprise To Upside
US Fiscal Thrust To Surprise To Upside
Thus a 1% of GDP fiscal stimulus for 2020 is the minimum necessary to improve sentiment. The US fiscal thrust – the change in the cyclically adjusted budget deficit – has already turned slightly positive this year, from what was expected to be a slight negative, due to a fiscally profligate budget deal between Trump and the Democrats last year (Chart 15). The one thing these blood enemies have in common is the need for more spending. Infrastructure spending is popular and has room to rise. Eventually the US will get stimulus, and it will surprise to the upside, even if the Democrats drag their feet to ensure that maximum political damage is inflicted on Trump this year. Not only is the fiscal setting inherently more dovish than it was in 2008, but Congress is bailing out plague-stricken households, not just Wall Street, this time around. The real game changer would be an infrastructure package. Americans spend about $140 billion or 0.7% of GDP each year on transport infrastructure, but popular opinion in both major political parties supports increases (Chart 16). The proposed sums are very large – Trump is proposing $1 trillion over a decade while Biden is proposing $1.3 trillion. The House Democrats have a bill worth $760 billion in new spending over five years ready to be passed. Also Trump is willing to capitulate on the Democrats’ preferred type of spending (direct deficit spending) due to his election constraint. These plans are all projecting considerable infrastructure spending on top of the Congressional Budget Office’s base line projection (Chart 17). Chart 16US Spends 0.7% Of GDP On Infra Each Year
Biden And Stimulus
Biden And Stimulus
Chart 17Median Voter Wants More Infra Spending
Biden And Stimulus
Biden And Stimulus
The fiscal multiplier of government spending is generally higher than tax cuts. Furthermore, the coronavirus hurts the economy by frightening households into their homes, which means that even the Democrats’ proposed cash transfers for low-income earners (those with a high marginal propensity to consume) may be impeded. Government-mandated infrastructure spending, by contrast, ensures that economic activity will pick up once the measures take effect (that is, with a 6-12 month lag … something the Democrats will become increasingly willing to agree to this spring given the election calendar). The impending US fiscal stimulus provides justification for going long infrastructure, construction, engineering, materials, mining, and environmental services sub-sectors included in the BCA Infrastructure Equity Basket (Chart 18). China’s large-scale stimulus measures reinforce this recommendation, since these firms are levered to China/EM growth. On a tactical basis, this trade is akin to catching a falling knife. Given our expectation that the world still faces challenges in overcoming the current turmoil, and the Democrats will hem and haw so as not to grant Trump his re-election wish list immediately, we await an opportune time to initiate this trade. A final reason to remain defensive on risk assets: the “lame duck” risk. If and when Trump’s re-election appears out of reach, he has an incentive to turn the tables. This could involve a radical or disruptive move in foreign or trade policy (e.g. on Iran, North Korea, Venezuela, China, or even Russia). At that point Trump could attempt to cement his legacy of cold war with China, or he could even lash out against Russian President Vladimir Putin, who has ostensibly stabbed him in the back by initiating a market share war with Saudi Arabia that may not be pieced back together in time to prevent job losses in shale oil swing states (Chart 19). Chart 18Look For Chance To Go Long Infrastructure Stocks
Look For Chance To Go Long Infrastructure Stocks
Look For Chance To Go Long Infrastructure Stocks
Chart 19A Russo-Saudi Oil Market War Hurts Trump In Shale Swing States
A Russo-Saudi Oil Market War Hurts Trump In Shale Swing States
A Russo-Saudi Oil Market War Hurts Trump In Shale Swing States
Presidential powers are least constrained in the international sphere. At the moment Trump is trying to save the economy and his presidency. But if it becomes a foregone conclusion that they cannot be saved, then he becomes a pure liability for risk assets. Housekeeping We are throwing in the towel on our US tech sector shorts for a loss of 36% and 11%, respectively, and also closing our long Thailand relative trade for a loss of 17%. We are also closing our tactical long Italian government bonds relative to Spanish for a loss of 2%. Matt Gertken Vice President Geopolitical Strategist mattg@bcaresearch.com Footnotes 1 Coincidentally all were Republicans, like Trump – not that it matters. 2 The Democrats may seek to have Trump increase the tax rate on the highest income earners to the pre-TCJA level, or they may seek to increase the cap on the state and local tax deduction, which allows households (mostly high-income earners) in high-tax states to reduce their federal tax bill.
Highlights Uncertainty & Yields: Global bond yields, driven to all-time lows as investors seek safety amid rioting markets, now discount a multi-year period of very weak global growth and inflation. Bond Portfolio Strategy: Maintain overall neutral portfolio duration exposure with so much bad news already priced into yields. Downgrade overall global spread product exposure to underweight versus governments on a tactical (0-3 months) basis given intense uncertainties on COVID-19 and oil markets. Model Bond Portfolio Changes – Governments: Upgrade countries that are more responsive to changes in the level of overall global bond yields and with room to cut interest rates (the US & Canada) to overweight, while downgrading sovereign debt with a lower “global yield beta” and less policy flexibility (Germany, France, Japan) to underweight. Model Bond Portfolio Changes – Credit: Downgrade US high-yield, euro area corporates and emerging market USD sovereigns & corporates to underweight. Feature Chart of the WeekOn The Verge Of Global ZIRP
On The Verge Of Global ZIRP
On The Verge Of Global ZIRP
The title of this report is a quote from a worried BCA client this morning, discussing his daily commute into Manhattan from the New York suburbs. We can think of no better analogy for the mood of investors in the current market panic. After having enjoyed a decade of riding the gravy train of recession-free growth and robust returns on risk assets, all underwritten by accommodative monetary policies, worries about a deflationary bust following the boom have intensified. The global spread of COVID-19, the ebbs and flows of the US presidential election and, now, a stunning collapse in oil prices – markets have simply been unable to process the investment implications of these unpredictable events all at once. At times of such stress, the obvious thing to do is to stand aside and hedge portfolios while awaiting better visibility on the uncertainties. At times of such stress, the obvious thing to do is to stand aside and hedge portfolios while awaiting better visibility on the uncertainties. It is clear that global government bonds have been a preferred hedge, with yields collapsing to record lows worldwide. While most of the market attention has been on the breathtaking fall in US yields that has pushed the entire Treasury curve below 1% as the market has moved to discount a swift move to a 0% fed funds rate. New lows were also hit yesterday in countries that had been lagging the Treasury rally: the 10-year German bund reached -0.85% yesterday, while the 10-year UK Gilt fell to an intraday all-time low of 0.08% with some shorter-maturity Gilt yields actually dipping into negative territory (Chart of the Week). The common driver of yesterday’s yield declines was the 25% plunge in global oil prices after the weekend collapse of the OPEC 2.0 alliance between Russia and Saudi Arabia. The inflation expectations component of global bond yields fell accordingly, continuing the correlation with energy prices seen over the past decade. Yet the real component of global bond yields has also been falling, with markets increasingly pricing in an extended period of weak growth and negative real interest rates – especially in the US. Collapsing US Treasury Yields Discount A Recession, Not A Financial Crisis Chart 2Re-opening Old Wounds
Re-opening Old Wounds
Re-opening Old Wounds
While this latest plunge in US equity markets has been both rapid and powerful, the damage only takes us back to levels on the S&P 500 last seen as recently as January 2019 (Chart 2). The turmoil, however, has reopened old wounds in markets that had suffered their own crises over the past decade, with European bank stocks hitting new all-time lows and credit spreads on US high-yield Energy bonds and Italian sovereign debt (versus Germany) sharply blowing out. The backdrop remains treacherous and global equity markets will likely remain under pressure until the number of new COVID-19 cases peaks outside of China (especially in the US). If there is one silver lining amidst the market carnage, it is that there appears to be few signs of 2008-style systemic financial stress. If there is one silver lining amidst the market carnage, it is that there appears to be few signs of 2008-style systemic financial stress. Bank funding indicators like Libor-OIS spreads and bank debt spreads have widened a bit over the past week but remain at very subdued levels (Chart 3). This is in sharp contrast to classic risk aversion indicators like the price of gold and the value of the Japanese yen versus the Australian dollar, which are closing in on the highs seen during the 2008 global financial crisis and 2012 European debt crisis. Chart 3A Growth Downturn, Not A Systemic Crisis
A Growth Downturn, Not A Systemic Crisis
A Growth Downturn, Not A Systemic Crisis
We interpret this as investors being far more worried about a deep global recession than another major financial crisis. That is also confirmed in the pricing of US Treasury yields, especially when looking at the real yield. Chart 4Does The UST Market Think R* Is Negative?
Does The UST Market Think R* Is Negative?
Does The UST Market Think R* Is Negative?
Chart 5Another Convexity-Fueled Bond Rally
Another Convexity-Fueled Bond Rally
Another Convexity-Fueled Bond Rally
The entire TIPS yield curve is now negative for the first time, even with the real fed funds rate below the Fed’s estimate of the “r*” neutral real rate (Chart 4). The combination of low and falling inflation expectations, and plunging real yields, indicates that the Treasury market now believes that the neutral real funds rate is not 0.8%, as suggested by the Fed’s estimate of r*, but is somewhere well below 0%. With the fed funds rate now down to 0.75% after last week’s intermeeting 50bps cut, the Treasury market is not only pricing the Fed quickly returning to the zero lower bound on the funds rate, but staying trapped at zero for a very long time. The Treasury market is not only pricing the Fed quickly returning to the zero lower bound on the funds rate, but staying trapped at zero for a very long time. Yet that may be too literal an interpretation of the incredible collapse of US Treasury yields. The power of negative convexity is also at work, driving intense demand for long-duration bonds that puts additional downward pressure on yields. Large owners of US mortgage backed securities (MBS) like the big commercial banks have seen the duration of their MBS holdings collapse as yields have fallen. The result is that banks are forced to buy huge amounts of Treasuries (or receive US dollar interest rate swaps) to hedge their duration exposure of negative convexity MBS, hyper-charging the fall in Treasury yields – perhaps over $1 trillion worth of buying, by some estimates.1 This is a similar dynamic to what occurred last summer in Europe, when sharply falling bond yields triggered convexity-related demand for duration from large asset-liability managers like pension funds, further fueling the decline in bond yields (Chart 5). Yet even allowing that some of the Treasury yield decline has been driven by a mechanical demand for duration, a 10-year US Treasury yield of 0.56% clearly discounts expectations of a US recession, as well – which appears justified by the recent performance of some critical US economic data. In Charts 6 & 7, we show a “cycle-on-cycle” analysis of some key US financial and indicators and how they behave before and after the start of the past five US recessions. The charts are set up so the vertical line represents the start of the recession, and we line up the data for the current business cycle as if the latest data point represents the start of a recession. Done this way, we can see if the current data is evolving in a similar fashion to past US economic downturns. Chart 6The US Business Cycle Looks Toppy
The US Business Cycle Looks Toppy
The US Business Cycle Looks Toppy
Chart 7COVID-19 Will Likely Trigger A Confidence-Driven US Recession
COVID-19 Will Likely Trigger A Confidence-Driven US Recession
COVID-19 Will Likely Trigger A Confidence-Driven US Recession
The charts show that the current flat 10-year/3-month US Treasury curve and steady decline in corporate profit growth are both accurately following the path entering past US recessions. Other indicators like the NFIB Small Business confidence survey, the Conference Board’s leading economic indicator and consumer confidence series typically peak between 12-18 months prior to the start of a recession, but appear to be only be peaking now. The same argument goes for initial jobless claims, which are usually rising for several months heading into a recession but remain surprisingly steady of late – a condition that seems unlikely to continue as more companies suffer virus-related hits to their sales and profits and begin to shed labor. Net-net, these reliable cyclical US data suggest that the Treasury market is right to be pricing in elevated recession risk – especially with US cases of COVID-19 starting to increase more rapidly and US financial conditions having tightened sharply in the latest market rout. Bottom Line: Global bond yields, driven to all-time lows as investors seek safety amid rioting markets, now discount a multi-year period of very weak global growth and inflation – most notably in the US. Allocation Changes To Our Model Bond Portfolio The stunning fall in global bond yields has already gone a long way. Yet it is very difficult to forecast a bottom in yields, even with central banks easing monetary policy to try and boost confidence, before there is evidence that the global COVID-19 outbreak is being contained (i.e. a decreasing total number of confirmed cases). By the same token, corporate bonds (and equities) will continue to be under selling pressure until the worst of the viral outbreak has passed. We raised our recommended overall global duration stance to neutral last week – a move that was more tactical in nature as a near-term hedge to our strategic overweight corporate bond allocations in our Model Bond Portfolio amid growing market volatility. Yet with the new stresses coming from the collapse in oil prices and increasing spread of COVID-19 in the US and Europe, we are moving to a much more cautious near-term stance on global credit. Yet with the new stresses coming from the collapse in oil prices and increasing spread of COVID-19 in the US and Europe, we are moving to a much more cautious near-term stance on global credit. This week, we are making the following additional changes to our model bond portfolio to reflect the growing odds of a global recession: Downgrade global corporates to underweight versus global governments Maintain a neutral overall portfolio duration, but favor countries within the government bond allocation that are more highly correlated to changes in to the overall level of global bond yields. Chart 8Favor Higher-Beta Bond Markets With Room To Cut Rates
Favor Higher-Beta Bond Markets With Room To Cut Rates
Favor Higher-Beta Bond Markets With Room To Cut Rates
Given how far yields have declined already, we think raising allocations to “high yield beta” countries that can still cut interest rates, at the expense of reduced weightings toward low beta countries that have limited scope to ease policy, offers a better risk/reward profile than simply raising duration exposure across the board. Such a nuanced argument is less applicable to global corporates, where elevated market volatility, poor investor risk appetite and deteriorating global growth momentum all argue for continued near-term underperformance of corporates versus government bonds. Specifically, we are making the following changes to our recommended allocations, presented with a brief rationale for each move: Upgrade US Treasuries and Canadian government bonds to overweight: Both Treasuries and Canadian bonds are higher beta markets, as we define by a regression of monthly yield changes to changes in the yield of the overall Bloomberg Barclays Global Treasury index (Chart 8). The Fed cut 50bps last week as an emergency measure and has 75bps to go before reaching the zero bound, which the market now expects by mid-year. Additional bond bullish moves after reaching the zero bound, like aggressive forward guidance, restarting quantitative easing and even anchoring Treasury yields in a BoJ-like form of yield curve control, are all possible if the US enters a recession. Meanwhile, the Bank of Canada (BoC) followed the Fed’s cut with a 50bp easing the next day and signaled that additional rate cuts are likely to prevent a plunge in Canadian consumer confidence. The collapsing oil price likely seals the deal for additional rate cuts by the BoC in the next few months. Downgrade Japanese government bonds to maximum underweight: Japanese government bonds (JGBs) are the most defensive low-beta market in model bond portfolio universe, thanks to the Bank of Japan’s Yield Curve Control policy that anchors the 10yr JGB yield around 0%. This makes JGBs the best candidate for a maximum underweight stance when global bond yields are not expected to rise in the near term, as we expect. Downgrade Germany and France to Underweight: The ECB meets this week and will be under pressure to ease policy given recent moves by other major central banks. A -10bps rate cut is expected, which may happen to counteract the recent increase in the euro versus the US dollar, but there is also possibility that ECB will increase and/or extend the size and scope of its current Asset Purchase Program. Given the ECB’s lack of overall monetary policy flexibility, and low level of inflation expectations, we see limited scope for the lower-beta German and French government bonds to outperform their global peers. Remain overweight UK and Australia: While both Australian government bonds and UK Gilts have a “median” yield beta in our model bond portfolio universe, both deserve moderate overweights as there is still the potential for rate cuts in both countries. The Reserve Bank of Australia (RBA) cut the Cash Rate by -25bps last week and they are still open to cut further to boost a sluggish economy hurt by wildfires and weak export demand from China. The RBA will stay more dovish for longer until we will see clear signs of a rebound of the Chinese economy from the COVID-19 outbreak. The Bank of England (BoE) will likely cut its policy rate later this month, or even before the next scheduled policy meeting, as COVID-19 is starting to spread through the UK. Downgrade US High-Yield To Underweight: US junk bonds had already taken a hit during the global market selloff in recent weeks, but the collapse in oil prices pummeled the market given the high weighting of US shale producers in the index (Chart 9). With additional weakness in oil prices likely as Russia and Saudi Arabia are now in a full-fledged price war, US high-yield will come under additional spread widening pressure focused on the weaker Caa-rated segment that contains most of the energy names. We recommend a zero weight in the Caa-rated US junk bonds, within an overall underweight allocation to the entire asset class. Downgrade euro area investment grade and high-yield corporates to underweight: COVID-19 is now spreading faster in Germany and France, after leaving Italy in a full-blown national crisis. The export-oriented economies of the euro area were already vulnerable to a global growth slowdown, but now domestic growth weakness raises the odds of a full-blown recession – not a good environment to own corporate bonds, especially with the euro now appreciating. Downgrade emerging market (EM) USD-denominated sovereigns and corporates to underweight: EM debt remains a levered play on global growth, so the increased odds of a global recession are a problem for the asset class – even with sharply lower interest rates and early signs of a softening in the US dollar (Chart 10). Chart 9Downgrade US Junk Bonds To Underweight
Downgrade US Junk Bonds To Underweight
Downgrade US Junk Bonds To Underweight
Chart 10Still Not Much Broad-Based Weakness In The USD
Still Not Much Broad-Based Weakness In The USD
Still Not Much Broad-Based Weakness In The USD
We will present the new specific model bond portfolio weightings, along with a discussion of the risk management implications of these changes, in next week’s report. Bottom Line: Maintain overall neutral portfolio duration exposure with so much bad news already priced into yields. Downgrade overall global spread product exposure to underweight versus governments on a tactical (0-3 months) basis given intense uncertainties on COVID-19 and oil markets. Upgrade high-beta countries with room to cut interest rates (the US & Canada) to overweight, while downgrading lower-beta countries with less policy flexibility (Germany, France, Japan) to underweight. Downgrade US high-yield, euro area corporates and emerging market USD sovereigns & corporates to underweight. Robert Robis, CFA Chief Fixed Income Strategist rrobis@bcaresearch.com Ray Park, CFA Research Analyst ray@bcaresearch.com Footnotes 1https://www.wsj.com/articles/fear-isnt-the-only-driver-of-the-treasury-rally-banks-need-to-hedge-their-mortgages-1158347080 Recommendations Regional Allocation Spread Product Tactical Trades Yields & Returns Global Bond Yields Historical Returns
Highlights Duration: It is too soon to call the bottom in bond yields. To help make that call we will be looking for when: daily new COVID-19 infections reach zero, global growth indicators improve, US economic indicators worsen, technical indicators signal a reversal. Fed: Low inflation expectations mean that the Fed is unconstrained when it comes to easing policy. Rate cuts will continue until either the funds rate reaches zero, or financial markets signal that enough stimulus has been delivered. Spread Product: Investors with 12-month investment horizons should neutralize allocations to spread product versus Treasuries, including high-yield where the recent oil supply shock will weigh heavily on returns. Investors should also downgrade exposure to MBS with the goal of re-deploying into corporate credit once the current risk-off episode runs its course. Feature Risk off sentiment prevailed in financial markets again last week, as COVID-19 continues to spread throughout the world. Most recently, the city of Milan has been placed under quarantine and New York state has declared a state of emergency. It is difficult to have much certainty about the virus’ ultimate economic impact, but the prospect of US recession looms larger and larger. In bond markets, the 10-year Treasury yield has fallen to 0.54% and the yield curve is pricing-in 91 bps of Fed rate cuts over the next 12 months (Chart 1). If those expectations are met, it would bring the funds rate down to 0.18%, only slightly above the zero-lower-bound. Chart 1Market Priced For A Return To The Zero-Lower-Bound
Market Priced For A Return To The Zero-Lower-Bound
Market Priced For A Return To The Zero-Lower-Bound
On the bright side, there is ample evidence that global economic growth was trending up before the virus struck in late January, and we remain confident that a large amount of pent-up demand will be unleashed once its impact fades. However, we have no clarity on how much longer COVID-19 might weigh on growth. For this reason, we recommend a much more defensive US bond portfolio allocation, even for investors with 12-month horizons. Specifically, investors should keep portfolio duration close to benchmark and reduce spread product allocations to neutral. The market is sending the message that more rate cuts are needed. We will be quick to re-initiate a below-benchmark duration recommendation when we think that bond yields are close to bottoming. In the below section titled “How To Call The Bottom In Yields”, we discuss the factors that will help us make that decision. A State Of Monetary Policy Emergency The Fed took quick action last week, delivering an inter-meeting 50 basis point rate cut as the stock market tumbled on Tuesday morning. Alas, the market is sending the message that those 50 bps won’t be enough. Fed funds futures are pricing-in another 82 bps of easing by the end of next week’s FOMC meeting, followed by further cuts in April (Table 1). Table 1Expectations Priced Into The Fed Funds Futures Curve
When And Where Will Bond Yields Trough?
When And Where Will Bond Yields Trough?
Of course, easier monetary policy is not the solution to what ails the global economy. At his press conference last week, Fed Chair Powell justified the emergency cut by saying that it will help “avoid a tightening of financial conditions which can weigh on activity, and it will help boost household and business confidence.” This is a fair assessment of what monetary policy can hope to accomplish in the current environment. At most, monetary policy can limit the damage in financial markets, which is a worthwhile goal given the strong historical correlation between financial conditions and economic growth (Chart 2). Chart 2Fed Must Do Its Best To Support Financial Conditions
Fed Must Do Its Best To Support Financial Conditions
Fed Must Do Its Best To Support Financial Conditions
What’s more, with inflation expectations at very low levels – as we go to press the 10-year TIPS breakeven inflation rate is a mere 1.03% – there is no reason for the Fed to resist easing policy, even if the expected benefits from easing are small. Chart 3Markets Demand More Easing
Markets Demand More Easing
Markets Demand More Easing
From our perch, the only possible reason for the Fed to refrain from cutting rates quickly all the way back to zero would be to preserve some monetary policy ammunition for when it is needed most. The Fed probably doesn’t see things this way. In conventional economic models it is the level of interest rates that influences economic activity. Therefore, the way to get the most bang for your stimulus buck is to cut rates to zero as quickly as possible. However, if monetary policy is primarily influencing the economy via its impact on financial conditions and investor sentiment, as Chair Powell claimed, then it would be advisable to only deliver rate cuts when financial conditions are tightening rapidly. That is, don’t cut rates if the stock market is rebounding, save your ammo for when equities are in free fall and panic is widespread. We can’t know for certain what the Fed will do between now and the next FOMC meeting. But we can say that, with inflation pressures low, there are no constraints against cutting rates back to the zero bound. The safest takeaway for bond investors is to assume that rate cuts will continue until either (i) the fed funds rate hits zero or (ii) we see signs that the markets and economy are no longer calling for further stimulus. Those signs would be (Chart 3): Yield curve steepening, particularly at the short end. Stocks outperforming bonds. A rising gold price. A falling US dollar. Bottom Line: More rate cuts are coming, and they won’t stop until either the fed funds rate hits zero or financial markets signal that sufficient stimulus has been delivered. We can’t be certain whether that will occur with more or less than the 91 bps of rate cuts that are currently priced for the next 12 months. As such, we recommend keeping portfolio duration close to benchmark. How To Call The Bottom In Yields The US economy is on the cusp of entering a downturn of uncertain duration that will likely be followed by a rapid recovery. Given that outlook, the next big call to make is: When will bond yields put in a bottom? We identify four catalysts that we will monitor to make that call. 1. Virus Panic Abates This is the most important catalyst that could lead us to re-initiate a below-benchmark duration recommendation. The pattern of past viral outbreaks is that bond yields tend to fall until the number of daily new cases reaches zero. This is precisely what happened during the 2003 SARS epidemic (Chart 4A). As for COVID-19, the number of daily new cases looked like it was approaching zero a few weeks ago, but then reversed course as the virus moved on from China to the rest of the world (Chart 4B). One ray of hope is that the number of new cases in China is approaching zero. This suggests that it will also be possible for other countries to contain the virus, but right now it is unclear how long that will take. Chart 4AYields Will Bottom When New Cases Reach Zero
Yields Will Bottom When New Cases Reach Zero
Yields Will Bottom When New Cases Reach Zero
Chart 4BNew COVID-19 Cases Still ##br##Rising
New COVID-19 Cases Still Rising
New COVID-19 Cases Still Rising
In sum, we will keep tracking the global daily number of new cases and will shift to a below-benchmark duration recommendation as it approaches zero. 2. Global Economic Data Improve (Especially China) Chart 5Waiting For A Global Growth Rebound
Waiting For A Global Growth Rebound
Waiting For A Global Growth Rebound
China is where the COVID-19 outbreak started and it is also where we are now seeing the impact in the economic data. The Global Manufacturing PMI dropped from 50.4 to 47.2 in February, due in large part to the plunge in China’s index from 51.1 to 40.3 (Chart 5). In order to call the bottom in US bond yields we will need to see evidence that China can come out the other side of the economic downturn. This means seeing an improvement in the Chinese and Global Manufacturing PMIs. We would also like to see improvement in other global growth indicators such as the CRB Raw Industrials index (Chart 5, panel 2) and the relative performance of cyclical versus defensive equity sectors (Chart 5, bottom panel). Aggressive Chinese stimulus (both monetary and fiscal) might help speed this process along. China’s credit impulse is on the rise (Chart 5, panel 2), and our China Investment Strategy service observed that recently announced policy initiatives related to infrastructure, housing and the automobile sector resemble those that led to a V-shaped Chinese economic recovery in 2016.1 We will be inclined to shift back to below-benchmark portfolio duration when the Global Manufacturing PMI, CRB Raw Industrials index and the relative performance of cyclical versus defensive equities move higher. 3. The US Economic Data Worsen Chart 6Waiting For Weaker US Data
Waiting For Weaker US Data
Waiting For Weaker US Data
While the Global and Chinese economic data are currently in the doldrums, we still haven’t seen COVID’s impact on the US economy. The US ISM Manufacturing PMI is in expansionary territory and the Services PMI is at a healthy 57.3 (Chart 6). Meanwhile, US employment growth has averaged +200k during the past 12 months (Chart 6, panel 2) and the US Economic Surprise Index is above 60 (Chart 6, bottom panel)! Until the US economic data take a hit, another downleg in US bond yields is likely. Looking ahead, if the Global and Chinese economic data are improving as the US data are weakening, financial markets will extrapolate from the Chinese experience and start to price-in an eventual US recovery. Therefore, bond yields will probably start to move higher while the US economic data are still weak. For this reason, one catalyst for us to re-initiate below-benchmark portfolio duration will be when the US economic data weaken. 4. Technical Signals Table 2The 3-Month Golden Rule
When And Where Will Bond Yields Trough?
When And Where Will Bond Yields Trough?
We don’t recommend relying on technical trading rules when forming a 12-month investment view, but technical signals can help add discipline to investment strategies, especially when calling tops and bottoms. One framework with a decent track record is our Golden Rule of Bond Investing applied to a shorter 3-month investment horizon.2 While this 3-month rule doesn’t work as well as when it is applied to a 12-month horizon, we still find that if you correctly predict whether the Fed will deliver a hawkish or dovish surprise relative to market expectations during the next three months, you will make the right duration call 63% of the time (Table 2). The 3-month Golden Rule worked better for dovish surprises than for hawkish surprises in our sample but delivered solid results in both cases. The median 3-month excess Treasury index return versus cash was -1.09% (annualized) when there was a hawkish Fed surprise, compared to +2.56% (annualized) when there was a dovish Fed surprise. For context, the median annualized 3-month excess Treasury index return versus cash during our sample period was +1.79%. Until the US economic data take a hit, another downleg in US bond yields is likely. The overnight index swap curve is currently priced for 94 bps of rate cuts during the next three months, which would essentially take the funds rate back to the zero bound. As of now, we cannot rule out this possibility and are therefore not inclined to look for higher yields during the next 3 months. Momentum, Positioning & Sentiment Other technical signals can also help call tops and bottoms in bond yields. One such signal comes from our Composite Technical Indicator, an indicator that is based on yield changes, investor sentiment surveys and positioning in bond futures markets. Right now, the indicator is sending a strong “overbought” signal with a reading below -1 (Chart 7). Chart 7Technical Treasury Signals
Technical Treasury Signals
Technical Treasury Signals
In isolation, an overbought signal from our Composite Technical Indicator is not a strong reason to call for higher yields. We found that, historically, a reading below -1 from our indicator precedes a 3-month move higher in the 10-year Treasury yield only 53% of the time (Table 3). Table 3Technical Treasury Indicator Performance (1995 – Present)
When And Where Will Bond Yields Trough?
When And Where Will Bond Yields Trough?
One reason for the Composite Technical Indicator’s mediocre performance is that, even at low levels, the market can always become more overbought. But we can partially control for this by combining the overbought signal from our indicator with simple momentum measures that might signal a trend reversal. For example, a reading below -1 from our Composite Technical Indicator combined with a 1-week increase in the 10-year yield precedes a higher 10-year yield during the next three months 58% of the time. If we wait for a 2-week increase in the 10-year yield the rule’s success rate rises to 60%, and it rises to 71% if we wait for the 10-year yield to break above its 4-week moving average. At present, our Composite Technical Indicator shows that Treasuries are extremely overbought, but momentum measures are sending no signals about an imminent trend change (Chart 7, bottom 3 panels). Bottom Line: It is too soon to call the bottom in bond yields. To help make that call we will be looking for when: daily new COVID-19 infections reach zero, global growth indicators improve, US economic indicators worsen, technical indicators signal a reversal. Some Quick Notes On TIPS, MBS And Spread Product Allocations Along with raising recommended portfolio duration to benchmark on a 12-month horizon, we also recommend neutralizing exposure to spread product in US bond portfolios. This includes reducing exposure to high-yield corporate bonds. High-yield remains attractively valued but will continue to sell off as long as risk-off market sentiment prevails. The looming oil price war will also weigh heavily on the sector, which is highly exposed to the US shale energy space. Once again using the SARS epidemic as a comparable, we see that – like Treasury yields – junk excess returns bottomed when the number of daily new cases approached zero (Chart 8). We could still be relatively far from this point, so taking risk off the table makes sense. New all-time lows in Treasury yields will drag mortgage rates lower and lead to a spike in refinancing activity. We also recommend moving MBS allocations to underweight. New all-time lows in Treasury yields will drag mortgage rates lower and lead to a spike in refinancing activity. This spike is not yet fully reflected in MBS spreads, which remain relatively tight (Chart 9) Chart 8Too Soon To Call For Peak Junk Spreads
Too Soon To Call For Peak Junk Spreads
Too Soon To Call For Peak Junk Spreads
Chart 9Downgrade MBS
Downgrade MBS
Downgrade MBS
. Going forward, even after the economic fallout from COVID-19 has passed and it is time to increase exposure to spread product, we will likely continue to recommend an underweight allocation to MBS because better opportunities will be available in investment grade and high-yield corporate bonds where spreads will be much more attractive. On TIPS, last weekend’s oil supply shock – combined with the demand shock from COVID-19 – will conspire to keep long-maturity TIPS breakeven inflation rates well below their “fundamental fair value” for some time yet. But for investors with longer time horizons we see exceptional value in TIPS relative to nominal Treasuries. Even before yesterday’s big drop in oil, the 10-year TIPS breakeven inflation rate was 52 bps cheap relative to the fair value reading from our Adaptive Expectations Model (Chart 10).3 Chart 10TIPS Offer A Ton Of Long-Run Value
TIPS Offer A Ton Of Long-Run Value
TIPS Offer A Ton Of Long-Run Value
Investors with 12-month investment horizons should continue to favor TIPS over nominal Treasuries, but those with shorter horizons may be advised to stand aside and wait for the daily number of new COVID-19 cases to reach zero before re-initiating the position. Ryan Swift US Bond Strategist rswift@bcaresearch.com Footnotes 1 Please see China Investment Strategy Weekly Report, “China: Back To Its Old Economic Playbook?”, dated February 26, 2020, available at cis.bcaresearch.com 2 For more details on our Golden Rule of Bond Investing please see US Bond Strategy Special Report, “The Golden Rule of Bond Investing", dated July 24, 2018, available at usbs.bcaresearch.com 3 For more details on our Adaptive Expectations Model please see US Bond Strategy Weekly Report, “How Are Inflation Expectations Adapting?”, dated February 11, 2020, available at usbs.bcaresearch.com Fixed Income Sector Performance Recommended Portfolio Specification
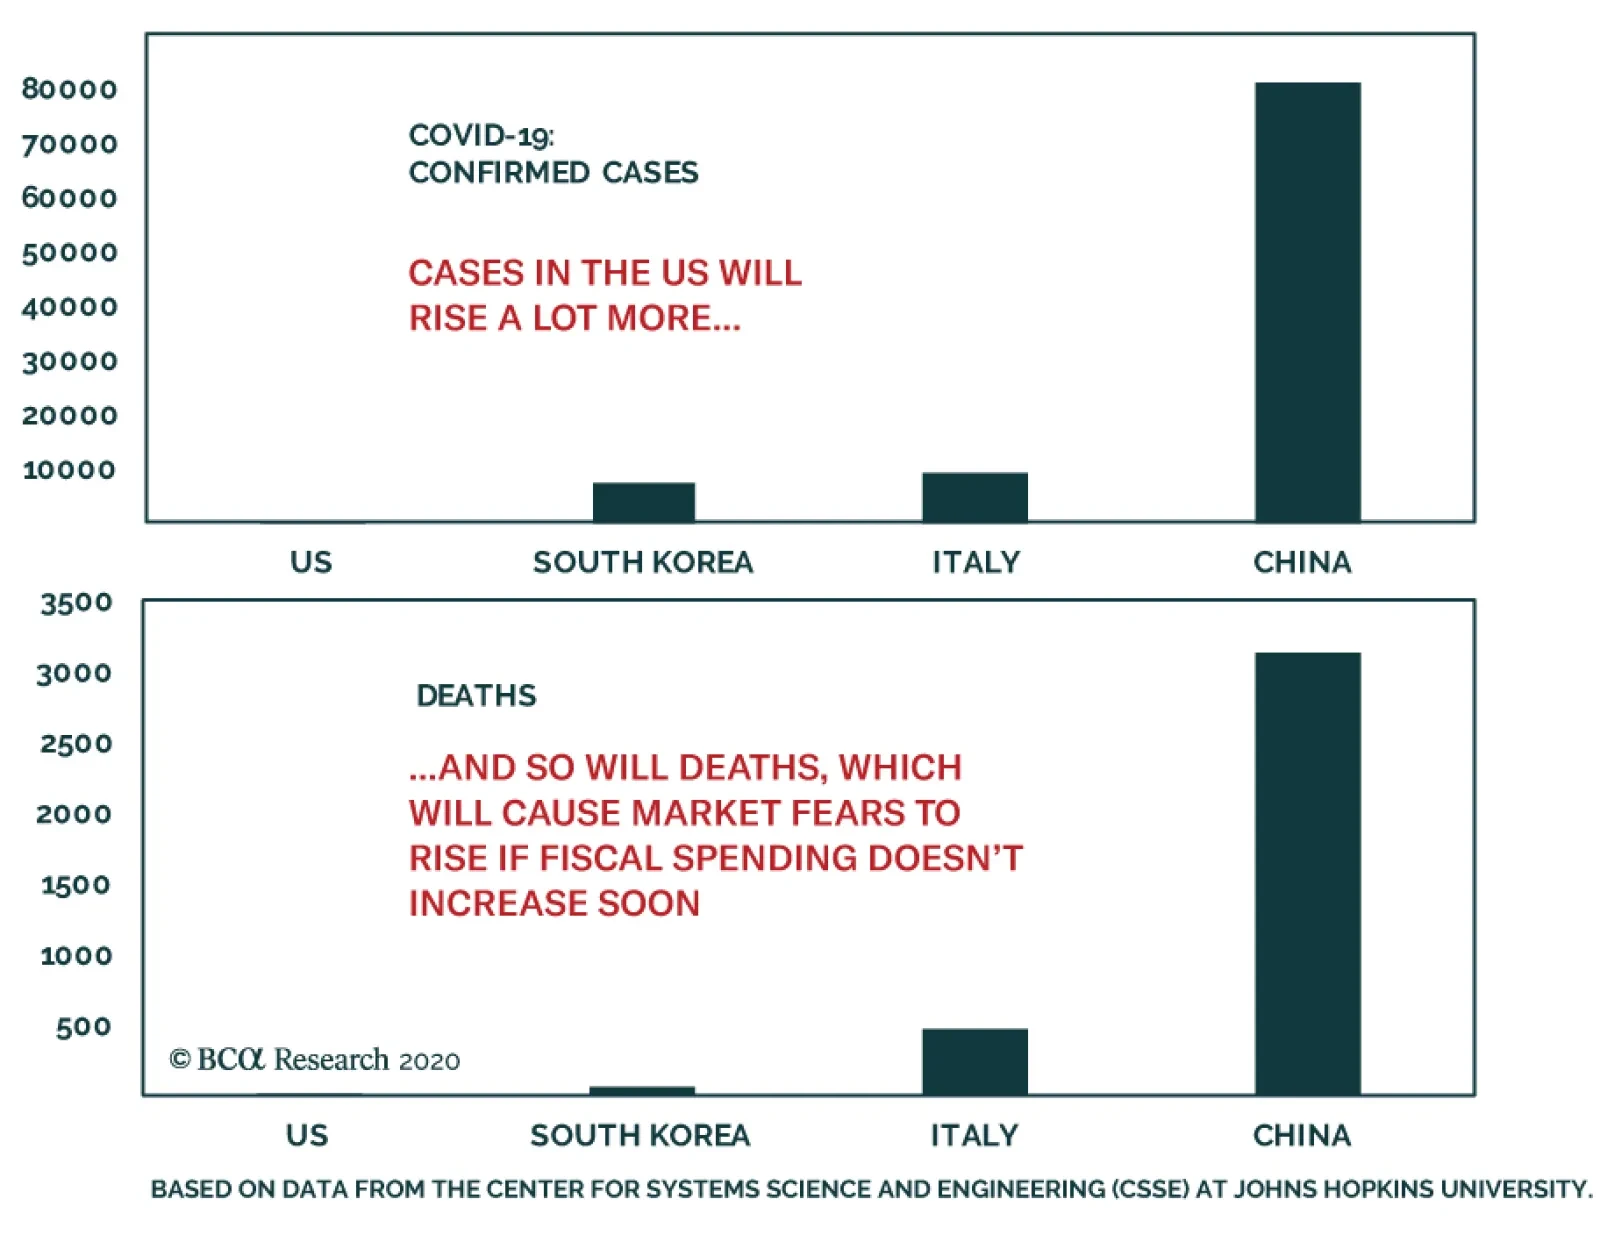
The market already anticipates the Fed to cut the fed funds rate below 0.25% by April, thus the Fed can do little to jolt markets higher. A large-scale fiscal spending package is the only policy measure that could put a permanent floor under equities in short…
Highlights The latest interest rate cuts by central banks confirms the narrative that the authorities view economic risks as asymmetrical to the downside. This all but assures that competitive devaluation will become the dominant currency landscape in the near future. If the virus proves to be just another seasonal flu, the global economy will be awash with much more stimulus, which will be fertile ground for pro-cyclical currencies. In the event that we get a much more malignant outcome, discussions around interest rate cuts will rapidly evolve into quantitative easing and debt monetization. The dollar will be the ultimate loser in both scenarios, but this path could be lined with intermediate strength. Our highest-conviction call before the dust settles is to short USD/JPY. We are also making a few portfolio adjustments in light of recent market volatility. Buy NOK/SEK and NZD/CHF and take profits soon on long SEK/NZD. Feature The DXY rally that began last December faltered below overhead psychological resistance at 100, and has since broken below key technical levels. The V-shaped reversal has been a mirror image of developments in equity markets, with the S&P 500 off 6% from its lows. The catalyst was aggressive market pricing of policy action from the Federal Reserve, to which the authorities yielded. The latest policy action confirms the narrative that most central banks continue to view deflation as a much bigger threat than inflation, since few have been able to achieve their mandate. This all but assures that competitive devaluation will become the dominant currency landscape, as each central bank prevents appreciation in their respective currency. Should the Fed continue on the path of much more aggressive stimulus, this will have powerful implications for the dollar and across both G10 and emerging market currencies. The US 10-year Treasury yield broke below 1% around 1:40 p.m. EST on March 3rd. This was significant not because of the level but because it emblematically erased the US carry trade for a number of countries (Chart I-1). Should the Fed continue on the path of much more aggressive stimulus, this will have powerful implications for the dollar and across both G10 and emerging market currencies. Chart I-1The Big Convergence
The Big Convergence
The Big Convergence
To Buy Or Sell The DXY? If the virus proves to be only slightly more lethal than the seasonal flu, the global economy will be awash with much more stimulus, which will be fertile ground for pro-cyclical currencies. As a counter-cyclical currency, the dollar will buckle, lighting a fire under our favorites such as the Norwegian krone and the Swedish krona. The euro will be the most liquid beneficiary of this move. Chart I-2 shows that the global economy was already on a powerful V-shaped recovery path before the outbreak. More importantly, this recovery was on the back of easier financial conditions. Chart I-2V-Shaped Recovery At Risk
V-Shaped Recovery At Risk
V-Shaped Recovery At Risk
Chart I-3A Second Wave Of Infections?
A Second Wave Of Infections?
A Second Wave Of Infections?
Our roadmap is the peak in the momentum of new infections outside of China. During the SARS 2013 episode, the bottom in asset prices (and peak in the DXY) occurred when the momentum in new cases peaked. Currency markets are currently pricing a much worse outcome than SARS. The risk is that we are entering a second wave of infections outside Hubei, China, which will be more difficult to control than when it was relatively more contained within the epicenter (Chart I-3). As we aptly witnessed a fortnight ago, currency markets will make a binary switch to risk aversion on such an outcome. This warns against shorting the DXY index or buying the euro or pound in the near term. As we go to press, the virus has been identified on almost every continent except Antarctica. Even in countries such as the US, with modern and sophisticated health facilities, the costs to get tested are exorbitant for underinsured individuals.1 This all but assures that the number of underreported cases is likely non-trivial, which could trigger another market riot once they surface. Chart I-4DXY and USD/JPY Tend To Move Together
DXY and USD/JPY Tend To Move Together
DXY and USD/JPY Tend To Move Together
Our highest-conviction call before the dust settles is therefore to short USD/JPY. As Chart I-1 highlights, the Bank of Japan is much closer to the end of their rope in terms of monetary policy tools. Long bond yields have already hit the zero bound, which means that real rates in Japan will continue to rise until the authorities are forced to act. One of the triggers to act will be a yen soaring out of control, which is not yet the case. Speculative evidence is that it will take a yen rally in the order of 12% to catalyze the BoJ. More importantly, the speed of the rally will matter. This was the trigger for negative interest rates in January 2016 as well as yield curve control in September of 2016. The first rally from USD/JPY 125 to around 112 and the subsequent rise towards 100 were both in the order of 12%. A similar rally from the recent peak near 112 will pin the USD/JPY at 100. Bottom Line: The yen is the most attractive currency to play dollar downside at the moment. Remain short USD/JPY. If global growth does pick up and the dollar weakens, the USD/JPY and the DXY tend to be positively correlated most of the time, providing ample room for investors to rotate into more pro-cyclical pairs (Chart I-4). Competitive Devaluation? In the event that we get a much more malignant outcome, discussions around interest rate cuts will rapidly evolve into quantitative easing and debt monetization. The Reserve Bank of Australia has already stated that QE is on the table if rates touch 0.25%.2 Other central banks are likely to follow suit. As the chorus of central banks cutting rates and stepping into QE on COVID-19 rises, the rising specter of currency brinkmanship is likely to unnerve countries pursuing more orthodox monetary policies. The currency of choice will be gold and other precious metals, though the dollar, Swiss franc, and yen are likely to also outperform. The velocity of money in both the US and the euro area was in a nascent upturn, but has started to roll over. Whether or not countries adopt QE, what is clear is that balance sheet expansion at both the Fed and the European Central Bank is set to continue. Chart I-5 shows that the velocity of money in both nations was in a nascent upturn, but has started to roll over. This tends to lead inflation by a few quarters. On a relative basis, our bias is that the pace of expansion should be more pronounced in the US. This will eventually set the dollar up for a significant decline, albeit after a knee-jerk rally. Chart I-5ADownside Risks To US Inflation
Downside Risks To US Inflation
Downside Risks To US Inflation
Chart I-5BDownside Risks To Euro Area Inflation
Downside Risks To Euro Area Inflation
Downside Risks To Euro Area Inflation
In terms of quantitative easing, it is most appealing when a country has low growth, low inflation, and large amounts of public debt. If we are right that inflation is about to roll over in the US, then the public debt profile and political capital to expand the budget deficit places the nation as a prime candidate for QE (Chart I-6). Fiscal stimulus is a much more difficult discussion in Europe, Japan, or elsewhere for that matter, and likely to arrive late. Chart I-6US Government Debt Is Very High
US Government Debt Is Very High
US Government Debt Is Very High
The backdrop for the US dollar is a 37% rise from the bottom. The New York Fed estimates that a 10 percentage point appreciation in the dollar shaves 0.5 percentage points off GDP growth over one year, and an additional 0.2 percentage points in the following year.3 With growth now hovering around 2%, a strong currency could easily nudge US growth to undershoot potential. The Fed is one of the few G10 central banks with room to ease monetary policy. This sets the dollar up for an eventual decline. However, the path to QE will be lined by a strong dollar if the backdrop is flight to safety. This entails rolling currency depreciations among some developed and emerging markets. When looking for the next candidates for competitive devaluation, the natural choices are the countries with overvalued exchange rates that are exerting a powerful deflationary impulse into their economies. Chart I-7 shows the deviation of real effective exchange rates from their long-term mean, according to the BIS. Chart I-7Competitive Devaluation Candidates
Are Competitive Devaluations Next?
Are Competitive Devaluations Next?
Bottom Line: The Fed is one of the few G10 central banks with room to ease monetary policy. This sets the dollar up for an eventual decline. It will first occur among the safe havens (currencies with already low interest rates), before it rotates to more procyclical currencies. Where Does US Politics Fit In? Politics should start to have a meaningful impact on the dollar once the democratic nominee is sealed. Super Tuesday revealed a powerful shift to the center, pinning former Vice President Joe Biden as the preferred candidate (Chart I-8). The dollar tends to thrive as political uncertainty rises. While not a forgone conclusion, a Sanders–Trump rivalry would have been a very polarized outcome, putting a bid under the greenback. Markets are likely to take a more conciliatory tone from a Biden victory, which will be negative for the greenback. Chart I-8US Politics Will Be Important
Are Competitive Devaluations Next?
Are Competitive Devaluations Next?
Our colleague Matt Gertken, chief geopolitical strategist, just published his analysis of Super Tuesday.4 While a contested convention remains unlikely, it will likely favor Trump’s reelection odds. What is common about a Biden-Sanders-Trump trio is that fiscal policy is set to expand in the US. This will ultimately be dollar bearish (Chart I-9). Chart I-9The Dollar And Budget Deficits
The Dollar And Budget Deficits
The Dollar And Budget Deficits
Bottom Line: The election is still many months away and much can change between now and then. For now, Biden is the preferred democratic nominee. Portfolio Adjustments Chart I-10Sell CHF/NZD
Sell CHF/NZD
Sell CHF/NZD
The sharp rally in the VIX index has opened up a trading opportunity on the short side. The historical pattern of previous spikes in the VIX is that unless the market starts to price in an actual recession, which is quite plausible, the probability of a short-term reversal is close to 100%. Given our base case that we are not headed for a recession over the next six to 12 months, we are opening a short CHF/NZD trade today. The cross tends to benefit from spikes in volatility, correcting sharply as the market unwinds overreactions. More importantly, the cross has already priced in an overshoot in the VIX in an order of magnitude akin to 2008. Place stops at 1.75 with a target of 1.45 (Chart I-10). We are also placing a limit buy on NOK/SEK at parity. The risk to this trade is a further down-leg in oil prices, but at parity, the cross makes for a compelling tactical trade. Momentum on the cross is currently bombed out. We will be closely watching whether Russia complies with OPEC production cuts and act accordingly. Remain long NOK within our petrocurrency basket against the euro. We are also looking to take profits on our long SEK/NZD trade, a nudge below our initial target. The market has fully priced in a rate cut by the Reserve Bank of New Zealand, suggesting the kiwi could have a knee-jerk rally, similar to the Aussie on the actual announcement. Finally, we were stopped out of our short gold/silver trade for a loss of 5.5%. We will be looking to re-establish this trade in the coming weeks. Stay tuned. Chester Ntonifor Foreign Exchange Strategist chestern@bcaresearch.com Footnotes 1 Bertha Coombs and William Feuer, “The coronavirus test will be covered by Medicaid, Medicare and private insurance, Pence says,” CNBC, dated March 4, 2020. 2 Michael Heath, “RBA Says QE Is Option at 0.25%, Doesn’t Expect to Need It,” Bloomberg News, dated November 26, 2019. 3 Mary Amiti and Tyler Bodine-Smith, “The Effect of the Strong Dollar on U.S. Growth,” Federal Reserve Bank of New York, dated July 17, 2015. 4 Please see Geopolitical Strategy Special Report, titled “US Election: A Return To Normalcy?”, dated March 4, 2020, available at gps.bcaresearch.com. Currencies U.S. Dollar Chart II-1USD Technicals 1
USD Technicals 1
USD Technicals 1
Chart II-2USD Technicals 2
USD Technicals 2
USD Technicals 2
Recent data in the US have been positive: The ISM manufacturing PMI fell slightly to 50.9, dragged down by the prices paid and new orders component, while the non-manufacturing index ticked up to 57.3. Core PCE inflation increased to 1.6% year-on-year in January. Unit labor costs came in at 0.9% quarter-on-quarter in Q4 of last year. This is a deceleration from the previous print of 2.5%. The DXY index depreciated by 1.4% this week. Following a conference call with G7 central banks, the Fed made an emergency rate cut of 50bps. Chairman Powell cited risks to the outlook from Covid-19 but acknowledged that the Fed can keep financial conditions accommodative, not fix broken supply chains or cure infections. Report Links: The Near-Term Bull Case For The Dollar - February 28, 2020 On The DXY Breakout, Euro, And Swiss Franc - February 21, 2020 Building A Protector Currency Portfolio - February 7, 2020 The Euro Chart II-3EUR Technicals 1
EUR Technicals 1
EUR Technicals 1
Chart II-4EUR Technicals 2
EUR Technicals 2
EUR Technicals 2
Recent data in the euro area have been positive: Core CPI inflation increased slightly to 1.2% year-on-year in February. The producer price index contracted by 0.5% year-on-year in January. The unemployment rate remained flat at 7.4% in January. Retail sales grew by 1.7% year-on-year in January, remaining flat from the previous month. The euro appreciated by 3.6% against the US dollar this week. As the ECB is limited by the zero lower bound, the euro strengthened on expectations that rate differentials with the US will continue to narrow. The ECB could resort to policy alternatives such as a special facility targeting small and medium enterprises. Markets are pricing in an 81% probability of a rate cut as we go into the ECB meeting next week. Report Links: On The DXY Breakout, Euro, And Swiss Franc - February 21, 2020 Updating Our Balance Of Payments Monitor - November 29, 2019 On Money Velocity, EUR/USD And Silver - October 11, 2019 Japanese Yen Chart II-5JPY Technicals 1
JPY Technicals 1
JPY Technicals 1
Chart II-6JPY Technicals 2
JPY Technicals 2
JPY Technicals 2
Recent data in Japan have been negative: The Tokyo CPI excluding fresh food grew by 0.5% year-on-year in February from 0.7% the previous month. The jobs-to-applicants ratio decreased to 1.49 from 1.57 while the unemployment rate increased to 2.4% from 2.2% in January. The consumer confidence index declined to 38.4 from 39.1 in February. Housing starts contracted by 10.1% year-on-year in January from 7.9% the previous month. The Japanese yen appreciated by 2.5% against the US dollar this week. Lower US yields, combined with continued risk-on flows, have extended the rally in the Japanese yen. Weakness in the Japanese economy is broad based, but the BoJ has limited policy space and fiscal action looks unlikely anytime soon. Global central bank action will drive the yen in the near term. Report Links: The Near-Term Bull Case For The Dollar - February 28, 2020 Building A Protector Currency Portfolio - February 7, 2020 Currency Market Signals From Gold, Equities And Flows - January 31, 2020 British Pound Chart II-7GBP Technicals 1
GBP Technicals 1
GBP Technicals 1
Chart II-8GBP Technicals 2
GBP Technicals 2
GBP Technicals 2
Recent data in the UK have been mixed: Consumer credit decreased to GBP 1.2 billion from GBP 1.4 billion while net lending to individuals fell to GBP 5.2 billion from GBP 5.8 billion in January. Mortgage approvals increased to 70.9 thousand from 67.9 thousand in January, while the Nationwide housing price index grew by 2.3% year-on-year in February from 1.9% the previous month. The British pound appreciated by 0.2% against the US dollar this week. At a hearing this week, incoming governor Andrew Bailey stated that the BoE is still assessing evidence on the nature of the shock from Covid-19. The BoE has limited room to cut and is constrained by possible stagflation; we expect targeted supply chain finance and cooperation with fiscal authorities to take precedence. Report Links: Updating Our Balance Of Payments Monitor - November 29, 2019 A Few Trade Ideas - Sept. 27, 2019 United Kingdom: Cyclical Slowdown Or Structural Malaise? - Sept. 20, 2019 Australian Dollar Chart II-9AUD Technicals 1
AUD Technicals 1
AUD Technicals 1
Chart II-10AUD Technicals 2
AUD Technicals 2
AUD Technicals 2
Recent data in Australia have been mixed: GDP grew by 2.2% year-on-year in Q4 2019, improving from 1.7% the previous quarter. Imports and exports both contracted by 3% while the trade balance dropped to AUD 5.2 billion in January. Building permits contracted by a dramatic 15.3% month-on-month in January, compared to growth of 3.9% in December. The RBA commodity price index contracted by 6.1% year-on-year in February. The Australian dollar appreciated by 0.8% against the US dollar this week. The Reserve Bank of Australia cut its official cash rate to 0.5%, an all-time low, citing the impact of Covid-19 on domestic spending, education, and travel. Watch to see if the signal from building permits is confirmed by other housing market indicators. The RBA might not be done easing. Report Links: On AUD And CNY - January 17, 2020 Updating Our Balance Of Payments Monitor - November 29, 2019 A Contrarian View On The Australian Dollar - May 24, 2019 New Zealand Dollar Chart II-11NZD Technicals 1
NZD Technicals 1
NZD Technicals 1
Chart II-12NZD Technicals 2
NZD Technicals 2
NZD Technicals 2
Recent data in New Zealand have been negative: The terms of trade index grew by 2.6% quarter-on-quarter in Q4 2019, improving from 1.9% in Q3. The ANZ commodity price index contracted by 2.1% in February, deepening from 0.9% the previous month. Building permits contracted by 2% month-on-month in January, from growth of 9.8% in December. The global dairy trade price index contracted by 1.2% in March. The New Zealand dollar appreciated by 0.3% against the US dollar this week. There is pressure on the Reserve Bank of New Zealand (RBNZ) to ease at its next meeting on March 27, with markets pricing in 42 basis points of easing over the next 12 months. However, the RBNZ has dispelled notions of a pre-meeting cut. Report Links: Updating Our Balance Of Payments Monitor - November 29, 2019 Place A Limit Sell On DXY At 100 - November 15, 2019 USD/CNY And Market Turbulence - August 9, 2019 Canadian Dollar Chart II-13CAD Technicals 1
CAD Technicals 1
CAD Technicals 1
Chart II-14CAD Technicals 2
CAD Technicals 2
CAD Technicals 2
Recent data in Canada have been negative: Annualized GDP grew by 0.3% quarter-on-quarter in Q4 2019, slowing from 1.4% the previous quarter. The raw material price index contracted by 2.2% and industrial product price index contracted by 0.3% month-on-month in January. Labor productivity contracted by 0.1% quarter-on-quarter in Q4 2019, compared to growth of 0.2% the previous quarter. The Canadian dollar depreciated by 0.1% against the US dollar this week. The Bank of Canada (BoC) followed the Fed and cut rates by 50bps. In addition to the confidence hit from Covid-19, the BoC cited falling terms of trade, depressed business investment, and dampened economic activity due to the CN rail strikes. The BoC stands ready to ease further, and Prime Minister Trudeau has raised the possibility of a fiscal response. Report Links: The Loonie: Upside Versus The Dollar, But Downside At The Crosses Updating Our Balance Of Payments Monitor - November 29, 2019 Making Money With Petrocurrencies - November 8, 2019 Swiss Franc Chart II-15CHF Technicals 1
CHF Technicals 1
CHF Technicals 1
Chart II-16CHF Technicals 2
CHF Technicals 2
CHF Technicals 2
Recent data in Switzerland have been positive: GDP grew by 1.5% year-on-year in Q4 2019, from growth of 1.1% the previous quarter. The SVME PMI increased to 49.5 from 47.8 in February. The KOF leading indicator increased to 100.9 from 100.1 in February. CPI contracted by 0.1% year-on-year in February, from growth of 0.2% the previous month. The Swiss franc appreciated by 1.6% against the US dollar this week. A combination of strong domestic data and global risk-off flows contributed to strength in the Swiss franc. However, the Swiss government will be revising down growth forecasts and a recent UN report has estimated that Switzerland lost US$ 1 billion in exports in February due to Chinese supply disruptions. Combined with a strong franc, this puts the domestic outlook at risk. Report Links: On The DXY Breakout, Euro, And Swiss Franc - February 21, 2020 Currency Market Signals From Gold, Equities And Flows - January 31, 2020 Portfolio Tweaks Before The Chinese New Year - January 24, 2020 Norwegian Krone Chart II-17NOK Technicals 1
NOK Technicals 1
NOK Technicals 1
Chart II-18NOK Technicals 2
NOK Technicals 2
NOK Technicals 2
Recent data in Norway have been positive: The current account decreased to NOK 19.1 billion from NOK 29.5 billion in Q4 2019. The credit indicator grew by 5% year-on-year in January. Registered unemployment decreased slightly to 2.3% from 2.4% in February. The Norwegian krone appreciated by 1.3% against the US dollar this week. Expect the petrocurrency to trade on news from the OPEC meetings in the coming days. The committee has proposed a production cut of 1.5 million barrels per day through Q2 2020, conditional on approval from Russia, to offset the demand shock from Covid-19. Report Links: Building A Protector Currency Portfolio - February 7, 2020 On Oil, Growth And The Dollar - January 10, 2020 Updating Our Balance Of Payments Monitor - November 29, 2019 Swedish Krona Chart II-19SEK Technicals 1
SEK Technicals 1
SEK Technicals 1
Chart II-20SEK Technicals 2
SEK Technicals 2
SEK Technicals 2
Recent data in Sweden have been positive: The Swedbank manufacturing PMI increased to 53.2 from 52 in February. Industrial production grew by 0.9% year-on-year, from a contraction of 2.6% the previous month. GDP grew by 0.8% year-on-year in Q4 2019, slowing from 1.8% the previous month. The Swedish krona appreciated by 1.5% against the US dollar this week. After hitting a 2-decade high near 10, USD/SEK has violently reversed and is now trading at the 9.45 level. What is evident from incoming data is that the cheap currency has been a perfect shock absorber, cushioning the domestic economy. We are protecting profits on long SEK/NZD today and we will be looking for other venues to trade SEK on the long side. Report Links: Updating Our Balance Of Payments Monitor - November 29, 2019 Where To Next For The US Dollar? - June 7, 2019 Balance Of Payments Across The G10 - February 15, 2019 Trades & Forecasts Forecast Summary Core Portfolio Tactical Trades Limit Orders Closed Trades
Dear Client, We are publishing an abbreviated report this week. Last night, I sent you a special report written by Matt Gertken, BCA’s chief geopolitical strategist, containing his analysis of the US presidential race following Super Tuesday’s results. I hope you will take the time to read Matt’s excellent report. Best regards, Peter Berezin, Chief Global Strategist Highlights While a 1918 Spanish flu-type scenario cannot be ruled out, it is unlikely. Evidence is emerging that a handful of sensible measures can significantly slow the spread of the virus. The fact that the number of new cases outside of China fell from 2,410 on March 3rd to 2,160 on March 4th indicates that these measures may be working. The saga of the Diamond Princess cruise liner suggests that the true fatality rate may be under 1%. Tentative evidence that the virus has mutated into a less lethal form implies that the fatality rate could fall even more. Investors should remain overweight equities. The shift towards even looser monetary policy in the US and elsewhere has increased the probability that stocks will rip higher, perhaps even entering a full-fledged bubble like they did in 1998 after the Fed cut rates in the wake of Long-Term Capital Management‘s implosion. Global bond yields will rise modestly from current levels. While the Fed is highly likely to cut rates another 25 basis points later this month, we doubt that rates will stay as low for as long as markets currently anticipate. US yields will increase more than yields abroad, which should take some pressure off the dollar. Nevertheless, as a countercyclical currency, the greenback will likely trade lower over the remainder of the year as global growth begins to reaccelerate. Stay Overweight Stocks We upgraded our near-term view on global equities last Friday morning after having penned a report the prior week entitled “Markets Too Complacent About The Coronavirus”. Despite this morning’s setback, the MSCI All-Country World index is still up 5.5% in dollar terms since our upgrade. The rebound in stocks has prompted some clients to ask whether it makes sense to revert to a more cautious stance again. The stock market is certainly pricing in a less apocalyptic scenario than it was on Friday. Nevertheless, we think investors should maintain a bullish posture towards equities for the time being. The shift towards even looser monetary policy in the US and elsewhere has increased the probability that stocks will rip higher, perhaps even entering a full-fledged bubble like they did in 1998 after the Fed cut rates in the wake of Long-Term Capital Management‘s implosion. A Manageable Problem While a 1918 Spanish flu-type scenario cannot be ruled out, it is unlikely. For one thing, most people died from secondary bacterial pneumonia back then. The virus damaged the lungs and bronchial tubes of its victims, permitting common bacteria to infect the lungs. This problem can now be readily treated with antibiotics. Moreover, as China’s experience demonstrates, it is possible to contain the coronavirus. China has recorded just 42 new cases outside of Hubei since February 26. The number of cases in Hubei has also plunged. In fact, the government has already closed one of its makeshift hospitals built to house COVID-19 patients. One might argue that other countries will not be able to implement the same draconian measures that China was willing to take. We are sympathetic to this view, but would note that Singapore and Hong Kong have also been able to stem the outbreak without imposing mass quarantines. In fact, it is worth noting that the number of new cases outside of China fell from 2,410 on March 3rd to 2,160 on March 4th. While one day does not make a trend, it is an encouraging development. Keep Washing It may turn out that a handful of sensible measures can significantly slow the spread of the virus, and perhaps even in a best-case scenario, stop it in its tracks. These include frequent handwashing, avoiding mass gatherings, and wearing a face mask in public. Granted, a mask will not help you much if you are not already infected, but if a social norm is established that compels everyone to wear a mask in public for a period of a few months, then those who are infected but do not know it will pose less of a risk to others. Extreme shaming of people who waltz into work with cold symptoms would also be a good idea. Who knows, we might even end up realizing my lifelong dream of replacing the grubby western handshake with a much more elegant Thai wai. What’s The Current Fatality Rate? A simple calculation of the number of COVID-19 deaths divided by the number of confirmed cases implies that the current fatality rate is around 3%. However, this figure is probably overstated because the denominator excludes people with mild symptoms who were never tested. The outbreak on the Diamond Princess cruise liner offers a potentially important natural experiment. Of the 705 people on board who have contracted the virus, only six have died. All six were over the age of 70. This is actually a fairly low fatality rate, considering that those on board were probably exposed to concentrated viral loads, and in some cases, had their treatment delayed. Admittedly, not everyone on board has fully recovered. Thus, more deaths could still occur. Nevertheless, the cruise ship’s saga does suggest that the true fatality rate from COVID-19 may be less than 1%, with most of the deaths confined to the elderly and those with pre-existing respiratory conditions. Two Virus Strains The other piece of good news has to do with the virus itself. A recent study conducted by researchers at Peking University’s School of Life Sciences and the Institut Pasteur of Shanghai has revealed that the virus has evolved into two major strains, designated L and S. Strain L is the more pervasive and aggressive of the two, but has become less common since early January.1 This is not surprising. Viruses that quickly leave people bedridden will spread less rapidly than those that produce milder symptoms. This suggests that the fatality rate from the virus could trend lower. Joementum The other market-relevant development this week was Joe Biden‘s better-than-expected performance in the South Carolina primary on Saturday and the Super Tuesday states. Betting markets are now giving Biden a 76% chance of becoming the Democratic nominee, up from 7% on February 11. Unlike in 1918 when the Bolsheviks consolidated power, Bernie “I don’t mind people calling me a communist” Sanders no longer has much of a path to becoming America’s first socialist leader. As president, Joe Biden would likely take a more conciliatory stance towards trade issues with China. That said, if the Democrats manage to capture the Senate, Biden would probably be willing to sign into law a bill that reversed at least part of Trump’s corporate tax cuts. On balance, the impact on markets would probably not be huge regardless of who wins the election. This suggests that US political risk could fade over the coming months. That is bullish for stocks. Investment Conclusions Investors should overweight global equities over both a 3-month and 12-month horizon. Bond yields will rise modestly from current levels. While the Fed is highly likely to cut rates a further 25 basis points later this month, we doubt that rates will stay as low for as long as markets currently anticipate. US yields will increase more than yields abroad, which should take some pressure off the dollar. Nevertheless, as a countercyclical currency, the greenback will likely trade lower over the remainder of the year as global growth begins to reaccelerate. The combination of stronger growth and a weaker dollar will lift commodity prices, while also giving cyclical stocks and financials a boost. Cyclicals and financials are overrepresented in non-US indices, which implies that international stocks will outperform their US peers. Peter Berezin Chief Global Strategist peterb@bcaresearch.com Footnotes 1 Xiaolu Tang, Changcheng Wu, Xiang Li, Yuhe Song, Xinmin Yao, Xinkai Wu, Yuange Duan, Hong Zhang, Yirong Wang, Zhaohui Qian, Jie Cui, Jian Lu, “On the origin and continuing evolution of SARS-CoV-2,” National Science Review (March 3, 2020). Global Investment Strategy View Matrix
1918 Or 1998?
1918 Or 1998?
MacroQuant Model And Current Subjective Scores
1918 Or 1998?
1918 Or 1998?
Strategic Recommendations Trades Closed In 2015-2020
Highlights Financial markets are now fully priced for an economic downturn lasting one quarter… …but they are not fully priced for a recession. To go tactically long equities versus bonds requires a high conviction that the coronavirus induced downturn will last no longer than one quarter. The big risk is that the coronavirus incubation period might be very long, rendering containment strategies ineffective. Hence, a better investment play is to go long positive yielding US T-bonds and/or UK gilts versus negative yielding Swiss bonds and/or German bunds… …or go long negative yielding currencies versus positive yielding currencies. Our favoured expression is long CHF/USD. Fractal trade: overweight Poland versus Portugal. Feature Chart I-1AFinancial Markets Are Priced For A One-Quarter Downturn...
Financial Markets Are Priced For A One-Quarter Downturn...
Financial Markets Are Priced For A One-Quarter Downturn...
Chart I-1B...But Not For A ##br##Recession
...But Not For A Recession
...But Not For A Recession
They say that when China sneezes, the rest of the world catches a cold. But the saying was meant as an economic metaphor, not as a literal medical truth.1 The current coronavirus crisis has two potential happy endings: ‘containment’, in which its worldwide contagion is halted; or ‘normalisation’, in which it becomes accepted as just another type of winter flu. The virus crisis also has a potential unhappy ending in which neither containment nor normalisation can happen. Containing Contagion To determine whether the virus crisis has a happy or unhappy ending, we must answer three crucial questions: 1. Does the virus thrive only in cold weather? If yes, then the onset of spring and summer should naturally contain the contagion (in the northern hemisphere). We are not experts in epidemiology or immunology, but we understand that the Covid-19 virus surface is a lipid (fat) which could become fragile at higher temperatures. Albeit this might just be a temporary containment until temperatures drop again. 2. Does the virus have a short incubation period before symptoms arise? If yes, then quarantining and containment will be effective because infected people are quickly identified. But if, after infection, there is a long asymptomatic period, then containment would be impossible – because for an extended period the virus would be ‘under cover’. In this regard, the dispersion of infections is as important as the number of infections. A thousand cases across a hundred countries is much more worrying than a thousand cases concentrated in two or three countries (Chart I-2). Chart I-2Covid-19 Has Spread To 80 Countries
Covid-19 Has Spread To 80 Countries
Covid-19 Has Spread To 80 Countries
3. Are most infections going undetected because the symptoms are very mild? If yes, then the true mortality rate of the Covid-19 virus is much lower than we think, and perhaps not that different to the mortality rate of winter flu, at around 1 in a 1000. In which case, the new virus could become ‘normalised’ as a variant of the flu. But if the current mortality rate, at ten times deadlier than the flu, is accurate, then it would be difficult to normalise (Chart I-3). Chart I-3The Covid-19 Mortality Rate Is Ten Times Deadlier Than The Flu. Or Is It?
The Covid-19 Mortality Rate Is Ten Times Deadlier Than The Flu. Or Is It?
The Covid-19 Mortality Rate Is Ten Times Deadlier Than The Flu. Or Is It?
An unhappy ending to the crisis will happen if the answer to all three questions is ‘no’. The main risk is that the asymptomatic incubation period appears to be quite long, rendering containment strategies ineffective. Still, even if the happy ending happens, there are two further questions. How much disruption will the economy suffer before the happy ending? And what have the financial markets priced? The Economic Disruption The disruption to the economy comes from both the supply side and the demand side: the supply side because containment strategies such as quarantining entire towns, shuttering factories, and cancelling major sports and social events hurt output; the demand side because a fearful public’s reluctance to use public transport, visit crowded places such as shopping malls, or travel abroad hurt spending. In this way, both production and consumption will suffer a large hit in the first quarter, at the very least. However, when normal activity eventually resumes, production and consumption will bounce back to pre-crisis levels, and in some cases overshoot pre-crisis levels. For example, if the crisis lasts for a quarter, movie-goers will return to the cinemas as usual in the second quarter, albeit they will not compensate for the visit they missed in the first quarter; but for manufacturers, the backlog of components that were not made during the first quarter will mean that twice as many will be made in the second quarter. For the financial markets, it is not the depth of the V that is important so much as its length. Therefore, economic output will experience a ‘V’ (Chart I-4): a lurch down followed by a symmetrical, or potentially even larger, snapback. However, for the financial markets, it is not the depth of the V that is important so much as its length. Chart I-4Economic Output Will Experience A 'V'
Economic Output Will Experience A 'V'
Economic Output Will Experience A 'V'
The Financial Market Disruption Anticipating the economy to experience a V, investors respond to the crisis according to the expected length of the V versus the different lengths of their investment horizons. By length of investment horizon, we mean the minimum timeframe over which the investor cares about a price move, or ‘marks to market’. Say the market expects the downturn to last three months, followed by a full recovery. A three-month investor, caring about the price in three months, will capitulate. He will sell all his equities and buy bonds. Whereas a six-month investor, caring about the price only in six months, will not capitulate because he will factor in both the down-leg and subsequent up-leg of the V. Meanwhile, a twelve-month investor will be completely unfazed by the short-lived downturn. Therefore, if the downturn lasts one quarter only, the market will bottom when all the three-month investors have capitulated, which is to say become indistinguishable in their behaviour from a 1-day trader. In technical terms, the tell-tale sign for this capitulation is that three-month (65-day) fractal structure of the market totally collapses. Last Friday, the financial markets reached this point, meaning that financial markets are now fully priced for an economic downturn lasting one quarter (Chart I-5). Chart I-5When 3-Month Investors Capitulate It Usually Signals A Trend-Reversal...
When 3-Month Investors Capitulate It Usually Signals A Trend-Reversal...
When 3-Month Investors Capitulate It Usually Signals A Trend-Reversal...
However, six-month and longer horizon investors are still a long way from capitulation. Meaning that the markets are not yet priced for a recession – defined as a contraction in activity lasting two or more straight quarters. It follows that if the down-leg of the V lasts significantly longer than a quarter then equities and other risk-assets have further downside versus high-quality bonds (Chart of the Week). During the global financial crisis, three-month investors had fully capitulated by September 3 2008 when equities had underperformed bonds by a seemingly huge 20 percent. However, equities went on to underperform bonds by a further 50 percent and only found a bottom when eighteen-month investors had fully capitulated in early 2009 (Chart I-6). This makes perfect sense, because profits contracted for a full eighteen months (Chart I-7). Chart I-6...But In The Global Financial Crisis The Market Turned Only When 18-Month Investors Had Capitulated...
...But In The Global Financial Crisis The Market Turned Only When 18-Month Investors Had Capitulated...
...But In The Global Financial Crisis The Market Turned Only When 18-Month Investors Had Capitulated...
Chart I-7...Because In The Global Financial Crisis, Profits Contracted For 18 Months
...Because In The Global Financial Crisis, Profits Contracted For 18 Months
...Because In The Global Financial Crisis, Profits Contracted For 18 Months
All of which brings us to a very powerful investment identity: Financial markets have fully priced a downturn when the time horizon of investors that have fully capitulated = the length of the downturn. The message right today is to go tactically long equities versus bonds if you have high conviction that the coronavirus induced downturn will last no longer than one quarter. Given that the coronavirus incubation period appears to be quite long, rendering containment strategies ineffective, we do not have such a high conviction on this tactical trade. Central banks that are already at the limits of monetary policy easing cannot ease much more. Instead, we have much higher conviction that those central banks that are already at the limits of monetary policy easing cannot ease much relative to those that have the scope to ease. The conclusion is: go long positive yielding US T-bonds and/or UK gilts versus negative yielding Swiss bonds and/or German bunds. Conversely, go long negative yielding currencies versus positive yielding currencies. Our favoured expression is long CHF/USD (Chart I-8). Chart I-8Overweight Positive-Yielding Bonds, And Overweight Negative-Yielding Currencies
Overweight Positive-Yielding Bonds, And Overweight Negative-Yielding Currencies
Overweight Positive-Yielding Bonds, And Overweight Negative-Yielding Currencies
Fractal Trading System* This week’s recommended trade is to overweight Poland versus Portugal. Set the profit target at 3.5 percent with a symmetrical stop-loss. In other trades, long EUR/GBP achieved its 2 percent profit target at which it was closed. And short palladium has quickly gone into profit, given that the palladium price is down 10 percent in the last week. The rolling 1-year win ratio now stands at 62 percent. Chart I-9Poland Vs. Portugal
Poland Vs. Portugal
Poland Vs. Portugal
When the fractal dimension approaches the lower limit after an investment has been in an established trend it is a potential trigger for a liquidity-triggered trend reversal. Therefore, open a countertrend position. The profit target is a one-third reversal of the preceding 13-week move. Apply a symmetrical stop-loss. Close the position at the profit target or stop-loss. Otherwise close the position after 13 weeks. * For more details please see the European Investment Strategy Special Report “Fractals, Liquidity & A Trading Model,” dated December 11, 2014, available at eis.bcaresearch.com. Dhaval Joshi Chief European Investment Strategist dhaval@bcaresearch.com Footnotes 1 The original version of the metaphor is attributed to the nineteenth century Austrian diplomat Klemens Metternich who said: “When France sneezes all of Europe catches a cold”. Subsequently, the Metternich metaphor has been adapted for any economy with outsized influence on the rest of the world. Fractal Trading Model
Is The Contagion Containable?
Is The Contagion Containable?
Is The Contagion Containable?
Is The Contagion Containable?
Cyclical Recommendations Structural Recommendations
Is The Contagion Containable?
Is The Contagion Containable?
Is The Contagion Containable?
Is The Contagion Containable?
Is The Contagion Containable?
Is The Contagion Containable?
Is The Contagion Containable?
Is The Contagion Containable?
Trades Closed Trades Asset Performance Currency & Bond Equity Sector Country Equity Indicators Bond Yields Chart II-1Indicators To Watch - Bond Yields
Indicators To Watch - Bond Yields
Indicators To Watch - Bond Yields
Chart II-2Indicators To Watch - Bond Yields
Indicators To Watch - Bond Yields
Indicators To Watch - Bond Yields
Chart II-3Indicators To Watch - Bond Yields
Indicators To Watch - Bond Yields
Indicators To Watch - Bond Yields
Chart II-4Indicators To Watch - Bond Yields
Indicators To Watch - Bond Yields
Indicators To Watch - Bond Yields
Interest Rate Chart II-5Indicators To Watch - Interest Rate Expectations
Indicators To Watch - Interest Rate Expectations
Indicators To Watch - Interest Rate Expectations
Chart II-6Indicators To Watch - Interest Rate Expectations
Indicators To Watch - Interest Rate Expectations
Indicators To Watch - Interest Rate Expectations
Chart II-7Indicators To Watch - Interest Rate Expectations
Indicators To Watch - Interest Rate Expectations
Indicators To Watch - Interest Rate Expectations
Chart II-8Indicators To Watch - Interest Rate Expectations
Indicators To Watch - Interest Rate Expectations
Indicators To Watch - Interest Rate Expectations
Highlights At the current rate of work resumption, March’s PMI should rebound to its “normal range” from February’s historic lows. If so, our simple calculation, using China’s PMI figures and GDP growth in Q4 2008 as a template, suggests that China's economic growth in Q1 2020 should come in at around 3.2%. Chinese stocks passively outperformed global benchmarks in the last two weeks. The likelihood of a stimulus overshoot in the next 6-12 months continues to rise, supporting our view that Chinese stocks will actively outperform global benchmark in the coming months. Cyclical stocks have significantly outperformed defensives lately. While this is consistent with our constructive view towards Chinese equities in general, the magnitude of a tech stock rally in the domestic market of late appears to be somewhat excessive. As such, investors should focus their sector exposure in favor of resources, industrials, and consumer discretionary. The depreciation in the RMB against the dollar will come primarily from a stronger dollar rather than a weaker RMB, and the downside in the value of the RMB should be limited. Feature Despite the past week’s plunge in global equities due to the threat of a worldwide COVID-19 pandemic, Chinese stocks have outperformed relative to global benchmarks. This underscores our view that epidemic risks within China are slowly abating, and China’s reflationary response to the crisis will likely overcompensate for the short-term economic shock. Tables 1 and 2 highlight key developments in China’s economy and its financial markets in the past month. On the growth front, both the February official and Caixin PMIs dropped to historic lows as a result of the virus outbreak and nationwide lockdown. On the other hand, economic data from January confirmed that pre-outbreak activity in China was on track to recovery. Daily data also suggests that production in China continues to resume. Moreover, monetary conditions have significantly loosened and fiscal supports have materially stepped up. Chinese equities in both onshore and offshore markets dropped by 2% and 7% respectively (in absolute terms) from their January 13 peaks. Nevertheless, they have both significantly outperformed global equities, particularly in the past week. Equally-weighted cyclical stocks versus defensives in the onshore market have also moved up sharply, driven by a rally in the technology sector stocks. While the outperformance of cyclical stocks is consistent with our constructive view towards Chinese stocks, the magnitude appears to be excessive. Thus, we would advise investors positioning for a cyclical recovery in China to favor exposure in resources, industrials and consumer discretionary stocks. Table 1China Macro Data Summary
China Macro And Market Review
China Macro And Market Review
Table 2China Financial Market Performance Summary
China Macro And Market Review
China Macro And Market Review
In reference to Tables 1 and 2, we have a number of observations concerning developments in China’s macro and financial market data: Chart 1Inventory And Production Shortages Are A Bigger Near-Term Concern Than Weaknesses In Demand
Inventory And Production Shortages Are A Bigger Near-Term Concern Than Weaknesses In Demand
Inventory And Production Shortages Are A Bigger Near-Term Concern Than Weaknesses In Demand
February’s drop in the official PMI below 40% is reminiscent of November 2008, which was the height of the global financial crisis. The raw material inventory sub-index of the PMI in February fell to a record low, a clear indication of strain in China’s manufacturing sector. While the finished goods inventory sub-index ticked up slightly compared with January, factories will likely run out of existing raw materials to produce goods if transportation logistics do not return to normal soon (Chart 1). A higher number in the new orders sub-index relative to production output also suggests the pressure on the supply side will intensify if the virus outbreak in China worsens and continues to disrupt manufacturing activities. This will in turn undermine the effectiveness of Chinese policy response. Daily data from various sources suggests Chinese industrial activities continue to pick up. Between February 10 (the first official return-to-work day after an extended Chinese New Year holiday) and February 25 (the cutoff date for responding to PMI surveys), daily coal consumption in China’s six largest power plants was only about 60% of consumption compared from the same period last year (adjusted for the Lunar Year calendar). This is in line with the 35.7 reading in February’s manufacturing PMI, versus 49.2 a year ago. In the last four days of February, however, coal consumption reached nearly 70% of last year’s consumption. This figure is in keeping with a 10 percentage point increase in the rate of work resumption of enterprises above-designated size in China’s coastal regions.1 If energy consumption and work resumption rates reach about 90% by the end of March compared with Q1 2019, then PMI in March should pick up to 45% or higher. A 45% or higher reading in March’s PMI will imply economic impact from the virus outbreak is mostly limited to February. A simple calculation using China’s GDP growth in Q4 2008 as a template suggests that China's economic growth in Q1 2020 should come in at around 3.2% in real terms. This is in line with the estimate from BCA's Global Investment Strategy service.2 As we pointed out in November last year,3 China is frontloading additional fiscal stimulus in Q1 2020 to secure the economic recovery, which started to bud prior to the virus outbreak. The increase in January’s credit numbers confirms our projection. The monthly flow in total social financing in January (with only three work weeks effectively) reached above RMB 5 trillion. This figure exceeded that in January 2019, the highest monthly credit number last year. Local government bond issuance in January was almost double that a year ago, and a total of 1.2 trillion local government bonds were issued in the first two months of this year - a 53% jump from the same period last year. This suggests that fiscal stimulus has indeed stepped up in 2020. Money supply in January was slightly distorted by the earlier Chinese New Year (it fell in January this year instead of February as in most years) and the COVID-19 outbreak. M1 registered zero growth from a year ago, whereas it grew by 0.4% in January 2019.4 Normally, during the month of the Chinese New Year, households have more cash in deposits whereas corporations have less as they pay pre-holiday bonuses to employees. This seasonality factor causes the growth rate in M0 to rise and M1 growth to fall. The seasonality was exacerbated by the nationwide lockdown on January 20 this year, as many real estate developers reportedly suffered from a significant reduction in home sales and delays in deposits for down payments. Household consumption in the service sector during the Chinese New Year was also severely suppressed. This explains near-zero growth in M1 and a larger-than-expected increase in household deposits in January (Chart 2). We expect the growth in both M0 and M1 to start normalizing in March, as production and household consumption continue to resume. While we do not expect large fluctuations in housing prices, we think growth in home sales may accelerate from Q2 2020. There are early signs that the government is starting to relax restrictions on the real estate sector, on a region by region basis. Land sales remain a major source of local governments’ income, accounting for more than half of total revenues as of last year. Chart 3 shows that as government expenditures lead land sales, a major increase in fiscal stimulus and local government spending means that a significant bump in land sales will be needed in 2020. A strengthening supply of land, coupled with the unlikelihood of large fluctuations in property prices, suggests that there will be more policy supports to the real estate sector and more incentives to boost housing demand. Chart 2Corporates Are Short On Cash
Corporates Are Short On Cash
Corporates Are Short On Cash
Chart 3Land And Home Sales Likely To Pick Up In 2020
Land And Home Sales Likely To Pick Up In 2020
Land And Home Sales Likely To Pick Up In 2020
In the past two weeks, China’s equity market has registered a near-vertical outperformance in both investable and domestic stocks relative to global benchmarks (Chart 4). While this recent outperformance was passive in nature, our policy assessment supports future active outperformance. The recently announced pro-growth policy initiatives increasingly resemble those rolled out at the start of the last easing cycle in 2015/2016. These policy initiatives increase the odds that the upcoming “insurance stimulus” will overcompensate for the short-term economic shock, and will likely lead to a significant rebound in corporate profits in the next 6-12 months. This supports our bullish view on Chinese stocks. Chart 5 also shows that, unlike during the 2015’s “bubble and bust” cycle, both the valuation and margin trading as a percentage of total market cap in China’s onshore market remain materially lower than 2015. Equally-weighted cyclical sectors continue to outperform defensives in both China’s investable and domestic markets, particularly the latter where stock prices in the technology sector were up 12% within the past month. While the outperformance of cyclical stocks relative to defensives is consistent with our constructive view towards Chinese equities in general, the magnitude appears to be somewhat excessive. Given this, we would advise investors positioning for a cyclical recovery in China’s economy to focus their sector exposure in favor of resources, industrials, and consumer discretionary stocks. Chart 4Chinese Stocks Strongly Outperformed Global Benchmarks Over The Past Two Weeks
Chinese Stocks Strongly Outperformed Global Benchmarks Over The Past Two Weeks
Chinese Stocks Strongly Outperformed Global Benchmarks Over The Past Two Weeks
Chart 5Onshore Market Trading Does Not Seem Overly Leveraged
Onshore Market Trading Does Not Seem Overly Leveraged
Onshore Market Trading Does Not Seem Overly Leveraged
China’s three-month repo rate (the de facto policy rate) has fallen significantly in the past month, roughly 30bps below its lowest level in 2016 (Chart 6). China’s government bond yields have also reached their lowest level since 2016. While corporate bond yield spreads in other major economies have picked up sharply in the past month, the reverse is happening in China. This suggests that the market is pricing in further easing and the notion that policy supports will be effective in preventing a surge in corporate bond default rate. From a global perspective, yield spreads on China’s onshore corporate bonds have been elevated since 2016. This indicates that investors have long either priced in a much higher default rate among Chinese corporate bond issuers, or demand an unjustifiably large risk premium (Chart 7). Since we expect Chinese policymakers to continue easing, risks of a surge in China’s corporate bond default rate remain low this year. As such, until we see signs that the Chinese authorities are reverting to a financial de-risking mode, we will continue to favor onshore corporate versus duration-matched government bonds. Chart 6Monetary Policy Now More Accommodative Than 2015-2016
Monetary Policy Now More Accommodative Than 2015-2016
Monetary Policy Now More Accommodative Than 2015-2016
Chart 7Chinese Corporates Pay High Risk Premium For Their Bonds, Even At A Relatively Low Default Rate
Chinese Corporates Pay High Risk Premium For Their Bonds, Even At A Relatively Low Default Rate
Chinese Corporates Pay High Risk Premium For Their Bonds, Even At A Relatively Low Default Rate
Chart 8The RMB Likely To Continue Outperforming Other EM Currencies
The RMB Likely To Continue Outperforming Other EM Currencies
The RMB Likely To Continue Outperforming Other EM Currencies
As we go to press, the Federal Reserve Bank has just made a 50bps cut to the Fed rate, the first emergency cut since the global financial crisis. The USD weakened against the Euro, the Japanese Yen, as well as the RMB immediately following the rate cut. While this reflects the market’s concerns of a worsening virus outbreak and the rising possibility of an economic slowdown in the US, the USD as a countercyclical currency will likely appreciate against most cyclical currencies as the virus continues spreading globally. Hence, the depreciation in the RMB against the dollar will come primarily from a stronger dollar rather than a weaker RMB, and the downside in the value of the RMB should be limited. The continuation of resuming production in China and the expectations of a Chinese economic recovery in Q2 will support an appreciation in the RMB against other EM currencies (Chart 8). Qingyun Xu, CFA Senior Analyst qingyunx@bcaresearch.com Jing Sima China Strategist jings@bcaresearch.com Footnotes 1 http://app.21jingji.com/html/2020yiqing_fgfc/ 2 Please see Global Investment Strategy Weekly Report "Markets Too Complacent About The Coronavirus," dated February 21, 2020, available at gis.bcaresearch.com 3 Please see China Investment Strategy Weekly Report "Questions From The Road: Timing The Turn," dated November 20, 2020, available at gis.bcaresearch.com 4 M1 is mainly made up by cash demand deposits from corporations, whereas M0 is mainly deposits from households Cyclical Investment Stance Equity Sector Recommendations