Earnings
Disparities between households and between companies’ earnings and equity performance are widening, but the overall status quo remains in place. We reiterate our neutral asset class recommendations while watching for early signs of whether activity might break out or break down.
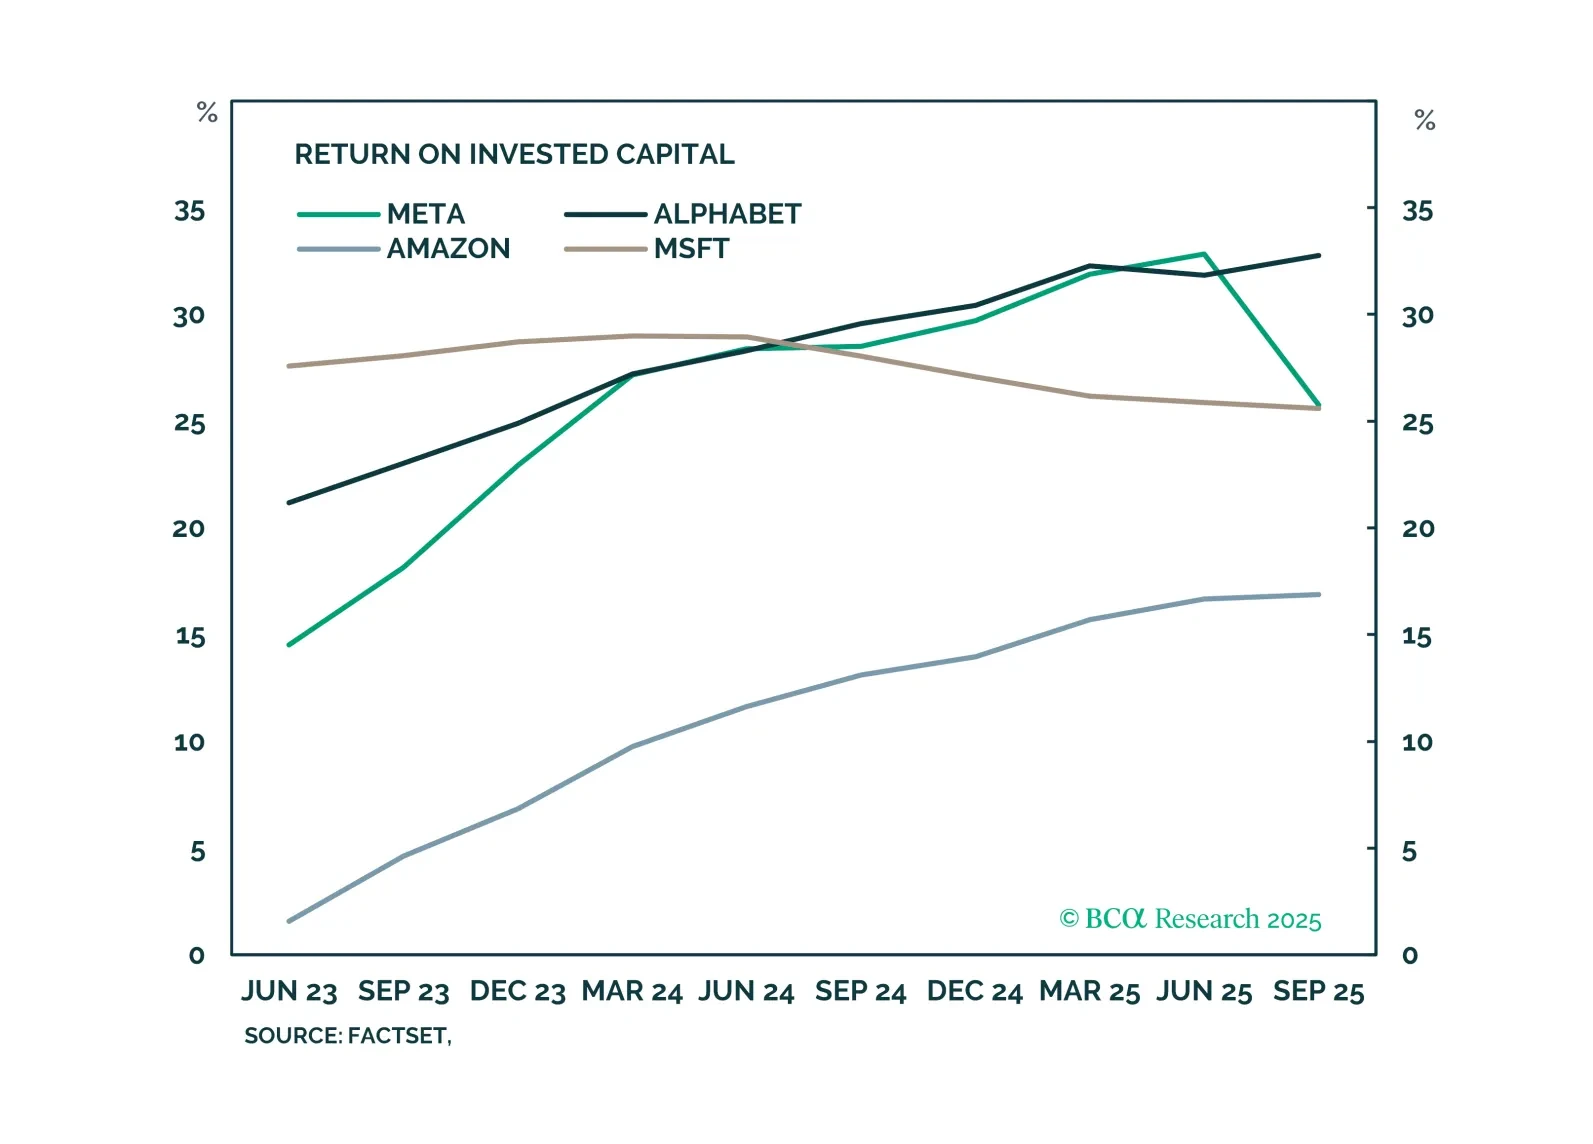
Investor reaction to Meta’s GenAI is an admonition against overspending, rather than a sign of a fraying GenAI rally. Other hyperscalers’ investments are driven by buoyant demand and remain profitable. With valuations stretched and many of the positives priced in, market consolidation is likely. We are decreasing portfolio beta.
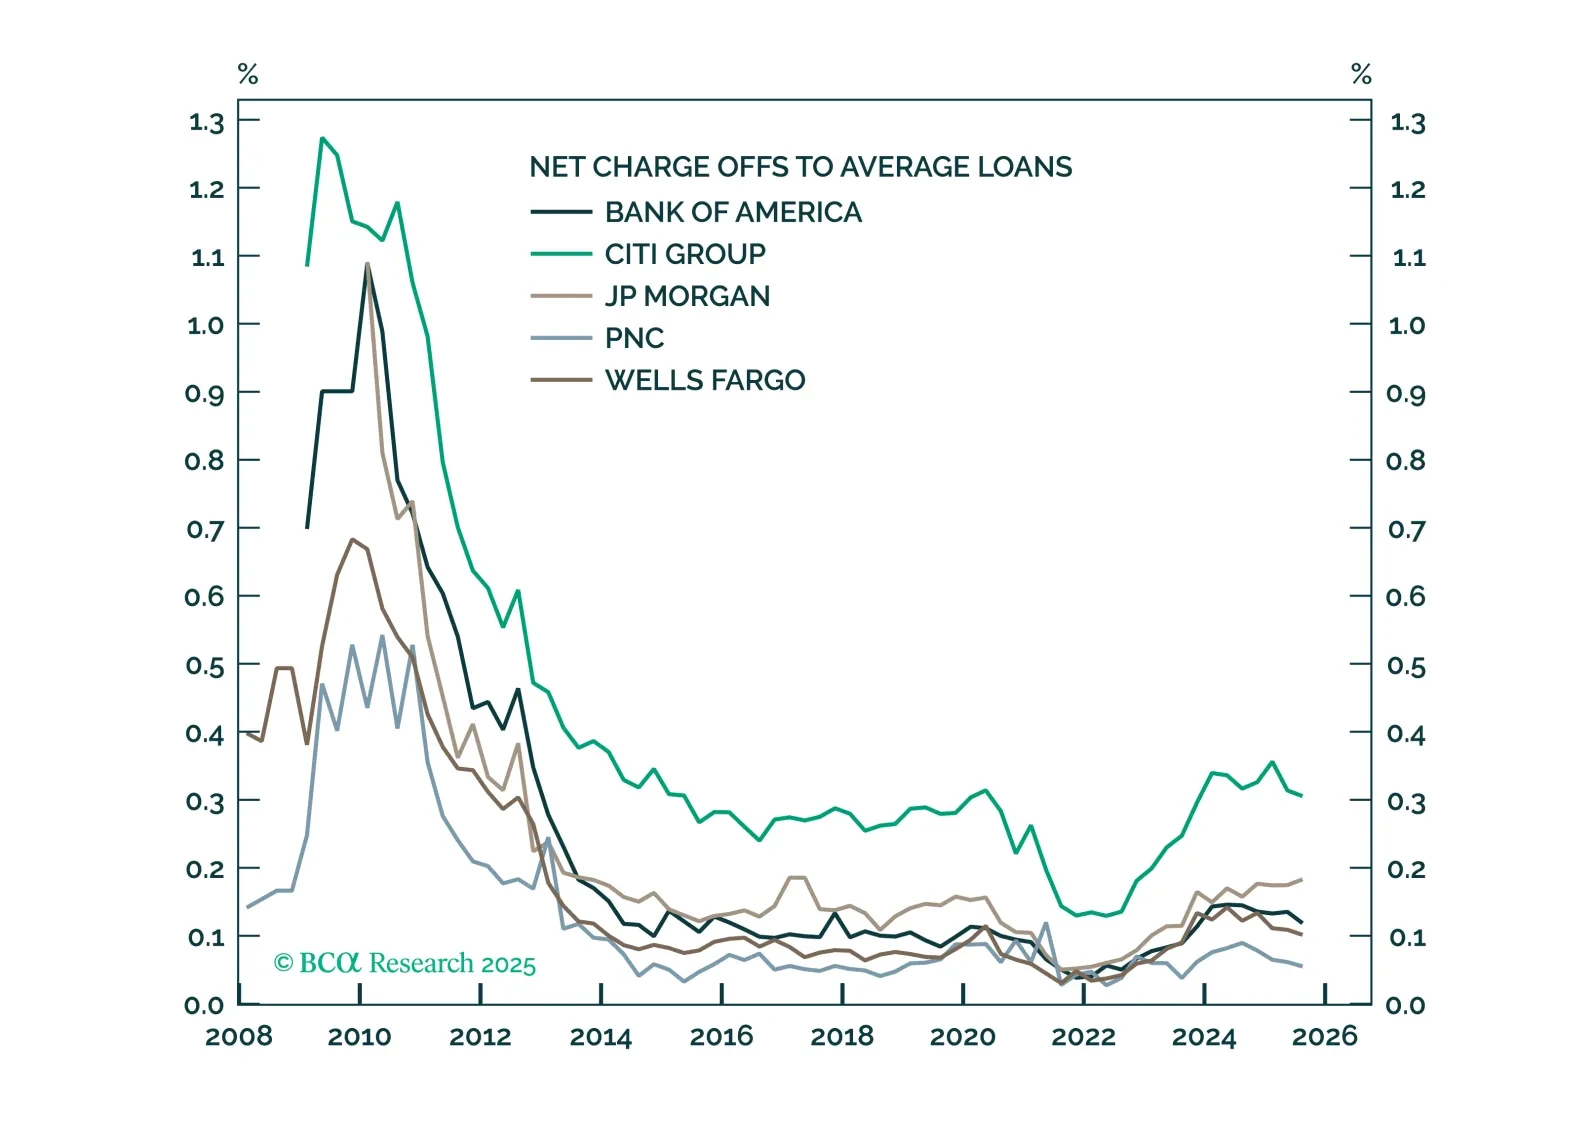
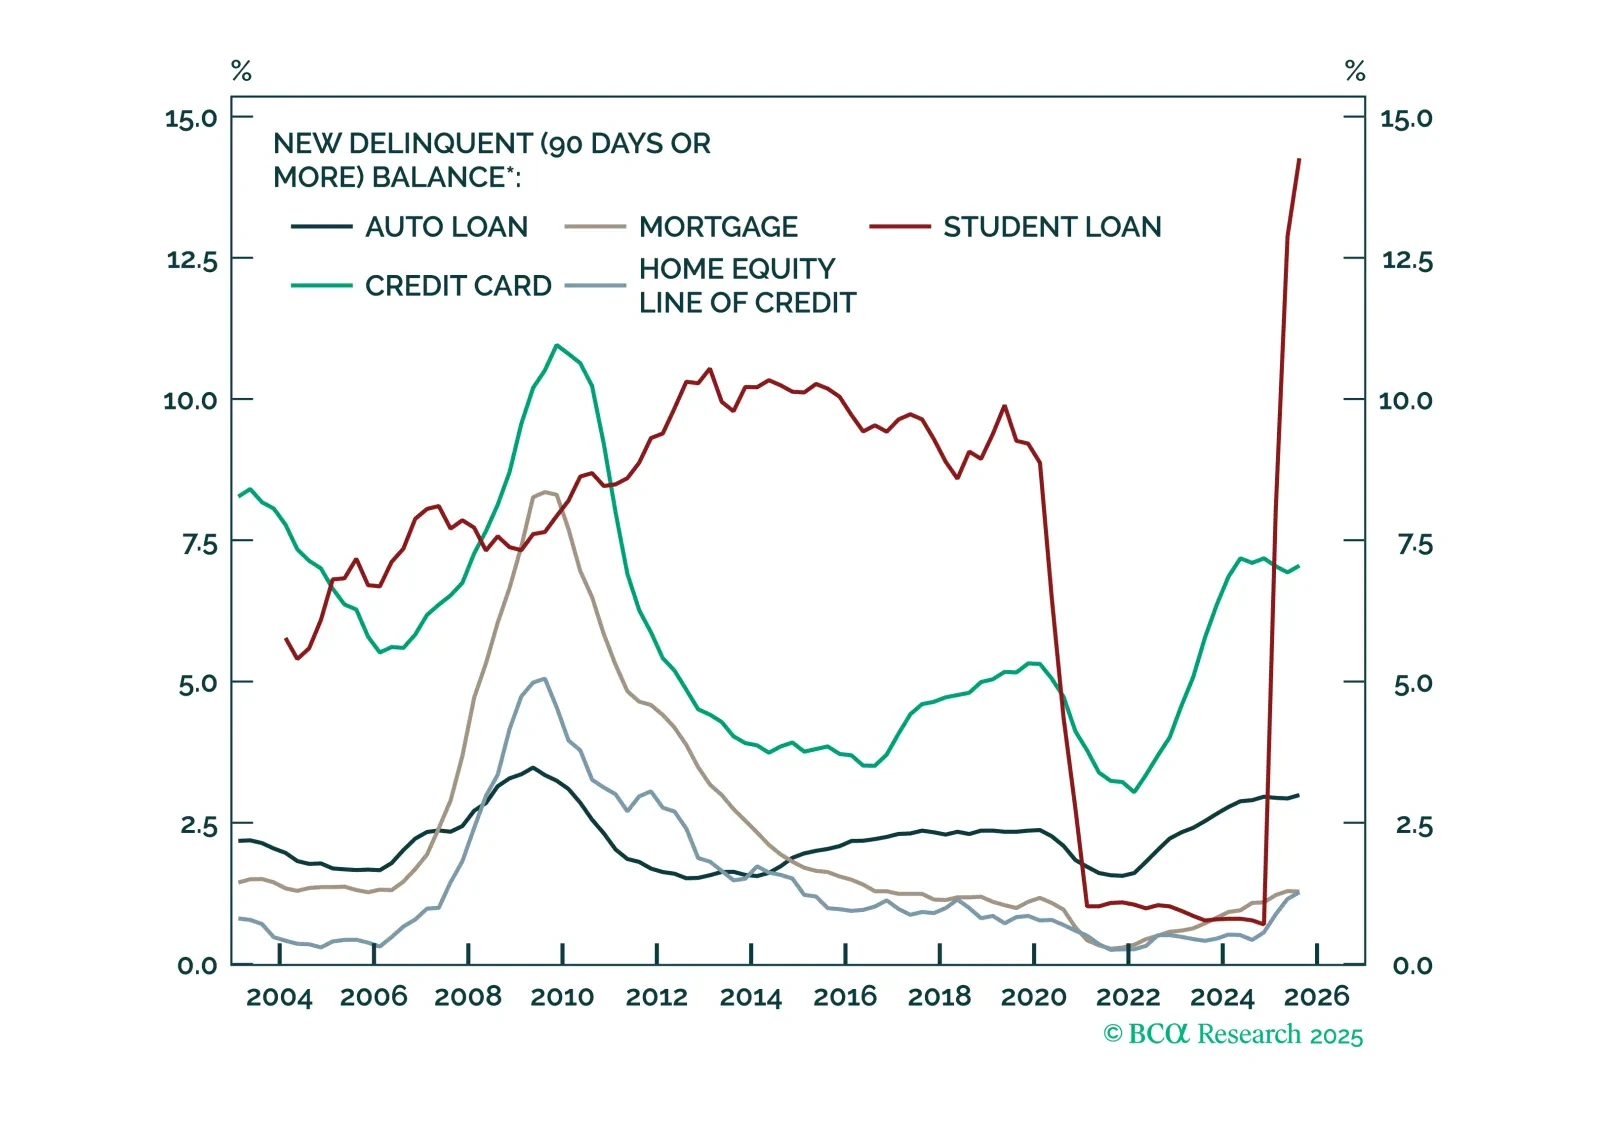
Strong results and constructive commentary from the US’s largest banks are encouraging: Consumers remain in solid shape, and the macro backdrop continues to favor equities. The outlook for the largest banks is positive, and they are unlikely to be affected by isolated credit events.

GenAI momentum is building. Many companies are already reaping benefits from the technology. GenAI is disrupting entire industries, such as education, image generation, and staffing. Investors should prefer our “disruptors” basket over the “disrupted” basket.
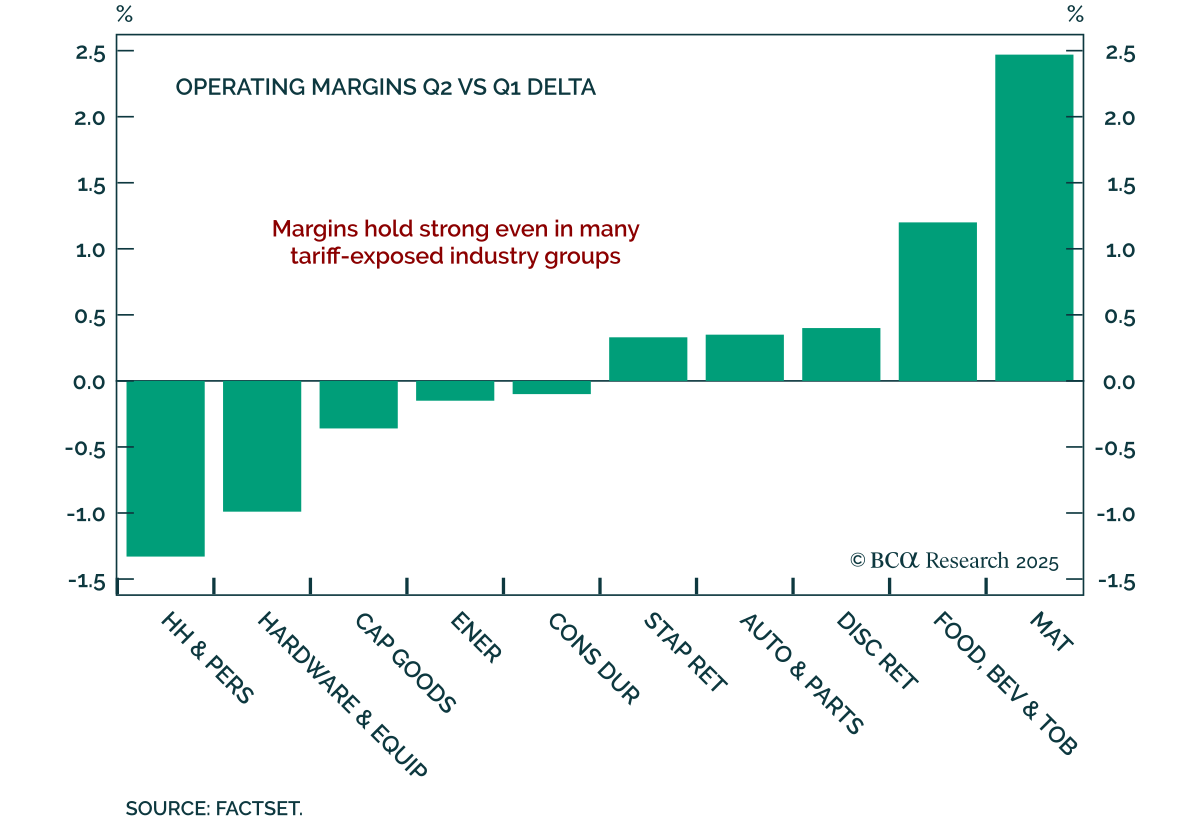
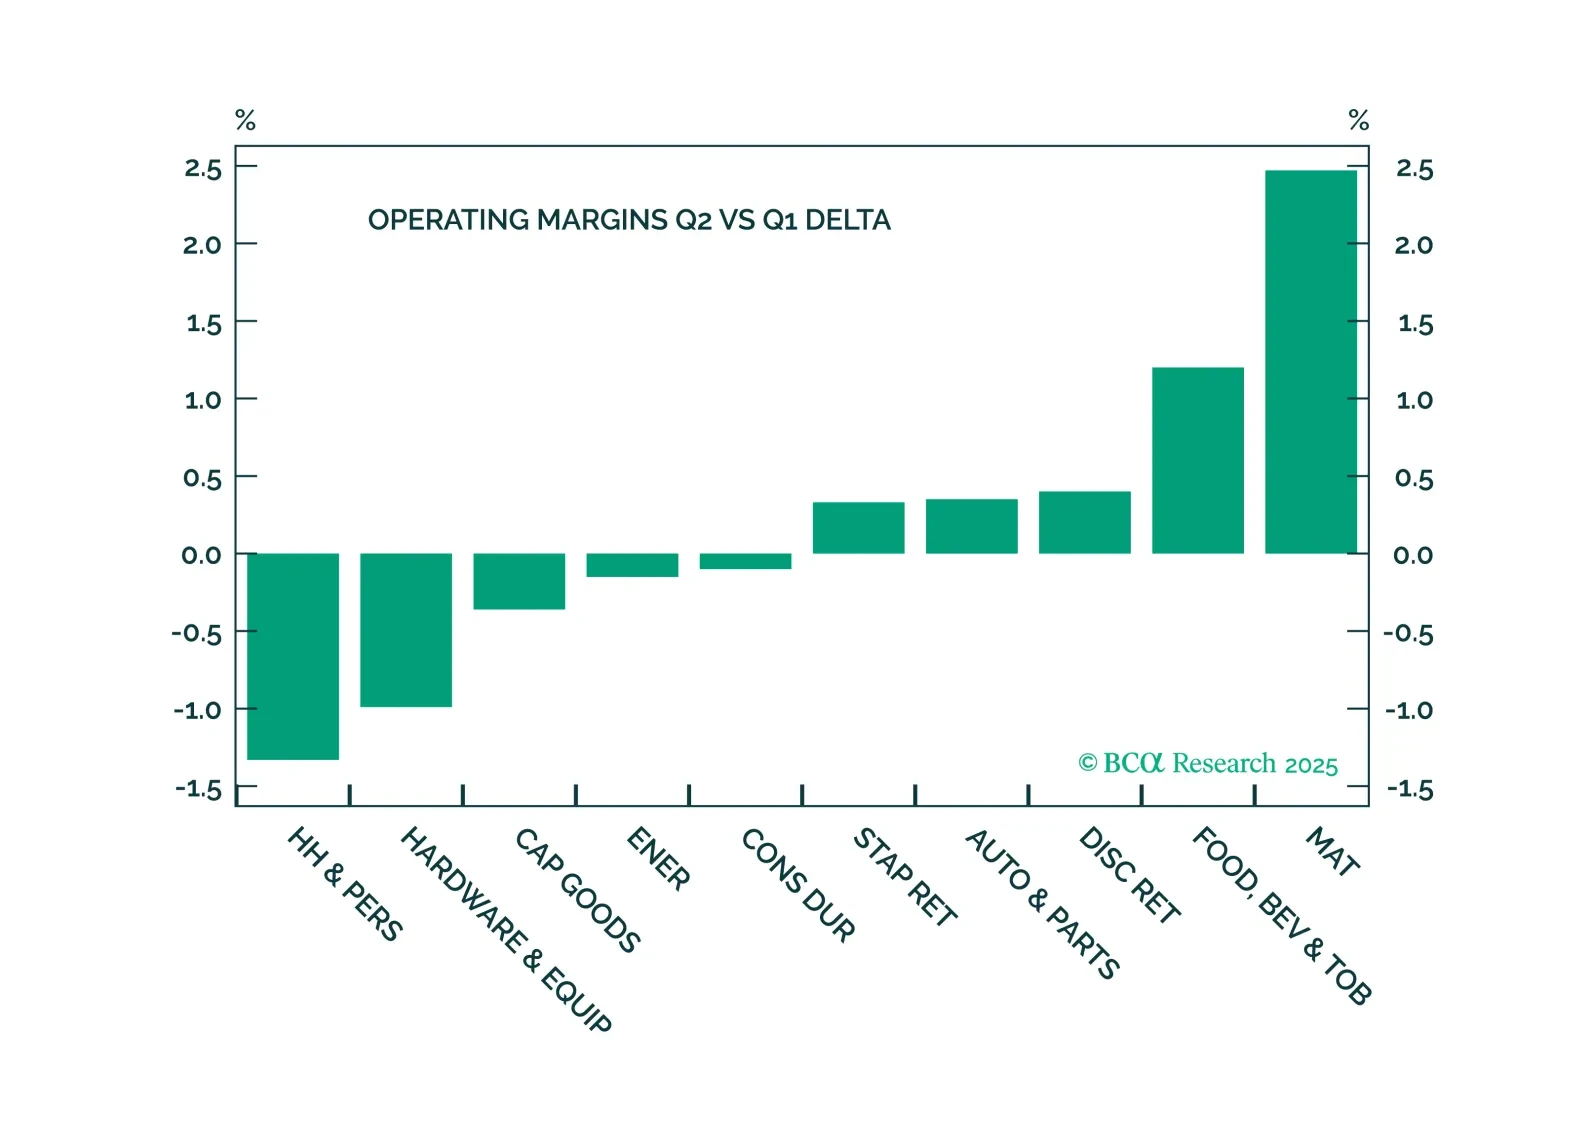
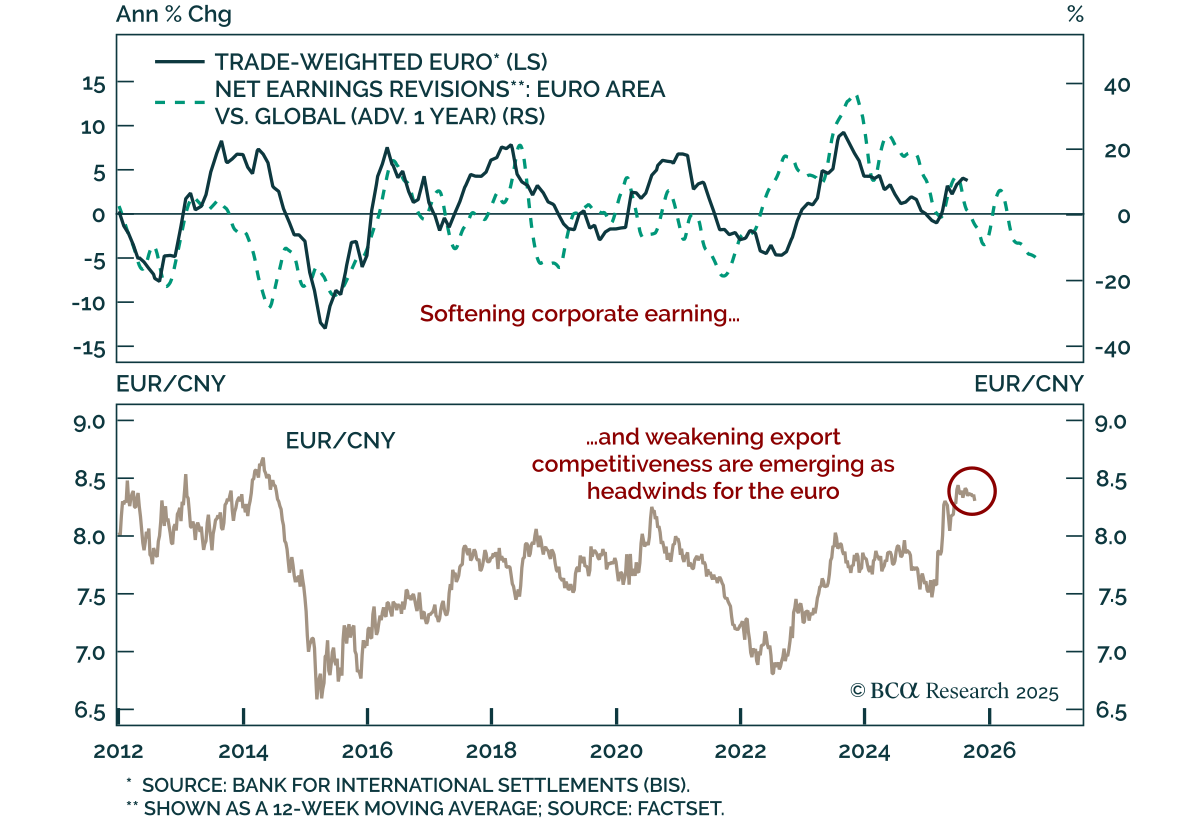
The Q2 earnings season delivered solid earnings and sales growth and resilient margins, reassuring investors that corporate America remains in good health and is capable of navigating economic uncertainty while mitigating the impact of new trade levies. The outlook is generally positive, but with one important caveat: The full effect of tariffs has yet to materialize.
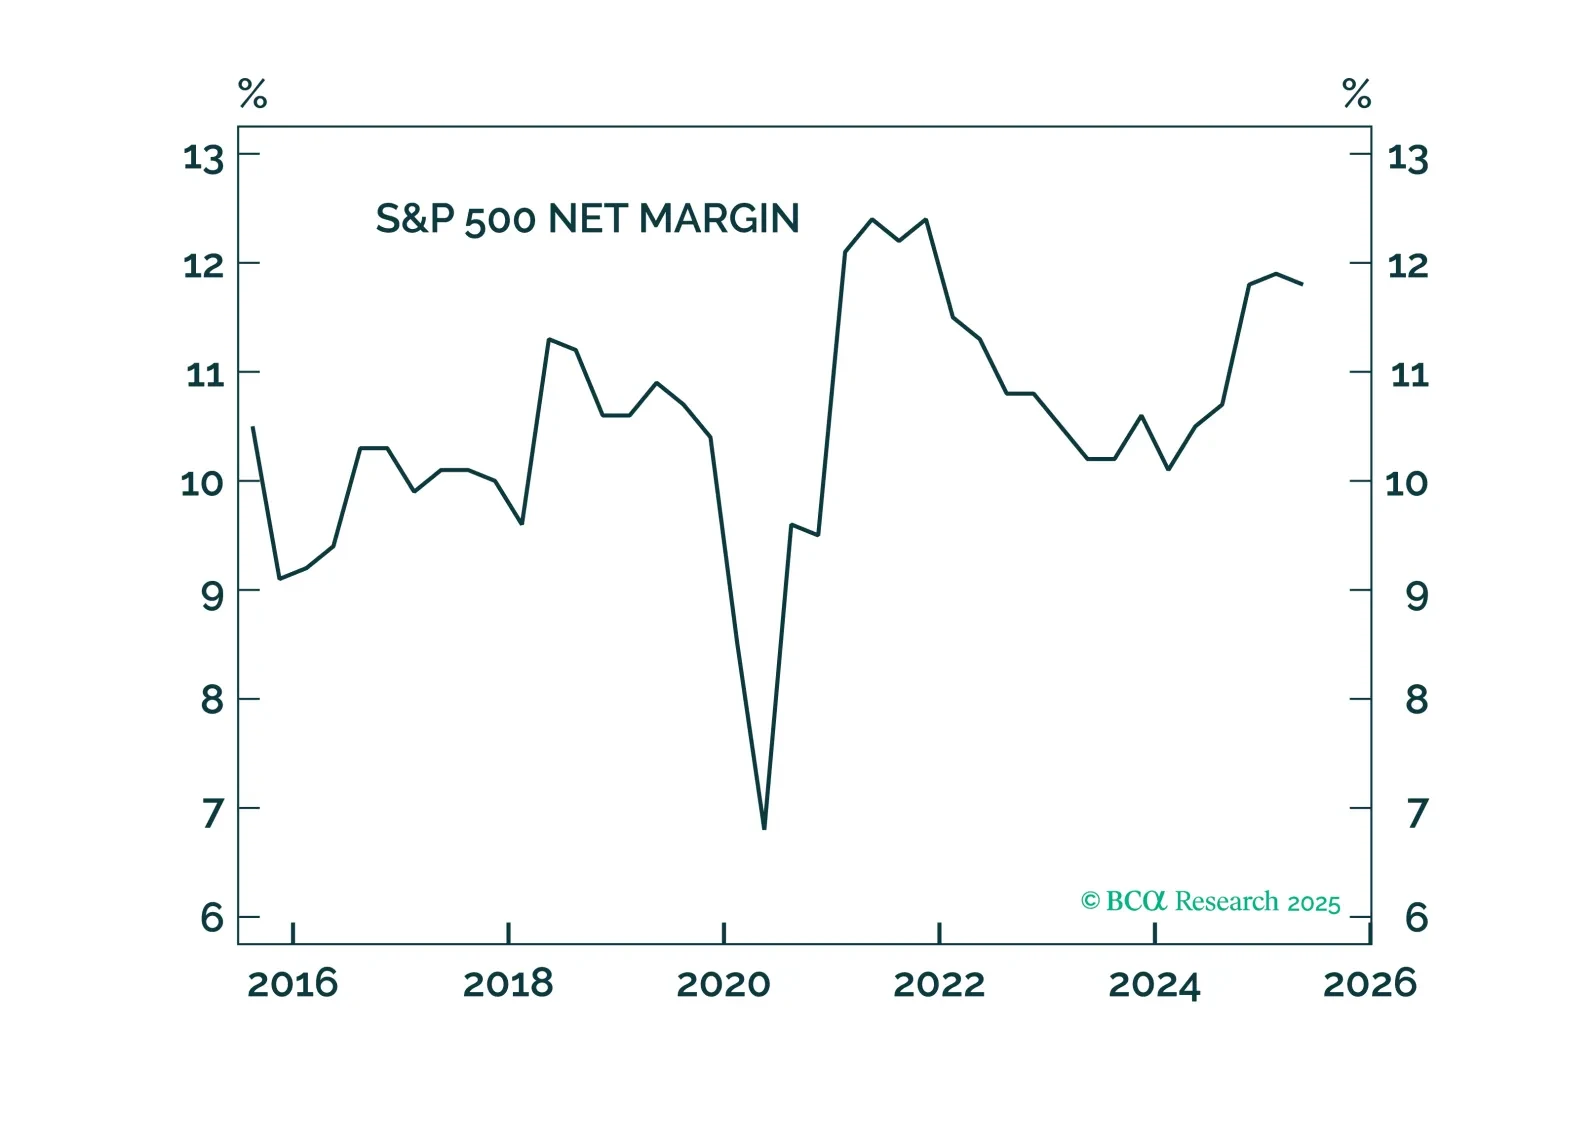
The Q2 reporting season underscores the resilience of corporate earnings, supporting our bullish outlook for equities, an outlook further bolstered by expectations of fiscal and monetary easing. However, for now, we are booking profits, closing overweights in Technology and Growth, and initiating a new overweight in Real Estate.
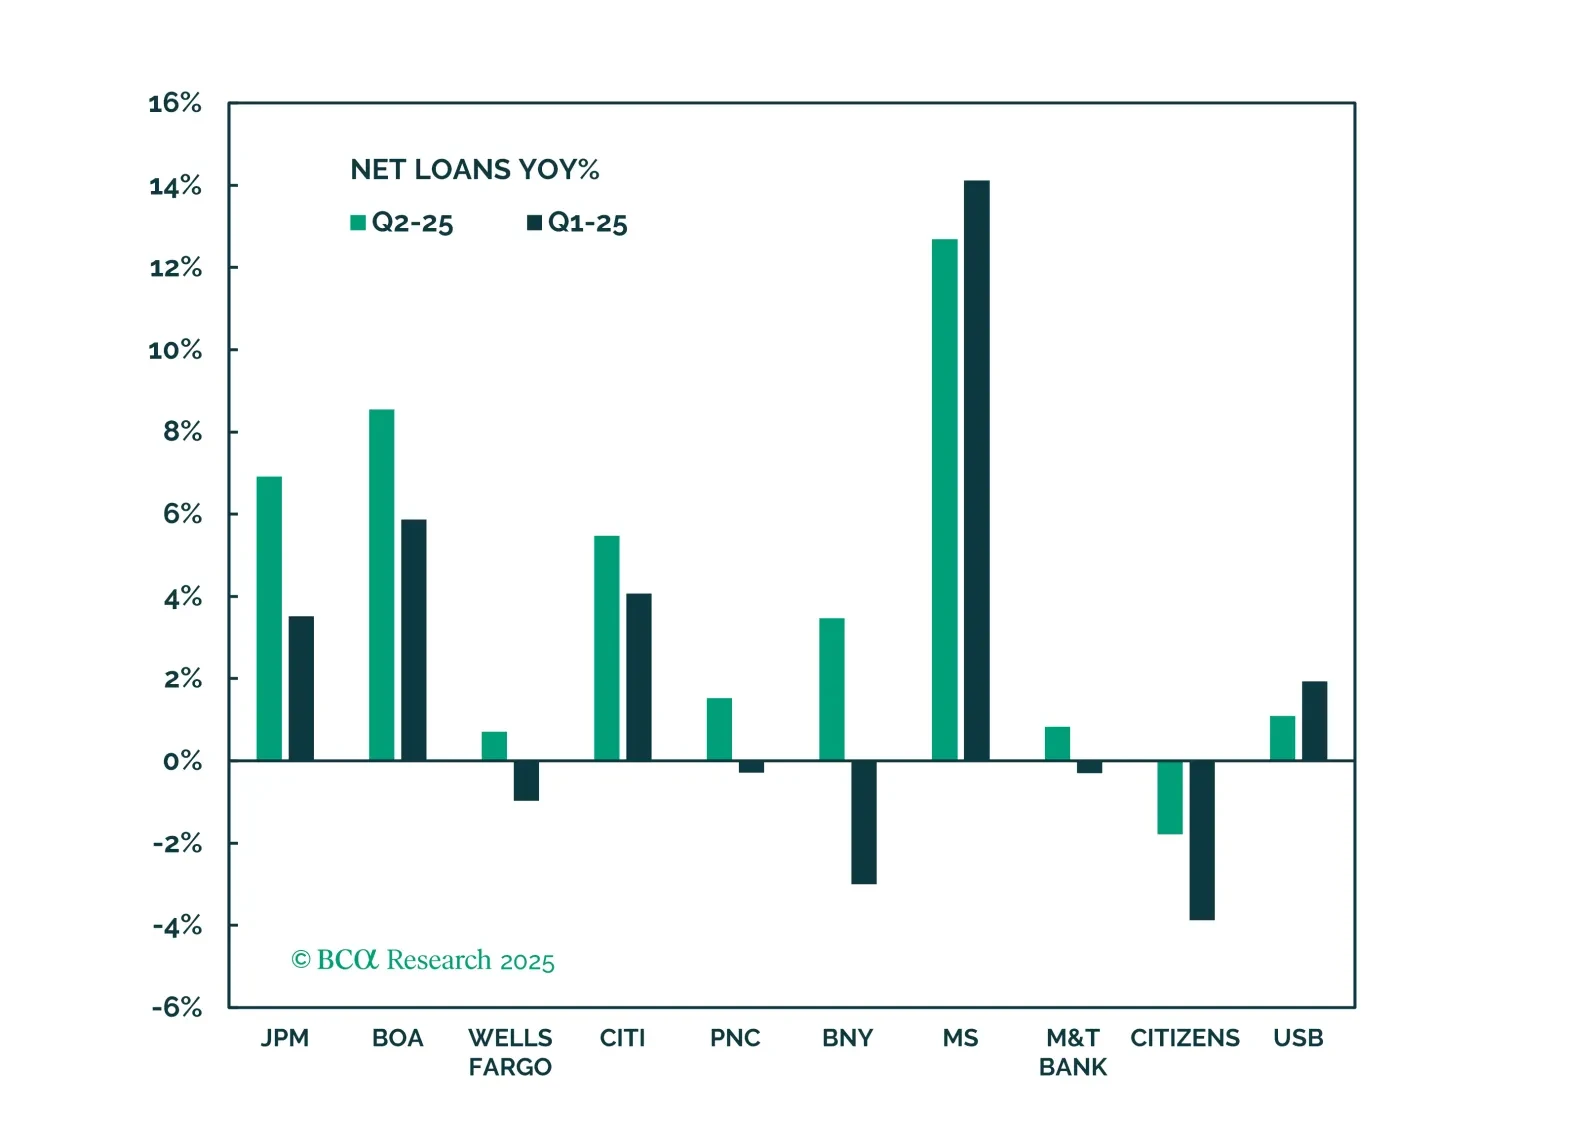
Banks have had a strong run and may continue to outperform, supported by a rebound in capital market activity, improving momentum in the core banking business, and the potential for rerating driven by deregulation. While risks remain, we remain cautiously optimistic.