Economic Growth

Executive Summary Caught In Risk-Off Selling
Copper Testing Support
Copper Testing Support
Weak Chinese and European economies are suppressing copper demand and helping to temper prices in a market that remains fundamentally tight. Weaker US GDP growth could put the three largest economies in the world in or close to recession in 2H22/1H23, which would contribute to demand-side weakness in copper markets. The odds manufacturing and base-metals refining will be curtailed in Europe are rising. Although a strike in Norway has been averted by government intervention, maintenance on Russia’s Nord Stream 1 pipeline scheduled to begin next week likely will serve as a pretext for longer and deeper natgas supply cuts to the EU. Bottom Line: Despite fundamental tightness in global copper markets, prices are being restrained by fears weaker Chinese and European economic performance will lead to a global recession. Early reads of US GDP pointing to negative growth in 2Q22 stoke these fears. Heightened economic policy uncertainty globally exacerbates them. We remain fundamentally bullish copper and will re-establish our long SPDR S&P Metals & Mining ETF (XME) – down ~ 40% from its highs in April – at tonight’s close. In addition, we went long the XOP oil and gas ETF at Tuesday’s close, after prompt Brent breached the buy-trigger we set last week of $105/bbl during this week’s crude-oil sell-off. Feature Lower GDP growth expectations in China and the EU – along with a wobbly US economy being flagged by an Atlanta Fed GDPNow forecast pointing to negative growth in 2Q22 – are stoking fears of a global manufacturing and industrial recession. This prompted a rout in industrial commodities – base metals and oil – this week, which still has markets on edge. This slow-down in the world’s three largest economies – accounting for almost 50% of global GDP expressed in purchasing-power terms – is the only thing keeping the level of global copper demand close to supply at present (Chart 1).1 At least for the time being, this is keeping the threat of sharply higher copper prices, which would be more in line with the low levels of supplies and inventories globally, at bay (Chart 2). As of the week ended May 27th, global copper stocks stood at just above 562k tons, which is ~ 31% lower y/y. Chart 1World’s Biggest Economies Slowing
Copper Prices Decouple From Fundamentals
Copper Prices Decouple From Fundamentals
Chart 2Copper Prices Disconnect From Fundamentals
Copper Prices Disconnect From Fundamentals
Copper Prices Disconnect From Fundamentals
Uncertainty Weakens Copper Prices Energy and metals markets remain extremely tight on a fundamental supply-demand basis.2 The sharp sell-off this week in oil and metals prices is, in our view, evidence industrial-commodity prices have decoupled from fundamentals. This makes traders – hedgers and speculators – extremely risk-averse, which reduces liquidity and increases volatility. On the back of these concerns, markets exhibit the sort of volatility associated with economic collapse, despite still-strong underlying fundamentals. Chart 3Rising Global Policy Uncertainty
Copper Prices Decouple From Fundamentals
Copper Prices Decouple From Fundamentals
Volatility is on the rise due to increasing economic uncertainty in these markets. This makes it extremely difficult to assign probabilities to different price outcomes (i.e., true uncertainty). The BBD Global Economic Policy Uncertainty is approaching levels seen during the early pandemic (Chart 3). We put this rising uncertainty down to poor policy and communication from central banks and governments; a pig’s breakfast of energy policy globally that increasingly adds nothing but confusion to markets; and a muddled public-health policy in China, which produces random shut-downs in global supply chains as covid infections randomly crop up in important port cities. Lastly, the East and West are moving toward a new Cold War, which already is having profound effects on all markets, trade flows and capital availability in the short- and medium-term. This keeps markets on edge and forces them to parse every geopolitical development that hits the tape.3 Re-forging supply chains, re-building basic industrial infrastructure as the West moves away from outsourcing to China and other EM states will be costly and volatile, especially as embargoes and sanctions increase between these blocs. This political and economic evolution will require increased investment in base metals production and exploration, along with similar commitments to oil and gas. Low and volatile prices will not support this, as they disincentivize investment, and set markets up for continued shortage and scarcity going forward. In the metals markets, years of underinvestment by major mining companies will keep copper supplies and inventories tight going forward (Chart 4). This will hinder and delay the global renewable-energy transition, which cannot be realized without higher base-metals supplies. Chart 4Structural Underinvestment In Mining Fundamentally Bullish Copper
Copper Prices Decouple From Fundamentals
Copper Prices Decouple From Fundamentals
Recession Fears Haunt Metals Globally … The proximate causes of the persistent weakening of copper prices is the demand destruction arising from the lockdown in China, and an increasing concern over the economic prospects of the EU as it prepares for a possible shut-off of Russian natgas exports. Should Russian supplies be cut off, the EU will be pushed into recession as natural-gas rationing – and the attendant prioritization of human needs going into winter – will constrict economic activity, particularly in manufacturing. This leaves two of the three largest economies in the world either in recession or not growing at all. Added to this is the fear of a wobbly US economy, which has been slowed by higher energy prices and the Fed’s hawkish tightening of monetary policy. The Atlanta Fed’s GDPNow forecast for 2Q22 estimates a 2.1% contraction in US GDP. This would be the second consecutive quarter of negative growth and would meet a widely held rule-of-thumb indicator or recession.4 In our modelling, we estimate the income elasticity of copper demand in DM economies like the EU and US (1.39) and EM-ex-China (0.87) states is higher than that of China (0.37). This means that a 1% contraction in p.a. Chinese real GDP would translate to a 0.37% p.a. fall in copper demand, all else equal. A contraction of real incomes – i.e., real GDP – in the EU and EM-ex-China will cause a larger relative adjustment in copper demand than in China, even though the level of copper demand in China is far greater in absolute terms (Chart 5). A recession in the EU will reduce import demand for China’s manufactured output in these markets (Chart 6). As China’s trade volumes fall, Chinese manufacturing PMIs will contract. Similarly, exports to China from the EU will weaken as manufacturing weakens and real GDP moves lower. We believe this will put more pressure on the Chinese government to provide fiscal and monetary stimulus to counter such a downdraft. Chart 5Copper Demand Sensitive to Real GDP (Income)
Copper Demand Sensitive to Real GDP (Income)
Copper Demand Sensitive to Real GDP (Income)
Chart 6Trade Channel Effects Follow GDP Weakness
Trade Channel Effects Follow GDP Weakness
Trade Channel Effects Follow GDP Weakness
… But China Worries Dominate The Chinese economy is showing signs of further slowing.5 Weakness in credit levels, infrastructure investment, manufacturing, the property sector, and exports all indicate the covid-policy lockdowns, high commodity prices, and parsimonious credit and fiscal policies have produced a dramatic slowing in economic activity. In our modelling, we find evidence that each of these components exhibits a long-run inverse relationship with Chinese copper inventories, which in turn exhibits a long-run inverse relationship with COMEX copper prices. Roughly 10 days after the initial Shanghai lockdown, copper prices went into contango (Chart 7). This occurred despite continuous declines in Chinese copper inventories during the lockdown months (Chart 8). Such anomalous behavior – i.e., as inventories fall markets become more backwardated – makes it difficult to connect prices and supply-demand-inventory fundamentals. Chart 7Copper In Contango For Most Of China’s Lockdown
Copper In Contango For Most Of Chinas Lockdown
Copper In Contango For Most Of Chinas Lockdown
Chart 8Chinese Copper Inventories Continue To Draw In Lockdown
Chinese Copper Inventories Continue To Draw In Lockdown
Chinese Copper Inventories Continue To Draw In Lockdown
BCA’s China Investment Strategy expects a muted 2H22 recovery for the Chinese economy. Rolling lockdowns due to China’s COVID policy will reduce the potency of fiscal and monetary stimulus. The stop-start nature of economic activity will stymie growth in disposable income and job creation, which in turn will translate to weaker aggregate demand. The knock-on effect of weaker business activity due to the lockdown earlier this year has been a higher propensity to save by households (Chart 9). Household surveys conducted by the PBoC show that, since 2017, household savings have been increasing, suggesting a precautionary sentiment (Chart 10). Chart 9Chinese Economic Slowdown Reduced Credit Demand
Chinese Economic Slowdown Reduced Credit Demand
Chinese Economic Slowdown Reduced Credit Demand
Chart 10Rising Precautionary Savings...
Rising Precautionary Savings...
Rising Precautionary Savings...
Chart 11...Will Impact Domestic Property Market
...Will Impact Domestic Property Market
...Will Impact Domestic Property Market
We do not expect the property market to recover in a manner similar to what occurred following China’s re-opening after the first wave of the COVID-19 pandemic. Depressed household purchasing power will keep housing demand subdued, while the “three red lines” policy, which limits the amount property developers can borrow, will keep supply low (Chart 11).6 Housing accounts for ~ 30% of copper consumption in China, which means weak property markets will remain a drag on copper demand. Investment Implications Continued weakness in China’s economy and a potentially deep recession in the EU will continue to restrain demand for copper globally. In addition, with the US economy looking wobbly, the third global pillar of economic strength also will be weakening going into 2H22. These fundamental demand-side effects will lower pressure on tight copper inventories and keep prices subdued, in our view. This does not, however, signal an all-clear for copper supply or inventory tightness. Weaker demand is the only thing keeping prices from rising sharply, given the tight supply and inventory position of global copper markets. On the supply side, governance issues in copper-rich Latin American states, which are in the process of revising their social contracts with copper producers and consumers, will increase mining costs for companies, disincentivizing long-term and large-scale investments in new mines.7 These costs ultimately will be borne by consumers as supply shortages mount and the need to increase capex grows. Ultimately, this will feed into longer-term inflation and inflation expectations. Chart 12Caught In Risk-Off Selling
Copper Testing Support
Copper Testing Support
We remain long-term bullish copper, as fundamentals remain tight and will get tighter. That said, over the short term, aggregate-demand weakness in the three major economic pillars in the world makes us leery of getting long copper futures, particularly as prompt COMEX prices test support (Chart 12). Persistently weak copper prices will disincentivize the needed investment in new supply the world will need to effect a transition to renewable energy in coming decades. For this reason, we are comfortable re-establishing our long XME metals and mining ETF at tonight’s close, as copper prices are down 40% from their April highs. Robert P. Ryan Chief Commodity & Energy Strategist rryan@bcaresearch.com Ashwin Shyam Research Analyst Commodity & Energy Strategy ashwin.shyam@bcaresearch.com Paula Struk Research Associate Commodity & Energy Strategy paula.struk@bcaresearch.com Commodity Round-Up Energy: Bullish. A strike by Norwegian energy-sector workers that would have hit the natural gas market in Europe particularly hard was averted earlier this week.8 This still leaves the EU and UK (Europe) at risk of additional losses of Russian natgas exports beginning next week when Nord Stream 1 (NS1) maintenance is due to start. These threats have pushed Dutch Title Transfer Facility (TTF) natural gas prices up close to 93% since 1 June, and close to 400% y/y as of Tuesday. For the first five months of this year, Europe’s been importing just under 15 Bcf/d of LNG, with ~ 8.5 Bcf/d of those volumes coming from the US, based on EIA data. The EIA expects US LNG exports to average ~ 11.9 Bcf/d this year and 12 Bcf/d in 2023. Europe accounted for just under 75% of US exports in January – April of this year, and we expect that to continue going forward. The IEA expects Russia to supply 25% of EU demand this year, the lowest in 20 years. Last year, Russian imports covered ~ 40% (~ 7 TCF) of EU demand. Base Metals: Zinc stocks are depleted but prices are dropping on recession fears (Chart 13). Smelting operations were hit last year following the power-supply crunches in China and Europe. While China has recovered its energy security, Europe, which accounts for ~15% of global refined zinc supply, has not. Reduced natgas supply from Russia will make the smelting shortage in Europe even more acute, especially if power and fuel rationing occur. In April, China was a net exporter of zinc for the first time since 2014, as low demand in the state and low European zinc supply incentivized Chinese smelters to ship metal to the West despite high outbound tariffs. Precious Metals: Markets switched from inflation to growth fears, as central banks, notably the Fed began hiking interest rates aggressively to curb inflation. Investors have been flocking to the USD, which hit a 20-year high on recession fears this week (Chart 14). This has happened at the expense of the yellow metal, which, since breaking through the USD 1800/oz mark last week, has continued to drop, hitting an 8-month low as of yesterday's close. Chart 13Global Copper Inventories Remain Tight
Global Copper Inventories Remain Tight
Global Copper Inventories Remain Tight
Chart 14
Copper Prices Decouple From Fundamentals
Copper Prices Decouple From Fundamentals
Footnotes 1 Please see China, US and EU are the largest economies in the world, which was published by Eurostat 19 May 2020. 2 For additional discussion of oil-market fundamentals, please see Recession Unlikely To Batter Oil Prices, which covers our expectation for global oil balances and prices. It was published 16 June 2022. 3 Please see Hypo-Globalization (A GeoRisk Update) published by BCA Research’s Geopolitical Strategy 30 July 2021. See also Commodities' Watershed Moment, which we published 22 March 2022. 4 Please see GDPNow, published by the Federal Reserve Bank of Atlanta 1 July 2022. 5 Please see Third Quarter Geopolitical Outlook: Thunder And Lightning, published by BCA’s Geopolitical Strategy 24 June 2022. This report notes, “China’s political crackdown, struggle with Covid-19, waning exports, and deflating property market have led to an abrupt slowdown this year. The government is responding by easing monetary, fiscal, and regulatory policy, though so far with limited effect … . Economic policy will not be decisive in the third quarter unless a crash forces the administration to stimulate aggressively.” 6 In August 2020, the Ministry of Housing and Urban-Rural Development and the People’s Bank of China proposed to implement a policy which kept a ceiling on companies’ asset to liability ratio at 70%, net debt to equity ratio at 100%, and cash to short-term borrowings ratio at 1. Developers whose liabilities are within these requirements may increase their liabilities by less than 15%. These were known as the “three red lines.” Per that policy, if one or more of these ceilings are surpassed, maximum liabilities growth is capped at a lower percentage. 7 Please see Add Local Politics To Copper Supply Risks, which we published 25 November 2021. It is available at ces.bcaresearch.com. See also Chile sticks to plan for new mining profit tax up to 32% linked to copper price, published by reuters.com via mining.com 1 July 2022. 8 Please see Norway’s government halts oil and gas strike published by ft.com 5 July 2022. Investment Views and Themes Strategic Recommendations Tactical Trades Trades Closed In 2022
Executive Summary Our recommended model bond portfolio outperformed its custom benchmark index by +24bps in Q2/2022, improving the year-to-date outperformance to a solid +72bps. The Q2 outperformance came entirely from the credit side of the portfolio (+35bps), led by underweights to US investment grade corporates (+28bps) and EM hard currency debt (+24bps). The rates side of the portfolio was down slightly (-11bps), with gains from underweights in US and UK inflation-linked bonds (a combined +24bps) helping offset the hit from overweights to German and French government bonds (a combined -30bps). Looking ahead, we continue to see more defensive positioning in growth-sensitive credit sectors like US investment grade corporate bonds and EM hard currency debt, rather than duration management, as providing the better opportunity to generate alpha in bond portfolios over the latter half of 2022. GFIS Model Bond Portfolio Recommended Positioning For The Next Six Months
GFIS Model Bond Portfolio Q2/2022 Review & Outlook: Winning By Playing Defense
GFIS Model Bond Portfolio Q2/2022 Review & Outlook: Winning By Playing Defense
Bottom Line: In our model bond portfolio, we are maintaining an overall neutral duration stance and a moderate underweight of spread product versus developed market sovereign bonds. We are, however, reducing the recommended tilts in inflation-linked bonds by upgrading US TIPS to neutral and downgrading Canadian linkers to neutral. Feature Dear Client, We are about to take a mid-summer publishing break, as this humble bond strategist moves his family into a new home in a new city. Next week, you will be receiving a report written by BCA Research’s Chief US Bond Strategist, Ryan Swift. The following week, there will be no Global Fixed Income Strategy report published. Our next report will be published on July 26, 2022. Regards, Rob Robis Bond investors are running out of places to hide to avoid losses in 2022. The total return on the Bloomberg Global Aggregate index (hedged into USD) in the second quarter of this year was -4%, nearly matching the -6% loss seen in Q1. No sector, from government bonds to corporate debt to emerging market credit, could avoid the damage caused by hawkish central bankers belated responding to the worst bout of global inflation since the 1970s. Related Report Global Fixed Income StrategyGFIS Model Bond Portfolio Q1/2022 Review & Outlook: Trading The Consolidation Phase Global inflation rates will soon peak, led by slowing growth of goods prices and commodity prices. However, inflation will remain well above central bank targets across the bulk of the developed world, supported by more domestic sources like services prices, housing costs and wages. This will limit the ability for important central banks like the Fed and ECB to quickly pivot in a more dovish direction to support weakening growth – and bail out foundering bond markets. With that backdrop in mind, we present our quarterly review of the BCA Research Global Fixed Income Strategy (GFIS) model bond portfolio for the second quarter of 2022. We also present our recommended positioning for the portfolio for the next six months, as well as portfolio return expectations for our base case and alternative investment scenarios. As a reminder to existing readers (and to new clients), the model portfolio is a part of our service that complements the usual macro analysis of global fixed income markets. The portfolio is how we communicate our opinion on the relative attractiveness between government bond and spread product sectors. We do this by applying actual percentage weightings to each of our recommendations within a fully invested hypothetical bond portfolio. Q2/2022 Model Bond Portfolio Performance: All About Credit Chart 1Q2/2022 Performance: Gains From Defensive Credit Positioning
Q2/2022 Performance: Gains From Defensive Credit Positioning
Q2/2022 Performance: Gains From Defensive Credit Positioning
The total return for the GFIS model portfolio (hedged into US dollars) in the second quarter was -4.3%, outperforming the custom benchmark index by +24bps (Chart 1).1 In terms of the specific breakdown between the government bond and spread product allocations in our model portfolio, the former generated -11bps of underperformance versus our custom benchmark index while the latter outperformed by +35bps. In our previous quarterly portfolio performance review in April, we noted that the greater opportunities to generate outperformance for fixed income investors would come from more defensive allocations to spread product, rather than big directional moves in government bond yields. That forecast largely panned out, as global credit markets moved to price in the growing risk of a deep economic downturn. Declining nominal government bond yields provided some modest relief at the end of June, with markets modestly pricing out some of the rate hikes discounted over the next year amid deepening global recession fears. While we maintained a neutral stance on overall portfolio duration during the quarter, we did benefit from the fact that the decline in global bond yields in late June was concentrated more in lower inflation expectations than falling real yields. Thus, our underweight positioning in inflation-linked bonds, focused on the US and UK, helped add a combined +25bps of outperformance versus the benchmark (Table 1). Table 1GFIS Model Bond Portfolio Q2/2022 Overall Return Attribution
GFIS Model Bond Portfolio Q2/2022 Review & Outlook: Winning By Playing Defense
GFIS Model Bond Portfolio Q2/2022 Review & Outlook: Winning By Playing Defense
The bar charts showing the total and relative returns for each individual government bond market and spread product sector in our model portfolio are presented in Charts 2 & 3. Chart 2GFIS Model Bond Portfolio Q2/2022 Government Bond Performance Attribution
GFIS Model Bond Portfolio Q2/2022 Review & Outlook: Winning By Playing Defense
GFIS Model Bond Portfolio Q2/2022 Review & Outlook: Winning By Playing Defense
Chart 3GFIS Model Bond Portfolio Q2/2022 Spread Product Performance Attribution By Sector
GFIS Model Bond Portfolio Q2/2022 Review & Outlook: Winning By Playing Defense
GFIS Model Bond Portfolio Q2/2022 Review & Outlook: Winning By Playing Defense
Biggest Outperformers: Underweight US investment grade Industrials (+19bps) Underweight UK index-linked Gilts (+15bps) Underweight US TIPS (+9bps) Underweight US investment grade Financials (+7bps) Underweight US MBS (+6bps) Underweight US Treasuries with maturities beyond ten years (+6bps) Biggest Underperformers: Overweight euro area investment grade corporates (-19bps) Overweight German government bonds with maturities beyond ten years (-14bps) Overweight French government bonds with maturities beyond ten years (-8bps) Overweight UK Gilts with maturities beyond ten years (-6bps) Overweight US CMBS (-4bps) Chart 4 presents the ranked benchmark index returns of the individual countries and spread product sectors in the GFIS model bond portfolio for Q2/2022. Returns are hedged into US dollars (we do not take active currency risk in this portfolio) and adjusted to reflect duration differences between each country/sector and the overall custom benchmark index for the model portfolio. We have also color coded the bars in each chart to reflect our recommended investment stance for each market during Q2 (red for underweight, dark green for overweight, gray for neutral). Chart 4Ranking The Winners & Losers From The GFIS Model Bond Portfolio Universe In Q2/2022
GFIS Model Bond Portfolio Q2/2022 Review & Outlook: Winning By Playing Defense
GFIS Model Bond Portfolio Q2/2022 Review & Outlook: Winning By Playing Defense
Ideally, we would look to see more green bars on the left side of the chart where market returns are highest, and more red bars on the right side of the chart were returns are lowest. That pattern largely held true in Q2/2022, especially at the tail ends of the chart. During a quarter where all the major asset classes in our portfolio lost money on a hedged and duration-matched basis, we outperformed by selectively underweighting the worst performers within the credit side of the benchmark portfolio universe. Notably, we were underweight EM USD-denominated Sovereigns (-1099bps), EM USD-denominated corporates (-816bps) and US investment grade corporates (-686bps) on the extreme right side of the chart. Some of our key overweight positions did relatively well, led by overweights in US CMBS (-148bps), Australian government bonds (-288bps) and euro area investment grade corporates (-378bps), all of which were on the left side of Chart 4. One of our key recommendations throughout the first half of 2022 - overweighting German government bonds (-517bps) and French government bonds (-657bps) versus underweighting US Treasuries (-283bps) - performed poorly in Q2. This was due to investors rapidly pricing in a far more aggressive series of ECB rate hikes than we expected, resulting in some convergence of US-European bond yield differentials. Importantly, core European bond yields have pulled back substantially over the last month, and by much more than US yields have declined. Most notably, the 2-year German yield, which began Q2 at minus-7bps and hit a peak of 1.2% on June 14, has now fallen all the way back to 0.4% as this report went to press. The 2-year US-Germany yield differential has already widened by 35bps in the first week of July, suggesting that our overweight core Europe/underweight US allocation is already contributing positively to the model bond portfolio returns for Q3. Bottom Line: Our model bond portfolio outperformed its benchmark index in the second quarter of the year by +24bps – a positive result coming largely from underweight positions in US corporate bonds, EM spread product and inflation-linked bonds in the US and UK. Future Drivers Of Model Bond Portfolio Returns Just as in Q2/2022, the performance of the model bond portfolio in Q3/2022 will be driven more by relative allocations between countries and spread product sectors, rather than big directional moves in bond yields or credit spreads. Overall Duration Exposure Chart 5A More Stable Backdrop For Global Bond Yields
A More Stable Backdrop For Global Bond Yields
A More Stable Backdrop For Global Bond Yields
In terms of portfolio duration, we still see a stronger case for global bond yields to be more rangebound than trending, especially in the US. There has already been a major downward adjustment to global bond yields via lower inflation expectations and reduced rate hike expectations. A GDP-weighted average of major developed market 10-year inflation breakevens has already fallen from an April 2022 peak of 281bps to 216bps (Chart 5). That aggregate breakeven is now back to the levels that began 2022, before the Russian invasion of Ukraine that triggered a surge in global energy prices. We anticipate that additional declines in global inflation expectations – and the associated reductions in central bank rate hike expectations – will be harder to achieve over the latter half of 2022. “Stickier” inflation from services, housing costs and wages will remain strong enough to keep overall inflation rates above central bank targets, even as decelerating goods and commodity price inflation act to slow headline inflation rates. Our Global Duration Indicator, which is comprised of growth indicators like the ZEW expectations index for the US and Europe as well as our own global leading economic indicator, has fallen substantially and is signaling a decline in global bond yield momentum once realized inflation rates peak (Chart 6). Chart 6Our Duration Indicator Calling For Slowing Global Yield Momentum
Our Duration Indicator Calling For Slowing Global Yield Momentum
Our Duration Indicator Calling For Slowing Global Yield Momentum
Chart 7Overall Portfolio Duration: Stay Neutral
Overall Portfolio Duration: Stay Neutral
Overall Portfolio Duration: Stay Neutral
We see that as signaling more of a sideways action in bond yields over the next six months, rather than a big downward move, especially in the US. Thus, we are keeping the duration of the model bond portfolio close to that of the benchmark index (Chart 7). Government Bond Country Allocation We are sticking with our view that, for countries with active central banks (i.e. everyone but Japan), favoring markets where interest rate expectations are above plausible estimates of neutral policy rates should lead to outperformance from country allocation. In Chart 8, we show 10-year bond yields and 2-years-forward 1-month Overnight Index Swap (OIS) rates for the US, euro area, UK, Canada and Australia. The shaded regions in the chart represent estimates of the range of neutral policy rates. In the case of the US, rate expectations and Treasury yields are now below the upper level of the range of neutral fed funds rates estimates, between 2-3%, taken from the latest set of FOMC economic projections. Hence, we are sticking with an underweight stance on US Treasuries with yields offering less protection against the Fed following through on its current guidance and lifting the funds rate into restrictive territory above 3%. In the other countries, rate expectations are above the range of neutral rate estimates, which suggests that bond yields have a bit more protection against hawkish central bank actions. That leads us to stay overweight core Europe, the UK and Australia in the government bond portion of the model bond portfolio. We are only keeping Canada at neutral, however, as we suspect that the Bank of Canada is more willing than other central banks to follow the Fed’s lead on taking rates to a restrictive level to help bring down elevated Canadian inflation. For other countries, we are staying neutral on Italian government bond exposure, for now, and underweight Japan (Chart 9). Chart 8Favor Countries Where Markets Expect Above-Neutral Rates
Favor Countries Where Markets Expect Above-Neutral Rates
Favor Countries Where Markets Expect Above-Neutral Rates
Chart 9Underweight JGBs, Stay Neutral Italy (For Now)
Underweight JGBs, Stay Neutral Italy (For Now)
Underweight JGBs, Stay Neutral Italy (For Now)
For Italy, we await news from the July 21 ECB meeting on the details of a proposal to help support Italian bond markets in the event of additional yield increases or spread widening versus Germany. It is clear from the history of the past decade that Italian bond returns suffer when the ECB is either hiking rates or slowing the growth of its balance sheet (top panel). In other words, it is difficult to recommend overweighting Italian bonds without the support of easy ECB monetary policy. Chart 10Our Inflation-Linked Bond Country Allocations
Our Inflation-Linked Bond Country Allocations
Our Inflation-Linked Bond Country Allocations
For Japan, our recommendation is strictly related to our view on the move in overall global bond yields. The Bank of Japan is bucking the worldwide trend to tighten monetary policy because core Japanese inflation remains weak. This makes Japanese government bonds (JGBs) a good place for bond investors to “hide out” in when global bond yields are rising. Given our view that global bond yield momentum will slow – in line with the signal from our Global Duration Indicator – we do not see a strong cyclical case for overweighting low-yielding JGBs. On inflation-linked bonds, we are maintaining a cautious overall stance, with commodity prices decelerating, realized inflation momentum set to soon peak and central banks signaling more tightening ahead (Chart 10). This week, we are closing out our lone overweight recommendation on inflation-linked bonds in Canada, where we downgrading to neutral (3 out of 5, see the model bond portfolio table on page 24).2 At the same time, we are neutralizing our underweight stance on US TIPS, moving the allocation to neutral. We still see shorter-term TIPS breakevens as having downside from here, but longer-maturity breakevens have already made enough of a downward adjustment, in our view. Global Spread Product Turning to credit markets, we are maintaining our moderately cautious view on the overall allocation to credit versus government bonds. Slowing global growth momentum and tightening global monetary policy is not an environment where credit spreads can narrow, especially for growth-sensitive credit like corporate bonds and high-yield (Chart 11). Having said that – the spread widening seen in US and European corporate bond markets has introduced a better valuation cushion into spreads. Our preferred measure of spread product valuation – the historical percentile ranking of the 12-month breakeven spread – shows that investment grade spreads in the euro area are now in the top quartile (85%) of its history on a risk-adjusted basis (Chart 12). US investment grade spreads are now up into the second quartile (64%), which is a big improvement from the start of 2022 but not as much as seen in Europe. Chart 11Global Monetary Backdrop Turning More Negative For Credit
Global Monetary Backdrop Turning More Negative For Credit
Global Monetary Backdrop Turning More Negative For Credit
Chart 12Corporate Spread Valuations Have Improved In The US & Europe
Corporate Spread Valuations Have Improved In The US & Europe
Corporate Spread Valuations Have Improved In The US & Europe
European credit spreads likely need to be wide as a risk premium against the numerous risks the region is facing right now – slowing growth, an increasingly hawkish ECB, soaring energy prices and the lingering uncertainties stemming from the Ukraine war. However, a lot of bad news is now discounted in European spreads and, as a result, we are maintaining our overweight stance on European investment grade corporates, especially versus US investment grade where we remain underweight. High-yield spreads on both sides of the Atlantic look more attractive on a 12-month breakeven spread basis, but also on a default-adjusted spread basis (Chart 13). Assuming a moderate increase in the high-yield default rates in the US and Europe - consistent with a sharp slowing of economic growth but no deep recession - the current level of high-yield spreads net of expected default losses over the next year is above long-run averages. It is too soon to move to an overweight stance on high-yield, with the Fed and ECB set to tighten more amid ongoing growth uncertainty, but given the improved valuation cushion we see a neutral allocation to junk in both the US and Europe as appropriate in our model portfolio. Chart 13Junk Spreads Offer Value If Recession Can Be Avoided
Junk Spreads Offer Value If Recession Can Be Avoided
Junk Spreads Offer Value If Recession Can Be Avoided
Finally, we remain comfortably underweight emerging market USD-denominated sovereign and corporate debt. The backdrop is poor for emerging market bond returns, given slowing global growth, softening commodity prices, a tightening Fed and a strengthening US dollar (Chart 14). Chart 14Staying Cautious On EM Debt Exposure
Staying Cautious On EM Debt Exposure
Staying Cautious On EM Debt Exposure
Summing It All Up The full list of our recommended portfolio allocations can be seen in Table 2. The portfolio enters the second half of 2022 with the following high-level characteristics: Table 2GFIS Model Bond Portfolio Recommended Positioning For The Next Six Months
GFIS Model Bond Portfolio Q2/2022 Review & Outlook: Winning By Playing Defense
GFIS Model Bond Portfolio Q2/2022 Review & Outlook: Winning By Playing Defense
Chart 15Overall Portfolio Allocation: Underweight Spread Product Vs Governments
GFIS Model Bond Portfolio Q2/2022 Review & Outlook: Winning By Playing Defense
GFIS Model Bond Portfolio Q2/2022 Review & Outlook: Winning By Playing Defense
the overall duration exposure remains at-benchmark (i.e. neutral) the portfolio has an underweight allocation to overall spread products versus government bonds, equal to four percentage points of the portfolio (Chart 15) the tracking error of the portfolio, or its expected volatility in excess of that of the benchmark, is 77bps – below our self-imposed 100bps tracking error limit (Chart 16) the portfolio now has a yield below that of the custom benchmark index, equal to -31bps on a currency-unhedged basis but a more modest “carry gap” of -10bps on a USD-hedged basis given the gains from hedging into USD (Chart 17). Chart 16Overall Portfolio Risk: Moderate
Overall Portfolio Risk: Moderate
Overall Portfolio Risk: Moderate
Chart 17Overall Portfolio Yield: Below-Benchmark
Overall Portfolio Yield: Below-Benchmark
Overall Portfolio Yield: Below-Benchmark
Bottom Line: Looking ahead, our model bond portfolio performance will continue to be driven by the same factors in Q3/2022 as in the previous quarter: the relative performance of US bonds versus European equivalents for both government debt and corporate bonds, and the path for emerging market credit spreads. Portfolio Scenario Analysis For The Next Six Months After making the modest changes to our inflation-linked bond allocations in the US and Canada, which can be seen in the tables on pages 23-24, we now turn to our regularly quarterly scenario analysis to determine the return expectations for the portfolio for the next six months. On the credit side of the portfolio, we use risk-factor-based regression models to forecast future yield changes for global spread product sectors as a function of four major factors - the VIX, oil prices, the US dollar and the fed funds rate (Table 3A). For the government bond side of the portfolio, we avoid using regression models and instead use a yield-beta driven framework, taking forecasts for changes in US Treasury yields and translating those in changes in non-US bond yields by applying a historical yield beta (Table 3B). Table 3AFactor Regressions Used To Estimate Spread Product Yield Changes
GFIS Model Bond Portfolio Q2/2022 Review & Outlook: Winning By Playing Defense
GFIS Model Bond Portfolio Q2/2022 Review & Outlook: Winning By Playing Defense
Table 3BEstimated Government Bond Yield Betas To US Treasuries
GFIS Model Bond Portfolio Q2/2022 Review & Outlook: Winning By Playing Defense
GFIS Model Bond Portfolio Q2/2022 Review & Outlook: Winning By Playing Defense
For our scenario analysis over the next six months, we use a base case scenario plus two alternate “tail risk” scenarios. In the current environment, our scenarios center around the pace of global growth. Base Case (Slow Global Growth) Global growth momentum slows substantially, with firms cutting back on hiring and investing activity due to slowing corporate profit growth. An outright recession is avoided because softening energy prices help ease the drag on real spending power for consumers. China introduces more monetary and fiscal stimulus measures to boost growth. Global inflation peaks and eases on the back of slowing growth of goods prices and commodity prices, but the floor on inflation in the US and other developed markets is higher than central bank inflation targets due to sticky domestic price pressures. The Fed continues to hike at every policy meeting in H2/2022. There is a very mild bear flattening of the US Treasury curve, but with longer-term yields remain broadly unchanged over the full six month scenario period with the Fed not hiking by more than currently discounted. The Brent oil price retreats by -10%, the US dollar modestly appreciates by 2%, the VIX stays close to current levels at 28 and the fed funds rate reaches 3.25% by year-end. Resilient Growth Scenario Consumer spending surprises to the upside in the US and even Europe, as softer momentum of energy prices eases the relentless downward pressure on real incomes. Labor demand remains sold across the developed world, particularly with firms reluctant to do mass layoffs because of a perceived scarcity of quality labor. China enacts more policy stimulus with growth likely to fall below 2022 government targets. The Fed is forced to be more aggressive on rate hikes, given resilient US growth and inflation staying well above the Fed’s 2% target. The US Treasury curve bear-flattens into outright inversion, but with Treasury yields rising across the curve. The Brent oil price rises +20%, the VIX index climbs to 30, the US dollar appreciates by +3% thanks to a more aggressive Fed that lifts the funds rate to 3.75% by year-end. Recession Scenario A toxic combination of contracting corporate profits and negative real income growth drags the major developed economies into outright recession. Global inflation rates slow rapidly from current elevated levels, fueled by a rapid decline in commodity prices, but remain above central bank targets making it hard for the Fed and other major central banks to pivot dovishly to support growth. Chinese policymakers belatedly act to ease monetary and fiscal policy, but not by enough to offset the slow response from developed market policymakers. The Treasury curve moderately bull-steepens, although the absolute decline in nominal Treasury yields is relatively modest as the Fed will not pivot quickly to signaling policy easing with inflation still likely to remain above 2%. The Brent oil price falls -20%, the VIX index soars to 35, the US dollar depreciates by -3% (as lower US rates win out over slowing global growth) and the Fed pushes the funds rate to 2.75% before pausing after September. The excess return scenarios for the model bond portfolio, using the above inputs in our simple quantitative return forecast framework, are shown in Table 4A. The US Treasury yield assumptions are shown in Table 4B. For the more visually inclined, we present charts showing the model inputs and Treasury yield projections in Chart 18 and Chart 19, respectively. Table 4AGFIS Model Bond Portfolio Scenario Analysis For The Next Six Months
GFIS Model Bond Portfolio Q2/2022 Review & Outlook: Winning By Playing Defense
GFIS Model Bond Portfolio Q2/2022 Review & Outlook: Winning By Playing Defense
Table 4BUS Treasury Yield Assumptions For The 6-Month Forward Scenario Analysis
GFIS Model Bond Portfolio Q2/2022 Review & Outlook: Winning By Playing Defense
GFIS Model Bond Portfolio Q2/2022 Review & Outlook: Winning By Playing Defense
Chart 18Risk Factor Assumptions For The Scenario Analysis
Risk Factor Assumptions For The Scenario Analysis
Risk Factor Assumptions For The Scenario Analysis
Chart 19US Treasury Yield Assumptions For The Scenario Analysis
US Treasury Yield Assumptions For The Scenario Analysis
US Treasury Yield Assumptions For The Scenario Analysis
Given our neutral overall duration stance, the return scenarios will be driven by mostly by the credit side of the portfolio. In the recession scenario where Treasury yields decline, there is a modest projected outperformance from the rates side of the portfolio coming through the underweight to low-beta JGBs. In all scenarios, financial market volatility is expected to stay at, or above, current levels as central banks will be unable to ease policy, even in the event of an actual recession, because of lingering high inflation. Thus, the return on the credit side of the model portfolio will be the main driver of performance, delivering a range of excess return outcomes between +47bps and +60bps. Bottom Line: The model bond portfolio should benefit in H2/2022 from the ongoing cautious stance on global spread product, focused on underweights to US investment grade corporates and EM hard currency debt. Robert Robis, CFA Chief Fixed Income Strategist rrobis@bcaresearch.com Footnotes 1 The GFIS model bond portfolio custom benchmark index is the Bloomberg Barclays Global Aggregate Index, but with allocations to global high-yield corporate debt replacing very high-quality spread product (i.e. AA-rated). We believe this to be more indicative of the typical internal benchmark used by global multi-sector fixed income managers. 2 We are also closing out our Canadian breakeven widening trade in our Tactical Overlay portfolio. GFIS Model Bond Portfolio Recommended Positioning Active Duration Contribution: GFIS Recommended Portfolio Vs. Custom Performance Benchmark
GFIS Model Bond Portfolio Q2/2022 Review & Outlook: Winning By Playing Defense
GFIS Model Bond Portfolio Q2/2022 Review & Outlook: Winning By Playing Defense
The GFIS Recommended Portfolio Vs. The Custom Benchmark Index Global Fixed Income - Strategic Recommendations*
GFIS Model Bond Portfolio Q2/2022 Review & Outlook: Winning By Playing Defense
GFIS Model Bond Portfolio Q2/2022 Review & Outlook: Winning By Playing Defense
Dear Client, This month’s Special Report has been written by Martin Barnes, BCA’s former Chief Economist. Martin, who retired from BCA Research last year after a long and illustrious career, discusses the long-run outlook for inflation. The views expressed in this report are his, and may not be consistent with those of the Bank Credit Analyst or other BCA Research services. But Martin’s warning of future stagflation is sobering, and I trust you will find his report both interesting and insightful. Jonathan LaBerge, CFA The Bank Credit Analyst Highlights Overly stimulative policies meant that inflation was set to rise even before the disruptions caused by the pandemic and Ukraine conflict. Inflation should decline sharply over the coming year in response to weaker economic growth and an easing in supply problems. But it will be a temporary respite. Central banks will not have the stomach to keep policy tight enough for long enough to squeeze inflation out of the system. Price pressures will return as economies bottom and the environment will become one of stagflation. Financial assets will rally strongly when inflation fears subside but subsequent stagflation will not be bullish for markets. Feature Former Federal Reserve Chairman Alan Greenspan once defined price stability as existing when “households and businesses need not factor expectations of changes in the average level of prices into their decisions”. Until recently, that state of affairs was the case for much of the past 30 years and for many, inflation was quiescent during their entire working lives. But inflation is now back as a huge issue and there is massive debate and uncertainty about whether it will be a temporary or lasting problem. I lean toward the latter view. Major changes in the economic and/or financial environment more often are identified in hindsight than in real time. It is easier to attribute large trend deviations to temporary factors than to make bold predictions about structural shifts. Obviously, the pandemic and conflict in Ukraine have had a significant impact on the near-term inflation picture via massive supply-side disruptions and represent temporary events. Thus, inflation will retreat from current elevated levels as those disruptions diminish. But the conditions for higher inflation were already in place before those two unfortunate events occurred. Specifically, central banks have been erring on the side of stimulus for several years and they will find it extremely difficult, if not impossible, to put the inflation genie back into the bottle. Inflation has moved from a non-issue to the most important factor driving markets. Over the next year, the next big surprise might be how fast inflation retreats and investors and policymakers will then breathe a big sigh of relief. However, this will prove to be a temporary respite because it will not take long for inflation to move back up and remain stubbornly above central bank targets. In other words, a whipsaw is in prospect over the next few years as inflation goes from up, to down, and to up again. The Current Inflation Problem The biggest increases in consumer prices have occurred in areas most affected by supply problems, with energy attracting the most attention. Nevertheless, in most countries, inflation has risen across the majority of goods and services. The core inflation rate (i.e. consumer prices excluding food and energy) in the G7 economies climbed from 2% to 4.8% between April 2021 and April 2022 (Chart II-1). Meanwhile, the Cleveland Fed’s trimmed mean measure of US consumer price inflation has spiked dramatically higher, consistent with a broad-based acceleration in inflation.1 The rise in underlying inflation is a bigger problem in the US, UK and Canada than in Japan or the Euro Area. Chart II-2 shows current core inflation rates relative to the target rate of 2% pursued by most central banks. That geographical divergence will be touched on later and in the meantime, the focus will be on the US situation. Chart II-1A Broad-Based Pickup In Inflation
A Broad-Based Pickup in Inflation
A Broad-Based Pickup in Inflation
Chart II-2The US, UK And Canada Have A Bigger Inflation Problem
July 2022
July 2022
The latest US inflation data for a range of goods and services is shown in Table II-1. The table shows the three- and six-month annualized changes in prices because 12-month rates can be affected by a base effect given the impact of pandemic-related shutdowns and disruptions a year ago. Also, a comparison of the three- and six-month rates shows if momentum is building or fading. The trends are not encouraging in that momentum has accelerated, not diminished in many key areas. Table II-1Selected Inflation Rates In The US CPI
July 2022
July 2022
Even if the data show a moderation in core inflation in the months ahead, it is important to note that rent inflation – the CPI component with the biggest weight – is seriously underestimated. This is one of the few items where prices are collected with a lag and real estate industry reports highlight that rent inflation is running at double-digit rates in the major cities. According to one report, average rents nationally increased by more than 25% in the year to May.2 The CPI data will eventually catch up with reality, providing at least a partial offset to any inflation improvements in other areas. Another problem for inflation is the acceleration in wage growth against the backdrop of an unusually tight labor market. Currently, the number of unfilled vacancies is almost twice the number of unemployed and it is thus no surprise that wage growth has picked up sharply (Chart II-3). The Atlanta Fed’s measure of annual wage inflation has risen above 6%, its highest reading since the data began in 1997. Wage growth is unlikely to suddenly decline absent a marked rise in the unemployment rate. There is much debate about whether the US economy is on the verge of recession, but let’s not get bogged down in semantics. Regardless of whether the technical definition of recession is met (at least two consecutive quarters of negative GDP growth), the pace of activity is set to slow sharply. Plunging consumer and business confidence, contracting real incomes and a peaking in housing activity all point to a significant weakening in growth, even if the labor market stays healthy (Chart II-4). Chart II-3A Very Tight US Labor Market
A Very Tight US Labor Market
A Very Tight US Labor Market
Chart II-4The US Economy Is In Trouble
The US Economy is in Trouble
The US Economy is in Trouble
Softer economic growth eventually will take the edge off inflationary pressures in many goods and services. Combined with an easing in supply-side disruptions, the inflation rate is certain to decline in the coming year, even if oil prices move higher in the short run. Currently, the Fed is talking tough about dealing with inflation and there is little doubt that further rate hikes are on the way. However, policymakers will have little stomach for inflicting enough economic pain to completely squeeze inflation out of the system. Once there are clear signs of a significant economic slowdown, the Fed will back off quickly. What Causes Inflation Anyway? Economics 101 teaches that prices are determined by the interaction of supply and demand. If the demand for a good or service exceeds supply, then prices will rise to bring things back into balance. Seems simple enough but, unfortunately, this leaves many unanswered questions. How much must prices rise and for how long in order to restore balance? What if there are structural impediments to supply? What if there are monopolies in key commodities or services? What if policy interferes with the operation of market-clearing solutions? And, finally, what measure of inflation should we be looking at? Chart II-5Inflation Is A 'Modern' Issue
Inflation is a 'Modern' Issue
Inflation is a 'Modern' Issue
For much of economic history, deflation was just as prevalent as inflation, with the latter only being a problem during periods of war (Chart II-5). As the pre-WWII world pre-dated fiat money, automatic stabilizers (e.g. the welfare state), and counter-cyclical fiscal policy, economies were prone to regular depressions that served to wash out financial and economic excesses and any inflationary pressures. But those days are long gone and free market forces should not be expected to keep inflation under wraps. I rather like the simple explanation of inflation’s roots as being “too much money chasing too few goods”. In that sense, the control of inflation lies firmly at the door of central banks. In the “old days” (i.e. before the 1990s), it was possible to use the growth in the money supply to gauge the stance of policy because there was a fairly stable and predictable relationship between monetary and economic trends. That all ended when financial deregulation and the explosion in non-bank financial activities meant that monetary trends ceased to be a reliable indicator of economic growth and inflation. As a result, the Fed stopped setting monetary growth targets more than 20 years ago and since then, money supply data has rarely been mentioned in FOMC discussions. Chart II-6A Simple Measure Of The Monetary Stance
A Simple Measure of the Monetary Stance
A Simple Measure of the Monetary Stance
Fortunately, all is not lost. The gap between the federal funds rate and nominal GDP growth is a reasonably good proxy for the stance of monetary policy. Conditions are easy when rates are persistently below GDP growth and vice versa when they are above. As can be seen in Chart II-6, rates were below GDP growth during most of the 1960s and 1970s, a period when inflation rose sharply. And inflation fell steadily in the 1980s into the first half of the 1990s when the Fed kept interest rates above GDP growth. And look at what has happened in the past decade: rates have been significantly below GDP growth, suggesting an aggressively easy monetary stance. It was only a matter of time before inflation picked up, even without the recent supply-side disruptions. The FOMC’s latest projections show long-run growth of 3.8% in nominal GDP while the fed funds rate is expected to average only 2.5%. That implies a continued accommodative stance, yet inflation is forecast to be in line with the 2% target. That all seems very unlikely. Fed policymakers spend a lot of time trying to figure out the level of the equilibrium real interest rate – the level consistent with steady non-inflationary economic growth. It would be very helpful to have this number but coming up with an accurate measure is a largely futile exercise. It cannot be measured empirically and its estimation requires a lot of assumptions, explaining why there is no broad agreement on what the right number is. I think there is a case for the simpler approach of using the nominal growth in GDP as a proxy for where rates should be in normal circumstances. As noted above, that suggests monetary policy was excessively accommodative for an extended period. If US Policy Was Too Easy, Why Was Inflation Low For So Long? The Fed’s preferred measure of underlying inflation is the change in the personal consumption deflator, excluding food and energy. In the 25 years to 2019, inflation by this measure averaged only 1.7%, compared to the Fed’s desired level of 2%. Thus, even though the level of interest rates implied very accommodative policy over that period, inflation remained tame. This leads to an important caveat. The stance of monetary policy plays the key role in driving inflation, but it is not everything. Offsetting forces on inflation (in both directions) can mute or even swamp the impact of policy. There were several disinflationary forces in operation during the past 25 years. Specifically: In the second half of the 1990s, the explosive growth of the internet and accompanying boom in technology spending led to a marked pickup in productivity growth. The entry of China into the World Trade Organization at the end of 2001 unleashed a wave of offshoring and downward pressure on traded goods prices. A series of deflationary shocks hit the US and global economy including the 1998 financial crisis in South-East Asia and Russia, the bursting of the tech bubble after 2000, and of course the global financial meltdown in 2007-09. Unstable economic conditions undermined labor’s bargaining power, keeping a tight lid on wage growth. This was highlighted by the dramatic decline in labor’s share of income after 2000. Importantly, the above forces are no longer in place and in some cases are reversing. The key technological advances of the past decade have not been particularly good for productivity. Indeed, one could argue that the activities of most so-called FANG stocks – especially those involved in social media - have had a negative impact on productivity. Time spent on FaceBook, Twitter and Netflix do not have obvious benefits for increased economic efficiency. Chart II-7Globalization In Retreat
Globalization in Retreat
Globalization in Retreat
Even before the pandemic’s impact on supply chains, there were signs that globalization had peaked (Chart II-7). Indeed, BCA first suggested in 2014 that globalization was running out of steam. More recently, the interruption to supply chains has highlighted the downside of relying excessively on overseas production for key goods such as semi-conductors and pharmaceuticals. Onshoring rather than offshoring will become more common with higher prices being the cost for greater control over supply. Globalization is not dead, but, at the margin, it no longer is a powerful source of disinflation. US import prices from China are back to their highest level in a decade after falling steadily during the eight years to 2020. The inflationary impact of the pandemic and the war in Ukraine via supply-side disruptions are more than offsetting any disinflationary effects of softer economic growth. In other words, they have represented stagflationary rather than deflationary shocks. Finally, with regard to income shares, the pendulum has swung more in favor of labor. Demographic trends (e.g. slow growth in the working-age population) suggest that the labor market will remain relatively tight in the years ahead, notwithstanding short-term weakness as the economy slows. Profit margins are likely to weaken and labor’s share of income will rise. The bottom line is that easy money policies will no longer be offset by a number of powerful external forces that served to keep consumer price inflation under wraps in the pre-pandemic period. And this raises another important point. If monetary policy is too easy, then it will show up somewhere, even if consumer price inflation is under control. There Is More Than One Kind Of Inflation Inflation most commonly refers to the change in the prices of consumer goods and services. That is understandable because consumer spending accounts for more than half of GDP in the major developed economies (and almost 70% in the US). And because consumers are the ones who vote, it is the inflation rate that politicians care most about. However, there are other kinds of inflation. If there are structural impediments to increased consumer prices, then excessively easy monetary policy most likely will show up in higher asset prices. This is a very different kind of inflation because it is welcomed by the owners of assets and by politicians. Nobody is happy to face higher prices for the goods and services they buy, but asset owners love the wealth-boosting effect of higher prices for homes and shares. Consumer inflation may have been subdued in the pre-pandemic decade, but the same is not true for asset prices. During the period that the Fed ran accommodative policies, there were several periods of rampant asset inflation such as the tech stock bubble of the late 1990s, the housing bubble of the 2000s, and the bond bubble of 2016-2020. And both equity and home prices surged in response to monetary stimulus triggered by the pandemic. Central banks may fret about the potential financial stability implications of surging asset prices, but in practice they do not act to curb them. Policymakers argue that it is hard to determine when an asset bubble exists and even when one is obvious, monetary policy is a crude tool to deal with it. If rising asset prices occur alongside an economy that is characterized by stable growth and moderate inflation, then acting to burst a bubble could inflict unnecessary economic damage. That is an understandable position, but it means ignoring the longer-term problems that occur when bubbles inevitably burst. This was highlighted by the economic and financial chaos after the US housing bubble burst in 2007. The reality is that central banks have been forced to rely more heavily on asset inflation as a source of monetary stimulus. An easing in monetary policy affects economic conditions in three primary ways: boosting credit demand and supply, raising asset prices, and lowering the exchange rate.3 Historically, the credit channel was by far the most important. BCA has written extensively about the Debt Supercycle and the role of monetary policy in fueling ever-rising levels of private sector indebtedness (see the Appendix for a brief description of the Debt Supercycle). Chart II-8No Releveraging Cycle In Household Debt
No Releveraging Cycle in Household Debt
No Releveraging Cycle in Household Debt
The environment changed dramatically after the 2007-09 financial meltdown. The collapse of the credit-fueled housing bubble drove a stake through the heart of the household sector’s love affair with debt. The ratio of household debt to income peaked in early 2009 and ten years later it was back to the levels of 2001 (Chart II-8). Even an extended period of record low interest rates has failed to trigger a new leveraging cycle. If the Fed can’t persuade consumers and businesses to fall back in love with debt, then it must rely on the other two transmission channels for monetary policy – asset prices and the exchange rate. And the Fed really has limited control over the latter channel given that it also depends on the actions of other central banks. The deleveraging of the household sector in the post-2009 period could have been very bearish for the economy, but the Fed’s easy money policies underpinned the stock market, allowing household net worth to revive. There was an explosive rise in household net worth in 2020-21 as surging house prices added to stock market gains. Between end-2019 and end-2021, the household sector’s direct holdings of equities plus owner’s equity in real estate increased in value by around $20 trillion, equal to more than one year’s personal disposable income. The recent decline in equity prices has reversed some of the gains, but net worth remains elevated by historical standards. The bottom line is that it was wrong to suggest that the Fed’s accommodative stance did not create inflation. Consumer price inflation was tame in the pre-pandemic period, but there was lots of asset inflation and that gathered pace in 2020 and 2021. There was always going to be some leakage of this into more generalized inflation but this was accelerated by the double whammy of the supply disruptions caused by the pandemic and the Ukraine war. The Strange Case Of Japan If higher inflation in the US has seemed inevitable, how can one explain the situation in Japan? In contrast to other developed countries, Japan’s annual core inflation rate was only 0.2% in May. While this was an increase from the average -1.3% rate in the prior six months, it is impressive given the country’s continued highly stimulative monetary policy and the same exposure to supply disruptions as elsewhere. Most importantly, Japan has suffered structural deflation for so long that inflation expectations are totally dormant for both consumers and businesses. In other words, raising prices is seen as a desperate measure and something to be avoided. Japan’s poor demographics may also have played a role. A sharply declining labor force and rapidly aging population are disinflationary rather than inflationary influences and help reinforce the corporate sector’s reluctance to raise prices. While Japan seems an outlier, it is worth noting that core inflation also has remained relatively subdued in many European countries. For the overall Euro area, the latest core inflation rate is 3.8%, well below that of the US and UK. Two common features of the higher inflation countries are that they tended to have more aggressively-easy fiscal policies in recent years and greater asset inflation – especially in real estate. Unfortunately, inflation expectations and business pricing behavior in the US and other Anglo-Saxon economies have not followed Japan’s example. Employees have become more aggressive in demanding higher wages, and most companies have no problem in passing on higher costs to their customers. The UK is facing a wave of public sector strikes over pay the likes of which have not been seen for decades. The Outlook Chart II-9A Peaking In Supply Problems?
A Peaking in Supply Problems?
A Peaking in Supply Problems?
Inflation may prove sticky over the next few months, but as noted earlier, it should move significantly lower over the coming year. Crude oil prices have risen by around 75% in the past year and that pace of rise cannot be sustained. Meanwhile, while shipping rates remain historically high, they are down sharply from earlier peaks (Chart II-9). Together with a revival in Chinese exports, this suggests some easing in supply chain problems. And as mentioned above, the pace of economic activity is set to slow sharply. But a return to pre-pandemic inflation levels is not in the cards. The Fed currently is talking tough and further rate hikes are on the way. But the tightening will end as soon as it becomes clear that the economy is heading south. A deep recession is not likely because there are not the worrying imbalances such as excessive consumer debt or inventories that typically precede serious downturns. However, policymakers will not take any risks and policy will return quickly to an accommodative stance, even though inflation is unlikely to return to the desired 2% level. On a positive note, inflation may be the highest in 40 years in many countries, but we are not facing a return to the destructive high-inflation environment of the 1970s. Inflation back then was institutionalized and a self-feeding cycle of higher wages and rising prices was deeply embedded. I was working as an economist for BP in London in the 1970s and remember receiving large quarterly pay rises just to compensate for inflation. In the absence of inflation-accounting practices, companies seriously underestimated the destruction that inflation was creating to balance sheets and profitability, making them complacent about the problem. Moreover, there were not the same global competitive pressures that exist today. Inflation in the US likely will form a new base of 3% to 4% over the medium term, with occasional fluctuations to 5% or above. An environment of stagflation is in prospect: growth will not be weak enough to suppress inflation and not strong enough to allow the Fed to maintain a restrictive stance. This puts the Fed in a difficult spot as it will be reluctant to admit defeat by raising the inflation target from its current 2%, even though that level will be out of reach in practical terms. A counter view is that I am too pessimistic by underestimating the disinflationary effects of technological advances. A sustained improvement in productivity would certainly help lower inflation but how likely is this? Technological advances are occurring all the time, but in recent years they largely have been incremental in nature and it is hard to think of any new breakthrough productivity-enhancing technologies. There is a difference between new technologies that simply represent better ways to do existing tasks (3D printing would fall into that category) and general purpose technologies that completely change the way economies operate (e.g. electricity and the internet). While businesses are still exploiting the benefits of the digital world, we await innovations that will trigger a new sustained upsurge in productivity. A game changer would be the development of unlimited cheap energy (cold fusion?) but that does not seem likely any time soon. Nevertheless, I will keep an open mind about the potential for productivity to surprise on the upside, despite my current skepticism. Chart II-10Inflation Expectations Spike Higher
Inflation Expectations Spike Higher
Inflation Expectations Spike Higher
What does all this mean for the markets? Not surprisingly, shifts in market expectations for future inflation are highly correlated with the current rate and have thus spiked higher in recent months, hurting both bonds and stocks (Chart II-10). Obvious inflation hedges would be inflation-protected bonds and resources, but neither group currently is attractively priced. The good news is that the current panic about inflation is setting the scene for a buying opportunity in both stocks and bonds. The exact timing is tricky to predict but both stocks and bonds will rally strongly later this year when inflation expectations retreat as it becomes clear that the economy is weakening and the Fed softens its hawkish tones. The bad news is that this bullish phase will not last much more than a year because a re-emergence of inflationary pressures will bring things back to earth. The long-run outlook is one of stagflation and that will be a tough environment for financial assets. Martin H. Barnes Former Chief Economist, BCA Research mhbarnes15@gmail.com Appendix: A Primer On The Debt Supercycle The Debt Supercycle is a description of the long-term decline in U.S. balance-sheet liquidity and rise in indebtedness during the post-WWII period. Economic expansions have always been associated with a buildup of leverage. However, prior to the introduction of automatic stabilizers such as the welfare state and deposit insurance, balance-sheet excesses tended to be fully unwound during economic downturns, albeit at the cost of severe declines in activity. The pain of the Great Depression led governments to intervene to smooth out the business cycle, and their actions were given legitimacy by the economic theories of John Maynard Keynes. Fiscal and monetary reflation, together with the introduction of automatic stabilizers such as unemployment insurance, were successful in preventing the frequent depressions that plagued the pre-WWII economy, but the downside was that balance-sheet imbalances and financial excesses built up during each expansion phase were never fully unwound. Periodic "cyclical" corrections to the buildup of debt and illiquidity occurred during recessions, but these were never enough to reverse the long-run trend. Although liquidity was rebuilt during a recession, it did not return to its previous cyclical high. Meanwhile, the liquidity rundown during the next expansion phase established new lows. These trends led to growing illiquidity, and vulnerability in the financial markets. The greater the degree of illiquidity in the economy, the greater is the threat of deflation. Thus, the bigger that balance-sheet excesses become, the more painful the corrective process would be. So, the stakes became higher in each cycle, putting ever-increasing pressure on the authorities to reflate demand, by whatever means were available. The Supercycle process was driven over time by the building tension between rising underlying deflationary risks in the economy, and the ability of policymakers to create inflation. The Supercycle reached an important inflection point in the recent economic and financial meltdown, with the authorities reaching the limit of their ability to get consumers to take on more leverage. This forced the government to leverage itself up instead, representing the Debt Supercycle's final inning. Footnotes 1This trimmed mean measure excludes the top 8% of CPI components with the largest monthly price gains and the bottom 8% with the smallest monthly gains. 2 Rent.com, https://www.rent.com/research/average-rent-price-report/, June 2022. 3 A fourth channel can be via a psychological boost to business and consumer confidence, but this can cut both ways if an easing in policy is interpreted as a sign of worsening economic conditions rather than as a reason for optimism.
BCA Research’s China Investment Strategy service continues to recommend a neutral stance in Chinese equities within a global portfolio. China’s economic data moved up slightly in May from an extremely depressed level in April. A normalization of the supply…
Executive Summary Russia Squeezes EU Natural Gas
Russia Squeezes EU Natural Gas
Russia Squeezes EU Natural Gas
Major geopolitical shocks tend to coincide with bear markets, so the market is getting closer to pricing this year’s bad news. But investors are not out of the woods yet. Russia is cutting off Europe’s natural gas supply ahead of this winter in retaliation to Europe’s oil embargo. Europe is sliding toward recession. China is reverting to autocratic rule and suffering a cyclical and structural downshift in growth rates. Only after Xi Jinping consolidates power will the ruling party focus exclusively on economic stabilization. The US can afford to take risks with Russia, opening up the possibility of a direct confrontation between the two giants before the US midterm election. A new strategic equilibrium is not yet at hand. Tactical Recommendation Inception Date Return LONG GLOBAL DEFENSIVES / CYCLICALS EQUITIES 2022-01-20 18.3% Bottom Line: Maintain a defensive posture in the third quarter but look for opportunities to buy oversold assets with long-term macro and policy tailwinds. Feature 2022 is a year of geopolitics and supply shocks. Global investors should remain defensive at least until the Chinese national party congress and US midterm election have passed. More fundamentally, an equilibrium must be established between Russia and NATO and between the US and Iran. Until then supply shocks will destroy demand. Checking Up On Our Three Key Views For 2022 Our three key views for the year are broadly on track: 1. China’s Reversion To Autocracy: For ten years now, the fall in Chinese potential economic growth has coincided with a rise in neo-Maoist autocracy and foreign policy assertiveness, leading to capital flight, international tensions, and depressed animal spirits (Chart 1). Related Report Geopolitical StrategyWill China Let 100 Flowers Bloom? Only Briefly. Rising incomes provided legitimacy for the Communist Party over the past four decades. Less rapidly rising incomes – and extreme disparities in standards of living – undermine the party and force it to find other sources of public support. Fighting pollution and expanding the social safety net are positives for political stability and potentially for economic productivity. But converting the political system from single-party rule to single-person rule is negative for productivity. Mercantilist trade policy and nationalist security policy are also negative. China’s political crackdown, struggle with Covid-19, waning exports, and deflating property market have led to an abrupt slowdown this year. The government is responding by easing monetary, fiscal, and regulatory policy, though so far with limited effect (Chart 2). Economic policy will not be decisive in the third quarter unless a crash forces the administration to stimulate aggressively. Chart 1China's Slowdown Leads To Maoism, Nationalism
China's Slowdown Leads To Maoism, Nationalism
China's Slowdown Leads To Maoism, Nationalism
Chart 2Chinese Policy Easing: Limited Effect So Far
Chinese Policy Easing: Limited Effect So Far
Chinese Policy Easing: Limited Effect So Far
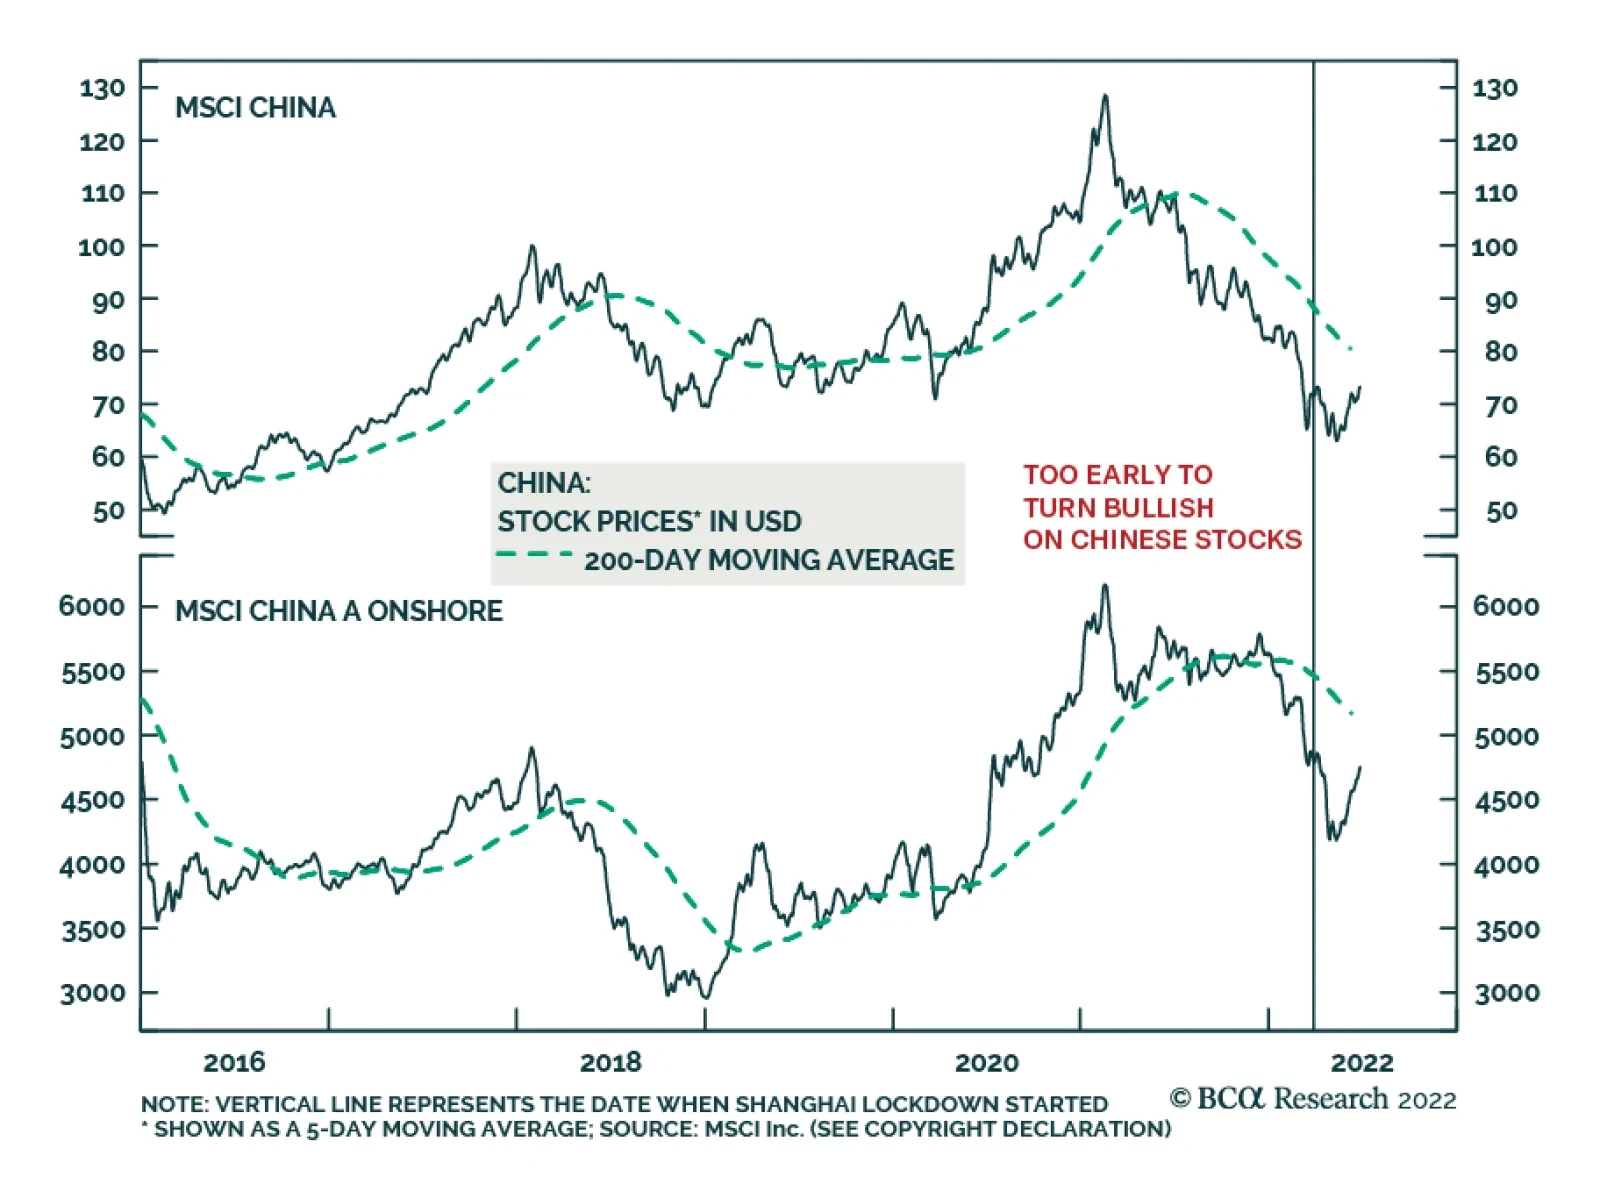
Chart 3Nascent Rally In Chinese Shares Will Be Dashed
Nascent Rally In Chinese Shares Will Be Dashed
Nascent Rally In Chinese Shares Will Be Dashed
Once General Secretary Xi Jinping secures another five-to-ten years in power at the twentieth national party congress this fall, he will be able to “let 100 flowers bloom,” i.e. ease policy further and focus exclusively on securing the economic recovery in 2023. But policy uncertainty will remain high until then. The party may have to crack down anew to ensure Xi’s power consolidation goes according to plan. China is highly vulnerable to social unrest for both structural and cyclical reasons. The US would jump to slap sanctions on China for human rights abuses. Hence the nascent recovery in Chinese domestic and offshore equities can easily be interrupted until the political reshuffle is over (Chart 3). If China’s economy stabilizes and a recession is avoided, investors will pile into the rally, but over the long run they will still be vulnerable to stranded capital due to Chinese autocracy and US-China cold war. If the Politburo and Politburo Standing Committee are stacked with members of Xi’s faction, as one should expect, then the reduction in policy uncertainty will only be temporary. Autocracy will lead to unpredictable and draconian policy measures – and it cannot solve the problem of a shrinking and overly indebted population. If the Communist Party changes course and stacks the Politburo with Xi’s factional rivals, to prevent China from going down the Maoist, Stalinist, and Putinist route, then global financial markets will cheer. But that outcome is unlikely. Hawkish foreign policy means that China will continue to increase its military threats against Taiwan, while not yet invading outright. Beijing has tightened its grip over Tibet, Xinjiang, and Hong Kong since 2008; Taiwan and the South China Sea are the only critical buffer areas that remain to be subjugated. Taiwan’s midterm elections, US midterms, and China’s party congress will keep uncertainty elevated. Taiwan has underperformed global and emerging market equities as the semiconductor boom and shortage has declined (Chart 4). Hong Kong is vulnerable to another outbreak of social unrest and government repression. Quality of life has deteriorated for the native population. Democracy activists are disaffected and prone to radicalization. Singapore will continue to benefit at Hong Kong’s expense (Chart 5). Chart 4Taiwan Equity Relative Performance Peaked
Taiwan Equity Relative Performance Peaked
Taiwan Equity Relative Performance Peaked
Chart 5Hong Kong Faces More Troubles
Hong Kong Faces More Troubles
Hong Kong Faces More Troubles
Chart 6Japan Undercuts China
Japan Undercuts China
Japan Undercuts China
China and Japan are likely to engage in clashes in the East China Sea. Beijing’s military modernization, nuclear weapons expansion, and technological development pose a threat to Japanese security. The gradual encirclement of Taiwan jeopardizes Japan’s vital sea lines of communication. Prime Minister Fumio Kishida is well positioned to lead the Liberal Democratic Party into the upper house election on July 10 – he does not need to trigger a diplomatic showdown but he would not suffer from it. Meanwhile China is hungry for foreign distractions and unhappy that Japan is reviving its military and depreciating its currency (Chart 6). A Sino-Japanese crisis cannot be ruled out, especially if the Biden administration looks as if it will lose its nerve in containing China. Financial markets would react negatively, depending on the magnitude of the crisis. North Korea is going back to testing ballistic missiles and likely nuclear weapons. It is expanding its doctrine for the use of such weapons. It could take advantage of China’s and America’s domestic politics to stage aggressive provocations. South Korea, which has a hawkish new president who lacks parliamentary support, is strengthening its deterrence with the United States. These efforts could provoke a negative response from the North. Financial markets will only temporarily react to North Korean provocations unless they are serious enough to elicit military threats from Japan or the United States. China would be happy to offer negotiations to distract the Biden administration from Xi’s power grab. South Korean equities will benefit on a relative basis as China adds more stimulus. 2. America’s Policy Insularity: President Biden’s net approval rating, at -15%, is now worse than President Trump’s in 2018, when the Republicans suffered a beating in midterm elections (Chart 7). Biden is now fighting inflation to try to salvage the elections for his party. That means US foreign policy will be domestically focused and erratic in the third quarter. Aside from “letting” the Federal Reserve hike rates, Biden’s executive options are limited. Pausing the federal gasoline tax requires congressional approval, and yet if he unilaterally orders tax collectors to stand down, the result will be a $10 billion tax cut – a drop in the bucket. Biden is considering waiving some of former President Trump’s tariffs on China, which he can do on his own. But doing so will hurt his standing in Rust Belt swing states without reducing inflation enough to get a payoff at the voting booth – after all, import prices are growing slower from China than elsewhere (Chart 8). He would also give Xi Jinping a last-minute victory over America that would silence Xi’s critics and cement his dictatorship at the critical hour. Chart 7Democrats Face Shellacking In Midterm Elections
Third Quarter Geopolitical Outlook: Thunder And Lightning
Third Quarter Geopolitical Outlook: Thunder And Lightning
Chart 8Paring Trump Tariffs Won't Reduce Inflation Much
Paring Trump Tariffs Won't Reduce Inflation Much
Paring Trump Tariffs Won't Reduce Inflation Much
Chart 9Only OPEC Can Help Biden - And Help May Come Late
Only OPEC Can Help Biden - And Help May Come Late
Only OPEC Can Help Biden - And Help May Come Late
Biden is offering to lift sanctions on Iran, which would free up 1.3 million barrels of oil per day. But Iran is not being forced to freeze its nuclear program by weak oil prices or Russian and Chinese pressure – quite the opposite. If Biden eases sanctions anyway, prices at the pump may not fall enough to win votes. Hence Biden is traveling to Saudi Arabia to make amends with Crown Prince Mohammed bin Salman. OPEC’s interest lies in producing enough oil to prevent a global recession, not in flooding the market on Biden’s whims to rescue the Democratic Party. Saudi and Emirati production may come but it may not come early in the third quarter. Lifting sanctions on Venezuela is a joke and Libya recently collapsed again (Chart 9). Even in dealing with Russia the Biden administration will exhibit an insular perspective. The US is not immediately threatened, like Europe, so it can afford to take risks, such as selling Ukraine advanced and long-range weapons and providing intelligence used to sink Russian ships. If Russia reacts negatively, a direct US-Russia confrontation will generate a rally around the flag that would help the Democrats, as it did under President John F. Kennedy in 1962 – one of the rare years in which the ruling party minimized its midterm election losses (Chart 10). The Cuban Missile Crisis counted more with voters than the earlier stock market slide. 3. Petro-States’ Geopolitical Leverage: Oil-producing states have immense geopolitical leverage this year thanks to the commodity cycle. Russia will not be forced to conclude its assault on Ukraine until global energy prices collapse, as occurred in 2014. In fact Russia’s leverage over Europe will be greatly reduced in the coming years since Europe is diversifying away from Russian energy exports. Hence Moscow is cutting natural gas flows to Europe today while it still can (Chart 11). Chart 10Biden Can Afford To Take Risks With Russia
Third Quarter Geopolitical Outlook: Thunder And Lightning
Third Quarter Geopolitical Outlook: Thunder And Lightning
Chart 11Russia Squeezes EU's Natural Gas
Russia Squeezes EU's Natural Gas
Russia Squeezes EU's Natural Gas
Chart 12EU/China Slowdown Will Weigh On World
Third Quarter Geopolitical Outlook: Thunder And Lightning
Third Quarter Geopolitical Outlook: Thunder And Lightning
Russia’s objective is to inflict a recession and cause changes in either policy or government in Europe. This will make it easier to conclude a favorable ceasefire in Ukraine. More importantly it will increase the odds that the EU’s 27 members, having suffered the cost of their coal and oil embargo, will fail to agree to a natural gas embargo by 2027 as they intend. Italy, for example, faces an election by June 2023, which could come earlier. The national unity coalition was formed to distribute the EU’s pandemic recovery funds. Now those funds are drying up, the economy is sliding toward recession, and the coalition is cracking. The most popular party is an anti-establishment right-wing party, the Brothers of Italy, which is waiting in the wings and can ally with the populist League, which has some sympathies with Russia. A recession could very easily produce a change in government and a more pragmatic approach to Moscow. The Italian economy is getting squeezed by energy prices and rising interest rates at the same time and cannot withstand the combination very long. A European recession or near-recession will cause further downgrades to global growth, especially when considering the knock-on effects in China, where the slowdown is more pronounced than is likely reported. The US economy is more robust but it will have to be very robust indeed to withstand a recession in Europe and growth recession in China (Chart 12). Russia does not have to retaliate against Finland and Sweden joining NATO until Turkey clears the path for them to join, which may not be until just before the Turkish general election due in June 2023. But imposing a recession on Europe is already retaliation – maybe a government change will produce a new veto against NATO enlargement. Russian retaliation against Lithuania for blocking 50% of its shipments to the Kaliningrad exclave is also forthcoming – unless Lithuania effectively stops enforcing the EU’s sanctions on Russian resources. Russia cannot wage a full-scale attack on the Baltic states without triggering direct hostilities with NATO since they are members of NATO. But it can retaliate in other ways. In a negative scenario Moscow could stage a small “accidental” attack against Lithuania to test NATO. But that would force Biden to uphold his pledge to defend “every inch” of NATO territory. Biden would probably do so by staging a proportionate military response or coordinating with an ally to do it. The target would be the Russian origin of attack or comparable assets in the Baltic Sea, the Black Sea, Ukraine, Belarus, or elsewhere. The result would be a dangerous escalation. Russia could also opt for cyber-attacks or economic warfare – such as squeezing Europe’s natural gas supply further. Ultimately Russia can afford to take greater risks than the US over Kaliningrad, other territories, and its periphery more broadly. That is the difference between Kennedy and Biden – the confrontation is not over Cuba. Russia is also likely to take a page out of Josef Stalin’s playbook and open a new front – not so much in Nicaragua as in the Middle East and North Africa. The US betrayal of the 2015 nuclear deal with Iran opens the opportunity for Russia to strengthen cooperation with Iran, stir up the Iranians’ courage, sell them weapons, and generate a security crisis in the Middle East. The US military would be distracted keeping peace in the Persian Gulf while the Europeans would lose their long-term energy alternative to Russia – and energy prices would rise. The Iranians – who also have leverage during a time of high oil prices – are not inclined to freeze their nuclear program. That would be to trade their long-term regime survival for economic benefits that the next American president can revoke unilaterally. Bottom Line: Xi Jinping is converting China back into an autocracy, the Biden administration lacks options and is willing to have a showdown with Russia, and the Putin administration is trying to inflict a European recession and political upheaval. Stay defensive. Checking Up On Our Strategic Themes For The 2020s As for our long-term themes, the following points are relevant after what we have learned in the second quarter: 1. Great Power Rivalry: The war in Ukraine has reminded investors of the primacy of national security. In an anarchic international system, if a single great nation pursues power to the neglect of its neighbors’ interests, then its neighbors need to pursue power to defend themselves. Before long every nation is out for itself. At least until a new equilibrium is established. For example, Russia’s decision to neutralize Ukraine by force is driving Germany to abandon its formerly liberal policy of energy cooperation in order to reduce Russia’s energy revenues and avoid feeding its military ambitions. Russia in turn is reducing natural gas exports to weaken Europe’s economy this winter. Germany will re-arm, Finland and Sweden will eventually join NATO, and Russia will underscore its red line against NATO bases or forces in Finland and Sweden. If this red line is violated then a larger war could ensue. Chart 13China Will Shift To Russian Energy
China Will Shift To Russian Energy
China Will Shift To Russian Energy
Until Russia and NATO come to a new understanding, neither Europe nor Russia can be secure. Meanwhile China cannot reject Russia’s turn to the east. China believes it may need to use force to prevent Taiwan independence at some point, so it must prepare for the US and its allies to treat it the same way that they have treated Russia. It must secure energy supply from Russia, Central Asia, and the Middle East via land routes that the US navy cannot blockade (Chart 13). Beijing must also diversify away from the US dollar, lest the Treasury Department freeze its foreign exchange reserves like it did Russia’s. Global investors will see diversification as a sign of China’s exit from the international order and preparation for conflict, which is negative for its economic future. However, the Russo-Chinese alliance presents a historic threat to the US’s security, coming close to the geopolitical nightmare of a unified Eurasia. The US is bound to oppose this development, whether coherently or not, and whether alone or in concert with its allies. After all, the US cannot offer credible security guarantees to negotiate a détente with China or Iran because its domestic divisions are so extreme that its foreign policy can change overnight. Other powers cannot be sure that the US will not suffer a radical domestic policy change or revolution that leads to belligerent foreign policy. Insecurity will drive the US and China apart rather than bringing them together. For example, Russia’s difficulties in Ukraine will encourage Chinese strategists to go back to the drawing board to adjust their plans for military contingencies in Taiwan. But the American lesson from Ukraine is to increase deterrence in Taiwan. That will provoke China and encourage the belief that China cannot wait forever to resolve the Taiwan problem. Until there is a strategic understanding between Russia and NATO, and the US and China, the world will remain in a painful and dangerous transitional phase – a multipolar disequilibrium. Chart 14Hypo-Globalization: Globalizing Less Than Potential
Third Quarter Geopolitical Outlook: Thunder And Lightning
Third Quarter Geopolitical Outlook: Thunder And Lightning
2. Hypo-Globalization: If national security rises to the fore, then economics becomes a tool of state power. Mercantilism becomes the basis of globalization rather than free market liberalism. Hypo-globalization is the result. The term is fitting because the trade intensity of global growth is not yet in a total free fall (i.e. de-globalization) but merely dropping off from its peaks during the phase of “hyper-globalization” in the 1990s and early 2000s (Chart 14). Hypo-globalization is probably a structural rather than cyclical phenomenon. The EU cannot re-engage with Russia and ease sanctions without rehabilitating Russia’s economy and hence its military capacity – which could enable Russia to attack Europe again. The US and China can try to re-engage but they will fail. Russo-Chinese alliance ensures that the US would be enriching not one but both of its greatest strategic rivals if it reopened its doors to Chinese technology acquisition and intellectual property theft. Iran will see its security in alliance with Russia and China. China has an incentive to develop Iran’s economy so as not to depend solely on Russia and Central Asia. Russia has an incentive to develop Iran’s military capacity so as to deprive Europe of an energy alternative. Both Russia and China wish to deprive the US of strategic hegemony in the Middle East. By contrast the US and EU cannot offer ironclad security guarantees to Iran because of its nuclear ambitions and America’s occasional belligerence. Thus the world can see expanding Russian and Chinese economic integration with Eurasia, and expanding American and European integration with various regions, but it cannot see further European integration with Russia or American integration with China. And ultimately Europe and China will be forced to sever links (Chart 15). Globalization will not cease – it is a multi-millennial trend – but it will slow down. It will be subordinated to national security and mercantilist economic theory. 3. Populism/Nationalism: In theory, domestic instability can cause introversion or extroversion. But in practice we are seeing extroversion, which is dangerous for global stability (Chart 16). Chart 15Global Economic Disintegration
Global Economic Disintegration
Global Economic Disintegration
Chart 16Internal Sources Of Nationalism
Internal Sources Of Nationalism
Internal Sources Of Nationalism
Russia’s invasion of Ukraine derived from domestic Russian instability – and instability across the former Soviet space, including Belarus, which the Kremlin feared could suffer a color revolution after the rigged election and mass protests of 2020-21. The reason the northern European countries are rapidly revising their national defense and foreign policies to counter Russia is because they perceive that the threat to their security is driven by factors within the former Soviet sphere that they cannot easily remove. These factors will get worse as a result of the Ukraine war. Russian aggression still poses the risk of spilling out of Ukraine’s borders. China’s Maoist nostalgia and return to autocratic government is also about nationalism. The end of the rapid growth phase of industrialization is giving way to the Asian scourge: debt-deflation. The Communist Party is trying to orchestrate a great leap forward into the next phase of development. But in case that leap fails like the last one, Beijing is promoting “the great rejuvenation of the Chinese nation” and blaming the rest of the world for excluding and containing China. Taiwan, unfortunately, is the last relic of China’s past humiliation at the hands of western imperialists. China will also seek to control the strategic approach to Taiwan, i.e. the South China Sea. China’s claim that the Taiwan Strait is sovereign sea, not international waters, will force the American navy to assert freedom of passage. American efforts to upgrade Taiwan relations and increase deterrence will be perceived as neo-imperialism. The United States, for its part, could also see nationalism convert into international aggression. The US is veering on the brink of a miniature civil war as nationalist forces in the interior of the country struggle with the political establishment in the coastal states. Polarization has abated since 2020, as stagflation has discredited the Democrats. But it is now likely to rebound, making congressional gridlock all but inevitable. A Republican-controlled House will find a reason to impeach President Biden in 2023-24, in hopes of undermining his party and reclaiming the presidency. Another hotly contested election is possible, or worse, a full-blown constitutional crisis. American institutions proved impervious to the attempt of former President Trump and his followers to disrupt the certification of the Electoral College vote. However, security forces will be much more aggressive against rebellions of whatever stripe in future, which could lead to episodes in which social unrest is aggravated by police repression. If the GOP retakes the White House – especially if it is a second-term Trump presidency with a vendetta against political enemies and nothing to lose – then the US will return to aggressive foreign policy, whether directed at China or Iran or both. In short, polarization has contaminated foreign policy such that the most powerful country in the world cannot lead with a steady hand. Over the long run polarization will decline in the face of common foreign enemies but for now the trend vitiates global stability. Chart 17Germany And Japan Rearming
Third Quarter Geopolitical Outlook: Thunder And Lightning
Third Quarter Geopolitical Outlook: Thunder And Lightning
It goes without saying that nationalism is also an active force in Iran, where 83-year-old Supreme Leader Ayatollah Khamenei is attempting to ensure the survival of his regime in the face of youthful social unrest and an unclear succession process. If Khamenei takes advantage of the commodity cycle, and American and Israeli disarray, he can make a mad dash for the bomb and try to achieve regime security. But if he does so then nationalism will betray him, since Israel and/or the US are willing to conduct air strikes to uphold the red line against nuclear weaponization. If any more proof of global nationalism is needed, look no further than Germany and Japan, the principal aggressors of World War II. Their pacifist foreign policies have served as the linchpins of the post-war international order. Now they are both pursuing rearmament and a more proactive foreign policy (Chart 17). Nationalism may be very nascent in Germany but it has clearly made a comeback in Japan, which exacerbates China’s fears of containment. The rise of nationalism in India is widely known and reinforces the trend. Bottom Line: Great power rivalry is intensifying because of Russia’s conflict with the West and China’s inability to reject Russia. Hypo-globalization is the result since EU-Russia and US-China economic integration cannot easily be mended in the context of great power struggle. Domestic instability in Russia, China, and the US is leading to nationalism and aggressive foreign policy, as leaders find themselves unwilling or unable to stabilize domestic politics through productive economic pursuits. Investment Takeaways BCA has shifted its House View to a neutral asset allocation stance on equities relative to bonds (Chart 18). Chart 18BCA House View: Neutral Stocks Versus Bonds
BCA House View: Neutral Stocks Versus Bonds
BCA House View: Neutral Stocks Versus Bonds
Geopolitical Strategy remains defensively positioned, favoring defensive markets and sectors, albeit with some exceptions that reflect our long-term views. Tactically stay long US 10-year Treasuries, large caps versus small caps, and defensives versus cyclicals. Stay long Mexico and short the UAE (Chart 19). Strategically stay long gold, US equities relative to global, and aerospace/defense sectors (Chart 20). Among currencies favor the USD, EUR, JPY, and GBP. Chart 19Stay Defensive In Q3 2022
Stay Defensive In Q3 2022
Stay Defensive In Q3 2022
Chart 20Stick To Long-Term Geopolitical Trades
Stick To Long-Term Geopolitical Trades
Stick To Long-Term Geopolitical Trades
Chart 21Favor Semiconductors But Not Taiwan
Favor Semiconductors But Not Taiwan
Favor Semiconductors But Not Taiwan
Chart 22Indian Tech Will Rebound Amid China's Geopolitical Risks
Indian Tech Will Rebound Amid China's Geopolitical Risks
Indian Tech Will Rebound Amid China's Geopolitical Risks
Chart 23Overweight ASEAN
Overweight ASEAN
Overweight ASEAN
Go long US semiconductors and semi equipment versus Taiwan broad market (Chart 21). While we correctly called the peak in Taiwanese stocks relative to global and EM equities, our long Korea / short Taiwan trade was the wrong way to articulate this view and remains deeply in the red. Similarly our attempt to double down on Indian tech versus Chinese tech was ill-timed. China eased tech regulations sooner than we expected. However, the long-term profile of the trade is still attractive and Chinese tech will still suffer from excessive government and foreign interference (Chart 22). Go long Singapore over Hong Kong, as Asian financial leadership continues to rotate (see Chart 5 above). Stay long ASEAN among emerging markets. We will also put Malaysia on upgrade watch, given recent Malaysian equity outperformance on the back of Chinese stimulus and growing western interest in alternatives to China (Chart 23). Matt Gertken Chief Geopolitical Strategist mattg@bcaresearch.com Strategic Themes Open Tactical Positions (0-6 Months) Open Cyclical Recommendations (6-18 Months) Regional Geopolitical Risk Matrix
Executive Summary The Fed has sought to convince one and all of its commitment to overcome high inflation and asset markets have taken heed, tightening financial conditions at a breakneck pace. As we write, the S&P 500 is down 23% year to date, the Bloomberg Barclays Treasury index is down 10%, its sister Corporate and High Yield indexes are down 15% and 12%, respectively, and the dollar had risen by 10% at its peak last week. According to Goldman Sachs’ Financial Conditions Index, the combination has amounted to a 3-percentage-point drag on GDP. Financial markets’ reaction function vis-a-vis monetary policy actions in this tightening cycle has been markedly different than in the previous three tightening cycles. Where tighter financial conditions had previously followed tighter monetary policy with a lengthy lag, they moved ahead of the Fed this time. If the recession is further away than moves in the bond, equity and foreign exchange markets imply, or if inflation eases across the rest of the year in line with our expectations, risk assets are poised to rebound. All Together Now
All Together Now
All Together Now
Bottom Line: The FOMC appears to be on course to induce a recession in its quest to bring inflation to heel. The outlook for financial markets depends on when the recession arrives and how bad it will be, however, and we see scope for positive surprises on both counts. Feature 2022 has not been a good year for financial markets and the action over the last week and a half has made it decidedly worse. In six sessions through Thursday, the S&P 500 nosedived 11%, swooning into bear market territory and unwinding nineteen months of advances. The benchmark 10-year Treasury note’s yield needed just three sessions to back up 45 basis points, from 3.05% to 3.5%. The upheaval has not been unique to the US – inflation and decelerating growth are global phenomena and central banks around the world are scrambling to tighten monetary conditions to rein in rising consumer prices while markets agonize about the effect on growth – but the Fed has been at the center of the storm and last week’s FOMC meeting inspired more swings. This week’s report highlights the most important takeaways from the latest FOMC meeting and how financial markets and Fed policy may interact going forward. There are several factors that are at least slightly different this time. Those differences may keep volatility elevated but they do not condemn stocks and bonds to continued declines. Financial markets have made huge pre-emptive moves that may be subject to reversals as inflation data improve and/or growth holds up better than expected. Prioritizing Price Stability Times have changed. Until inflation began to stir last year, the Fed had been able to prioritize the full employment element of its dual mandate for the entire post-crisis period. Chair Powell made it abundantly clear that price stability is the FOMC’s top priority now, opening his post-meeting remarks with the “overarching message” that it has the means and the will to bring inflation back down to its target level. Living up to this commitment will not be as much fun as trying to prod the economy back to full employment, and it looks as if it will ultimately result in a recession. Following 150 basis points (bps) of hikes so far this year, the target range for the fed funds rate now stands at 1.5-1.75%, and the revised Summary of Economic Projections (SEP) indicated that the median FOMC participant expects another 175 bps of hikes across the year’s remaining four meetings, bringing the funds rate to 3.25-3.5% by year end, at the low end of the money markets’ expectations range (Chart 1). Chart 1Markets And The Fed Are On The Same Page
Markets And The Fed Are On The Same Page
Markets And The Fed Are On The Same Page
During the press conference, Powell repeatedly cited the committee’s concern over rising inflation expectations, calling out the increase in 5-year inflation expectations in the University of Michigan’s preliminary June survey as “quite eye-catching.” The series rose from 30 basis points, to 3.3%, after spending the last four months at 3% and the previous ten in a tight 2.9-3.1% range. The reading was the highest since 2008, when the average national gasoline price first rose above $4 per gallon (Chart 2). Chart 2An "Eye-Catching" Move ...
An "Eye-Catching" Move ...
An "Eye-Catching" Move ...
Threading The Needle FOMC participants’ median projections for real growth, unemployment and inflation at the end of 2022, 2023 and 2024 were benign to pollyannaish, signaling their confidence that the committee will be able to thread the needle, wrestling inflation back to target while maintaining trend growth and capping the unemployment rate at 4.1%. That would meet anyone’s definition of a soft landing, but soft landings have been notoriously elusive. It is fiendishly difficult to fine-tune a complex multi-faceted economy with central bankers’ blunt tools. Empirically, every unemployment rate increase of at least one-third of a percentage point has led to a recession (Chart 3), so even the modest one-half point rise envisioned in the SEP could bring some challenges. A closer examination of past unemployment rate increases suggests a potential way around the dour history, but it depends on reversing the decline in labor force participation that is not yet fully understood. The labor force participation rate – the share of the 16-and-over population that is either working or actively looking for a job – remains more than a percentage point below its pre-pandemic level (Chart 4). If it recovered its early 2020 share, the labor force would expand by 2.8 million people. Chart 3... That Could Put Upward Pressure On The Unemployment Rate
... That Could Put Upward Pressure On The Unemployment Rate
... That Could Put Upward Pressure On The Unemployment Rate
Chart 4The Mystery Of The Missing Workers
The Mystery Of The Missing Workers
The Mystery Of The Missing Workers
If the participation rate were restored to its pre-pandemic level, the fortified labor force would allow for payroll expansion despite the unemployment rate increases envisioned in the latest SEP, as per the population growth and household-to-establishment-survey conversion rate estimates embedded in Table 1. It is reasonable to think that the expansion could continue, or the ensuing recession would be mild, despite a rising unemployment rate if payrolls manage to keep growing. An increasing unemployment rate/increasing payrolls scenario is plausible, but we cannot deem it probable when we do not know what has impeded the participation rate’s recovery. The committee is unlikely to be of one mind on the participation rate question, but it may hold the key to reconciling the sunny projections with the observed difficulty of achieving a soft landing. Table 1A Path To A Soft Landing
One Overarching Message, Multiple Potential Outcomes
One Overarching Message, Multiple Potential Outcomes
We’ll Take The Over We agree with Chair Powell and the FOMC’s assessment that solid consumer balance sheets and robust job gains have the economy on a sound footing, despite slowing growth. We do not see familiar underlying vulnerabilities that herald a reversal like an overreliance on debt, broad supply overhangs or an investment boom that has gone on too long. Inflation is the signal problem in the US and the rest of the world, and we continue to expect that it will recede in the second half as supply constraints in pandemic-squeezed segments ease and the pre-emptive backup in yields holds back some marginal demand for big-ticket items that require financing. No one knows the equilibrium fed funds rate in real time, but Powell indicated the committee thinks it’s around 3.5%, placing the year end 2022 median funds rate dot just shy of equilibrium and the median 2023 dot in modestly restrictive territory. A recession is the likely outcome of the rate hike campaign, but if the target rate doesn’t exceed the equilibrium rate until early next year, it may not begin until the middle of 2023 or early in 2024. Given that the consensus view now appears to be that a recession will begin this year if it hasn’t done so already, and financial markets have gone a long way toward pricing in its effects, we don’t see much upside to joining the bearish chorus now. We’ll take the over on the recession-by-year-end proposition. The Big Difference This Time When asked how high the funds rate has to go to arrest inflation, Powell offered the following description of how rate hikes work. “I … look at it this way: We move the policy rate that affects financial conditions, and that affects the economy. We have [more] rigorous ways to think about it, but ultimately it comes down to, ‘do we think financial conditions are in a place where they’re having the desired effect on the economy?’ And that desired effect is we’d like to see demand moderating.” Related Report US Investment StrategyInflation And Investing Two questions later, he approvingly noted how much bang the committee had already gotten for its buck to this point in the tightening campaign. “[T]his year has been a demonstration of how well [guidance] can work. With us having … done very little in the way of raising interest rates, financial conditions have tightened quite significantly through the expectations channel, as we’ve made clear what our plans are. I think that’s been … very healthy[.]” We stay away from making value judgments about policy, though we can see that a central banker would be in favor of anything that shortens the lag between policy actions and their economic effect. It is immediately obvious, however, that the current rate hike campaign’s real-time impact on financial conditions contrasts sharply with the last three decades’ campaigns (Chart 5). Every one-point change in the Goldman Sachs Financial Conditions Index (FCI) is calibrated to correspond to a one-percentage-point change in real GDP. The FOMC hiked by 175 bps ahead of the 2001 recession and the FCI eventually rose four points, peaking in October 2002, 29 months after the FOMC pushed fed funds to its terminal rate and 21 after it began cutting rates. After the 2004-6 “conundrum” campaign, when financial conditions eased despite 17 consecutive quarter-point rate hikes, the FCI tightened by five points, reaching its peak almost three years after the last hike and 18 months after the first cut. Chart 5Seize The Day
Seize The Day
Seize The Day
Chart 6Decoupling
Decoupling
Decoupling
Some of the response is a simple reflection of the about-face in the inflation backdrop. As our Chief Emerging Markets Strategist Arthur Budaghyan predicted in February 2021, Treasury yields and stock prices have flipped from several decades of positive correlation (rising stock prices offset falling bond valuations and vice versa) in a disinflationary environment to negative correlation in an inflationary environment. Now that Treasury bond, corporate bond and stock prices have been falling together, and the safe-haven dollar has risen amidst the general flight from risk, all of the FCI’s subcomponents have been reinforcing one another, making the index jumpier. More volatile financial conditions raise the probability of overshoots. To wit, has the FCI moved too far, too soon? The volcanic upward move in the 10-year Treasury yield has severed its reliable empirical link with the gold-to-commodity ratio (Chart 6, top panel) and the relative performance of cyclical and defensive equity sectors (Chart 6, bottom panel). They suggest a retracement could be in store. Projected policy rate differentials between the Fed and other currency majors’ central banks are narrowing as monetary policy makers rush to combat inflation. Gloom about growth is widespread. Any positive global growth surprise, from China regarding COVID or stimulus, from the Ukrainian theater, or from supply chain relief, could reel in the extended dollar. Investors should not lose sight of the potential that the coming recession could be mild. A 25% selloff in the S&P 500 may be nearly enough to address that outcome. As of Thursday’s close, the index’s forward four-quarter multiple was down to 15.5 from just under 22 at the start of the year – stocks were expensive, but the nearly 30% de-rating haircut has been severe. The 15.5 multiple assumes the next four quarters’ earnings grow almost 10% year-over-year, which looks ambitious. 5% growth would yield a 16.2 multiple, while no growth would price stocks at 17 times. Those multiples are not cheap, but a lot of froth has come out of the equity market. Against the gloom that has taken over financial markets, we think the next twelve months can be rewarding for investors in risk assets. We are alert to the principal ways our constructive view could be proven wrong and will change our view if it is invalidated by the evidence, but we remain overweight equities in a multi-asset portfolio over the cyclical three-to-twelve-month timeframe. Doug Peta, CFA Chief US Investment Strategist dougp@bcaresearch.com
Executive Summary Structural Tailwinds For The Franc
Structural Tailwinds For The Franc
Structural Tailwinds For The Franc
Volatility in FX markets is likely to remain elevated, as witnessed by the reaction of a full circle of central bank meetings this week.Policy convergence remains a good bet for interest rate curves and currency pairs. The SNB surprised markets by raising interest rates by 50 bps, to -0.25%, the first hike since 2007.Higher volatility will continue to buoy the Swiss franc in the short run.Structural appreciation in the franc is also likely over the coming decades (Feature Chart). Swiss stocks often perform well during economic downturns, but they are not particularly cheap, and are vulnerable to higher interest rates. Investors should only overweight Swiss stocks if they expect more significant downside to global stocks.Valuation favors the franc versus the dollar. However, EUR/CHF and GBP/CHF are closer to fair value. CHF/JPY is expensive; hence, the yen is a better hedge for downside economic surprises. Go short CHF/JPY as a trade.BCA’s Foreign Exchange Strategy was short CHF/SEK at 10.2 with stop loss at 10.5. That stop was hit overnight, triggering a loss of -3.3%. Stand aside for now.Bottom Line: Favor the franc over the short term against other pro-cyclical currencies, with a view to downgrade CHF when it becomes evident that economic growth is bottoming. Any further bout of Swiss equity outperformance, prompted by global risk aversion, offers an attractive selling opportunity versus Eurozone stocks.Feature Chart 1The SNB Has Capitulated To Rising Inflation
The SNB Has Capitulated To Rising Inflation
The SNB Has Capitulated To Rising Inflation
Volatility in FX markets is likely to remain elevated. This week, the Fed delivered its first 75 bps interest rate hike since 1994. It also increased its expected year-end level for the Fed Funds rate to 3.4% from 1.9%, and to 3.8% from 3.4% at the end of 2023. The FX market had been warming up to a hawkish surprise, but the dollar surged on the news, hitting a fresh two-decade high of 105.5, before later reversing gains.Meanwhile, the European Central Bank (ECB) held an emergency meeting on Wednesday, to try to mitigate the rise in Italian yields, which hit as high as 4.2% on Tuesday, or 243 bps over German 10-year yields. The subsequent statement released by the Governing Council offered no concrete details. Yes, the reinvestments of the proceeds from maturing debt in the Pandemic Emergency Purchase Program (PEPP) will flow mostly to peripheral markets, but investors want clarity on the nature of the long-awaited policy plan to tackle fragmentation risk in the Euro Area. As a result, peripheral bond markets will remain fragile until a bold program comes to fruition.To cement currency volatility this week, SNB Governor Thomas Jordan surprised markets by raising interest rates by 50 bps in Switzerland, to -0.25%, the first hike since the Global Financial Crisis (Chart 1). The negative interest rate threshold for sight deposits was also lowered, a move encouraging banks to pack reserves at the SNB. The Bank of England also raised interest rates in line with market expectations. The move initially disappointed GBP bulls, but sterling is holding above our 1.20 floor.An environment of monetary policy uncertainty, rising recession risks in response to high inflation, and the potential for central bank policy mistakes bodes well for safe-haven assets. In Europe, the market with the strongest defensive profile is Switzerland. In this report, we address whether investors should bet on continued appreciation of the franc and an outperformance of Swiss stocks, especially now that the SNB has turned hawkish.Switzerland Versus The WorldGlobal economic growth is slowing and a small/open economy like Switzerland’s has not been spared. The KOF economic barometer, a key leading indicator for Swiss GDP growth, has collapsed over the past twelve months from 144 to 97 as global industrial activity decelerated (Chart 2). Despite softening growth, global inflation refuses to decline, forcing central banks worldwide to lean into the slowdown. This threatens to cut the post-pandemic business cycle expansion short. Chart 2The SNB Is Tightening Into A Slowing Economy
The SNB Is Tightening Into A Slowing Economy
The SNB Is Tightening Into A Slowing Economy
Surprisingly, the Swiss economy is generally performing better than the rest of Europe. Historically, Swiss economic performance is procyclical due to the large share of exports within its GDP. Hence, a slowdown in global manufacturing often creates a large threat to Swiss growth. Going forward, can the Swiss economy diverge from that of the rest of the world (Chart 3)? Such a divergence is not probable, but a few factors will protect the Swiss economy:Switzerland still has one of the lowest policy rates in the G10, even after today’s 50bps interest rate increase. This has tremendously helped ease monetary conditions. Our monetary gauge is at its most accommodative level in over two decades (Chart 4). Chart 3The Swiss Economy Is Procyclical
The Swiss Economy Is Procyclical
The Swiss Economy Is Procyclical
Chart 4Swiss Monetary Conditions Are Still Accommodative
Swiss Monetary Conditions Are Still Accommodative
Swiss Monetary Conditions Are Still Accommodative
Swiss inflation remains the lowest in the G10 outside Japan. In Switzerland, the main driver of price increases has been goods, while services inflation remains subdued. Consequently, the SNB has been tolerating an appreciating franc to temper imported inflation (Chart 5), while keeping domestic borrowing costs at very accommodative levels. In its updated forecasts, the SNB now expects a -0.25% interest rate to allow Swiss inflation to moderate to 1.9% in 2023 and 1.6% in 2024. Chart 5Swiss Inflation Is Surprising To The Upside
Swiss Inflation Is Surprising To The Upside
Swiss Inflation Is Surprising To The Upside
Part of the reason Switzerland has low inflation has been the tremendous productivity gains, especially relative to its trading partners (Chart 6). Swiss income-per-capita is elevated, but wage growth has lagged output gains, which limits the risk of a wage-inflation spiral. It is notable that part-time employment continues to dominate job gains, implying that the need for precautionary savings will remain high in Switzerland. Chart 6A Productivity Profile For Switzerland
A Productivity Profile For Switzerland
A Productivity Profile For Switzerland
Higher productivity growth and the elevated national savings leave their footprint on the trade data. The Swiss trade balance is hitting fresh highs, unlike Europe or Japan (Chart 7). This could potentially create a problem for the Swiss economy as it puts upward pressure on the CHF at a time when global manufacturing output is slowing. However, Switzerland specializes in high value-added exports with an elevated degree of complexity, that stand early in global supply chains. These type of goods are likely to remain in high demand in a global environment marked by supply-chain bottlenecks and high-capacity utilization. Chart 7Structural Tailwinds For The Franc
Structural Tailwinds For The Franc
Structural Tailwinds For The Franc
Finally, Switzerland does not import energy to fulfill its electricity production. Hydropower accounts for roughly 61.4% of electricity generation, followed by nuclear power at 28.5%. This has partially insulated Switzerland from the energy shock hurting economic activity and trade balances in the EU. For example, German electricity generation is 28.8% coal and 14.7% natural gas.Bottom Line: The Swiss economy is reopening and is relatively insulated from the Russia-Ukraine conflict. This limits to some degree how closely Switzerland will track the global and European economic slowdown. It creates a departure from the traditional pro-cyclicality of the Swiss economy.The SNB, The SARON Curve, And The Swiss FrancIf the Swiss economy surprises to the upside, the case for the SNB to tolerate a rising franc becomes even stronger. The pace of foreign exchange reserve accumulation is already decelerating (Chart 8). Governor Thomas Jordan has been very clear: as global prices rise, the fair value of the franc is also rising, which implies a willingness to tolerate currency strength. In a purchasing power parity framework, higher external inflation makes Swiss goods relatively cheaper. This allows foreigners to bid up the currency.Even with today’s updated pricing, the SNB is still expected to remain among the most dovish central banks in the G10 (Chart 9). If inflationary pressures prove sticky, the SNB will step up its hawkish rhetoric. If inflationary fears subside, then global rates will fall as well, which has usually been a boon for the franc. More specifically, this would be negative for the EUR/CHF cross (Chart 10). Chart 8Less Intervention By The SNB
Less Intervention By The SNB
Less Intervention By The SNB
Chart 9The SARON Curve Has Adjusted Higher
The SARON Curve Has Adjusted Higher
The SARON Curve Has Adjusted Higher
Chart 10EUR/CHF And Bund Yields Can Continue To Diverge
EUR/CHF And Bund Yields Can Continue To Diverge
EUR/CHF And Bund Yields Can Continue To Diverge
The Swiss economy can tolerate an appreciating CHF, but can it withstand higher interest rates? We believe so. Switzerland is a net creditor nation, but its domestic non-financial debt is also extremely elevated. Thus, the Swiss economy is vulnerable to higher rates, especially the housing market (Chart 11). Nonetheless, internal adjustments will soften the blow and increase affordability. Of note, property speculation in Switzerland has decreased in response to macroprudential measures. Growth in rental housing prices, which usually constitute the bulk of investment homes, has collapsed, but the price of owner-occupied homes has proven more robust (Chart 12). A cap on the percentage of secondary homes in any Canton as well as tighter lending standards have also helped. In a renewed update to its Financial Stability Report, Fritz Zurbrügg, Vice Chairman of the Governing Board, suggests that Swiss banks are well capitalized, especially given the recent reactivation of the countercyclical capital buffer. Chart 11Higher Rates Are A Risk For Swiss Real Estate
Higher Rates Are A Risk For Swiss Real Estate
Higher Rates Are A Risk For Swiss Real Estate
Chart 12Some Adjustment Already In Investment Home Prices
Some Adjustment Already In Investment Home Prices
Some Adjustment Already In Investment Home Prices
In the very near term, demographics might also be a tailwind. The pandemic limited immigration to Switzerland, but the working-age population is rebounding anew (Chart 13), which will create a cushion under housing and support domestic demand. Chart 13A Small Demographic Tailwind For Home Prices
A Small Demographic Tailwind For Home Prices
A Small Demographic Tailwind For Home Prices
Stronger aggregate demand in an inflationary world will justify the need for less monetary accommodation. In a nutshell, the SNB is likely to continue walking the path of “least regrets” like most central banks, by tightening monetary policy to meet its 2% inflation mandate, but pausing if economic conditions warrant.The currency has historically been used as a key tool for calibrating financial conditions. From a fundamental perspective, our PPP models suggest the franc is quite cheap versus the dollar but at fair value versus the euro and sterling. This is echoed by Governor Jordan, who no longer views the franc as expensive. Our models adjusts the consumption basket in Switzerland for an apples-to-apples comparison across both the UK and the eurozone (Chart 14). Chart 14AA CHF Is At Fair Value Versus The EUR And GBP
A CHF Is At Fair Value Versus The EUR And GBP
A CHF Is At Fair Value Versus The EUR And GBP
Chart 14BA CHF Is At Fair Value Versus The EUR And GBP
A CHF Is At Fair Value Versus The EUR And GBP
A CHF Is At Fair Value Versus The EUR And GBP
Finally, hedging costs for shorting the franc against the dollar have risen substantially (Chart 15). As such, any short bets on the franc are likely being placed naked. If the Fed ends up tempering its pace of rate hikes next year in response to weaker US activity, short-covering activity is likely to accentuate any pre-existing strength in the CHF. Chart 15Hedging Costs For USD/CHF Carry Trades Have Risen Hedging Costs Are Prohibitive
Hedging Costs For USD/CHF Carry Trades Have Risen Hedging Costs Are Prohibitive
Hedging Costs For USD/CHF Carry Trades Have Risen Hedging Costs Are Prohibitive
Bottom Line: The franc is undervalued against the dollar, and a good hedge against a rise in volatility versus other procyclical currencies. This places the franc in a good “heads I win, tails I don’t loose too much” bet. Swiss interest rates are also likely to climb higher. However, because the franc will do the bulk of the monetary tightening, the SNB is likely to lag the expectations now embedded in the SARON curve.What About Swiss Equities?Despite the cyclical nature of the Swiss economy, Swiss equities are extremely defensive. Swiss stocks have little to do with the domestic economy and are mostly a collection of large multinationals, dominated by the healthcare and consumer staples sectors, which together account for roughly 60% of the Swiss MSCI benchmark.This defensive attribute has created its own problem for Swiss equities. Relative to the Eurozone, the Swiss market has moved massively ahead of profitability, and it is now more expensive than at the apex of the European debt crisis in 2012 (Chart 16). Moreover, the jump in German yields is becoming increasingly problematic for Swiss stocks that historically perform poorly when global interest rates are rising (Chart 17). Chart 16Swiss Stocks Are Expensive
Swiss Stocks Are Expensive
Swiss Stocks Are Expensive
Chart 17A Lost Tailwind
A Lost Tailwind
A Lost Tailwind
In the near term, Swiss equities will only be able to defy the gravitational pull created by demanding valuations and higher yields if global risk aversion remains elevated. However, once global stocks find a floor and Italian spreads begin to narrow, Swiss stocks are likely to underperform massively (Chart 18). It could take a few more weeks before the BTP/Bund spreads narrow as the recent ECB announcement was rather tepid. However, the ECB holding an emergency meeting and issuing a formal statement addressing the problem facing peripheral bond markets suggests that a formal program designed to manage fragmentation risk will emerge before the end of the summer.Beyond their defensive attributes, Swiss stocks also correlate to the Quality Factor. The robust performance of this factor since the turn of the millennium, in Europe and globally, has allowed the Swiss market to greatly outperform Eurozone equities (Chart 19). However, the Quality Factor has begun to underperform, which indicates that the Swiss market is losing another of its underpinnings. Chart 18Near-term, Follow Risk Aversion
Near-term, Follow Risk Aversion
Near-term, Follow Risk Aversion
Chart 19Swiss Stocks Are About Quality
Swiss Stocks Are About Quality
Swiss Stocks Are About Quality
These observations imply that over the next 12 to 18 months, Swiss equities will underperform their Euro Area counterparts. Materials and consumer staples stand out as the two sectors with the most extended valuations relative to their Euro Area competitors, especially since their relative performances have become dissociated from relative profits (Chart 20). They should carry maximum underweights relative to their European counterparts. The healthcare sector is Switzerland’s largest market weight. It is not as expensive relative to the Eurozone as the materials and consumer staples sectors, but it carries enough of a premium that investors should still underweight this sector relative to its eurozone competitor (Chart 21). Chart 20Dangerous Setup For Swiss Materials and Staples
Dangerous Setup For Swiss Materials and Staples
Dangerous Setup For Swiss Materials and Staples
Chart 21The Swiss Heavyweight Is Becoming Pricey
The Swiss Heavyweight Is Becoming Pricey
The Swiss Heavyweight Is Becoming Pricey
Bottom Line: The defensive nature of the Swiss market has allowed for a large outperformance over European equities. However, the Swiss market is now very expensive on a relative basis, and it is vulnerable to higher interest rates. While global risk aversion can still buoy the Swiss market in the near term, conditions are falling into place for Swiss stocks to underperform their Eurozone counterpart over a 12-to-18 month window. Materials and consumer staples are the sectors mostly likely to experience a large underperformance relative to their Euro Area competitors, followed by the healthcare sector. Investment ConclusionsVolatility in FX markets is likely to remain elevated, as witnessed by the reaction of a full circle of central bank meetings this week.Policy convergence remains a good bet for interest rate curves and currency pairs. The SNB surprised markets by raising interest rates by 50 bps, to -0.25%, the first hike since 2007 (Chart 1).Higher volatility will continue to buoy the Swiss franc in the short run.Structural appreciation in the franc is also likely over the coming decades.Swiss stocks often perform well during economic downturns, but they are not particularly cheap, and vulnerable to higher interest rates. Investors should only overweight Swiss stocks if they expect more significant downside to global stocks.Valuation favors the franc versus the dollar. However, EUR/CHF and GBP/CHF are closer to fair value. CHF/JPY is expensive; hence the yen is a better hedge for downside economic surprises. Go short CHF/JPY as a trade.BCA’s Foreign Exchange Strategy was short CHF/SEK at 10.2 with stop loss at 10.5. That stop was hit overnight, triggering a loss of -3.3%. Stand aside for now. Chester NtoniforForeign Exchange Strategistchestern@bcaresearch.comMathieu Savary Chief European StrategistMathieu@bcaresearch.com
Executive Summary Structural Tailwinds For The Franc
Structural Tailwinds For The Franc
Structural Tailwinds For The Franc
Volatility in FX markets is likely to remain elevated, as witnessed by the reaction of a full circle of central bank meetings this week. Policy convergence remains a good bet for interest rate curves and currency pairs. The SNB surprised markets by raising interest rates by 50 bps, to -0.25%, the first hike since 2007. Higher volatility will continue to buoy the Swiss franc in the short run. Structural appreciation in the franc is also likely over the coming decades (Feature Chart). Swiss stocks often perform well during economic downturns, but they are not particularly cheap, and are vulnerable to higher interest rates. Investors should only overweight Swiss stocks if they expect more significant downside to global stocks. Valuation favors the franc versus the dollar. However, EUR/CHF and GBP/CHF are closer to fair value. CHF/JPY is expensive; hence, the yen is a better hedge for downside economic surprises. Go short CHF/JPY as a trade. BCA’s Foreign Exchange Strategy was short CHF/SEK at 10.2 with stop loss at 10.5. That stop was hit overnight, triggering a loss of -3.3%. Stand aside for now. Bottom Line: Favor the franc over the short term against other pro-cyclical currencies, with a view to downgrade CHF when it becomes evident that economic growth is bottoming. Any further bout of Swiss equity outperformance, prompted by global risk aversion, offers an attractive selling opportunity versus Eurozone stocks. Feature Chart 1The SNB Has Capitulated To Rising Inflation
The SNB Has Capitulated To Rising Inflation
The SNB Has Capitulated To Rising Inflation
Volatility in FX markets is likely to remain elevated. This week, the Fed delivered its first 75 bps interest rate hike since 1994. It also increased its expected year-end level for the Fed Funds rate to 3.4% from 1.9%, and to 3.8% from 3.4% at the end of 2023. The FX market had been warming up to a hawkish surprise, but the dollar surged on the news, hitting a fresh two-decade high of 105.5, before later reversing gains. Meanwhile, the European Central Bank (ECB) held an emergency meeting on Wednesday, to try to mitigate the rise in Italian yields, which hit as high as 4.2% on Tuesday, or 243 bps over German 10-year yields. The subsequent statement released by the Governing Council offered no concrete details. Yes, the reinvestments of the proceeds from maturing debt in the Pandemic Emergency Purchase Program (PEPP) will flow mostly to peripheral markets, but investors want clarity on the nature of the long-awaited policy plan to tackle fragmentation risk in the Euro Area. As a result, peripheral bond markets will remain fragile until a bold program comes to fruition. To cement currency volatility this week, SNB Governor Thomas Jordan surprised markets by raising interest rates by 50 bps in Switzerland, to -0.25%, the first hike since the Global Financial Crisis (Chart 1). The negative interest rate threshold for sight deposits was also lowered, a move encouraging banks to pack reserves at the SNB. The Bank of England also raised interest rates in line with market expectations. The move initially disappointed GBP bulls, but sterling is holding above our 1.20 floor. An environment of monetary policy uncertainty, rising recession risks in response to high inflation, and the potential for central bank policy mistakes bodes well for safe-haven assets. In Europe, the market with the strongest defensive profile is Switzerland. In this report, we address whether investors should bet on continued appreciation of the franc and an outperformance of Swiss stocks, especially now that the SNB has turned hawkish. Switzerland Versus The World Global economic growth is slowing and a small/open economy like Switzerland’s has not been spared. The KOF economic barometer, a key leading indicator for Swiss GDP growth, has collapsed over the past twelve months from 144 to 97 as global industrial activity decelerated (Chart 2). Despite softening growth, global inflation refuses to decline, forcing central banks worldwide to lean into the slowdown. This threatens to cut the post-pandemic business cycle expansion short. Chart 2The SNB Is Tightening Into A Slowing Economy
The SNB Is Tightening Into A Slowing Economy
The SNB Is Tightening Into A Slowing Economy
Surprisingly, the Swiss economy is generally performing better than the rest of Europe. Historically, Swiss economic performance is procyclical due to the large share of exports within its GDP. Hence, a slowdown in global manufacturing often creates a large threat to Swiss growth. Going forward, can the Swiss economy diverge from that of the rest of the world (Chart 3)? Such a divergence is not probable, but a few factors will protect the Swiss economy: Switzerland still has one of the lowest policy rates in the G10, even after today’s 50bps interest rate increase. This has tremendously helped ease monetary conditions. Our monetary gauge is at its most accommodative level in over two decades (Chart 4). Chart 3The Swiss Economy Is Procyclical
The Swiss Economy Is Procyclical
The Swiss Economy Is Procyclical
Chart 4Swiss Monetary Conditions Are Still Accommodative
Swiss Monetary Conditions Are Still Accommodative
Swiss Monetary Conditions Are Still Accommodative
Swiss inflation remains the lowest in the G10 outside Japan. In Switzerland, the main driver of price increases has been goods, while services inflation remains subdued. Consequently, the SNB has been tolerating an appreciating franc to temper imported inflation (Chart 5), while keeping domestic borrowing costs at very accommodative levels. In its updated forecasts, the SNB now expects a -0.25% interest rate to allow Swiss inflation to moderate to 1.9% in 2023 and 1.6% in 2024. Chart 5Swiss Inflation Is Surprising To The Upside
Swiss Inflation Is Surprising To The Upside
Swiss Inflation Is Surprising To The Upside
Part of the reason Switzerland has low inflation has been the tremendous productivity gains, especially relative to its trading partners (Chart 6). Swiss income-per-capita is elevated, but wage growth has lagged output gains, which limits the risk of a wage-inflation spiral. It is notable that part-time employment continues to dominate job gains, implying that the need for precautionary savings will remain high in Switzerland. Chart 6A Productivity Profile For Switzerland
A Productivity Profile For Switzerland
A Productivity Profile For Switzerland
Higher productivity growth and the elevated national savings leave their footprint on the trade data. The Swiss trade balance is hitting fresh highs, unlike Europe or Japan (Chart 7). This could potentially create a problem for the Swiss economy as it puts upward pressure on the CHF at a time when global manufacturing output is slowing. However, Switzerland specializes in high value-added exports with an elevated degree of complexity, that stand early in global supply chains. These type of goods are likely to remain in high demand in a global environment marked by supply-chain bottlenecks and high-capacity utilization. Chart 7Structural Tailwinds For The Franc
Structural Tailwinds For The Franc
Structural Tailwinds For The Franc
Finally, Switzerland does not import energy to fulfill its electricity production. Hydropower accounts for roughly 61.4% of electricity generation, followed by nuclear power at 28.5%. This has partially insulated Switzerland from the energy shock hurting economic activity and trade balances in the EU. For example, German electricity generation is 28.8% coal and 14.7% natural gas. Bottom Line: The Swiss economy is reopening and is relatively insulated from the Russia-Ukraine conflict. This limits to some degree how closely Switzerland will track the global and European economic slowdown. It creates a departure from the traditional pro-cyclicality of the Swiss economy. The SNB, The SARON Curve, And The Swiss Franc If the Swiss economy surprises to the upside, the case for the SNB to tolerate a rising franc becomes even stronger. The pace of foreign exchange reserve accumulation is already decelerating (Chart 8). Governor Thomas Jordan has been very clear: as global prices rise, the fair value of the franc is also rising, which implies a willingness to tolerate currency strength. In a purchasing power parity framework, higher external inflation makes Swiss goods relatively cheaper. This allows foreigners to bid up the currency. Even with today’s updated pricing, the SNB is still expected to remain among the most dovish central banks in the G10 (Chart 9). If inflationary pressures prove sticky, the SNB will step up its hawkish rhetoric. If inflationary fears subside, then global rates will fall as well, which has usually been a boon for the franc. More specifically, this would be negative for the EUR/CHF cross (Chart 10). Chart 8Less Intervention By The SNB
Less Intervention By The SNB
Less Intervention By The SNB
Chart 9The SARON Curve Has Adjusted Higher
The SARON Curve Has Adjusted Higher
The SARON Curve Has Adjusted Higher
Chart 10EUR/CHF And Bund Yields Can Continue To Diverge
EUR/CHF And Bund Yields Can Continue To Diverge
EUR/CHF And Bund Yields Can Continue To Diverge
The Swiss economy can tolerate an appreciating CHF, but can it withstand higher interest rates? We believe so. Switzerland is a net creditor nation, but its domestic non-financial debt is also extremely elevated. Thus, the Swiss economy is vulnerable to higher rates, especially the housing market (Chart 11). Nonetheless, internal adjustments will soften the blow and increase affordability. Of note, property speculation in Switzerland has decreased in response to macroprudential measures. Growth in rental housing prices, which usually constitute the bulk of investment homes, has collapsed, but the price of owner-occupied homes has proven more robust (Chart 12). A cap on the percentage of secondary homes in any Canton as well as tighter lending standards have also helped. In a renewed update to its Financial Stability Report, Fritz Zurbrügg, Vice Chairman of the Governing Board, suggests that Swiss banks are well capitalized, especially given the recent reactivation of the countercyclical capital buffer. Chart 11Higher Rates Are A Risk For Swiss Real Estate
Higher Rates Are A Risk For Swiss Real Estate
Higher Rates Are A Risk For Swiss Real Estate
Chart 12Some Adjustment Already In Investment Home Prices
Some Adjustment Already In Investment Home Prices
Some Adjustment Already In Investment Home Prices
In the very near term, demographics might also be a tailwind. The pandemic limited immigration to Switzerland, but the working-age population is rebounding anew (Chart 13), which will create a cushion under housing and support domestic demand. Chart 13A Small Demographic Tailwind For Home Prices
A Small Demographic Tailwind For Home Prices
A Small Demographic Tailwind For Home Prices
Stronger aggregate demand in an inflationary world will justify the need for less monetary accommodation. In a nutshell, the SNB is likely to continue walking the path of “least regrets” like most central banks, by tightening monetary policy to meet its 2% inflation mandate, but pausing if economic conditions warrant. The currency has historically been used as a key tool for calibrating financial conditions. From a fundamental perspective, our PPP models suggest the franc is quite cheap versus the dollar but at fair value versus the euro and sterling. This is echoed by Governor Jordan, who no longer views the franc as expensive. Our models adjusts the consumption basket in Switzerland for an apples-to-apples comparison across both the UK and the eurozone (Chart 14). Chart 14AA CHF Is At Fair Value Versus The EUR And GBP
A CHF Is At Fair Value Versus The EUR And GBP
A CHF Is At Fair Value Versus The EUR And GBP
Chart 14BA CHF Is At Fair Value Versus The EUR And GBP
A CHF Is At Fair Value Versus The EUR And GBP
A CHF Is At Fair Value Versus The EUR And GBP
Finally, hedging costs for shorting the franc against the dollar have risen substantially (Chart 15). As such, any short bets on the franc are likely being placed naked. If the Fed ends up tempering its pace of rate hikes next year in response to weaker US activity, short-covering activity is likely to accentuate any pre-existing strength in the CHF. Chart 15Hedging Costs For USD/CHF Carry Trades Have Risen Hedging Costs Are Prohibitive
Hedging Costs For USD/CHF Carry Trades Have Risen Hedging Costs Are Prohibitive
Hedging Costs For USD/CHF Carry Trades Have Risen Hedging Costs Are Prohibitive
Bottom Line: The franc is undervalued against the dollar, and a good hedge against a rise in volatility versus other procyclical currencies. This places the franc in a good “heads I win, tails I don’t loose too much” bet. Swiss interest rates are also likely to climb higher. However, because the franc will do the bulk of the monetary tightening, the SNB is likely to lag the expectations now embedded in the SARON curve. What About Swiss Equities? Despite the cyclical nature of the Swiss economy, Swiss equities are extremely defensive. Swiss stocks have little to do with the domestic economy and are mostly a collection of large multinationals, dominated by the healthcare and consumer staples sectors, which together account for roughly 60% of the Swiss MSCI benchmark. This defensive attribute has created its own problem for Swiss equities. Relative to the Eurozone, the Swiss market has moved massively ahead of profitability, and it is now more expensive than at the apex of the European debt crisis in 2012 (Chart 16). Moreover, the jump in German yields is becoming increasingly problematic for Swiss stocks that historically perform poorly when global interest rates are rising (Chart 17). Chart 16Swiss Stocks Are Expensive
Swiss Stocks Are Expensive
Swiss Stocks Are Expensive
Chart 17A Lost Tailwind
A Lost Tailwind
A Lost Tailwind
In the near term, Swiss equities will only be able to defy the gravitational pull created by demanding valuations and higher yields if global risk aversion remains elevated. However, once global stocks find a floor and Italian spreads begin to narrow, Swiss stocks are likely to underperform massively (Chart 18). It could take a few more weeks before the BTP/Bund spreads narrow as the recent ECB announcement was rather tepid. However, the ECB holding an emergency meeting and issuing a formal statement addressing the problem facing peripheral bond markets suggests that a formal program designed to manage fragmentation risk will emerge before the end of the summer. Beyond their defensive attributes, Swiss stocks also correlate to the Quality Factor. The robust performance of this factor since the turn of the millennium, in Europe and globally, has allowed the Swiss market to greatly outperform Eurozone equities (Chart 19). However, the Quality Factor has begun to underperform, which indicates that the Swiss market is losing another of its underpinnings. Chart 18Near-term, Follow Risk Aversion
Near-term, Follow Risk Aversion
Near-term, Follow Risk Aversion
Chart 19Swiss Stocks Are About Quality
Swiss Stocks Are About Quality
Swiss Stocks Are About Quality
These observations imply that over the next 12 to 18 months, Swiss equities will underperform their Euro Area counterparts. Materials and consumer staples stand out as the two sectors with the most extended valuations relative to their Euro Area competitors, especially since their relative performances have become dissociated from relative profits (Chart 20). They should carry maximum underweights relative to their European counterparts. The healthcare sector is Switzerland’s largest market weight. It is not as expensive relative to the Eurozone as the materials and consumer staples sectors, but it carries enough of a premium that investors should still underweight this sector relative to its eurozone competitor (Chart 21). Chart 20Dangerous Setup For Swiss Materials and Staples
Dangerous Setup For Swiss Materials and Staples
Dangerous Setup For Swiss Materials and Staples
Chart 21The Swiss Heavyweight Is Becoming Pricey
The Swiss Heavyweight Is Becoming Pricey
The Swiss Heavyweight Is Becoming Pricey
Bottom Line: The defensive nature of the Swiss market has allowed for a large outperformance over European equities. However, the Swiss market is now very expensive on a relative basis, and it is vulnerable to higher interest rates. While global risk aversion can still buoy the Swiss market in the near term, conditions are falling into place for Swiss stocks to underperform their Eurozone counterpart over a 12-to-18 month window. Materials and consumer staples are the sectors mostly likely to experience a large underperformance relative to their Euro Area competitors, followed by the healthcare sector. Investment Conclusions Volatility in FX markets is likely to remain elevated, as witnessed by the reaction of a full circle of central bank meetings this week. Policy convergence remains a good bet for interest rate curves and currency pairs. The SNB surprised markets by raising interest rates by 50 bps, to -0.25%, the first hike since 2007 (Chart 1). Higher volatility will continue to buoy the Swiss franc in the short run. Structural appreciation in the franc is also likely over the coming decades. Swiss stocks often perform well during economic downturns, but they are not particularly cheap, and vulnerable to higher interest rates. Investors should only overweight Swiss stocks if they expect more significant downside to global stocks. Valuation favors the franc versus the dollar. However, EUR/CHF and GBP/CHF are closer to fair value. CHF/JPY is expensive; hence the yen is a better hedge for downside economic surprises. Go short CHF/JPY as a trade. BCA’s Foreign Exchange Strategy was short CHF/SEK at 10.2 with stop loss at 10.5. That stop was hit overnight, triggering a loss of -3.3%. Stand aside for now. Chester Ntonifor Foreign Exchange Strategist chestern@bcaresearch.com Mathieu Savary Chief European Strategist Mathieu@bcaresearch.com Trades & Forecasts Strategic View Cyclical Holdings (6-18 months) Tactical Holdings (0-6 months) Forecast Summary
Executive Summary Was FAANGM A Bubble?
Was FAANGM A Bubble?
Was FAANGM A Bubble?
US inflation has become broad-based, and the labor market is very tight. Wages are a lagging variable, and they will be rising rapidly in the coming months, even as the economy slows. Although US growth will be slowing and global trade will be contracting, the Fed will remain hawkish over the coming months. This is an unprecedented environment and is negative for global and EM risk assets. The US trade-weighted dollar will continue to appreciate as long as the Fed sounds and acts in a hawkish manner and global trade contracts. Consistent with a US dollar overshoot, EM financial markets will undershoot. Even though EM equity and local bond valuations have become attractive, their fundamentals are still negative. A buying opportunity in EM will occur when the Fed makes a dovish pivot and China stimulates more aggressively. We reckon that these conditions will fall into place sometime in H2 this year. Bottom Line: For now, we recommend that investors stay defensive in absolute terms and underweight EM within global equity and credit portfolios. The dollar has more upside in the near term but a major buying opportunity in EM local currency bonds is approaching. Feature Last week, after a two and a half year hiatus, I travelled to Europe to visit clients. I also took the opportunity catch up with Ms. Mea, a global portfolio manager and a long-standing client. Prior to the pandemic, we met regularly to discuss global macro and financial markets. She was happy to resume our in-person meetings, and we met in Amsterdam over dinner last Friday. This report provides the key points of our conversation for the benefit of all clients. Ms. Mea: I am very happy that we are again able to meet in person. Video meetings are good, but in-person meetings are better. One’s body language often gives away their level of confidence regarding investment recommendations. Answer: Agreed. My meetings with clients this week have reminded me of the value of in-person meetings. Chart 1Our Calls On Various EM Asset Classes
Our Calls On Various EM Asset Classes
Our Calls On Various EM Asset Classes
Ms. Mea: Before our meeting I reviewed the evolution of your investment views since the pandemic erupted. Let me try to summarize them, and correct me if I miss something. Even though you upgraded your medium-term view on Chinese growth in May 2020 due to the stimulus, you remained skeptical of the rally in global risk assets. In Q2 2020, you upgraded your stance on EM bonds and in July 2020 you lifted the recommended allocation to EM equities and currencies from underweight to neutral (Chart 1). In the summer and fall of 2020, you were still wary of a deflationary relapse in developed economies. However, since January 2021, your outlook for the US shifted drastically to overheating and inflation. Since then, you have been very vocal about inflation risks in the US. At the same time, you have been warning about a major slowdown in Chinese growth. Regarding financial markets, in March 2021, you downgraded EM stocks and bonds to underweight and recommended shorting select EM currencies versus the US dollar (Chart 1). I should say that your call on US inflation and China’s slowdown have played out very well over the past 18 months. Let’s zero in on US inflation. It was just last year that many investors and analysts claimed that inflation is good for stocks because it helps their top line growth. Why then have global markets panicked? Chart 2Record Wealth Destruction In US Stocks And Bonds
Record Wealth Destruction In US Stocks And Bonds
Record Wealth Destruction In US Stocks And Bonds
Answer: Not many people have a deep understanding of inflation and its impact on financial markets because most investors lack experience in navigating financial markets during an inflation era. In fact, the US equity and bond market selloffs of the past 12 months have wiped out about $12 trillion and $3.5 trillion off their respective market value. This adds up to a combined $15.5 trillion or about 60% of US GDP and already exceeds the wipeouts during the March 2020 crash and all other bear markets (Chart 2). The way we think about macro and markets must change in an inflation regime. In our seminal February 25, 2021 Special Report titled A Paradigm Shift In The Stock-Bond Relationship, we made the case that the US economy and its financial markets were about to enter a new paradigm of higher inflation. We argued that US core CPI would spike well above 2% and US share prices and US government bond yields would become negatively correlated. A similar paradigm shift occurred in 1966 (Chart 3). In short, we argued that the era of low US inflation was over, and as a result, equities and bonds would selloff simultaneously. This will remain the roadmap for investors as long as core inflation is high. Chart 3A Paradigm Shift: US Stock Prices And Bond Yields Correlation Over Decades
A Paradigm Shift: US Stock Prices And Bond Yields Correlation Over Decades
A Paradigm Shift: US Stock Prices And Bond Yields Correlation Over Decades
Ms. Mea: Do you think the Fed is behind the curve? Answer: Yes, the Fed has fallen behind the curve, and, as we have repeatedly argued over the past 12 months, the US inflation genie is out of the bottle. There is a lot of confusion in the global investment community about how we should think about inflation, and about how and when the various measures of inflation matter. As consumers, we care about headline inflation because it affects our purchasing power. So, changes in all goods and service prices, including energy and food, matter to consumers. However, this does not mean that central banks should target and set policy based on headline inflation. Rather, central banks should target genuine broad-based inflation in the economy before it becomes entrenched. Ms. Mea: Can you explain why in certain cases a surge in energy, food and other prices leads to entrenched inflation but in other cases it does not? Answer: Let me give you an example. When consumers experience rapidly rising food and energy prices, they will likely demand faster wage growth from their employers. If businesses are enjoying strong demand for their goods/services and facing a tight labor market, they might have little choice but to agree to pay raises to sustain their business. Companies will then attempt to protect their profit margins by hiking their selling prices. Households may accept higher prices given their incomes are rising. This dynamic could cause inflation to become broad-based and entrenched. In this case, central banks should lift rates to slow the economy materially and cool off the labor market to end the wage-price spiral. If employees fail to negotiate hefty pay raises, odds are that inflation will not become broad-based. The more households spend on energy and food, the less income they will have to spend on other items, causing their discretionary spending to contract. In this case, there is no rush for central banks to tighten policy. If monetary authorities tighten materially, the economy will experience a full-fledged recession. In short, wage dynamics will determine whether inflation becomes broad-based. Labor market conditions will ultimately dictate this outcome. Ms. Mea: But why are wages more important than the price of fuel or food in determining whether inflation becomes broad-based? Answer: To be technically correct, unit labor costs, not wages, are key to inflation dynamics. Unit labor cost = (wage per hour) / (productivity). Productivity is output per hour. Given that labor is the largest cost component of US businesses, unit labor costs will swell and profit margins will shrink when salaries rise faster than productivity. CEOs and business owners always do their best to protect the their profit margins. Thus, accelerating unit labor costs will lead them to raise their selling prices. In the wake of wage gains, consumers might accept higher goods and service prices. If they do and go on to demand even higher wages, the economy will enter a wage-price spiral. This is why wage costs, more specifically unit labor costs, are the most important variable to monitor. If high energy and food prices lead employees to demand faster wage growth from their employers, and if they are granted wage increases above and beyond their productivity advances, inflation will become more broad-based and genuine. If consumers push back against higher prices, i.e., reduce their spending, corporate profits will plunge, and companies will freeze investment and lay off employees. Wages will slow and inflation will wane. Ms. Mea: Are all economies currently experiencing a wage-price spiral? Answer: The US and some other countries have been experiencing a wage-price spiral over the past 12 months. In other countries, including many developing economies, a wage-price spiral is currently absent. In the US, labor demand exceeds supply by the widest margin since 1950 (Chart 4). The upshot is that wages will continue to rise in response to persistently high inflation (Chart 5). Chart 4US Labor Demand Is Exceeding Labor Supply By The Widest Margin Since 1950
US Labor Demand Is Exceeding Labor Supply By The Widest Margin Since 1950
US Labor Demand Is Exceeding Labor Supply By The Widest Margin Since 1950
Chart 5US Wage Growth Is Already Very High
US Wage Growth Is Already Very High
US Wage Growth Is Already Very High
Wages in the US are currently rising at a rate of 6-6.5% or so. US productivity growth is around 1.5%. As a result, unit labor costs are rising at a 4.5-5% annual rate, the fastest rate for corporate America in the past 40 years (Chart 6). As Chart 6 demonstrates, unit labor costs have been instrumental in defining core CPI fluctuations over the past 70 years in the US. Chart 6US Unit Labor Costs Are Rising At The Fastest Rate Since 1982
US Unit Labor Costs Are Rising At The Fastest Rate Since 1982
US Unit Labor Costs Are Rising At The Fastest Rate Since 1982
Chart 7US Core Of Core Inflation Is High And Not Falling
US Core Of Core Inflation Is High And Not Falling
US Core Of Core Inflation Is High And Not Falling
In short, both surging unit labor costs and the acceleration of super core CPI measures like trimmed-mean CPI and median CPI suggest that US inflation has become broad-based and a wage-inflation spiral has taken hold in the US (Chart 7). Critically, wages are a lagging variable and are not reset all at once for all employees. American employees will continue to demand substantial wage hikes both to offset the last 12 months of lost purchasing power and to protect their purchasing power for the next 12 months. Hence, we will be witnessing faster wage growth in the coming months even as the economy slows. For many continental European economies and for several EM economies, wage growth is still weak. Chart 8 illustrates that nominal wage growth in India, Indonesia, China and Mexico are very subdued. Sluggish wage gains in emerging economies are consistent with the profile of their domestic demand. Domestic demand in these large developing economies remains extremely weak. In many cases, the level of domestic demand in real terms is still below its pre-pandemic level (Chart 9). Chart 8EM Wages Are Very Tame
EM Wages Are Very Tame
EM Wages Are Very Tame
Chart 9EM Domestic Demand Is Depressed
EM Domestic Demand Is Depressed
EM Domestic Demand Is Depressed
In China, deflation, rather than inflation, is the main economic threat. Headline and core inflation are within a 1-2% range (Chart 10), domestic demand is very weak, and the unemployment rate has risen in the past 12 months. Chart 10China's Inflation Is Subdued
China's Inflation Is Subdued
China's Inflation Is Subdued
Ms. Mea: Do you expect the US economy to contract? Answer: US growth will decelerate substantially, and certain segments of the economy could shrink for a couple of quarters. My expectation is that US corporate profits will contract materially. Slowing top line growth, narrowing profit margins, shrinking global trade and a strong dollar are all major headwinds for the S&P 500 EPS. EM EPS are also heading towards a major contraction. This is why I view EM fundamentals as negative even though EM valuations have become attractive. Ms. Mea: You have recently written that global trade volumes are about to contract. What is your rationale and is there any evidence that this is already happening? Answer: US and EU demand for consumer goods ex-autos has been booming over the past two years. Households have overspent on goods ex-autos (Chart 11). Given that their disposable income is contracting in real terms and a preference to spend on services, households will markedly curtail their purchases of consumer goods in the coming months. This will hurt global manufacturing in general, and emerging Asia in particular. Some forward-looking indicators are already signaling a contraction in global trade: US retail inventories (in real terms) have swelled (Chart 12, top panel). US retailers will dramatically reduce their orders. Chart 11Global Trade Volumes Will Shrink In H2 2022
Global Trade Volumes Will Shrink In H2 2022
Global Trade Volumes Will Shrink In H2 2022
Chart 12US Import Volumes Are Set To Contract
US Import Volumes Are Set To Contract
US Import Volumes Are Set To Contract
Besides, US railroad carload is already shrinking, signaling reduced goods shipments (Chart 12, bottom panel). Taiwanese shipments to China lead global trade and they point to an impending slump (Chart 13, top panel). Also, the Taiwanese manufacturing shipments-to-inventory ratio has dropped below 1 (Chart 13, bottom panel). Finally, industrial metal prices are breaking down despite easing lockdowns in China and continued sanctions on Russia (Chart 14). This is a sign of downshifting global manufacturing. Chart 13A Red Flag For Global Trade
A Red Flag For Global Trade
A Red Flag For Global Trade
Chart 14Industrial Metal Prices Are Breaking Down
Industrial Metal Prices Are Breaking Down
Industrial Metal Prices Are Breaking Down
Ms. Mea: Won’t a global trade contraction push down goods prices and help US inflation? Answer: Correct, it will bring down US goods inflation but not services inflation. Importantly, as we discussed above, US inflation has already spilled into wages and has become broad-based. Plus, it is hovering well above the Fed’s target. Hence, the Fed cannot dial down its hawkishness now, even if goods price inflation drops significantly. In brief, even though US growth will be slowing and global trade will be contracting over the coming months, the Fed is likely to remain hawkish. This is an unprecedented environment and is negative for global and EM risk assets. Ms. Mea: What are the financial market implications of entrenched inflation in the US and the lack of genuine inflationary pressures in many emerging economies? Answer: As long as the Fed sounds and acts in a hawkish manner and/or global trade contracts, the US trade-weighted dollar will continue to appreciate. The greenback is a countercyclical currency and rallies when global trade slumps. On the whole, the USD will likely overshoot in the near run. Consistent with a US dollar overshoot, EM financial markets will undershoot. Even though investor sentiment on EM equities and USD bonds is very low (Chart 15), a final capitulation selloff is still likely. In short, EM valuation and positioning are positive for future potential returns yet their fundamentals (business cycle, profits, return on capital, etc.) are still negative. A buying opportunity in EM will emerge when the Fed makes a dovish pivot, China stimulates more aggressively, and EM equity and bond valuations improve further. We reckon that these conditions will fall into place sometime in H2 this year. If the Fed turns dovish early without taming US inflation, it will fall behind the inflation curve and the US dollar will begin its bear market. Investors will respond by embracing EM financial assets. EM local currency bonds in particular offer value (Chart 16). Prudent macro policies and the lack of wage pressures entail a good medium-to-long term opportunity in EM local currency bonds. Chart 15Investor Sentiment On EM Stocks And USD Bonds Is Low
Investor Sentiment On EM Stocks And USD Bonds Is Low
Investor Sentiment On EM Stocks And USD Bonds Is Low
Chart 16US TIPS Yields Should Roll Over For EM Local Bond Yields To Decline
US TIPS Yields Should Roll Over For EM Local Bond Yields To Decline
US TIPS Yields Should Roll Over For EM Local Bond Yields To Decline
As EM currencies put in a bottom, local yields will come down. This will help their equity markets. Ms. Mea: Speaking of a capitulation selloff, how far can it go? Both for EM stocks as well as the S&P 500? Chart 17S&P500: Where Is Technical Support Line?
S&P500: Where Is Technical Support Line?
S&P500: Where Is Technical Support Line?
Answer: As long as US bond yields and oil prices do not start falling on a consistent basis, the S&P 500 will remain under selling pressure. Technicals can help us gauge the likely magnitude of the move. The S&P 500 has dropped to a major technical support, but it will likely be broken. The next support is around 3100-3200 (Chart 17). The EM equity index is sitting on a technical support now (Chart 18). The next support level is 15-17% below the current one. Chart 18EM Stocks in USD Terms Could Drop Another 15%
EM Stocks in USD Terms Could Drop Another 15%
EM Stocks in USD Terms Could Drop Another 15%
Critically, US equity investors should also consider whether the US equity bull market that has been in place since 2009 is over. If it is, then the S&P 500 bear market could last long, and prices could drop significantly. Chart 19Was FAANGM A Bubble?
Was FAANGM A Bubble?
Was FAANGM A Bubble?
A few observations that investors should keep in mind: First, over the past 12 years, FAANGM stocks have followed the profile of the Nasdaq 100 (Chart 19). In short, FAANGM stocks have risen as much as the Nasdaq 100 index did in the 1990s. Second, when retail investors rush into an asset class, it often signals the final phase of the bull market. Once the bull market ends, the ensuing bear market is vicious. The behavior of tech/internet stocks and the broader S&P 500 fits this profile extremely well. For several years after the Lehman crash, individual investors were hesitant to buy US stocks. However, the resilience of US equities led to a buy the dip mentality in 2019-20. Retail investors joined the equity party en masse in early 2020. The post retail frenzy hangover is usually very painful and prolonged. Based on this roadmap, it seems that the 2020-21 retail-driven rally was the final upleg in the S&P 500 bull market. By extension, we have entered a bear market that could be vicious and extended. All the excesses of the 10-year FAANGM and S&P500 bull markets will need to be worked out before a new bull market emerges. Finally, a high inflation regime raises the bar for the Fed to rescue the stock market. This also entails lower equity multiples than we have in the S&P500 now. Ms. Mea: What do you make of EM’s recent outperformance versus DM stocks? When will you upgrade EM versus DM? Answer: Indeed, EM stocks have recently outperformed DM stocks. We might be witnessing a major transition in global equity market leadership. We have held for some time that an equity leadership change from the US to the rest of the world and from TMT stocks to other segments of the global equity market would likely take place during or following a major market selloff. The ongoing equity bear market seems to be exactly that catalyst. Chart 20For EM Equities To Outperform, USD Needs To Weaken
For EM Equities To Outperform, USD Needs To Weaken
For EM Equities To Outperform, USD Needs To Weaken
If the S&P 500 bull market is over, the global equity leadership will also change away from US and TMT stocks to other stock markets and sectors. That said, to upgrade EM stocks, we need to change our view on the USD because EM relative equity performance versus DM closely tracks the inverted trade-weighted US dollar (Chart 20). In the near term, we believe the greenback has more upside potential. In particular, Asian currencies and equity markets cannot outperform when the Fed is hawkish and global trade is contracting. Latin American currencies have benefited since early this year from the spike in commodity prices. However, worries about a US recession, a strong dollar and a lack of strong recovery in the Chinese economy will push industrial metal prices lower. As shown in Chart 14 above, industrial metal prices are breaking down. This is a bad omen for Latin American markets. On the whole, we will likely be upgrading EM versus DM later this year. For now, we recommend that investors stay defensive and underweight EM within global equity and credit portfolios. We also continue to short the following currencies versus the USD: ZAR, COP, PEN, PLN, PHP and IDR; as well as HUF vs. CZK, and KRW vs. JPY. A major buying opportunity in local currency bonds is approaching. Arthur Budaghyan Chief Emerging Markets Strategist arthurb@bcaresearch.com
Executive Summary
Does Powell Need To Channel His Inner Volcker?
Does Powell Need To Channel His Inner Volcker?
Economic growth is now a casualty, and not a driver, of monetary policy choices. Inflation is dictating where central banks are taking interest rates. Our baseline view remains that core US inflation will cool by enough on its own without the need for the Fed to deliver a policy-induced recession. However, the odds of the latter have increased after the upside surprise in the May US CPI report. The ECB has been dragged into the same morass as other major central banks – tightening policy because of soaring inflation, despite broad-based signs of sluggish economic growth. We still see the pricing of cumulative rate hikes in the euro area as being too aggressive, even after last week’s clear announcement from the ECB that a string of future rate hikes was coming. With the ECB also announcing an end to its QE program, but offering no details on a replacement, markets have been given the green light to push Italian yields/spreads higher (and the euro lower) until there is an ECB response to market fragmentation in European sovereign debt. Bottom Line: The Fed is still more likely than the ECB to follow through on rate hikes discounted in US and European interest rate curves - position for renewed widening of the Treasury-Bund spread. Italian bond yields will remain under upward pressure until the contours of an ECB plan to stabilize Peripheral Spreads alongside rate hikes are revealed – tactically position for a wider BTP-Bund spread. Central Bankers Cannot Worry About Growth … Or Your Investment Portfolio The US consumer price index (CPI) report for May was yet another bond-bearish shock in a year full of them. With US headline US inflation hitting an 41-year high of 8.6%, the Treasury market adjusted bond yields upward to reflect both higher inflation expectations and even more aggressive Fed tightening. Coming only a day after the June European Central Bank (ECB) meeting that provided guidance that a series of rate hikes would begin in July, that could include a 50bp hike at the September meeting, financial markets worldwide moved to price in the risk that policy-induced recessions were the only way to bring down soaring global inflation. The result: global bond yields soared to new highs for the year, while risk assets of all shapes and sizes were hammered. We have our doubts that today’s class of policymakers – especially the Fed - has the stomach to repeat the actions of former Fed Chair Paul Volcker, who famously pushed US interest rates above the double-digit inflation rates of the late 1970s to engineer a deep recession to crush inflation. The starting point of the current tightening cycle is even further behind the curve than during the Volcker era, in terms of “realized” real interest rates, with the 10-year US Treasury yield now over five percentage points below headline US CPI inflation (Chart 1). Related Report Global Fixed Income StrategyAssessing The Risks To Our Main Views Central bankers are now faced with the no-win scenario of pushing nominal policy rates higher to chase soaring inflation in a bid to maintain inflation fighting credibility, regardless of the spillover effects on financial market stability or economic growth expectations. More worryingly, the rate hikes needed to establish that credibility are not only becoming more frequent but larger. 50bps has become the “standard” size for developed market rate hikes. The Fed may have upped the ante with the 75bp hike at yesterday's FOMC meeting. Such is the reality of a funds rate still only at 1.75% but with US inflation pushing toward 9%. The timing of the latest hawkish shifts from the Fed, ECB and others is surprising, looking purely from a growth perspective. The OECD leading economic indicators for the US, euro area and China are slowing, alongside depressed consumer confidence and deteriorating business sentiment (Chart 2). Similar readings are evident in comparable measures in other major economies, both in developed and emerging economies. This would normally be the type of backdrop that would entice central banks to consider easing monetary policy - IF inflation was subdued, which is clearly not the case today. Chart 1Does Powell Need To Channel His Inner Volcker?
Does Powell Need To Channel His Inner Volcker?
Does Powell Need To Channel His Inner Volcker?
In fact, high inflation is the reason why economic sentiment has worsened. Chart 2Worrying Signs For Global Growth
Worrying Signs For Global Growth
Worrying Signs For Global Growth
Consumers see income growth that is lagging inflation, especially for everyday items like gasoline and food. Businesses are seeing input costs rising, especially for labor in an environment of tight job markets. Inflation has become broad-based, across goods, services and wages. This is true for countries that are more advanced in their monetary tightening cycles - the US, Canada and the UK - where inflation rates are remarkably similar (Chart 3). But it is also now true in countries with lower (but still accelerating) inflation rates and where central banks have been slower to tighten monetary conditions, like the euro area and Australia (Chart 4). Chart 3Inflation Turning More 'Domestic' (Services / Wages) Here
Inflation Turning More 'Domestic' (Services / Wages) Here
Inflation Turning More 'Domestic' (Services / Wages) Here
Chart 4Still No Major Services/Wage Inflation Overshoots Here
Still No Major Services/Wage Inflation Overshoots Here
Still No Major Services/Wage Inflation Overshoots Here
For the Fed, assessing the underlying momentum of US inflation, and setting monetary policy accordingly, has become a bit trickier. While headline inflation continues to accelerate in response to rising energy and food prices, core inflation ticked lower in both April and May and now sits at 6.1%, down from 6.5% in March. Longer-term survey-based measures of inflation expectations have been moving steadily higher, with the University of Michigan 5-10 year consumer inflation expectations survey now up to a 14-year high of 3.3% (Chart 5). Yet longer-term market-based inflation expectations have been more stable, with the 10-year TIPS breakeven now at 2.66%, down from the late April peak of 3.02%. There are also some mixed signals visible within the US inflation data. Core goods CPI inflation clocked in at 8.5% in May, down from the recent peak of 12.4% in February 2022, while core services CPI inflation accelerated to a 14-year high of 5.2% in May (Chart 6). A similar divergence can be seen when looking at the Atlanta Fed’s measures of “sticky” and “flexible” price inflation. Core flexible CPI inflation – measuring prices that adjust more rapidly – has fallen from a peak of 19% to 12.3% in May. At the same time, core sticky CPI inflation for prices that are slower to adjust sped up to an 31-year high of 5% in May. Chart 5Some Mixed Inflation Messages For The Fed
Some Mixed Inflation Messages For The Fed
Some Mixed Inflation Messages For The Fed
Chart 6US Inflation Will Eventually Be Lower, But 'Stickier'
US Inflation Will Eventually Be Lower, But 'Stickier'
US Inflation Will Eventually Be Lower, But 'Stickier'
Chart 7Stick With UST-Bund Spread Widening Trades
Stick With UST-Bund Spread Widening Trades
Stick With UST-Bund Spread Widening Trades
In terms of the Fed’s next policy moves, the acceleration of core services (and sticky) inflation means underlying inflation momentum remains strong enough to make it difficult for the Fed to tighten by less than markets are discounting over the next year. Yet the deceleration of core goods (and flexible) inflation, if it continues, can lead to an eventual peak in overall US inflation. This would ease pressure on the Fed to tighten policy more aggressively than markets are expecting to slam the brakes on US economic growth. For nervous markets worried about Fed-induced recession risks, the clear peak in US inflation that we had been expecting has likely been pushed out further into the latter half of 2022. Thus, a significant fall in US Treasury yields that would provide relief to stressed risk assets is unlikely in the near term. Our preferred way to play that upward pressure on US Treasury yields is through an underweight stance on US Treasuries in global bond portfolios, rather than a below-benchmark duration stance. That is particularly true versus German Bunds - the 10-year UST-Bund yield spread is now well below the fair value level from our fundamental valuation model (Chart 7). Bottom Line: It is not clear that the Fed needs to “pull a Volcker” and generate a policy-induced recession to cool off US inflation. However, the Fed is far more likely to hike rates in line with market expectations than the ECB over the next 6-12 months. Stay underweight US Treasuries versus core Europe in global bond portfolios. The ECB Takes The Patient Off Life Support The ECB is finally coming to grips with surging European inflation. At last week’s policy meeting, the ECB Governing Council voted to end new bond buying via the Asset Purchase Program, while also signaling that a 25bp rate hike was on the way in July, with more hikes to follow – perhaps as much as 50bps in September if inflation remains elevated. Chart 8Markets Pricing In A Highly Aggressive ECB
Markets Pricing In A Highly Aggressive ECB
Markets Pricing In A Highly Aggressive ECB
The central bank provided a new set of quarterly economic projections that, unsurprisingly, included significant upward revisions to the inflation forecasts. The 2022 headline HICP inflation forecast was bumped from 5.1% to 6.8%, the 2023 forecast from 2.1% to 3.5% and the 2024 forecast was nudged higher from 1.9% to 2.1%. The projections for core HICP inflation were also increased to 3.3% for 2022, 2.8% for 2023 and 2.3% for 2024. The central bank now expects euro area inflation to stay above its 2% inflation target throughout its forecast period – even with a 20% decline in oil prices, and 36% fall in natural gas prices, built into the projection between 2022 and 2024. A move towards tighter monetary policy has been heralded by our ECB Monitor, which remains elevated largely due to its inflation component (Chart 8). By contrast, the growth component of the Monitor has rolled over and is now at levels consistent with unchanged monetary policy. Yet in the current environment of very elevated inflation, concerns about the economy are taking a back seat to maintaining the ECB’s inflation-fighting credibility. In the relatively young history of the ECB, dating back to the inception of the euro in 1998, there have only been three true hiking cycles that involved multiple interest rate increases: 2000, 2006-08 and 2011. In each case, both growth and inflation were accelerating in a broad-based way across the majority of euro area countries. Today, inflation is surging, with the headline HICP inflation rate hitting 8.1% in May, while core inflation (ex energy and food) is a more subdued but still high 4.4%. Economic growth is decelerating, however, with leading economic indicators now slowing in a majority of euro area countries (Chart 9). Chart 9Coming Up: An Unusual ECB Tightening Cycle That Ignores Growth
Coming Up: An Unusual ECB Tightening Cycle That Ignores Growth
Coming Up: An Unusual ECB Tightening Cycle That Ignores Growth
The ECB’s updated economic growth forecasts were downgraded for this year and next, with real GDP growth now expected to reach 2.8% in 2022 and 2.1% in both 2023 and 2024. Cutting growth forecasts for the current year was inevitable given the uncertainties stemming from the Ukraine war and soaring European energy prices. However, the projected growth rates do seem optimistic in the face of deeply depressed readings on economic sentiment from reliable measures like the ZEW index or the European Commission consumer confidence index, both of which have fallen sharply to levels last seen during the 2020 pandemic shock (Chart 10). Demand for European exports is also sluggish, particularly exports to China which are now flat in year-over-year terms. A similar pattern can be seen in the ECB’s inflation forecasts, which seem too optimistic in projecting lower wage growth and core inflation through 2024, even with the euro area unemployment rate forecasted to stay below 7% - under the OECD’s full employment estimate of 7.7% over the same period (Chart 11). Chart 10Overly Optimistic ECB Growth Forecasts
Overly Optimistic ECB Growth Forecasts
Overly Optimistic ECB Growth Forecasts
Chart 11Overly Optimistic ECB Inflation Forecasts?
Overly Optimistic ECB Inflation Forecasts?
Overly Optimistic ECB Inflation Forecasts?
The ECB is facing the same communications problem as other central banks at the moment. There is a fear of forecasting a major growth slowdown that would scare financial markets, even though that is a necessary condition to help bring down elevated inflation. At the same time, projections of a big decline in inflation that would limit the need for economy-crushing monetary tightening are not credible in the current environment of historically elevated headline inflation with very low unemployment rates. Interest rate markets understand the bind that the ECB finds itself in, and have moved to price in a very rapid jump in policy rates over the next 1-2 years. The 1-month OIS rate, 2-years forward is now at 2.5%, a high level compared to estimates of the neutral ECB policy rate, which lies between 1-1.5%. Core European bond yields have moved up alongside those rising rate expectations, with the 10-year German bund yield now at 1.64%, a far cry from the -0.18% yield at the start of 2022. Additional German yield increases will prove to be more difficult in the months ahead. There has already been a major upward adjustment in the inflation expectations component of yields, with the 10-year euro CPI swap rate now up to 2.6% compared to 2% at the start of this year (Chart 12). Importantly, those inflation expectations have stabilized of late, even in the face of high oil prices. Meanwhile, real bond yields, while still negative, have also moved up substantially and are now back to levels that prevailed before the ECB introduced negative policy rates in 2014 (bottom panel). With so much bond-bearish news now priced into core European bond yields, additional yield increases from here would require a more fundamental driver – an upward repricing of terminal interest rate expectations. On that note, the German yield curve is signaling that the terminal rate in the euro area is not much above 1.75%, as that is where bond yield forwards have converged to for both long and short maturity bonds (Chart 13). Chart 12How Much Higher Can Bund Yields Realistically Go?
How Much Higher Can Bund Yields Realistically Go?
How Much Higher Can Bund Yields Realistically Go?
Chart 13Markets Signaling A 1.75% Terminal Rate
Markets Signaling A 1.75% Terminal Rate
Markets Signaling A 1.75% Terminal Rate
Given our view that the neutral rate in Europe is, at best, no more than 1.5%, ECB rate hikes much beyond that level would likely invert a Bund curve that is priced for only a 1.75% terminal rate. An inverted Bund curve would also raise the odds that Europe enters a policy-induced recession – turning a bond bearish outcome into a bond bullish one. Even with the relatively aggressive policy expectations priced into European bond yields, it is still too soon to raise European duration exposure with inflation still accelerating. We prefer maintaining a neutral duration stance until there is a clear peak in realized European inflation – an outcome that would also favor a shift into Bund curve steepeners as the markets price out rate hikes and, potentially, begin to discount future rate cuts. Does The ECB Even Have A Plan For Italian Debt? The ECB seems to have a clear near-term plan on the timing, and even the potential size, of rate hikes. There is far less clarity on how it will deal with stabilizing sovereign bond yields post-APP in the countries that benefitted from ECB asset purchases, most notably Italy. By offering no details on a replacement to APP buying of riskier European debt at last week’s policy meeting, markets were given the green light to test the ECB’s resolve by pushing Italian bond yields higher (and the euro lower). Volatility in both markets will continue until there is a credible ECB response to so-called “market fragmentation” in European sovereign debt (i.e. higher yields and wider spreads versus Bunds in the Periphery). With the benchmark 10-year Italian BTP yield pushing above 4%, the ECB tried to calm markets yesterday by announcing an emergency meeting of the Governing Council to discuss “anti-fragmentation” policy options. The announcement triggered a relief rally in BTP prices, likely fueled by short covering. But the ECB statement was again light on concrete details, only noting that: a) reinvestments from maturing bonds from the now-completed Pandemic Emergency Purchase Program (PEPP) could be used “flexibly” to support stressed parts of the European bond market b) the timeline for ECB researchers to prepare proposals for a “new anti-fragmentation instrument” would be accelerated. We expect the ECB to eventually produce a credible bond buying plan to support Peripheral European bond markets – but only after an “iterative” trial-and-error process where trial balloon proposals are floated and skeptical financial markets respond. Chart 14Stay Cautious On Italian Government Bonds
Stay Cautious On Italian Government Bonds
Stay Cautious On Italian Government Bonds
There is almost certainly some serious horse trading going on within the ECB Governing Council, with inflation hawks demanding more rate hikes in exchange for their support of new plans to deal with market fragmentation. Details such as the size of any new program, the conditions under which it would be activated, and country purchase limits (if any) will need to be ironed out. Internal ECB debates will prolong that trial-and-error process with financial markets, keeping yield/spread/FX volatility elevated in the short-term. On a strategic (6-18 month) time horizon, we see a neutral allocation to Italy in global bond portfolios as appropriate, given the tradeoff between increasingly attractive yields and the uncertain timing of effective ECB market stabilization proposals. On a more tactical horizon (0-6 months), we expect Italian yields and spreads versus Germany to remain under upward pressure until a viable anti-fragmentation program is announced (Chart 14). To play for that move, we are introducing a new position in our Tactical Overlay Trade portfolio, selling 10-year Italy futures and buying 10-year German Bund futures. The details of the new trade, including the specific futures contracts and weightings for the two legs of the trade to make it duration-neutral, can be found in the Tactical Trade table on page 18. As we monitor and discuss this trade in future reports, we will refer to the well-followed 10-year Italy-Germany spread (currently 225bps) to determine targets and stop levels of this bond futures spread trade. We are setting a stop-out on this trade if the 10-year Italy-Germany spread has a one-day close below 200bps, while targeting a potential widening to 275-300bps (the 2018 peak in that spread). Bottom Line: The ECB’s lack of conviction on designing a plan to support Peripheral bond markets during the upcoming period of interest rate hikes will keep upward pressure on Peripheral yields/spreads over the next few months. Robert Robis, CFA Chief Fixed Income Strategist rrobis@bcaresearch.com GFIS Model Bond Portfolio Recommended Positioning Active Duration Contribution: GFIS Recommended Portfolio Vs. Custom Performance Benchmark
Volcker's Ghost
Volcker's Ghost
The GFIS Recommended Portfolio Vs. The Custom Benchmark Index Global Fixed Income - Strategic Recommendations*
Volcker's Ghost
Volcker's Ghost
Tactical Overlay Trades