Economic Growth

In lieu of next week’s report, I will be presenting the quarterly Counterpoint webcast titled ‘Where Is The Groupthink Wrong? (Part 2)’. I do hope you can join. Highlights If a continued surge in the oil price – or other commodity or goods prices – started driving up the 30-year T-bond yield, the markets and the economy would feel the pain. We reiterate that the pain point at which the Fed would be forced to volte-face is only around 30 bps away on the 30-year T-bond, equal to a yield of around 2.4-2.5 percent. That would be a great buying opportunity for bonds. Given the proximity of this pain point, it is too late to short bonds, or for equity investors to rotate into value and cyclical equity sectors. That tactical opportunity has almost played out. On a 6-month and longer horizon, equity investors should prefer long-duration defensive sectors such as healthcare. Chinese long-duration bond yields are on a structural downtrend. Fractal analysis: The Korean won is oversold. Feature Many people have noticed the suspicious proximity of oil price surges to subsequent economic downturns – most recently, the 1999-2000 trebling of crude and the subsequent 2000-01 downturn, and the 2007-2008 trebling of crude and the subsequent 2008-09 global recession. Begging the question, should we be concerned about the trebling of the crude oil price since March 2020? Of course, we know that the root cause of both the 2000-01 downturn and the 2008-09 recession was not the oil price surge that preceded them. As their names make crystal clear, the 2001-01 downturn was the dot com bust and the 2008-09 recession was the global financial crisis. And yet, and yet… while the oil price surge was not the culprit, it was certainly the accessory to both murders, by driving up the bond yield and tipping an already fragile market and economy over the brink. Today, could oil become the accessory to another murder? (Chart I-1) Chart I-1AOil Was The Accessory To The Murder In 2008...
Oil Was The Accessory To The Murder In 2008...
Oil Was The Accessory To The Murder In 2008...
Chart I-1B...Could It Become The Accessory To Another Murder?
...Could It Become The Accessory To Another Murder?
...Could It Become The Accessory To Another Murder?
Oil Is The Accessory To Many Murders Turn the clock back to the 1970s, and it might seem more straightforward that the recession of 1974 was the direct result of the oil shock that preceded it. Yet even in this case, we can argue that oil was the accessory, rather than the true culprit of that murder. It is correct that the specific timing, magnitude, and nature of OPEC supply cutbacks were closely related to geopolitical events – especially the US support for Israel in the Arab-Israeli war of October 1973. Yet as neat and popular as this explanation is, it ignores a bigger economic story: the collapse in August 1971 of the Bretton Woods ‘pseudo gold standard’, which severed the fixed link between the US dollar and quantities of commodities. To maintain the real value of oil, the OPEC countries were raising the price of crude oil well before October 1973. Meaning that while geopolitical events may have influenced the precise timing and magnitude of price hikes, OPEC countries were just ‘staying even’ with the collapsing real value of the US dollar, in which oil was priced. Seen in this light, the true culprit of the recession was the collapse of the Bretton Woods system, and the oil price surge through 1973-74 was just the accessory to the murder (Chart I-2). Chart I-2In 1973-74, OPEC Was Just 'Staying Even' With A Collapsing Real Value Of The Dollar
In 1973-74, OPEC Was Just 'Staying Even' With A Collapsing Real Value Of The Dollar
In 1973-74, OPEC Was Just 'Staying Even' With A Collapsing Real Value Of The Dollar
A quarter of a century later in 1999, the oil price again trebled within a short time span – and by the turn of the millennium, the ensuing inflationary fears had pushed up the 10-year T-bond yield from 4.5 percent to almost 7 percent (Chart I-3). With stocks already looking expensive versus bonds, it was this increase in the bond yield – rather than a decline in the equity earnings yield – that inflated the equity bubble to its bursting point in early 2000 (Chart I-4). Chart I-3In 1999, As Oil Surged, So Did The Bond Yield...
In 1999, As Oil Surged, So Did The Bond Yield...
In 1999, As Oil Surged, So Did The Bond Yield...
Chart I-4...Making Expensive Equities Even More Expensive
...Making Expensive Equities Even More Expensive
...Making Expensive Equities Even More Expensive
To repeat, for the broader equity market, the last stage of the bubble was not so much that stocks became more expensive in absolute terms (the earnings yield was just moving sideways). Rather, stock valuations worsened markedly relative to sharply higher bond yields. Seen in this light, the oil price surge through 1999 was once again the accessory to the murder. Eight years later in 2007-08, the oil price once again trebled with Brent crude reaching an all-time high of $146 per barrel in July 2008. Again, the inflationary fears forced the 10-year T-bond yield to increase, from 3.25 percent to 4.25 percent during the early summer of 2008 (Chart I-5) – even though the Federal Reserve was slashing the Fed funds rate in the face of an escalating financial crisis (Chart I-6). Chart I-5In 2008, As Oil Surged, So Did The Bond Yield...
In 2008, As Oil Surged, So Did The Bond Yield...
In 2008, As Oil Surged, So Did The Bond Yield...
Chart I-6...Even Though The Fed Was Slashing Rates In The Face Of A Financial Crisis
...Even Though The Fed Was Slashing Rates In The Face Of A Financial Crisis
...Even Though The Fed Was Slashing Rates In The Face Of A Financial Crisis
Suffice to say, driving up bond yields in the summer of 2008 – in the face of the Fed’s aggressive rate cuts and a global financial system teetering on the brink – was not the smartest thing that the bond market could do. On the other hand, neither could it override its Pavlovian fears of the oil price trebling. Seen in this light, the oil price surge through 2007-08 was once again the accessory to the murder. Inflationary Fears May Once Again Lead To Murder Fast forward to today, and the danger of the recent trebling of the oil price comes not from the oil price per se. Instead, just as in 2000 and 2008, the danger comes from its potential to drive up bond yields, which can tip more systemically important economic and financial fragilities over the brink. One such fragility is the extreme sensitivity of highly-valued growth stocks to the 30-year T-bond yield, as explained in The Fed’s ‘Pain Point’ Is Only 30 Basis Points Away. On this note, one encouragement is that while shorter duration yields have risen sharply through October, the much more important 30-year T-bond yield has just gone sideways. A much bigger systemic fragility lies in the $300 trillion global real estate market, as explained in The Real Risk Is Real Estate (Part 2). Specifically, the global real estate market has undergone an unprecedented ten-year boom in which prices have doubled in every corner of the world. Over the same period, rents have risen by just 30 percent, which has depressed the global rental yield to an all-time low of 2.5 percent. Structurally depressed rental yields are justified by structurally depressed 30-year bond yields. Therefore, any sustained rise in 30-year bond yields risks undermining the foundations of the $300 trillion global real estate market (Chart I-7). Chart I-7Structurally Depressed Rental Yields Are Justified By Structurally Depressed 30-Year Bond Yields
Structurally Depressed Rental Yields Are Justified By Structurally Depressed 30-Year Bond Yields
Structurally Depressed Rental Yields Are Justified By Structurally Depressed 30-Year Bond Yields
Nowhere is this truer than in China, where prime real estate yields in the major cities are at a paltry 1 percent. In this context, the recent woes of real estate developer Evergrande are just the ‘canary in the coalmine’ warning of an extremely fragile Chinese real estate sector. This will put downward pressure on China’s long-duration bond yields. As my colleague, BCA China strategist, Jing Sima, points out, “Chinese long-duration bond yields are on a structural downtrend…yields are likely to move structurally to a lower bound.” But it is not just in China. Real estate is at record high valuations everywhere and contingent on no major rise in long-duration bond yields. In the US, there is a tight relationship between the (inverted) 30-year bond yield and mortgage applications for home purchase (Chart I-8), and a tight relationship between mortgage applications for home purchase and building permits (Chart I-9). Thereby, higher bond yields threaten not only real estate prices. They also threaten the act of building itself, an important swing factor in economic activity. Chart I-8The Bond Yield Drives Mortgage Applications...
The Bond Yield Drives Mortgage Applications...
The Bond Yield Drives Mortgage Applications...
Chart I-9...And Mortgage Applications Drive Building Permits
...And Mortgage Applications Drive Building Permits
...And Mortgage Applications Drive Building Permits
To repeat, focus on the 30-year T-bond yield – as this is the most significant driver for both growth stock valuations, and for real estate valuations and activity. To repeat also, the 30-year T-bond yield has been generally well-behaved over the past few months. But if a continued surge in the oil price – or other commodity or goods prices – started driving up the 30-year T-bond yield, the markets and the economy would feel pain. And at some point, this pain would force the Fed to volte-face. We reiterate that this pain point is only around 30 bps away, equal to a yield on 30-year T-bond of around 2.4-2.5 percent – a level that would be a great buying opportunity for bonds. Given the proximity of this pain point, it is too late to short bonds or for equity investors to rotate into value and cyclical equity sectors. That tactical opportunity has almost played out. On a 6-month and longer horizon, equity investors should prefer long-duration defensive sectors such as healthcare. The Korean Won Is Oversold Finally, in this week’s fractal analysis, we note that the Korean won is oversold – specifically versus the Chinese yuan on the 130-day fractal structure of that cross (Chart I-10). Chart I-10The Korean Won Is Oversold
The Korean Won Is Oversold
The Korean Won Is Oversold
Given that previous instances of such fragility have reliably indicated trend changes, this week’s recommended trade is long KRW/CNY, setting the profit target and symmetrical stop-loss at 2 percent. Dhaval Joshi Chief Strategist dhaval@bcaresearch.com Fractal Trading System Fractal Trades 6-Month Recommendations Structural Recommendations Closed Fractal Trades Indicators To Watch - Bond Yields Chart II-1Indicators To Watch - Bond Yields ##br##- Euro Area
Indicators To Watch - Bond Yields - Euro Area
Indicators To Watch - Bond Yields - Euro Area
Chart II-2Indicators To Watch - Bond Yields ##br##- Europe Ex Euro Area
Indicators To Watch - Bond Yields - Europe Ex Euro Area
Indicators To Watch - Bond Yields - Europe Ex Euro Area
Chart II-3Indicators To Watch - Bond Yields ##br##- Asia
Indicators To Watch - Bond Yields - Asia
Indicators To Watch - Bond Yields - Asia
Chart II-4Indicators To Watch - Bond Yields ##br##- Other Developed
Indicators To Watch - Bond Yields - Other Developed
Indicators To Watch - Bond Yields - Other Developed
Indicators To Watch - Interest Rate Expectations Chart II-5Indicators To Watch - Interest Rate Expectations
Indicators To Watch - Interest Rate Expectations
Indicators To Watch - Interest Rate Expectations
Chart II-6Indicators To Watch - Interest Rate Expectations
Indicators To Watch - Interest Rate Expectations
Indicators To Watch - Interest Rate Expectations
Chart II-7Indicators To Watch - Interest Rate Expectations
Indicators To Watch - Interest Rate Expectations
Indicators To Watch - Interest Rate Expectations
Chart II-8Indicators To Watch - Interest Rate Expectations
Indicators To Watch - Interest Rate Expectations
Indicators To Watch - Interest Rate Expectations
Highlights Energy Prices & Bond Yields: Surging energy prices are lifting inflation expectations in the US and Europe, while at the same time dampening consumer confidence amid diminished perceptions of real purchasing power. These conflicting trends are putting central banks in a tricky spot in the near-term, but tightening labor markets will force a more enduring need for dialing back global monetary accommodation in 2022, led by the Fed and the Bank of England. Stay below-benchmark on global duration exposure, favoring euro area government debt over US Treasuries and UK Gilts. High-Yield: Trans-Atlantic junk bond performance has diverged of late, with euro area spreads widening versus the US. This is a temporary distortion created by the pop in oil prices, with the Energy sector that benefits from higher oil prices representing a far greater share of the high-yield universe in the US compared to Europe. Maintain an overweight stance on European high-yield corporates. Feature Chart of the WeekGlobal Bond Yield Breakout?
Global Bond Yield Breakout?
Global Bond Yield Breakout?
It is not easy being an inflation-targeting central bank these days. Soaring energy prices, with the Brent crude benchmark price climbing to a 3-year high of $86/bbl last week and natural gas prices up nearly four-fold year-to-date in Europe. These moves are adding upward pressure to inflation rates already elevated because of disrupted supply chains and rising labor costs. Government bond yields in the developed markets are moving higher in response, driven by rising inflation breakevens and increasing central bank hawkishness that is causing a stir in negative real yields (Chart of the Week). Among the three most important developed economy central banks - the Fed, the ECB and the Bank of England (BoE) – the most forceful signaling of a need for tighter policy is surprisingly coming from Threadneedle Street in London, home to one of the most dovish central banks since the 2008 crisis. Numerous BoE officials, including Governor Andrew Bailey, have strongly hinted that UK rate hikes could begin as soon as next month’s policy meeting. Fed officials have suggested a similar timetable for the start of the QE taper. By contrast, members of the ECB Governing Council have paid lip service to the recent sharp pickup in euro area inflation but, for the most part, have stuck to the view that it will not last long enough to justify a policy response. The relative hawkishness among “The Big Three” central banks fits with our current recommended strategy on global duration exposure, staying below-benchmark, and country allocation, with the largest underweights to US Treasuries and UK Gilts. Should Central Banks Focus More On Inflation Or Growth? Monetary policymakers are in a difficult spot at the moment. Rising energy prices have breathed new life into inflation, and inflation expectations, even as global growth momentum has cooled off somewhat. Given the magnitude and breadth of the global energy price surge – even coal prices in China have shot up 120% since late August - it will be difficult for central bankers to “see through” the inflationary implications and worry more about growth (Chart 2). Rising energy prices are likely to extend the current global inflation upturn that has already gone on for longer than expected because of supply-chain disruptions. This raises the risk that consumers could turn more cautious on spending behavior if they have to devote more of their incomes just to fuel their cars or heat their homes. In the US, this dynamic already appears to be playing out. The acceleration of inflation has broadened out, with the Cleveland Fed’s trimmed mean CPI inflation measure (which removes the most volatile components of the CPI) rising to 3.5% in September (Chart 3, top panel). With US consumers seeing higher prices on a wider range of goods and services, they have raised their inflation expectations. The preliminary October University of Michigan US consumer confidence survey showed that 1-year-ahead inflation expectations rose to a 13-year high of 4.8% (middle panel). Chart 2Pouring Gas On Global Inflation
Pouring Gas On Global Inflation
Pouring Gas On Global Inflation
The New York Fed’s consumer survey showed a similar 1-year-ahead inflation forecast (5.3%), which is well above the forecast for income growth in 2022 (2.9%). Combining those two measures shows that US consumers implicitly see a contraction in their real incomes over the next 12 months. Chart 3US Consumers Expect A Sharp Decline In Real Purchasing Power
US Consumers Expect A Sharp Decline In Real Purchasing Power
US Consumers Expect A Sharp Decline In Real Purchasing Power
This has likely played a big role in the sharp fall in the University of Michigan consumer confidence index since the peak back in June (bottom panel), despite favorable US labor market conditions. US consumer perceptions of inflation appear much greater than the reality of inflation evident in the official price indices. The New York Fed survey also asks US consumers what their 1-year-ahead expectations are for major spending categories, like food or rent (Chart 4). Consumers expect somewhat slower inflation for food (7.0%) and gasoline (5.9%) over the next year, yet they also expect much higher medical care costs (9.4%) and rent (9.7%). For the latter two, those are considerably higher than the latest actual inflation rates seen in the US CPI (2.4% for rent, 0.4% for medical care) or PCE deflator (2.1% for rent, 2.4% for medical care). Taking these survey results at face value, it is likely that US consumers are overestimating how much their real incomes will suffer next year from higher inflation. This is especially true as US household income growth will likely surpass the 2.9% estimate seen in the New York Fed survey. Yet that does not preclude the Fed from starting to turn more hawkish. Central bankers are always on the lookout for signs that higher realized inflation is feeding through into rising inflation expectations, which could require a policy tightening response to prevent an overshoot of inflation targets. The Fed has given itself a bit more leeway in that regard by altering their policy framework to allow temporary deviations of inflation from the central bank targets. The BoE, however, has not given itself the same sort of flexibility, which is why it is now signaling an imminent rate hike in response to survey-based inflation expectations, and breakeven inflation rates on longer-dated index-linked Gilts, climbing to close to 4% (Chart 5). Yet even the Fed, with its Average Inflation Targeting framework, has signaled that a tapering of its bond purchases will likely begin by year-end. Chart 4US Consumer Inflation Expectations Well Above Actual Inflation
US Consumer Inflation Expectations Well Above Actual Inflation
US Consumer Inflation Expectations Well Above Actual Inflation
Markets are looking at the persistence of high inflation and have priced in a more hawkish trajectory for interest rates in the US, UK and even Europe over the next 12-24 months (Chart 6, bottom panel). Chart 5Inflation Weighing On UK & European Consumer Confidence
Inflation Weighing On UK & European Consumer Confidence
Inflation Weighing On UK & European Consumer Confidence
Real bond yields in those regions are also starting to move higher in response to rising rate expectations (third panel) - a bond-bearish dynamic that we have discussed at length in recent reports.1 Between those three, the BoE’s hawkish turn has hammered the Gilt market the hardest. Yet there has definitely been a spillover into rate expectations and bond yields in other countries on the back of the BoE guidance. We have already seen rate hikes from smaller developed market central banks, Norway and New Zealand, over the past month. If a major central bank like the BoE soon follows suit because of overshooting inflation expectations, then markets are justified in thinking that the Fed or even the ECB could be next. Of those “Big 3” central banks, we see the ECB as being the least likely to respond to the current inflation upturn with rate hikes in 2022. There is simply not enough evidence suggesting that the energy/supply-chain driven inflation in the euro area is broadening out into other parts of the economy on a sustainable basis. Furthermore, there is already some degree of monetary tightening “scheduled” in 2022 when the ECB’s pandemic bond purchase program expires in March. The ECB will not want to compound that by moving into rate hiking mode soon after. On the other hand, the Fed will likely see enough further tightening of US labor market conditions to begin hiking rates in the fourth quarter of 2022 (Chart 7). In the UK, After next month’s likely rate hike, the BoE will need to deliver at least another 50-75bps of additional hikes in 2022 and likely more in 2023 with real policy rates already well below neutral before the latest spike in energy prices. Chart 6Expect Higher Real Yields As Central Banks Turn More Hawkish
Expect Higher Real Yields As Central Banks Turn More Hawkish
Expect Higher Real Yields As Central Banks Turn More Hawkish
Chart 7Labor Markets, Not Commodities, Will Dictate Monetary Policy In 2022
Labor Markets, Not Commodities, Will Dictate Monetary Policy In 2022
Labor Markets, Not Commodities, Will Dictate Monetary Policy In 2022
With the Fed and BoE set to be far more hawkish than the ECB next year, we see greater risks of government bond yields rising faster, and higher than current forward rates, in the US and UK compared to the euro area (Chart 8). This justifies an overall cautious strategic stance on duration exposure in global bond portfolios. With regards to inflation-linked bonds, however, we recommend only a neutral overall stance. Elevated inflation breakevens have converged to, or even above, central bank inflation targets in all developed market economies (excluding Japan). 10-year UK breakevens, in particular, look very expensive on our fair value model (Chart 9). Chart 8Our Recommended "Big 3" Country Allocations
Our Recommended 'Big 3' Country Allocations
Our Recommended 'Big 3' Country Allocations
Chart 9Maintain An Overall Neutral Stance On Inflation-Linked Bonds
Maintain An Overall Neutral Stance On Inflation-Linked Bonds
Maintain An Overall Neutral Stance On Inflation-Linked Bonds
Bottom Line: Our view on the policy decisions of the Big 3 central banks in 2022 informs our strategic (6-18 months) investment strategy within those markets. Stay below-benchmark on overall global duration exposure, favoring euro area government debt over US Treasuries and UK Gilts. Fade The Recent Backup In European High Yield Spreads Chart 10A Slight Pickup In European Junk Spreads
A Slight Pickup In European Junk Spreads
A Slight Pickup In European Junk Spreads
Corporate credit markets in the US and Europe have calmed down since the July/August “Delta fueled” selloff with one notable exception – European high-yield (HY). The Bloomberg European HY index spread now sits 39bps above the September low, noticeably diverging from the US HY index spread (Chart 10). We view those wider spreads as a tactical buying opportunity for European junk bonds, both in absolute terms and versus US junk bonds. The recent underperformance appears rooted in soaring European energy prices. The spread widening has been concentrated in European consumer sectors (both cyclicals and non-cyclicals) that would be more exposed to the drain on real incomes from booming natural gas prices. Energy is also a smaller part of the European high-yield index (2%) compared to the US HY index (13%), which helps explain the performance gap with the US – the US index is more exposed to companies that benefit from higher energy prices (Chart 11). Chart 11Sectoral Breakdown Of US & Euro Area High-Yield Indices
Central Banks Backed Into A Corner
Central Banks Backed Into A Corner
Over a more medium-term perspective, there is little reason why there should be a meaningful performance difference between US and European HY. The path of spreads and excess returns (versus duration-matched government debt) for the two markets have been highly correlated in recent years (Chart 12). When adjusting European HY returns to allow a proper apples-to-apples comparison to US HY – by hedging European returns into US dollars and controlling for duration differences between the two markets – there has been little sustained difference in returns dating back to 2018. Chart 12Euro Area HY Has Closed The Gap Vs. The US
Euro Area HY Has Closed The Gap Vs. The US
Euro Area HY Has Closed The Gap Vs. The US
Chart 13Junk Default Rates Will Stay Low In 2022
Central Banks Backed Into A Corner
Central Banks Backed Into A Corner
More fundamentally, there is little difference in default rates that would justify a major divergence of HY spreads on both sides of the Atlantic. Moody’s is forecasting a HY default rate for a rate of 2% in both the US and Europe for 2022 (Chart 13). Such similar default rate expectations make sense with economic growth likely to remain well above trend in 2022 in both the US and Europe. Higher inflation will also boost nominal GDP growth, helping lift corporate revenues and the ability to service debt. From a valuation perspective, there is also little to choose from between European and US HY: The default-adjusted spread, which takes the current HY index spread and subtracts expected default losses over the next twelve months, is 196bps in Europe and 166bps in the US (Chart 14). While those spreads are below the post-2000 mean in both markets, they are still above past valuation extremes. The percentile ranking of 12-month breakeven spreads (the amount of spread widening over one year that would eliminate the yield advantage of HY over duration-matched government bonds) are also similar, 25% for European HY and 26% for US HY (Chart 15). These suggest HY spreads are not particularly “cheap”, from a historical perspective, in either market, but they could move lower to reach previous historical extremes. Chart 14Low Expected Default Losses Supporting HY Valuations
Low Expected Default Losses Supporting HY Valuations
Low Expected Default Losses Supporting HY Valuations
Chart 15Overall HY Spreads Are Tight In The US & Europe
Overall HY Spreads Are Tight In The US & Europe
Overall HY Spreads Are Tight In The US & Europe
Chart 16Euro Area Ba-Rated HY Spreads Look More Attractive
Central Banks Backed Into A Corner
Central Banks Backed Into A Corner
Summing it all up, there is no discernable reason why European HY should trade at a sustainably wider spread to US HY, outside of the compositional issue related to the weight of the Energy sector in both markets. When breaking down the two markets by credit rating buckets, European Ba-rated corporates even look more attractive versus similarly-rated US corporates, based on 12-month breakeven spread percentile rankings (Chart 16). Bottom Line: Maintain a strategic overweight stance on European high-yield corporates, and tactically position for some relatively better performance of European junk bonds versus US equivalents. Robert Robis, CFA Chief Fixed Income Strategist rrobis@bcaresearch.com Footnotes 1 Please see BCA Research Global Fixed Income Strategy Report, "What If Higher Inflation Is Not Transitory?", dated September 23, 2021, available at gfis.bcaresearch.com. Recommendations Duration Regional Allocation Spread Product Tactical Trades GFIS Model Bond Portfolio Recommended Positioning Active Duration Contribution: GFIS Recommended Portfolio Vs. Custom Performance Benchmark
Central Banks Backed Into A Corner
Central Banks Backed Into A Corner
The GFIS Recommended Portfolio Vs. The Custom Benchmark Index
Highlights As US and China’s grand strategies collide, expect major and minor geopolitical earthquakes whose epicenter will now lie in South Asia and the Indian Ocean basin. Another tectonic change will drive South Asia’s emergence as a new geopolitical battle ground - South Asia is now heavily weaponized. All key players operating in this theater are nuclear powers. South Asia’s democratic traditions are well-known but notable institutional and social fault lines exist. These could trigger major geopolitical events in Afghanistan, Pakistan and in pockets of India too. We are bullish on India strategically but bearish tactically. Dangerous transitions are underway to India’s east and west. Within India, key elections are approaching, and it is possible that growth may disappoint. For reasons of geopolitics, we are strategically bullish on Bangladesh but strategically bearish on Pakistan and Sri Lanka. We are booking gains of 9% on our long rare earths basket and 1% on our long GBP-CZK trade. Feature Over the 1900s, East Asia and the Middle East emerged as two key geopolitical focal points on the world map. Global hegemons flexed their muscles and clashed in these two theaters. Meanwhile South Asia was a geopolitical backstage at best. The majority of South Asia was a British colony until the second half of the twentieth century. After WWII it struggled with the difficulties of independence and mostly missed out on the prosperity of East Asia and the Pacific. But will the twenty-first century be any different? Absolutely so. We expect the current century to be marked by major and minor geopolitical earthquakes in which South Asia and the Indian Ocean basin will play a major part. This seismic change is likely to be the result of several tectonic forces: Population: A quarter of the world’s people live in South Asia today and this share will keep growing for the next four decades. India will be the most populous country in the world by 2027 and will account for about a fifth of global population. Supply: China’s growth model has left it heavily dependent on imports of raw materials from abroad. It is clashing with the West over markets and supply chains. Beijing is building supply lines overland while developing a navy to try to secure its maritime interests. These interests increasingly overlap with India’s, creating economic competition and security concerns over vital sea lines of communication. Access: Whilst the Himalayas and Tibetan plateau have historically prevented China from expanding its influence in South Asia, China’s alliance with Pakistan is strengthening. Physical channels like the China Pakistan Economic Corridor (CPEC), and other linkages under the Belt and Road Initiative, now provide China a foot in the South Asian door like never before (Map 1). Weapons: The second half of the twentieth century saw China, India, and Pakistan acquire nuclear arms. Consequently, South Asia today is one of the most weaponized geographies globally (Map 1). Map 1South Asia To Emerge As A Key Geopolitical Theater In The 21st Century
South Asia: A New Geopolitical Theater
South Asia: A New Geopolitical Theater
With the South Asian economy ever developing, and US-China confrontation here to stay, we expect China to make its presence felt in South Asia over the coming decades. The US’s recent withdrawal from Afghanistan, and the failure of democratization in Myanmar, are but two symptoms of a grand strategic change by which China seeks to prevent US encirclement and Indo-American cooperation develops to counter China. Throw in the abiding interests of all these powers in the Middle East and it becomes clear that South Asia and the Indian Ocean basin writ large will become increasingly important over the coming decades. The Lay Of The Land - India Is The Center Of Gravity Chart 1South Asia Managed Rare Feat Of ‘Steady’ Growth
South Asia: A New Geopolitical Theater
South Asia: A New Geopolitical Theater
South Asia stands out amongst developing regions of the world for its large and young population. In recent decades, South Asia has also managed to grow its economy steadily, surpassing Sub-Saharan Africa and rivaling the Middle East (Chart 1). While South Asia’s growth rates have not been as miraculous as East Asia post World War II, its growth engine has managed to hum slowly but surely. India and Bangladesh have been the star performers on the economic growth front (Chart 2). Despite decent growth rates, the South Asian region is characterized by very low per capita incomes due to large population. On per capita incomes, Sri Lanka leads whilst Pakistan finds itself at the other end of the spectrum (Chart 3). Chart 2India And Bangladesh Have Been Star Performers
South Asia: A New Geopolitical Theater
South Asia: A New Geopolitical Theater
Chart 3Per Capita Incomes In South Asia Have Grown, But Remain Low
South Asia: A New Geopolitical Theater
South Asia: A New Geopolitical Theater
Chart 4India Accounts For About 80% Of South Asia’s GDP
South Asia: A New Geopolitical Theater
South Asia: A New Geopolitical Theater
South Asia constitutes eight nations. However only four are material from an investment perspective: India, Pakistan, Sri Lanka, and Bangladesh. India is the center of gravity as it offers the most liquid scrips and accounts for 80% of the region’s GDP (Chart 4). In addition: India accounts for 101 of the 110 companies from South Asia listed on MSCI’s equity indices. MSCI India’s market capitalization is about $1 trillion. In fact, India’s equity market could soon become larger than that of the UK and join the world’s top-five club.1 The combined market cap of MSCI Bangladesh, Sri Lanka, and Pakistan amounts to only about $6 billion. Liquidity is a constraint that investors must contend with whilst investing in these three countries in South Asia. Pakistan is the home of 220 million – set to grow to 300 million by 2040. It lags its neighbors on economic growth and governance but has nuclear weapons and a 650,000-strong military. Bottom Line: India is the center of gravity for the regional economy and financial markets in South Asia. Sri Lanka and Bangladesh are small but are developing. Pakistan is the laggard, but is militarily strong, which raises political and geopolitical risks. South Asia: Major Consumer, Minor Producer Chart 5Manufacturing Capabilities Of South Asian Economies Are Weak
South Asia: A New Geopolitical Theater
South Asia: A New Geopolitical Theater
South Asia’s defining economic characteristic is that it is a major consumer. This feature contrasts with the region’s East Asian cousins, which worked up economic miracles based on their manufacturing capabilities. South Asia’s appetite to consume is partly driven by population and partly driven by the fact that this region’s economies have an unusually underdeveloped manufacturing base (Chart 5). It’s no surprise that all countries in South Asia (with the sole exception of Afghanistan) are set to have a current account deficit over the next five years (Charts 6A and 6B). Chart 6ASouth Asian Economies Tend To Be Net Importers
South Asia: A New Geopolitical Theater
South Asia: A New Geopolitical Theater
Chart 6BSouth Asian Economies Tend To Be Net Importers
South Asia: A New Geopolitical Theater
South Asia: A New Geopolitical Theater
India is set to become the third largest global importer of goods and services (after the US and UK) over the next five years. Its rise as a large client state of the world will be both a blessing and a curse, as increased business leverage will coincide with geopolitical insecurity. Structurally, Sino-Indian tensions are rising and growing bilateral trade will not be enough to prevent them. Meanwhile dependency on the volatile Middle East is a geopolitical vulnerability. Either way, India and its region become more important to the rest of the world over time. Whilst the structure of South Asia’s economy is relatively rudimentary, it is worth noting that Bangladesh and Sri Lanka present an exception. Bangladesh has embarked on a path of manufacturing-oriented development via labor-intensive production. Sri Lanka has a well-developed services sector (Chart 7). In particular: Bangladesh: Within South Asia, Bangladesh’s manufacturing sector stands out as being better developed than regional peers. More than 95% of Bangladesh’s exports are manufactured goods –a level that is comparable to China (Chart 8). China’s share in the global apparel and footwear market has been systematically declining and Bangladesh is one of the countries that has benefited most from this shift. Bangladesh’s share in global apparel and footwear exports to the US as well as EU has been rising steadily and today stands at 4.5% and 13% respectively.2 Chart 7Bangladesh’s And Sri Lanka’s Economies Are Relatively Modern
South Asia: A New Geopolitical Theater
South Asia: A New Geopolitical Theater
Chart 8Bangladesh Has The Most Developed Exports Franchise In South Asia
South Asia: A New Geopolitical Theater
South Asia: A New Geopolitical Theater
Sri Lanka: Whilst Sri Lanka social complexities are lower and per capita incomes are higher as compared to peers in South Asia, its transition from a long civil war to a focus on economic development recently suffered a body blow, first owing to terrorist attacks in 2019 and then owing to the pandemic. The economic predicament was then worsened by its government’s hasty transition to organic farming which hit domestic food production. Geopolitically it is worth noting that China is one of the largest lenders to Sri Lanka. Whilst Sri Lanka’s central bank may be able to convince markets of the nation’s ability to meet debt obligations for now, its foreign exchange reserves position remains precarious and public debt levels remain high. Sri Lanka’s vulnerable finances are likely to only increase Sri Lanka’s reliance on capital-rich China. Despite Democracy, South Asia Has Political Tinderboxes Another factor that sets South Asia apart from developing regions like Africa, the Middle East, and Central Asia is the region’s democratic moorings. India and Sri Lanka lead the region on this front, although the last decade may have seen minor setbacks to the quality of democracy in both countries (Chart 9). Pockets of South Asia are socially and politically unstable, characterized by religious or communal strife, terrorist activity, and even the occasional coup d'état. Risk Of Social Conflict Most Elevated In Pakistan And Afghanistan India’s demographic dividend is real, but its benefits should not be overstated. For instance, India’s northern region is a demographic tinderbox. It is younger than the rest of the country, yet per capita incomes are lower, youth underemployment is higher, and society is more heterogeneous. The rise of nationalism in India is an important consequence and could engender potential social unrest. Chart 9India’s Democracy Strongest, But May Have Had Some Setbacks
South Asia: A New Geopolitical Theater
South Asia: A New Geopolitical Theater
Chart 10South Asia Is Young And Will Age Slowly
South Asia: A New Geopolitical Theater
South Asia: A New Geopolitical Theater
Chart 11Social Complexities Are High In Afghanistan & Pakistan
South Asia: A New Geopolitical Theater
South Asia: A New Geopolitical Theater
A similar problem confronts South Asia as a whole. Pakistan and Afghanistan are younger than India by a wide margin (Chart 10). But both countries are economically backward and have either poor or non-existent democratic traditions. Lots of poor youths and inadequate political valves to release social tensions make for an explosive combination. These countries are highly vulnerable to social conflict that could cause political instability at home or across the region via terrorism (Chart 11). The Gatsby Effect Most Prominent In Pakistan While various regions struggle with inequality, South Asia has less of a problem that way (Chart 12). However South Asia is characterized by very low levels of social mobility as compared to peer regions. This can partially be attributed to two centuries of colonial rule as well as to endemic traditions of social stratification. Chart 12Gatsby Effect: Social Mobility Is Lowest In Pakistan
South Asia: A New Geopolitical Theater
South Asia: A New Geopolitical Theater
Within South Asia it is worth noting that social mobility is the lowest in Pakistan and highest in Sri Lanka. Chart 13Military’s Influence Most Elevated In Pakistan And Nepal Too
South Asia: A New Geopolitical Theater
South Asia: A New Geopolitical Theater
Military Influential In Pakistan (And Nepal) Events that transpired over January 2020 in the US showed that even the oldest constitutional democracy in the world is not immune to a breakdown of civil-military relations. South Asia has seen the occasional coup d'état, one reason for the political tinderboxes highlighted above. Obviously, Myanmar is the worst – it saw its nascent democratization snuffed out just last year. But other countries in the region could also struggle to maintain civilian order in the coming decades. The military’s influence is outsized in Pakistan as well as Nepal (Chart 13). India maintains high levels of defense spending but has a strong tradition of civilian control (Chart 14). Chart 14Pakistan’s Military Budget Is Most Generous, India A Close Second
South Asia: A New Geopolitical Theater
South Asia: A New Geopolitical Theater
South Asia: A New Global Battle Ground Historically global hegemons have sought to assert their dominance by staking claim over coastal regions in Europe and Asia. Over the past two centuries Asia has emerged as a geopolitical theater second only to Europe. Naval and coastal conflicts have emerged from the rise of Japan (the Russo-Japanese War) and the Cold War (the Korean War & the Vietnam War). Today the rise of China is the destabilizing factor. The “frozen conflicts” of the Cold War are thawing in Taiwan, South Korea, and elsewhere. China is pursuing territorial disputes around its entire periphery, including notably in the East and South China Seas but also South Asia. Meanwhile the US, fearful of China, is struggling to strike a deal with Iran and shift its focus from the Middle East to reviving its Pacific strategic presence. A budding US-China competition is creating conditions for a new cold war or a series of “proxy battles” in Asia. Over the next few decades, we expect disputes to continue. But the focal points are likely to cover South Asia too. In specific, landlocked regions in South Asia are likely to see rising tensions in the twenty-first century (Map 2). Also as mentioned above, China’s naval expansion and the US’s attempt to form a “quadrilateral” alliance with India, Japan, and Australia will generate tensions and potentially conflict. European allies are also becoming more active in Asia as a result of US alliances as well as owing to Europe’s independent need for secure supply lines. Map 2China’s Interest In Landlocked Regions Of South Asia Is Rising
South Asia: A New Geopolitical Theater
South Asia: A New Geopolitical Theater
While border clashes between India and China will ebb and flow, Indo-Chinese confrontations along India’s eastern border will become a structural theme. Arguably, Sino-Indian rivalries pre-date the twenty-first century. But in a world in which the Asian giants are increasingly economically and technologically developed, Sino-Indian confrontations are likely to persist and result in major geopolitical events. Consider: China is adopting nationalism and an assertive foreign policy to cope with rising socioeconomic pressures on the Communist Party as potential GDP growth slows. China is developing a navy as well as a stronger alliance with Pakistan, which includes greater lines of communication. North India is a key constituency for the political party in power in India today (i.e., the Bhartiya Janata Party or BJP) and this geography harbors especially unfavorable views of Pakistan (Chart 15). Thus, there is a risk that the India of today could respond far more decisively or aggressively to threats or even minor disputes. More broadly, nationalism is rising in India as well as China. India is shedding its historical stance of neutrality and aligning with the US, which fuels China’s distrust (Chart 16). Chart 15Northern India Views Pakistan Even More Unfavorably Than Rest Of India
South Asia: A New Geopolitical Theater
South Asia: A New Geopolitical Theater
Chart 16India Has Aligned With The QUAD To Counter The Sino-Pak Alliance
South Asia: A New Geopolitical Theater
South Asia: A New Geopolitical Theater
Turning attention to India’s western border, clashes between India and Pakistan relating to landlocked areas in Kashmir will also be a recurring theme. Whilst India currently has a ceasefire agreement in place with Pakistan, peace between the two countries cannot possibly be expected to last. This is mainly because: Kashmir: Core problems between the two countries, like India’s control over Kashmir and Pakistan’s use of militant proxies, remain unaddressed. India’s unexpected decision in 2019 to abrogate article 370 of the Indian constitution has reinforced Pakistan’s attention on Kashmir. Sino-Pak Alliance: Pakistan accounted for 38% of China’s arms exports over 2016-20. Pakistan accounts for the lion’s share of Chinese investments made in South Asia (Chart 17). Sino-India rivalries will spill into the Indo-Pak relationship (and vice versa). Revival Of Taliban: The US withdrawal from Afghanistan has revived Taliban rule in that country. Taliban’s rise will resuscitate a range of dormant terrorist movements in Afghanistan as well as in Pakistan. India has a long history of being targeted. South Asia today is very different from what it looked like for most of the post-WWII era: it is heavily weaponized. India, Pakistan, and China became nuclear powers in the second half of the twentieth century and have been steadily building their nuclear stockpiles ever since (Chart 18). North Korea’s growing arsenal is theoretically able to target India, while Iran (more friendly toward India) may also obtain nuclear weapons. Chart 17China And Pakistan: Joined At The Hip?
South Asia: A New Geopolitical Theater
South Asia: A New Geopolitical Theater
Chart 18South Asia: The New Epicenter For Nuclear Activity
South Asia: A New Geopolitical Theater
South Asia: A New Geopolitical Theater
While nuclear arms create a powerful incentive for nations to avoid total war, they can also create unmitigated fear and uncertainty during incidents of major strategic tension. This is especially true when countries have not yet worked out a mode of living with each other, as with the US and USSR in the early days of the Cold War. Investment Takeaways For investors with an investment horizon exceeding 12 months, we highlight that India presents a long-term buying opportunity for two key reasons: China’s Internal And External Troubles Will Benefit India: As long as US and China do not reengage in a major way, global corporations will fall under pressure to diversify from China and the US will pursue closer relations with India. China faces an array of challenges across its periphery, whereas India need only focus on the South Asian sphere. India Is Rising As A Global Consumer: As long as a major Middle East war and oil shock is avoided (not a negligible risk), India should see more benefits than costs from its growing importance as a client of the world. However, over the next 12 months we worry that India is priced for perfection. India currently trades at a punchy premium relative to emerging markets (Table 1) at a time of when both geopolitical and macroeconomic headwinds are at play. In particular: Table 1We Are Bearish On India Tactically, But Bullish On India & Bangladesh Strategically
South Asia: A New Geopolitical Theater
South Asia: A New Geopolitical Theater
Major Transitions Are Dangerous: Recent developments in South Asia have added to geopolitical risks for India. The assumption of power by Taliban in Afghanistan will activate latent terrorist forces that could target India. Pakistan’s chronic instability combined with the change of power in Afghanistan could set off an escalation in Indo-Pakistani tensions, sooner rather than later. On India’s eastern front, China’s need to distract its population from a souring economy could trigger a clash between China and India. Down south, China’s rising influence over crisis-hit Sri Lanka is notable and could potentially engender security risks for India. Chart 19Politics Can Trump Economics In Run Up To General Elections
South Asia: A New Geopolitical Theater
South Asia: A New Geopolitical Theater
Growth Slowing, Elections Approaching: We worry that India’s growth engine may throw up a downside surprise over the next 12 months owing to poor jobs growth and poor investment growth. History suggests that politics often trumps economics in the run up to general elections (Chart 19). Hence there is a real risk that policy decisions will be voter-friendly but not market-friendly over 2022. As both India and Pakistan are gearing up for elections in the coming years, major military showdown or saber rattling should not be ruled out. Both countries may engineer a rally around the flag effect to bump up their pandemic-battered approval. Tension with China may escalate as Xi Jinping extends his term in power next year and seeks to enforce red lines in China’s eastern and western borders. Globally what are the key geopolitical factors that could lead to India’s underperformance in the short run? We highlight a checklist here: China Stimulates: The near-term clash between markets and policymakers in China should eventually give way to meaningful fiscal stimulus by Chinese authorities. This buoys China as well as emerging markets that depend on China for their growth. However, even if China flounders, India may not continue to outperform. The correlation between MSCI India and China equities has been positive. Fed Tightens Quickly: A faster-than-expected taper and tightening guidance could cause those emerging markets that are richly priced like India to correct. A Crisis Over Iran’s Nuclear Program: If the US is unable to return to diplomacy, tensions in the Middle East will rise and stoke oil prices. This will affect India adversely, given global price pressures and India’s high dependence on oil imports. Conversely, if these developments fail to materialize then that would lower our conviction regarding India’s underperformance in the short run. In summary, we are bullish India strategically but bearish tactically. As regards the three other investable markets in South Asia: We are bearish on Pakistan and Sri Lanka on a strategic time horizon. Whilst both nations’ rising alignment with China could be an advantage ceteris paribus, ironically their deteriorating finances are driving their proximity to capital-rich China (Chart 20). To boot, Sri Lanka’s ability to pay its way out of its economic crisis on its own steam is worsening. This is evident from its rising debt to GDP ratio (Chart 21). Chart 20Pakistan And Sri Lanka Running Low On Reserves
South Asia: A New Geopolitical Theater
South Asia: A New Geopolitical Theater
Pakistan faces elevated risks of internal social conflict, must deal with a rapidly changing external environment, has a weak democracy and an unusually influential military. Sri Lanka’s social risks are low, but its economic crisis appears likely to persist. The fact that both markets have been characterized by a high degree of volatility in earnings in the recent past implies that even a cyclical “Buy” case for either of these markets is fraught with risks (Table 1). The outlook for Bangladesh is better. Exports account for 15% of GDP and the US and Europe account for around 70% of its exports. Strong fiscal stimulus in these developed markets should augur well for this frontier market. Additionally, Bangladesh is characterized by moderate social risks, reasonably strong democracy scores and low levels of influence from the military. Its healthy public finances (Chart 21) and the fact that it shares no border with China creates the potential to leverage a symbiotic relationship with China. Chart 21Sri Lanka’s Debt Now Exceeds Its GDP
South Asia: A New Geopolitical Theater
South Asia: A New Geopolitical Theater
But there is a catch. Bangladesh as a market has a low market cap and hence offers low levels of liquidity (Table 1). We thus urge investors to avoid making cyclical investment calls on this South Asian market. However, from a long-term perspective we highlight our strategic bullish view on Bangladesh given supportive geopolitical factors. Watch out for an upcoming report from our Emerging Markets Strategy team, that will delve into the macroeconomic aspects of Bangladesh. Ritika Mankar, CFA Editor/Strategist ritika.mankar@bcaresearch.com Footnotes 1 Abhishek Vishnoi and Swetha Gopinath, "India's stock market on track to overtake UK in terms of m-cap: Report" Business Standard, October 2021. 2 Arianna Rossi, Christian Viegelahn, and David Williams, "The post-COVID-19 garment industry in Asia" Research Brief, International Labour Organization, July 2021. Open Trades & Positions
South Asia: A New Geopolitical Theater
South Asia: A New Geopolitical Theater
South Asia: A New Geopolitical Theater
South Asia: A New Geopolitical Theater
Having worked as an economist for close to 50 years, the current strange and uncertain environment seems a good time to look back and consider some of the lessons I have learned. An additional reason for writing this rather personal report is that, after 34 exciting and interesting years, I will retire from BCA at the end of this month. Over the ages, there has been an insatiable demand for predictions – seeking those who are believed to have a window into the future, whether it be the Oracle of Delphi or the proverbial guru on the mountaintop. Surely, someone somewhere must know what is going to happen? Unfortunately, my almost half century in the forecasting business has highlighted that the future is essentially unknowable, and I have not come across anyone with a consistently good track record. Fortunately, all is not lost because forecasting errors can be minimized by following some basic rules and practices. Dealing With Shocks Chart 1My First Forecasting Shock
My First Forecasting Shock
My First Forecasting Shock
My career as an economist began in January 1973 when I joined the Forecasting Division within the Corporate Planning Department of British Petroleum in London. At the time, this seemed a strange move to friends who had entered the booming financial sector. The oil industry was regarded as incredibly dull with the crude price averaging $2.50 a barrel during the previous five years and no expectations of a major change in the foreseeable future (Chart 1). Of course, industry experts did not foresee the October 1973 war in the Middle East and OPEC’s resulting embargo of oil deliveries to the US. The crude price spiked above $15 a barrel in early 1974 and remained in double digits even after the embargo ended. This was my first lesson in the power of unforeseen shocks to destroy the basis of current forecasts and force a complete rethink of the outlook. A problem in dealing with major shocks is that some are transitory (e.g. natural disasters such as Japan’s devastating Fukushima earthquake) and some reflect a structural shift in the outlook. The oil shock was clearly in the latter category. OPEC suddenly became aware of its power to influence the market and from that time on, it took a more aggressive role in setting prices. At BP, long-run planning could not assume a return to pre-1974 prices and that was a game changer. In practice, most shocks are transitory, even if it is not evident at the time. And I believe that is true of the Covid-19 pandemic. Even if the virus cannot be eradicated, treatments will improve and we will learn to live with it, just as we live with the common cold and seasonal flu. There may be a lasting impact on some areas such as increased working from home, but I am skeptical that there will be any major change to the underlying drivers of economic growth. At most, it may encourage some trends that are already underway. However, the extreme policy response to the crisis will have some important effects and I will return to that later. Catching Structural Shifts Many economists spend much of their time making detailed economic forecasts for the coming one and two years. That may have great value in helping firms plan production schedules but is of limited value in helping investors time the market. As I have noted in previous reports, economists have done a poor job of forecasting recessions, which is the most important thing to get right from a planning point of view. Table 1 shows the recession forecasting record of the Federal Reserve, an institution that has tremendous economic brainpower and resources at its disposal. The Fed staff failed to predict any of the recessions in the past 50 years and other official and private sector forecasters were no better. Table 1Fed Economic Forecasts vs. Outcomes
Perspectives From A Long Career
Perspectives From A Long Career
BCA has wisely eschewed short-term economic forecasts. You would never read in a BCA publication a statement such as “we have revised next year’s GDP growth from 3.2% to 2.7%”. That does not mean we don’t care about the short-run economic outlook: we believe it is necessary to have a view about whether the consensus on economic trends is likely to be disappointed - either on the upside or downside. However, it is more important to focus on catching the long-term structural shifts in economic trends. Looking back over the past 50 years, the most important economic development for investors to get right was the rising inflation of the 1970s and its subsequent multi-decade decline. Any investors smart enough to be on the right side of the long-run inflation cycle would have avoided stocks and bonds and embraced commodities in the 1970s and done the reverse thereafter. While BCA’s track record was not perfect, it generally was on the right side of these trends. Another long-run trend that investors needed to identify was the surge in global trade and interdependence, beginning in the 1990s as former-communist countries and China embraced more market-friendly policies. This not only reinforced global disinflation but also shifted economic power from labor to capital, driving profit margins to record levels. Chart 2The Retreat From Globalization
The Retreat From Globalization
The Retreat From Globalization
Turning to the current environment, another structural shift is underway. Several years ago, we noted that the tide was turning against globalization. This showed up in a decline in cross-border capital flows, political and popular antipathy to large-scale immigration, and a flattening in the ratio of global trade to production (Chart 2). Recent developments have exacerbated these trends. Notably, the Covid-related disruptions to supply chains has forced a rethink about the wisdom of relying so heavily on foreign production facilities. The shift away from globalization is likely to persist for some time. This will support the case for a structural increase in inflation, a development underpinned by other forces. For example, the pendulum is swinging away from capital back to labor, central banks are setting themselves up to stay too easy for too long and crushing public sector debt burdens will make policymakers more willing to tolerate inflation overshoots. A structural increase in inflation (albeit nowhere near 1970’s levels) means that investors should expect a further decline in profit margins, higher interest rates and gains in inflation hedges. This will be a gradual shift with price pressures likely to moderate in the coming year as supply chain disruptions ease. Ignore Monetary Policy At Your Peril The level of interest rates is the single most important driver of asset prices which means that investors must pay close attention to central bank policy. During my career I have had a lot of contact with central bankers, not least because I was fortunate enough to attend the Federal Reserve’s Jackson Hole symposium for 18 years. Central bankers tend to be treated with great professional reverence. Every statement is examined for nuances about their views and there seems to be an implicit assumption that superior access to information and market intelligence gives them an edge when it comes to understanding economic trends and developments. Sadly, this is not the case. My many discussions with senior policymakers have made it abundantly clear that regarding the big questions about the outlook, they are no better placed than the rest of us. For example, like forecasters in general, they are struggling to know whether the recent rise in inflation is temporary, when supply chain disruptions will end and what will happen to resource prices. This is rather disconcerting as it would be desirable if those twiddling the policy dials were more informed than us outside observers. Chart 3Low Rates Underpin the Bull Market
Low Rates Underpin the Bull Market
Low Rates Underpin the Bull Market
Regardless of whether policymakers fully understand the long-run implications of their policies, the actions of central bankers have major market effects. One might reasonably have thought that the adverse economic impact of the pandemic would seriously damage the stock market, but the hit was short-lived with the MSCI All-Country Index currently 27% above its end-2019 level and close to its all-time high. This can be attributed to the fact that short-term interest rates in the major developed economies have been kept close to zero for more than a year (Chart 3). In 1852, the eminent financial journalist Walter Bagehot famously quipped that “John Bull can stand many things, but he can’t stand 2%”. In other words, a world of low interest rates is anathema to investors, forcing them to take greater risks in order to secure higher returns. What was true then remains true today. Low rates have driven investors into stocks as an explicit objective of central bank policy. Chart 4Inflation Undershoots For Two Decades
Inflation Undershoots For Two Decades
Inflation Undershoots For Two Decades
In the 1960s and 1970s, central bankers erred by keeping policy too easy for too long. Their formative years as policymakers were in the earlier decades when deflation was seen as a much bigger threat than inflation. This dulled their perception about the inflation risks of their policies. In contrast, the policymakers in charge during the 1980s to 2000s were fiercely anti-inflationary as they had experienced the inflationary consequences of their predecessors. Now the pendulum has swung back again because inflation has underperformed central bank expectations for the past 20 years, a period that also saw some severe deflationary shocks (Chart 4). In other words, the scene is setting up again for policy errors on the side of too much monetary stimulus and higher inflation. The high inflation of the 1970s was grim for financial assets with both equities and bonds delivering negative real returns. Bond investors underestimated the persistence and level of inflation which means they accepted ex-ante negative real yields. On the equity side, higher inflation did tremendous damage to corporate finances because of rising costs and the failure of companies to set aside enough for depreciation. Inflation accounting did not exist in those days and corporate restructuring had yet to occur. There is now much more awareness of inflation risks and accounting is better. Thus, inflation will be much less damaging to equities than before. However, we have returned to negative bond yields, largely as a result of policy-imposed financial repression rather than investor complacency. In other words, a new inflation cycle likely will be more damaging to bonds than stocks. What About Debt? On joining BCA, I had to learn about “The Debt Supercycle”, a term the company developed in the 1970s to describe the role of policy in feeding a seemingly never-ending cycle of increased leverage, resulting financial vulnerability and ever-desperate measures by policymakers to keep things afloat. This was well highlighted by the Fed’s response to the bursting of the tech bubble in the early 2000s when it kept interest rates at historically low rates even as the economy recovered. This helped create the conditions for the subsequent debt-driven housing bubble which led to an even greater policy response when that blew up in 2007-08. The essential message from BCA’s Debt Supercycle thesis is that investors should never underestimate the lengths to which policymakers will go to keep the economic/financial ship afloat. The Debt Supercycle primarily referred to the trend in private sector indebtedness in the US, although it applied to other countries. For example, in 2012, ECB President Mario Draghi noted that he was prepared “to do whatever it takes to preserve the euro”. Chart 5A Shift in the Debt Supercycle
A Shift in the Debt Supercycle
A Shift in the Debt Supercycle
To all intents, the financial crisis of 2007-09 effectively ended the private sector Debt Supercyle in the US. Despite keeping interest rates at extremely low levels, the Fed has been unable to trigger a new upturn to household sector leverage (Chart 5). Corporate debt burdens have risen, but largely for financial engineering purposes (equity buybacks and M&A) rather than capital spending. With the private sector no longer willing or able to go on another debt-fueled spending spree, the public sector has had to take its place. The past decade has witnessed an unprecedented peacetime increase in government deficits and debt. Inevitably, the surge in government debt has fueled bearish predictions of looming financial disaster. However, the same lessons apply regarding private sector excesses: the authorities will go to extreme lengths to prevent financial and economic chaos. The solution to excessive government debt is not to pursue even greater fiscal stimulus. Instead, the solution will be a mix of financial repression, higher inflation and eventually renewed fiscal discipline. That will not rule out periodic crises to force necessary policy actions, but investors should not assume that current high levels of government debt will inevitably lead to financial Armageddon. I apologize if that sounds complacent and I know that our long-standing client Mr. X would take a very different view. Who Is Mr. X? I have been asked countless times over the years whether Mr. X is a real person and, if so, who he is. I have always refused to answer this question, just as Coca Cola Inc. would never reveal the recipe for its drink. After all, it’s interesting to have a little mystery in an otherwise strait-laced business. What I can say is that our end-year conversations with Mr. X have proved invaluable in clarifying our thinking as we prepare our Annual Outlook report. It highlights the need to avoid groupthink and take account of a wide range of views. Mr. X is an interesting character in that he views the world through an Austrian School perspective. This means he favors free market solutions over aggressive policy interventions and has a healthy distrust of both politicians and central bankers. He does not like debt and fears inflation. All this has given him a bearish bias toward risk assets over the past few decades and it has been a perpetual struggle for us to convince him to adopt a more pro-growth investment strategy. That said, he was correctly more bearish than us in late 2007 and while we were not optimistic at that time, we should have paid more attention to his views. We recently held our annual discussion with Mr. X, along with his daughter Ms. X who joined his family office a couple of years ago. She does not share his Austrian School perspective and is much more inclined to take risks, given her hedge fund background. You will discover their latest thinking in our new Outlook report, due to be published next month. Timing The Markets The Bank Credit Analyst began publication in 1949 and it was years ahead of its time in understanding the role of money and credit in driving the economy and asset markets. Its founder, Hamilton Bolton, developed a series of monetary indicators that enabled him to make very prescient market calls and that is what put the company on the map. The focused monetary approach worked very well until the end of the 1970s because banks were the dominant financial intermediary, creating a relatively stable and predictable relationship between trends in money and the financial markets. It all changed with financial deregulation and innovation, beginning in the 1980s. BCA’s monetary indicators no longer worked so well, and we had to adopt a more comprehensive approach. Timing the markets is as much art as science but I would make the following observations: The stance of monetary policy remains the most important factor to consider, despite the less stable relationship between money flows and markets. Current negative real interest rates at a time when the economy is expanding are a powerful incentive to favor risk assets. Valuation is poor indicator of near-run trends. As Keynes famously noted “the stock market can stay irrational longer than you can remain solvent”. I learned that painful lesson in the late 1990s when I advocated caution in the Bank Credit Analyst yet the markets marched ever higher, until they finally broke in early 2000. Not a happy time! Yet, there is a well-established correlation between starting valuations and long-run returns so they cannot be completely ignored (Chart 6). Chart 6Valuation Matters for Long-Run Returns
Perspectives From A Long Career
Perspectives From A Long Career
Chart 7Technicals Still Positive For Stocks
Technicals Still Positive For Stocks
Technicals Still Positive For Stocks
Technical indicators can provide useful information around major turning points, although they are prone to false signals. Investor sentiment typically is at a bullish extreme at market tops and vice versa at bottoms. Also, I remember reading a large tome that reviewed every technical indicator known to man and it concluded that the most reliable one was the humble moving average crossover. Following a simple rule such as acting when the index crosses its 200-day average will keep you out of the market for the bulk of a bear phase and in for the bulk of a bull run. Of course, by definition, it will be a bit late and there will be many whipsaws. Currently, the stock market is above its rising 200-day average and investor sentiment is far from a bullish extreme (Chart 7). Don’t base your market expectations on consensus forecasts for the economy. The economy is a lagging not leading indicator of the markets. However, if your economic view is very different from the consensus, then that should impact your strategy. The bottom line is that there is no magic solution to consistently successful market timing. This explains why 86% of US active equity managers underperformed the benchmark index over the past 10 years, according to S&P Dow Jones data.1 At BCA, we follow a disciplined comprehensive approach that has served us well over the years, but inevitably we also suffer the occasional wobble. Concluding Thoughts Within BCA I have developed a reputation of being the resident bear and that does not bother me at all. It suits my Scottish temperament (probably weather-related), and anyway, I think it is more fun to be bearish. The language of the dark side is very rich and descriptive and it is not a surprise that bad news sells more newspapers than good news. To be bullish when there always are many problems around just makes one sound complacent and out-of-touch. Of course, it is important to get the markets right and I would never take a bearish view just to be different. In practice, I have generally been positive on risk assets, but that has not stopped me from pointing out the downside risks along the way. Perhaps, I have spent too much time talking to Mr. X! I have had much to be thankful for during my career. It has been a great privilege to interact with so many very smart and interesting people and a constantly changing economic and financial environment has kept me fully engaged. Whenever I was foolish enough to think I had things figured out, events taught me otherwise. I may be leaving BCA but will continue to follow economic and market developments with keen interest. Martin H. Barnes, Senior Vice President Chief Economist mbarnes@bcaresearch.com mhbarnes15@gmail.com Footnotes 1Detailed data on the performance of active managers are available at https://www.spglobal.com/spdji/en/research-insights/spiva/
Dear Client, Owing to BCA’s Annual Investment Conference next week, there will be no report on Wednesday, October 20. We will return to our regular publication schedule on Wednesday, October 27. Please note that there will be a China Outlook panel discussion at 9 AM on Thursday, October 21. We hope you will join us for the event. Best regards, Jing Sima China Strategist Highlights In the next six to nine months, the long-end of the yield curve will likely drop as investors start to price in weaker-than-expected economic growth amid measured stimulus. China’s 10-year government bond yields are set to structurally shift to a lower bound as domestic demand decelerates along with the nation’s total population. Policymakers will favor lower borrowing costs to reduce stress due to high debt levels among companies, central and local governments, and households. National savings are not a constraint for a country to lower domestic bond yields. China will continue to open domestic financial markets to global investors. The country’s large foreign exchange reserves limit the risk to its internal markets from extreme volatility in foreign fund flows. Feature In the past two decades policy rates in advanced economies have been brought close to zero and bond yields have dropped to extremely low levels. The yields on China’s government bonds, however, have remained well above their peers in advanced economies and in neighboring countries (Chart 1). Chart 1China's Government Bond Yields Far Above Other Major Economies
China's Government Bond Yields Far Above Other Major Economies
China's Government Bond Yields Far Above Other Major Economies
Moreover, despite China’s growth slowing from double to mid-single digits, yields on China’s 10-year government bonds have remained at around 2006 levels. China’s working-age population continues to decline and its total population is estimated to start falling in the next five years. China’s demographic headwinds, combined with high leverage in the private sector at around 220% of GDP, will cap the upside in yields. In this report we share our views on China’s short rates and long-term bond yields on a cyclical basis (next six to nine months) and in the next five years. The Cyclical Outlook The yield curve will likely flatten with China’s long-term government bond yields dropping more than short-term rates in next six to nine months. This will occur in the expectation of a further growth slowdown in at least the next two quarters. Meanwhile, the downside is limited on the short-end of the curve, given it is more sensitive to the PBoC’s guidance and monetary authorities will ease policy only gradually. Stimulus in the next two quarters may also disappoint. Credit growth will bottom in Q4 this year, but the rebound will be modest. Stronger issuance in local government bonds in the next two quarters will be offset by sluggish bank loan impulse. Chinese policymakers will refrain from using stimulus for the property market as a counter-cyclical policy tool to revive the economy. Restrictions will be maintained on bank lending to the real estate sector including mortgages and these controls will limit the rebound in credit expansion. Furthermore, infrastructure investment will improve modestly in the next two quarters, but local governments remain under pressure to deleverage, which will limit their incentive and capacity to spend. Chart 2Stimulus In 2018/19 Was Very Measured
Stimulus In 2018/19 Was Very Measured
Stimulus In 2018/19 Was Very Measured
We maintain our view that the current policy backdrop is shaping up to resemble that of H2 2018 and 2019. At that time, even though the central bank maintained an accommodative monetary policy stance and kept liquidity conditions ample, the size of the stimulus was measured and the economy was lackluster (Chart 2). Recent liquidity injections by the PBoC through open market operations should not be viewed as monetary easing because they represent the bank’s efforts to keep policy rates steady, at best (Chart 3). The central bank provided the interbank system with substantial financing to avoid liquidity crunches following the May 2019 Baoshang Bank takeover and the November 2020 Yongcheng Coal company debt default (Chart 4). In both cases, 10-year bond yields did not fall by as much as short rates, reflecting investors’ expectations that the liquidity injections and resulting drop in short rates were not long-lasting. Chart 3Recent PBoC Liquidity Injections Intended To Keep Policy Rates Steady
Recent PBoC Liquidity Injections Intended To Keep Policy Rates Steady
Recent PBoC Liquidity Injections Intended To Keep Policy Rates Steady
Chart 4APBoC Also Injected Liquidity After Previous High-Profile Defaults
PBoC Also Injected Liquidity After Previous High-Profile Defaults
PBoC Also Injected Liquidity After Previous High-Profile Defaults
Chart 4BPBoC Also Injected Liquidity After Previous High-Profile Defaults
PBoC Also Injected Liquidity After Previous High-Profile Defaults
PBoC Also Injected Liquidity After Previous High-Profile Defaults
Our view on China’s bond yields will not change with the liftoff of US Fed policy rates, even if the Fed hikes rates earlier and by more than anticipated. The Fed’s policy has little bearing on China’s long-dated yields, which are driven by domestic business cycles and monetary policy (Chart 5). Concerning the exchange rate, we believe that the RMB will modestly depreciate in the next six to nine months, given that the China-US nominal and real interest rate differentials will narrow (Chart 6). While some depreciation in the currency is modestly reflationary for China’s exporters, it will not be enough to offset weaknesses in domestic demand. Chart 5Domestic Economic Fundamentals Drive Yields On China's Government Bonds
Domestic Economic Fundamentals Drive Yields On China's Government Bonds
Domestic Economic Fundamentals Drive Yields On China's Government Bonds
Chart 6China-US Rate Differentials Are Set To Narrow
China-US Rate Differentials Are Set To Narrow
China-US Rate Differentials Are Set To Narrow
Chart 7Pipeline Inflationary Pressures in China Remain Elevated
Pipeline Inflationary Pressures in China Remain Elevated
Pipeline Inflationary Pressures in China Remain Elevated
Inflation remains a risk to our cyclical view on the 10-year bond yield. While the economy is weakening, pipeline inflationary pressures remain elevated (Chart 7). We do not foresee that the PBoC will change its modestly dovish policy stance because of inflationary pressures stemming from supply-side bottlenecks. However, supply constraints will not abate soon and consequently, pipeline inflationary pressures and producer price inflation may not subside in the next six months. Thus, fixed-income investors may start to price in higher inflation, which could prevent long-duration bond yields from declining by much. Bottom Line: In the coming months, the long-end of the yield curve will likely drop as investors start to price in weaker-than-expected economic growth and very measured stimulus. The short-end of the curve will have limited downside potential because there is only a slim chance of aggressive monetary easing. Bond Yields Are On A Structural Downtrend Bond yields in China will likely downshift in the next three to five years. Our secular outlook for government bond yields is based on the country’s demographic trends, inflation, productivity growth and debt levels. While China’s long-term bond yields have persistently averaged below nominal GDP growth, in the past decade the gap has significantly narrowed as economic growth slowed while yields remained within a tight range (Chart 8). This contrasts with other manufacturing and export-oriented Asian economies where interest rates have moved to a lower range in proportion with economic growth rates (Chart 9). Chart 8China's Economic Growth Has Downshifted But Yields Have Not...
China's Economic Growth Has Downshifted But Yields Have Not...
China's Economic Growth Has Downshifted But Yields Have Not...
Chart 9...In Contrast With Other Asian Manufacturing-Based Economies
...In Contrast With Other Asian Manufacturing-Based Economies
...In Contrast With Other Asian Manufacturing-Based Economies
China’s long-dated bond yields will also downshift in the next three to five years given the nation’s declining long-term potential output growth, based on the following: Chart 10Wages Have Risen In China
Wages Have Risen In China
Wages Have Risen In China
A shrinking workforce can be inflationary due to higher labor costs and we expect Chinese workers’ compensation will continue to increase in the next five years (Chart 10). However, wage inflation will likely be offset by labor productivity, which has remained robust. The nation’s unit-labor cost (ULC), measured by the wages paid for each employee to produce one unit of output, has been flat to slightly down in the past decade despite strong wage growth (Chart 11). Similarly, ULC has sagged in Japan and is muted in South Korea (countries with shrinking labor forces) due to fast-growing labor productivity. This contrasts with the US, where ULC has risen even though the labor force has expanded in the past 10 years (Chart 12) China’s labor productivity will not likely undergo a significant decline in the next five years, particularly if China successfully maintains the manufacturing sector’s share in its aggregate economy, because productivity growth in this sector is usually higher than in others. Chart 11ULC Has Been Relatively Flat
ULC Has Been Relatively Flat
ULC Has Been Relatively Flat
Chart 12ULC Muted In Asian Economies Compared With US
ULC Muted In Asian Economies Compared With US
ULC Muted In Asian Economies Compared With US
Meanwhile, China’s total population will shrink within the next five years, which will likely bring powerful disinflationary forces that will more than offset price increases created by labor shortages. Disinflation will cap the upside in interest rates/bond yields. Chart 13Japan's Household Consumption Share Fell Sharply When Total Population Started Shrinking
Japan's Household Consumption Share Fell Sharply When Total Population Started Shrinking
Japan's Household Consumption Share Fell Sharply When Total Population Started Shrinking
A shrinking total population can significantly reduce demand, as evidenced in Japan in the past two decades. Japan’s working-age population started falling in the early 1990s, but the country’s household consumption share in GDP fell sharply after its total population peaked in 2010 and the urban population growth started contracting (Chart 13). In other words, Japan’s rapidly falling demand more than offset a muted increase in wage growth. China’s housing demand may have already peaked and the decline will gather speed in the next five years (Chart 14). Long-term growth in household consumption moves in tandem with housing and, therefore, will also downshift in the coming years (Chart 15). In the next five years or longer, China’s de-carbonization efforts will require shutting down production of many old economy enterprises. Policymakers may keep low interest rates to accommodate such a transformation. Furthermore, amid the geopolitical confrontation with the US, Beijing will need lower interest rates to support the manufacturing sector and to undertake an industrial upgrade. Chart 14China's Demand For Housing Is On A Structural Downshift...
China's Demand For Housing Is On A Structural Downshift...
China's Demand For Housing Is On A Structural Downshift...
Chart 15...Along With Consumption
...Along With Consumption
...Along With Consumption
The main risk to our view is that China’s total factor productivity1 growth could accelerate to more than offset a declining total population. This would boost real per capita income and result in higher potential growth in the economy. In this scenario, long-duration bond yields could climb. However, total factor productivity growth will need to outpace the rate of a shrinking labor pool and capital formation to prop up growth in the aggregate economy (Chart 16A and 16B). This is a daunting mission that Japan and South Korea, where productivity growth has been on par with China, have failed to accomplish. Chart 16AChina's Neighbors Have Not Accelerated Their Productivity Gains To Structurally Boost Economic Growth
China's Neighbors Have Not Accelerated Their Productivity Gains To Structurally Boost Economic Growth
China's Neighbors Have Not Accelerated Their Productivity Gains To Structurally Boost Economic Growth
Chart 16BChina's Neighbors Have Not Accelerated Their Productivity Gains To Structurally Boost Economic Growth
China's Neighbors Have Not Accelerated Their Productivity Gains To Structurally Boost Economic Growth
China's Neighbors Have Not Accelerated Their Productivity Gains To Structurally Boost Economic Growth
Chart 17China Cannot Drastically Improve Its Productivity Growth In The Next Five Years
China’s Interest Rates: Will They Join The Race To Zero?
China’s Interest Rates: Will They Join The Race To Zero?
It is unrealistic to expect that China will drastically improve its productivity growth. Productivity level is much higher now than it was 10-20 years ago when China’s manufacturing sector accounted for more than 40% of GDP (Chart 17). Even though China’s manufacturing share in the economy will stabilize and even increase from the current 27% of the economy, it cannot boost the sector drastically, particularly because its export market share cannot expand much further due to rising geopolitical tensions. In short, sectors of the economy where productivity gains have been most rapid – manufacturing sector including exports that drove China’s productivity in the past 20 years - cannot fully offset the deceleration in other growth drivers going forward. The service sector will grow, but it is much more difficult to achieve fast productivity gains in the service sector. All in all, productivity and economic growth will moderate as China’s growth model shifts from capital-intensive infrastructure and real estate to services. Bottom Line: In the next five years, China’s 10-year government bond yields are more likely to structurally move to a lower bound as final demand falls along with the nation’s total population. Savings, Debt And Interest Rates China’s national savings rate is one of the highest in the world, but it will drop as the population ages. Thus, some economists may argue that a structural decline in the national savings rate will lead to higher interest rates in the long run. Chart 18Lower Savings Rates Do Not Necessarily Herald Higher Interest Rates
Lower Savings Rates Do Not Necessarily Herald Higher Interest Rates
Lower Savings Rates Do Not Necessarily Herald Higher Interest Rates
However, there is no empirical evidence that national savings drive interest rates. There has not been an inverse relationship between national savings rates and government bond yields in either Japan or the US, as illustrated in the middle and bottom panels of Chart 18. There are more periods of positive rather than negative correlation between savings rates and bond yields. Note that China’s national savings rate and its interest rates also are not inversely related; a rising saving rate does not lead to lower interest rates and vice versa (Chart 18, top panel). This empirical evidence is in line with special reports published by BCA’s Emerging Markets Strategy that concluded the following: Banks cannot and do not lend out or intermediate national or households “savings.” In an economy with banks, one does not need to save in the form of a deposit in a bank in order for a bank to lend money to another entity. In any economy, new money originates by commercial banks “out of thin air” when they lend to or buy assets from non-banks. Hence, there is little relationship between national savings (flow concept in economics) and money supply growth (a flow variable too) (Chart 19). The term “savings” in macroeconomics denotes an increase in the economy’s capital stock, not deposits at banks. China’s banking system has an enormous amount of deposits, created by the banks “out of thin air” and not from households’ savings. The above factors explain why Japan’s government bond yields and national savings rate have been falling since 1990 (Chart 18 on Page 12, bottom panel). A lack of demand for borrowing was not why bond yields fell. A reason why China’s bond yields will likely be in a secular decline is that commercial banks will purchase government and corporate bonds en masse as they have done in the past 10 years (Chart 20). To do so, commercial banks will not use existing deposits, but rather they will create new deposits/money “out of thin air.” Chart 19There Is Little Relationship Between National Savings And Money Growth
There Is Little Relationship Between National Savings And Money Growth
There Is Little Relationship Between National Savings And Money Growth
Chart 20China's Commercial Banks Will Continue To Purchase Government And Corporate Bonds
China's Commercial Banks Will Continue To Purchase Government And Corporate Bonds
China's Commercial Banks Will Continue To Purchase Government And Corporate Bonds
The same is true for the banks’ purchases of corporate bonds. In China, commercial banks own about 75% of government (including local government) bonds and 20% of onshore corporate bonds. To avoid a spike in bond yields, Chinese regulators could relax the limitations on commercial banks to purchase government and corporate bonds. The upshot will be a lack of crowding out and no upward pressure on bond yields despite a large bond issuance. Chart 21China's Debt-To-GDP Ratio And Service Costs Have More Than Doubled In The Past 10 Years
China's Debt-To-GDP Ratio And Service Costs Have More Than Doubled In The Past 10 Years
China's Debt-To-GDP Ratio And Service Costs Have More Than Doubled In The Past 10 Years
What are the implications of high indebtedness on interest rates? China’s domestic debt-to-GDP ratio has jumped from 120% of GDP in 2008 to 260% (Chart 21, top panel). This includes local currency borrowing by/debt of government, enterprises and households. Critically, the debt-service ratio2 for enterprises and households has more than doubled from 10% of disposable income in 2008 to over 20% (Chart 21, bottom panel). China cannot afford much higher interest rates because enterprises and households will struggle and will not be able to service their debts. Mortgage rates in China are at around 5.5%, the one-year prime lending rate for companies is 3.85% and onshore corporate bond yields are 3.7%. These are not particularly low borrowing costs given both high indebtedness and the outlook for structurally slower economic growth. Onshore borrowing costs may be brought down further in the years ahead to rule out debt distress among households, enterprises and local governments. Since 2015 and prior to the pandemic, China’s debt-service ratio has been mostly flat despite a rising debt-to-GDP ratio.3 This has been achieved through declining interest rates. In the next five years policymakers will likely maintain a stable debt-to-GDP ratio. Hence, lower bond yields are all but inevitable to decrease the debt-servicing burden. In addition, China’s “common prosperity” policy means larger government spending/deficits. However, to cap the government debt-to-GDP ratio, bond yields should be kept down. This is another reason why China’s will opt for lower interest rates/bond yields. Bottom Line: The high level of debt among local governments, companies and households means that borrowing costs in China will be reduced in the years ahead. National savings are not a constraint in any country for commercial banks to expand credit and/or to buy bonds. China will encourage its banks to buy government and corporate bonds to trim yields amid continuous heavy bond issuance. Will China’s Financial Opening Continue? In the current environment which geopolitical tensions are rising between China and the West, many global investors are concerned whether China will impose tighter capital controls and even seize foreign assets. Despite these challenges, China has continued to make progress opening its domestic markets. The nation seems to be sticking to its key policy goals of attracting foreign capital and internationalizing the RMB; both aspects require open access and repatriation of foreign capital. In addition, the share of foreign holdings in onshore securities is very low and thus, poses limited risk to China’s onshore financial markets during global economic or geopolitical crises. China’s current exposure to foreign capital flows is much smaller than its Asian neighbors during the 1997 Asian Financial Crisis, as well as Russia during the geopolitical standoff in 2014-2016 following the capture of Crimea.4 Despite years of easing access to financial markets, foreign ownership (mostly concentrated in government bonds) remains at only around 3-4% of China’s entire onshore bond market. Furthermore, unlike other Asian economies in 1997-98, China has large foreign exchange reserves to buffer shocks from foreign fund flows. In recent years its capital control mechanism has also been successful in preventing implicit capital outflows and stabilizing the RMB exchange rate. We expect Chinese policymakers to feel confident in continuing their financial opening because they have the capability and sufficient funds to safeguard the economy against retrenchments by global investors. Bottom Line: China will continue to open its domestic financial markets, albeit gradually, to global investors. The country’s domestic financial markets have limited exposure to the extreme volatility of foreign capital flows. Investment Conclusions Chart 22The RMB Still Has Upside Structurally, But Will Modestly Depreciate On A Cyclical Basis
The RMB Still Has Upside Structurally, But Will Modestly Depreciate On A Cyclical Basis
The RMB Still Has Upside Structurally, But Will Modestly Depreciate On A Cyclical Basis
We are constructive on China’s government bonds, both cyclically and structurally. In the next six to nine months, the yield curve will likely flatten, with long-duration bond yields dropping faster than the short-end. China’s 10-year government bond yield will structurally shift to a lower range in the next five years, driven by the impact of falling population on domestic demand, and the country’s rising debt levels and debt-servicing costs. Although the RMB still has upside structural potential, in the next 6 to 12 months the currency will likely modestly depreciate against the US dollar (Chart 22). Jing Sima China Strategist jings@bcaresearch.com Qingyun Xu, CFA Associate Editor qingyunx@bcaresearch.com Footnotes 1Total Factor Productivity (TFP) is a measure of productive efficiency, determining how much output can be produced from a certain amount of inputs. 2Defined by BIS as the ratio of interest payments plus amortizations to income. 3Despite a rising debt load, debt-servicing costs were contained due to (1) LGFV debt swap as new provincial government bonds had lower yields than LGFV bonds and (2) a large decline in the prime lending rate and mortgage rates. 4Foreign investors held more than 40% of local currency bonds in Indonesia, and over 20% in Malaysia. Foreign ownership accounted for 26% of Russia’s local currency bonds in 2014. Market/Sector Recommendations Cyclical Investment Stance
Highlights Electricity shortages in China are largely due to excessive power demand rather than a matter of shrinking electricity production. Chinese electricity consumption has been supercharged by the export sector’s booming demand for electricity. Excessive overseas (mainly US) demand for goods has been the main culprit behind China’s robust electricity demand. Divergence in the mainland economy between booming exports on the one hand and weakening property construction and infrastructure spending on the other hand will reduce the likelihood that policymakers will rush to stimulate. Odds are that Chinese and EM share prices will continue selling off and underperforming DM equities. Feature Contrary to popular perceptions, China’s electricity crisis is not due to drastic supply shortages but rather caused by excessive demand. This has implications for macro policy. Given that electricity shortages stem from strong demand, policymakers will be less aggressive in providing blanket stimulus over the near term. The basis is that unleashing more stimulus to boost the industrial sector – at a time when there are already scarcities of electricity and other inputs – will intensify the shortages and aggravate the situation. Robust Electricity Demand Electricity demand has been outstripping growing electricity output. Hence, shortages are largely due to excessive electricity demand. Charts 1 and 2 demonstrate that both electricity consumption and output have been expanding but demand growth has outpacing supply. Notably, electricity demand has surged above its trend by more than electricity production. Chart 1Chinese Electricity Production Is Above Its Trend
Chinese Electricity Production Is Above Its Trend
Chinese Electricity Production Is Above Its Trend
Chart 2Chinese Electricity Consumption Is Well Above Its Trend
Chinese Electricity Consumption Is Well Above Its Trend
Chinese Electricity Consumption Is Well Above Its Trend
The mainland’s electricity demand has been strong due to surging manufacturing consumption of electricity. The top panel of Chart 3illustrates that electricity consumption in manufacturing has become overextended. On the other hand, residential demand for electricity has been expanding gradually and has not been excessive (Chart 3, bottom panel). The manufacturing sector has been supercharged by booming exports. Chart 4 reveals that China’s industrial output and exports have expanded briskly – their levels have surged well above their 10-year trend. Chart 3Electricity Demand Growth Is Driven By Manufacturing Not Residential Consumption
Electricity Demand Growth Is Driven By Manufacturing Not Residential Consumption
Electricity Demand Growth Is Driven By Manufacturing Not Residential Consumption
Chart 4Manufacturing And Exports Have Been Very Strong
Manufacturing And Exports Have Been Very Strong
Manufacturing And Exports Have Been Very Strong
Chart 5US Goods Demand: Classic Overheating
US Goods Demand: Classic Overheating
US Goods Demand: Classic Overheating
DM countries’ stimulus has been responsible for this export boom. Specifically, US demand for goods has been running well above its pre-pandemic trend (Chart 5). Bottom Line: Both electricity consumption and production have been rising but demand has outstripped supply, resulting in shortages. On Supply Constraints Not only has total electricity output been rising but electricity produced by thermal coal has also been expanding, albeit gradually (Chart 6). China still generates 71% of its electricity using thermal coal. While electricity output growth from this source has slowed down recently, it has still not contracted (Chart 7). Chart 6China: Sources Of Electricity Production
China: Sources Of Electricity Production
China: Sources Of Electricity Production
Chart 7Electricity Output Has Slowed But Not Contracted
Electricity Output Has Slowed But Not Contracted
Electricity Output Has Slowed But Not Contracted
Similarly, coal supply has been rising slowly, i.e., it has not shrunk (Chart 8). Coal supply has been capped due to the following reasons: Coal production has decelerated due to decarbonization policies adopted by Beijing. Authorities have also constrained coal mining by strictly enforcing safety protocols in mines following accidents early this year. Moreover, coal imports have been constrained by Beijing's ban on coal from Australia. Beijing’s “dual control” policy – which imposes targets on energy intensity and the level of energy consumption on provinces – has also led several local governments to reduce electricity production in recent weeks to ensure that annual targets are met. Finally, in recent years electricity prices have been flat-to-down while coal prices have surged (Chart 9). Thus, coal-based power generators have recently been incurring losses and some of them have been reluctant to produce more electricity. Chart 8China's Coal Supply Has Been Timid
China's Coal Supply Has Been Timid
China's Coal Supply Has Been Timid
Chart 9Coal Power Plants Are Operating With Losses
Coal Power Plants Are Operating With Losses
Coal Power Plants Are Operating With Losses
Authorities have begun tackling these problems. Coal supply will likely rise moderately as will electricity output from thermal coal. Reportedly, some Australian coal has in recent days been offloaded in China, and authorities have eased restriction on coal production and encouraged banks to lend to coal producers and electricity generators. Bottom Line: There has been a slowdown – not a contraction – in electricity produced by thermal coal. Authorities have started addressing these bottlenecks and odds are that electricity output will catch up with electricity demand before year-end, i.e., the power shortages will likely gradually ebb. Implications For Chinese Macro Policy Given that electricity demand has been outstripping supply, clients might wonder about the pace of China’s economic growth. This has ramifications as to whether or not authorities will stimulate aggressively. On the one hand, the manufacturing and especially export-oriented segments have been expanding briskly. As shown in Chart 4 above, manufacturing output in general and exports in particular have been overheating. Further, the labor market has been tightening, as is illustrated in Chart 10. On the other hand, as we have been writing, construction and infrastructure spending have been weakening (Chart 11). Chart 10China: Urban Labor Market Is Tight
China: Urban Labor Market Is Tight
China: Urban Labor Market Is Tight
Chart 11Construction And Infrastructure Have Slowed
Construction And Infrastructure Have Slowed
Construction And Infrastructure Have Slowed
Granted property developers, local governments and LGFVs are facing debt limits and financing constraints, it is safe to assume that they will cut back on their capital spending. China’s construction and infrastructure spending accounts for a large share of industrial metals demand. This is a basis for our argument that industrial metal prices remain at risk of declining. Unlike the current power crunch, industrial metal shortages are not caused by excessive demand but rather are due to shrinking production. Chart 12 shows that China’s steel output has contracted. Hence, the surge in steel prices has been due to production cutbacks. Local governments are probably shutting down metals production in response to decarbonization policies and to divert power to export-oriented companies. The fact that the price of steel’s key ingredient – iron ore – has collapsed is consistent with reduced demand for it (Chart 13). This is in contrast with the current strong demand for coal. Chart 12Lower Steel Production = Higher Steel Prices
Lower Steel Production = Higher Steel Prices
Lower Steel Production = Higher Steel Prices
Chart 13Weak Iron Ore Demand = Lower Prices
Weak Iron Ore Demand = Lower Prices
Weak Iron Ore Demand = Lower Prices
Overall, the bifurcation in the economy characterized by booming exports versus weakening property construction and infrastructure spending reduces the likelihood that policymakers will rush to stimulate. Rather, they will provide targeted support to negatively affected segments of the economy in the form of easier credit access, easing industry regulation and easier decarbonization targets. Bottom Line: Policymakers in Beijing will not rush to provide a blanket stimulus for now. Rather, they will use this period of booming exports to undertake deleveraging in the real estate sector as well as local governments and their affiliated companies. Investment Implications: Barring any large stimulus, construction and infrastructure spending will continue to disappoint, which is bad for industrial metals. This outlook in combination with the ongoing regulatory clampdown on internet companies heralds lower prices for Chinese investable stocks. Chart 14Stay Long A Shares / Short Chinese Investable Stocks
Stay Long A Shares / Short Chinese Investable Stocks
Stay Long A Shares / Short Chinese Investable Stocks
Given that Chinese investable stocks include few export companies, booming exports will not be sufficient to propel China’s MSCI Investable equity index higher. Among the Chinese indexes, we reiterate our long A shares / short China MSCI Investable index strategy, a recommendation made in early March (Chart 14). Reshuffling The EM Portfolio BCA’s Emerging Markets Strategy team is recommending the following changes in country allocation within EM equity and fixed-income portfolios. Equities: We are downgrading Indian stocks from overweight to neutral. The reasons for this portfolio shift are presented in the country report we are publishing today. In its place, dedicated EM equity managers should upgrade Russian and Central European equity markets like Poland, Czech Republic and Hungary from neutral to overweight. The rationale is that high oil prices favor Russian equity outperformance. Barring a major crash in oil prices, we are comfortable maintaining an overweight allocation to Russia in an EM portfolio. In turn, rising bond yields in core Europe are positive for bank stocks that have a large weight in Central European bourses. Fixed Income: We are upgrading Russian local currency bonds from neutral to overweight within an EM domestic bond portfolio. A hawkish central bank is positive for the long end of the Russian yield curve. 10-year yields also offer great value. Further, high energy prices (even if they drop from current very elevated levels but remain above $60 per a barrel) will help the ruble to outperform its EM peers. We maintain a yield curve trade of receiving 10-year/paying 1-year swap rates in Russia. Finally, we continue overweighting Russian sovereign and corporate credit within an EM credit portfolio. Arthur Budaghyan Chief Emerging Markets Strategist arthurb@bcaresearch.com Equities Recommendations Currencies, Credit And Fixed-Income Recommendations
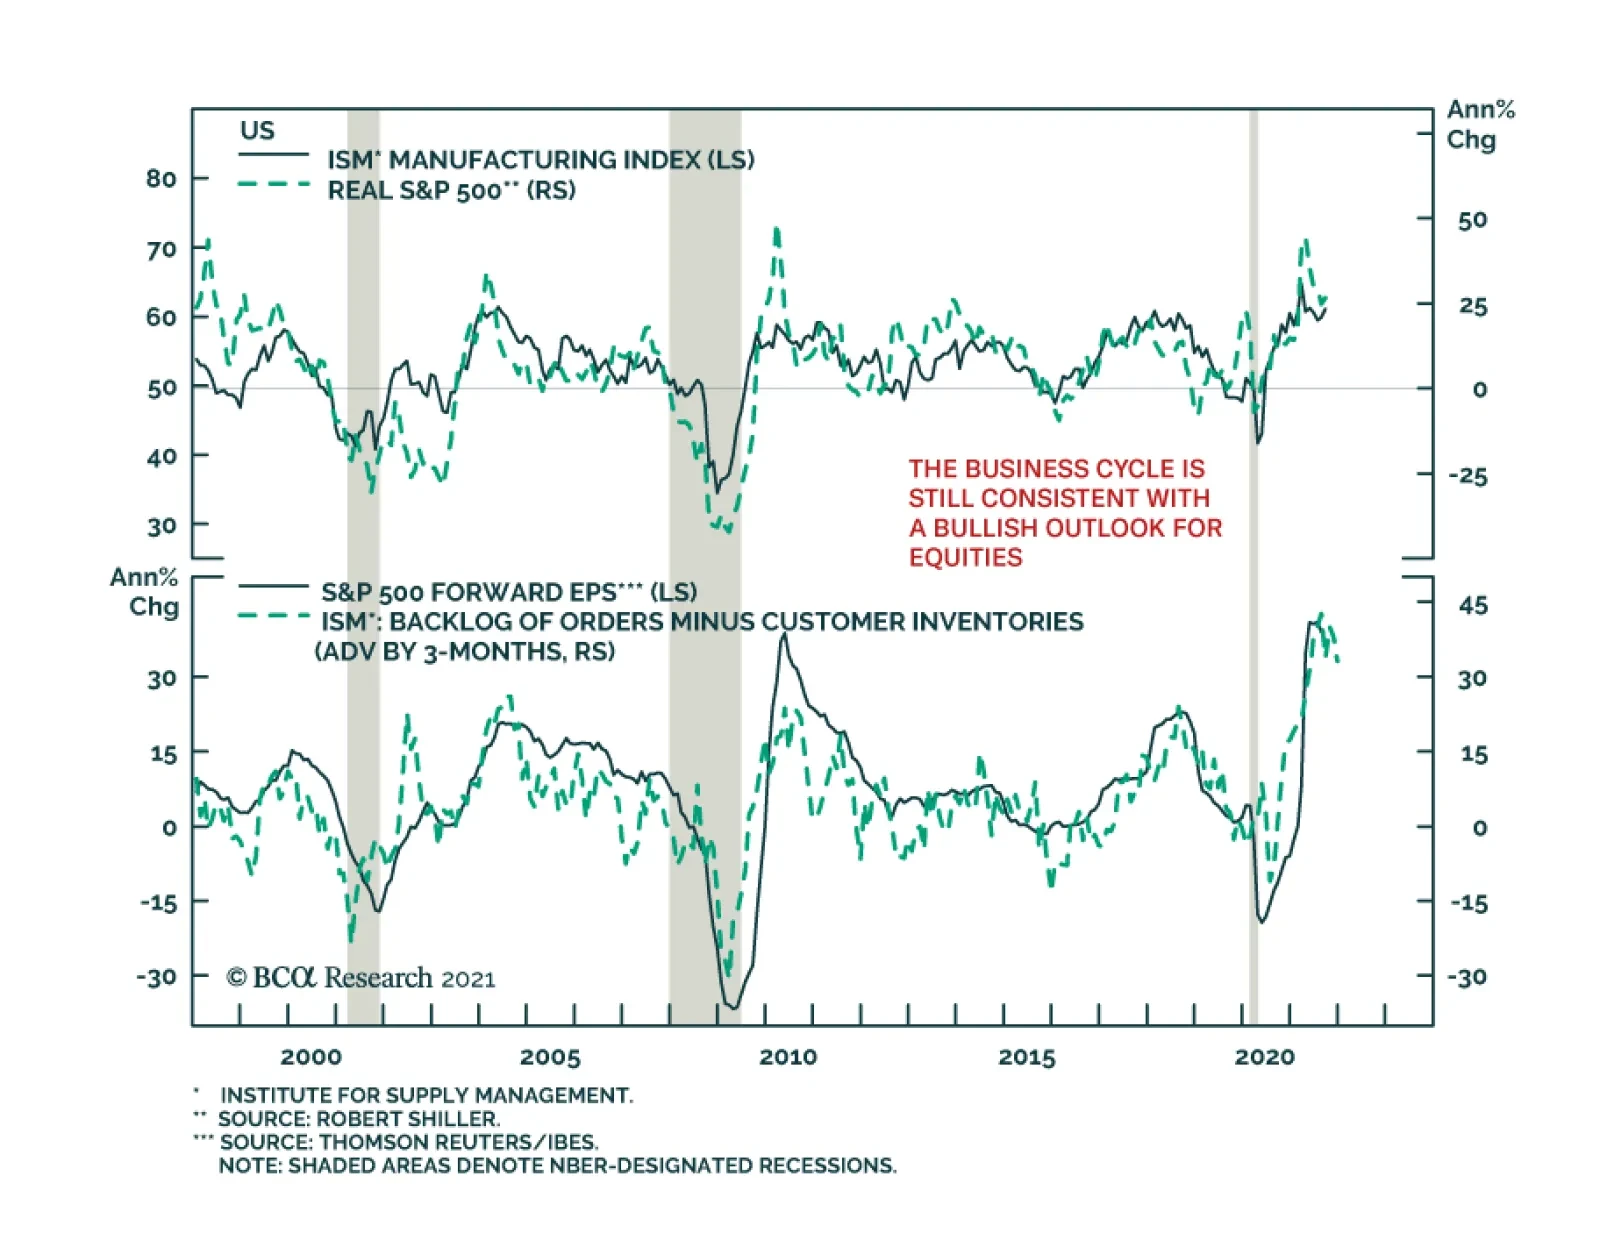
Both the ISM and Markit PMIs suggest that US manufacturing activity accelerated in September. The ISM index increased 1.2 points to a four-month high of 61.1, surprising expectations of a decline. Similarly, the Markit measure inched up 0.2 points to 60.7. …
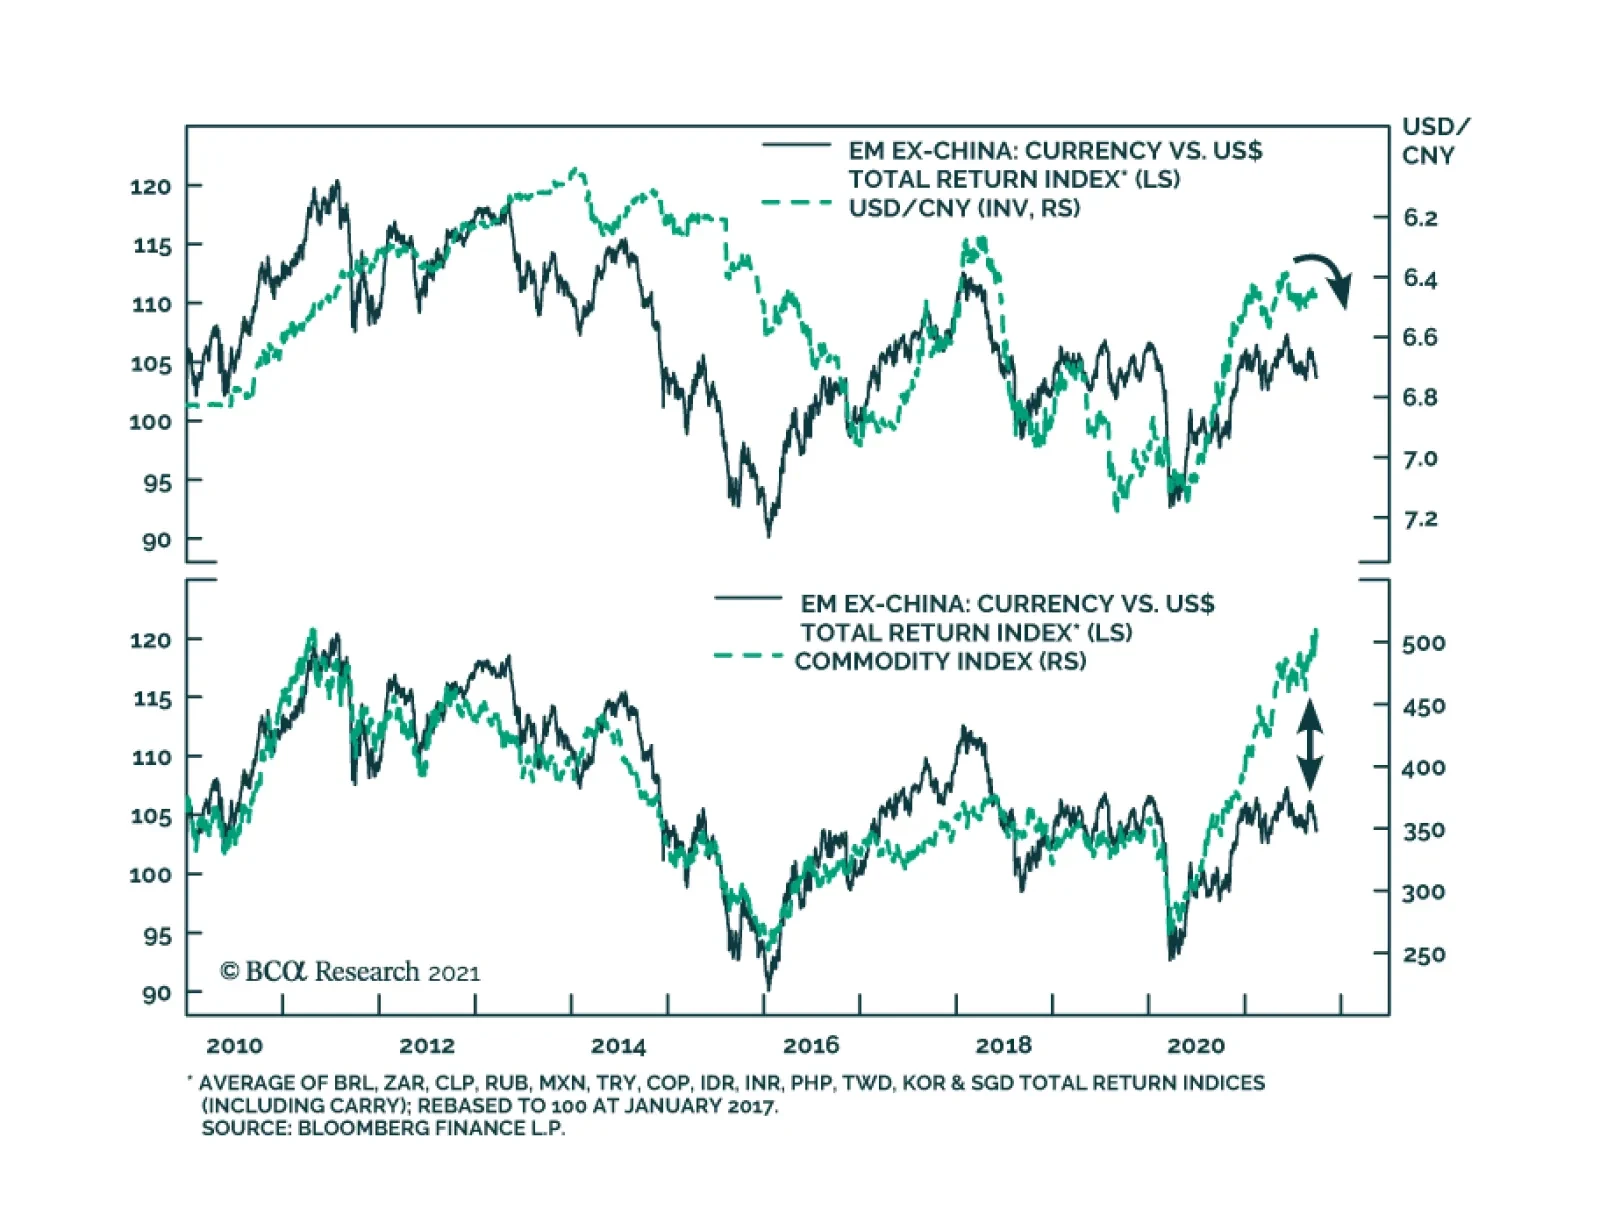
Emerging market currencies have recently rolled over in early-June and are depreciating sharply vis-à-vis the US dollar. Odds are that this downtrend will continue. On the domestic front, it is true that many Emerging Market central banks are already…
Highlights The fourth quarter will be volatile as China still poses a risk of overtightening policy and undermining the global recovery. US political risks are also elevated. A debt default is likely to be averted in the end. Fiscal stimulus could be excessive. There is a 65% chance that taxes will rise in the New Year. A crisis over Iran’s nuclear program is imminent. Oil supply disruptions are likely. A return to diplomacy is still possible but red lines need to be underscored. European political risks are comparatively low, although they cannot go much lower, Russia still poses threats to its neighbors, and China’s economic wobbles will weigh on European assets. Our views still support Mexican equities and EU industrials over the long run but we are booking some gains in the face of higher volatility. Feature Our annual theme for 2021 was “No Return To Normalcy” and events have borne this out. The pandemic has continued to disrupt life while geopolitics has not reverted to pre-Trump norms. Going forward, the pandemic may subside but the geopolitical backdrop will be disruptive. This is primarily due to Chinese policy, unfinished business with Iran, and the struggle among various nations to remain stable in the aftermath of the pandemic. Chart 1Delta Recedes With Vaccinations
Delta Recedes With Vaccinations
Delta Recedes With Vaccinations
Chart 2Global Recovery Marches On
Global Recovery Marches On
Global Recovery Marches On
Chart 3Global Labor Markets On The Mend
Global Labor Markets On The Mend
Global Labor Markets On The Mend
The underlying driver of markets in the fourth quarter will be the fact that the COVID-19 pandemic is waning as vaccination campaigns make progress (Chart 1). New cases of the Delta variant have rolled over in numerous countries and in US states that are skeptical toward vaccines. Global growth will still face crosswinds. US growth rates are unlikely to be downgraded further while Europe’s growth has been upgraded. However, forecasters are likely to downgrade Chinese growth expectations in the face of the government’s regulatory onslaught against various sectors and property sector instability (Chart 2). Barring a Chinese policy mistake, the global composite PMI is likely to stabilize. Labor markets will continue healing (Chart 3). The tug of war between unemployment and inflation will continue to give way in favor of inflation, given that wage pressures will emerge, stimulus-fueled household demand will be strong, and supply shortages will persist. Central banks will try to normalize policy but will not move aggressively in the face of any new setbacks to the recovery. Will China Spoil The Recovery? Maybe. Chinese policy and structural imbalances pose the greatest threat to the global economic recovery both in the short and the long run. The immediate risk to the recovery is clear from our market-based Chinese growth indicator, which has not yet bottomed (Chart 4). The historic confluence of domestic political and geopolitical risks in China is our key view for the year. China is attempting to make the economic transition that other East Asian states have made – away from the “miracle” manufacturing phase of growth toward something more sustainable. But there are two important differences: China is making its political and economic system less open and free (the opposite of Taiwan and South Korea) and it is confronting rather than befriending the United States. The Xi administration is focused on consolidating power ahead of the twentieth national party congress in fall 2022. Xi is attempting to stay in power beyond the ten-year limit that was in place when he took office. On one hand he is presenting a slate of socioeconomic reforms – dubbed “common prosperity” – to curry popular favor. This agenda represents a tilt from capitalism toward socialism within the context of the Communist Party’s overarching idea of socialism with Chinese characteristics. On the other hand, Xi is cracking down on the private sector – Big Tech, property developers – which theoretically provides the base of power for any political opposition. The crackdowns have caused Chinese equities to collapse relative to global and have reaffirmed the long trend of underperformance of cyclical sectors relative to defensives within Chinese investable shares (Chart 5, top panel). Chart 4China Threatens To Spoil The Party
China Threatens To Spoil The Party
China Threatens To Spoil The Party
In terms of financial distress, so far only high-yield corporate bonds have seen spreads explode, not investment grade. But current policies force property developers to liquidate their holdings, pay off debts, and raise cash while forcing banks to cut bank on loans to property developers and homebuyers. (Not to mention curbs on carbon emissions and other policies squeezing industrial and other sectors.) Chart 5Beijing Could Easily Trigger Global Market Riot
Beijing Could Easily Trigger Global Market Riot
Beijing Could Easily Trigger Global Market Riot
If these policies are not relaxed then property developers will continue to struggle, property prices will fall, credit tightening will intensify, and local governments will be starved of revenue and forced to cut back on their own spending. Yet the government’s signals of policy easing are so far gradual and behind the curve. If policy is not relaxed, then onshore equities will sell off (as well as offshore) and credit spreads will widen more generally (Chart 5, bottom panel). Broad financial turmoil cannot be ruled out in the fourth quarter. Ultimately, however, China will be forced to do whatever it takes to try to secure the post-pandemic recovery. Otherwise it will instigate a socioeconomic crisis ahead of the all-important political reshuffle in fall 2022. That would be the opposite of what Xi Jinping needs as he tries to consolidate power. Chinese households have stored their wealth, built up over decades of economic success, in the housing sector (Chart 6). Economic instability could translate to political instability. Chart 6Beijing Will Provide Bailouts And Stimulus … Or Face Political Instability
Fourth Quarter Outlook: So Much For Normalcy!
Fourth Quarter Outlook: So Much For Normalcy!
Investors often ask how the government can ease policy if doing so will further inflate housing prices, which hurts the middle class and is the opposite of the common prosperity agenda. High housing prices are the biggest of the three “mountains” that are said to be crushing the common folks and weighing on Chinese birthrates and fertility (the other two are high education and medical costs). The answer is that while policymakers want to cap housing prices and encourage fertility, they must prevent a general collapse in prices and economic and financial crisis. There is no evidence that suppressing housing prices will increase fertility or birthrates – if anything, falling fertility is hard to reverse and goes hand in hand with falling prices. Rather, evidence from the US, Japan, South Korea, Thailand, and other countries shows that a bursting property bubble certainly does not increase fertility or birthrates (Charts 7A and 7B). Chart 7AEconomic Crash Not A Recipe For Higher Fertility
Economic Crash Not A Recipe For Higher Fertility
Economic Crash Not A Recipe For Higher Fertility
Chart 7BEconomic Crash Not A Recipe For Higher Fertility
Economic Crash Not A Recipe For Higher Fertility
Economic Crash Not A Recipe For Higher Fertility
Bringing it all together, investors should not play down negative news and financial instability emerging from China. There are no checks and balances on autocrats. Our China Investment Strategy has a high conviction view that policy stimulus is not forthcoming and regulatory curbs will not be eased. The implication is that China’s government could make major policy mistakes and trigger financial instability in the near term before changing its mind to try to preserve overall stability. At that point it could be too late. Will Countries Add More Stimulus? Yes. Chart 8Global Monetary Policy Challenges
Global Monetary Policy Challenges
Global Monetary Policy Challenges
With China’s stability in question, investors face a range of crosswinds. Central banks are struggling with a surge in inflation driven by stimulus-fueled demand and supply bottlenecks. The global output gap is still large but rapid economic normalization will push inflation up further if kinks are not removed (Chart 8). A moderating factor in this regard is that budget deficits are contracting in 2022 and coming years – fiscal policy will shift from thrust to drag (Chart 9). However, the fiscal drag is probably overstated as governments are also likely to increase deficit spending on the margin. The US is certainly likely to do so. But before considering US fiscal policy we must address the immediate question: whether the US will default on national debt. Treasury Secretary Janet Yellen has designated October 18 as the “X-date” at which the Treasury will run out of extraordinary measures to make debt payments if Congress does not raise the statutory debt ceiling. There is presumably a few weeks of leeway after this date but markets will grow very jittery and credit rating agencies will start to downgrade the United States, as Standard & Poor’s did in 2011. Chart 9Global Fiscal Drag Rears Its Head
Fourth Quarter Outlook: So Much For Normalcy!
Fourth Quarter Outlook: So Much For Normalcy!
Democrats have full control of Congress and can therefore suspend the debt ceiling through a party-line vote. They can do this through regular legislation, if Republicans avoid raising a filibuster, though that requires Democrats to make concessions in a back-room deal with Republicans. Or they can compromise the filibuster, though that requires convincing moderate Democrats who support the filibuster that they need to make an exception to preserve the faith and credit of the US. Or they can raise the debt ceiling via budget reconciliation, though this would run up against the time limit and so far Senate Leader Chuck Schumer claims to refuse this option. While the odds of a debt default are not zero, the Democrats have the power to avoid it and will also suffer the most in public opinion if it occurs. Therefore the debt limit will likely be suspended at the last minute in late October or early November. Investors should expect volatility but should view it as short-term noise and buy on dips – i.e. the opposite of any volatility that stems from Chinese financial turmoil. Congress is likely to pass Biden’s $550 billion bipartisan infrastructure bill (80% subjective odds). It is also likely to pass a partisan social welfare reconciliation bill over the coming months (65% subjective odds). The full impact on the deficit of both bills should range from $1.1-$1.6 trillion over ten years. This will not be enough to prevent the fiscal drag in 2022 but it will provide for a gradually expanding budget deficit over the course of the decade (Chart 10). Chart 10New Fiscal Stimulus Will Reduce Fiscal Drag On Margin
Fourth Quarter Outlook: So Much For Normalcy!
Fourth Quarter Outlook: So Much For Normalcy!
The reconciliation package will be watered down and late in coming. Investors will likely buy the rumor and sell the news. If reconciliation fails, markets may cheer, as it will also include tax hikes and pose the risk of pushing up inflation and hastening Fed rate hikes. Elsewhere governments are also providing “soft budgets.” The German election results confirmed our forecast that the government will change to left-wing leadership that will be able to boost domestic investment but not raise taxes. This is due to the inclusion of at least one right-leaning party, most likely the Free Democrats. Fiscal deficits will go up. Germany has a national policy consensus on most matters of importance and thus can pass some legislation. But the new coalition will be ideologically split and barely have a majority in the Bundestag, so controversial or sweeping legislation will be unlikely. This outcome is positive for German markets and the euro. Looking at popular opinion toward western leaders and their ruling coalitions since the outbreak of COVID-19, the takeaway is that the Europeans have the strongest political capital (Chart 11). Governments are either supported by leadership changes (Italy, Germany) or likely to be supported in upcoming elections (France). The UK does not face an election until 2024, unless an early election is called. This seems doubtful to us given the government’s strong majority. Chart 11DM Shifts In Popular Opinion Since COVID-19
Fourth Quarter Outlook: So Much For Normalcy!
Fourth Quarter Outlook: So Much For Normalcy!
Chart 12EM Shifts In Popular Opinion Since COVID-19
Fourth Quarter Outlook: So Much For Normalcy!
Fourth Quarter Outlook: So Much For Normalcy!
After all, Canada called an early election and it became a much riskier affair than the government intended and did not increase the prime minister’s political capital. Spain is far more likely to see tumult and an early election. Japan’s election in November will not bring any surprises: as we have written, Kishidanomics will be Abenomics by a different name. The implication is that after November, most developed markets will be politically recapitalized and fiscal policy will continue to be accommodative across the board. In emerging markets, popular opinion has been much more damning for leaders, calling attention to our expectation that the aftershocks of the global pandemic will come in the form of social and political instability (Chart 12). Russia has a record of pursuing more aggressive foreign policy to distract from its domestic ills. The next conflict could already be emerging, with allegations that it is deliberately pushing up natural gas prices in Europe to try to force the new German government to certify and operate the NordStream II pipeline. The Americans are already brandishing new sanctions. Chart 13Stary Neutral Dollar For Now
Stary Neutral Dollar For Now
Stary Neutral Dollar For Now
Brazil and Turkey both face extreme social instability in the lead-up to elections in 2022 and 2023. India has been the chief beneficiary of today’s climate but it also faces an increase in political and geopolitical risk due to looming state elections and its increasing alliance with the West against China. Putting it all together, the US is likely to stimulate further and pump up inflation expectations. Europe is politically stable but Russia disrupt it. Other emerging markets, including China, will struggle with economic, political, and social instability. This is an environment in which the US dollar will remain relatively firm and the renminbi will depreciate – with negative effects on EM currencies more broadly (Chart 13). Annual Views On Track Our three key views for 2021 are so far on track but face major tests in the fourth quarter: 1. China’s internal and external headwinds: If China overtightens policy and short-circuits the global economic recovery, then its domestic political risks will have exceeded even our own pessimistic expectations. We expect China to ease fiscal policy and do at least the minimum to secure the recovery. Investors should be neutral on risky assets until China provides clearer signals that it will not overtighten policy (Chart 14). 2. Iran is the crux of the US pivot to Asia: A crisis over Iran is imminent since Biden did not restore the 2015 nuclear deal promptly upon taking office. Any disruption of Middle Eastern energy flows will add to global supply bottlenecks and price pressures. Brent crude oil prices will see upside risks relative both to BCA forecasts and the forward curve (Chart 15). Chart 14Wait For China To Relax Policy
Wait For China To Relax Policy
Wait For China To Relax Policy
Chart 15Expect A Near-Term Crisis Over Iran
Expect A Near-Term Crisis Over Iran
Expect A Near-Term Crisis Over Iran
The reason is that Iran is expected to reach nuclear “breakout” capability by November or December (i.e. obtain enough highly enriched uranium to make a nuclear device). The Biden administration is focused on diplomacy and so far hesitant to impose a credible threat of war to halt Iranian advances. Israel’s new government has belatedly admitted that it would be a good thing for the US and Iran to rejoin the 2015 nuclear deal – if not, it supports a global coalition to impose sanctions, and finally a military option as a last resort. Biden will struggle to put together a global coalition as effective as Obama did, given worse relations with China and Russia. The US and Israel are highly likely to continue using sabotage and cyberattacks to slow Iran’s nuclear and missile progress. Chart 16Pivot To Asia Runs Through Iran
Pivot To Asia Runs Through Iran
Pivot To Asia Runs Through Iran
Chart 17Europe: A Post-Trump Winner? Depends On China
Europe: A Post-Trump Winner? Depends On China
Europe: A Post-Trump Winner? Depends On China
Thus the Iranians are likely to reach breakout capability at which point a crisis could erupt. The market is not priced for the next Middle East crisis (Chart 16). Incidentally, any additional foreign policy humiliation on top of Afghanistan could undermine the Biden administration more broadly, in both domestic and foreign policy. 3. Europe benefits most from a post-pandemic, post-Trump world: Europe is a cyclical economy and is also relatively politically stable in a world of structurally rising policy uncertainty and geopolitical risk. We thought it stood to benefit most from the global recovery and the passing of the Trump administration. However, China’s policy tightening has undermined European assets and will continue to do so. Therefore this view is largely contingent on the first view (Chart 17). Investment Takeaways Strategically we maintain a diversified portfolio of trades based on critical geopolitical themes: long gold, short China/Taiwan, long developed markets, long aerospace/defense, long rare earths, and long value over growth stocks. Taiwanese equities have continued to outperform despite bubbling geopolitical tensions. We maintain our view that Taiwan is overpriced and vulnerable to long-term semiconductor diversification as well as US-China conflict. Our rare earths basket, which focuses on miners outside China, has been volatile and stands to suffer if China’s growth decelerates. But global industrial, energy, and defense policy will continue to support rare earths and metals prices. Russian tensions with the West have been manageable over the course of the year and emerging European stocks have outperformed developed European peers, contrary to our recommendation. However, fundamental conflicts remain unresolved and the dispute over the recently completed Nord Stream II pipeline to Germany could still deal negative surprises. We will reassess this recommendation in a future report. We are booking gains on the following trades: long Mexico (8%), long aerospace and defense in absolute terms (4%), long EU industrials relative to global (4%), and long Italian BTPs relative to bunds (0.2%). Matt Gertken Vice President Geopolitical Strategy mattg@bcaresearch.com Appendix: GeoRisk Indicator China
China: GeoRisk Indicator
China: GeoRisk Indicator
Russia
Russia: GeoRisk Indicator
Russia: GeoRisk Indicator
United Kingdom
UK: GeoRisk Indicator
UK: GeoRisk Indicator
Germany
Germany: GeoRisk Indicator
Germany: GeoRisk Indicator
France
France: GeoRisk Indicator
France: GeoRisk Indicator
Italy
Italy: GeoRisk Indicator
Italy: GeoRisk Indicator
Canada
Canada: GeoRisk Indicator
Canada: GeoRisk Indicator
Spain
Spain: GeoRisk Indicator
Spain: GeoRisk Indicator
Taiwan
Taiwan: GeoRisk Indicator
Taiwan: GeoRisk Indicator
Korea
Korea: GeoRisk Indicator
Korea: GeoRisk Indicator
Turkey
Turkey: GeoRisk Indicator
Turkey: GeoRisk Indicator
Brazil
Brazil: GeoRisk Indicator
Brazil: GeoRisk Indicator
Australia
Australia: GeoRisk Indicator
Australia: GeoRisk Indicator
Appendix: Geopolitical Calendar
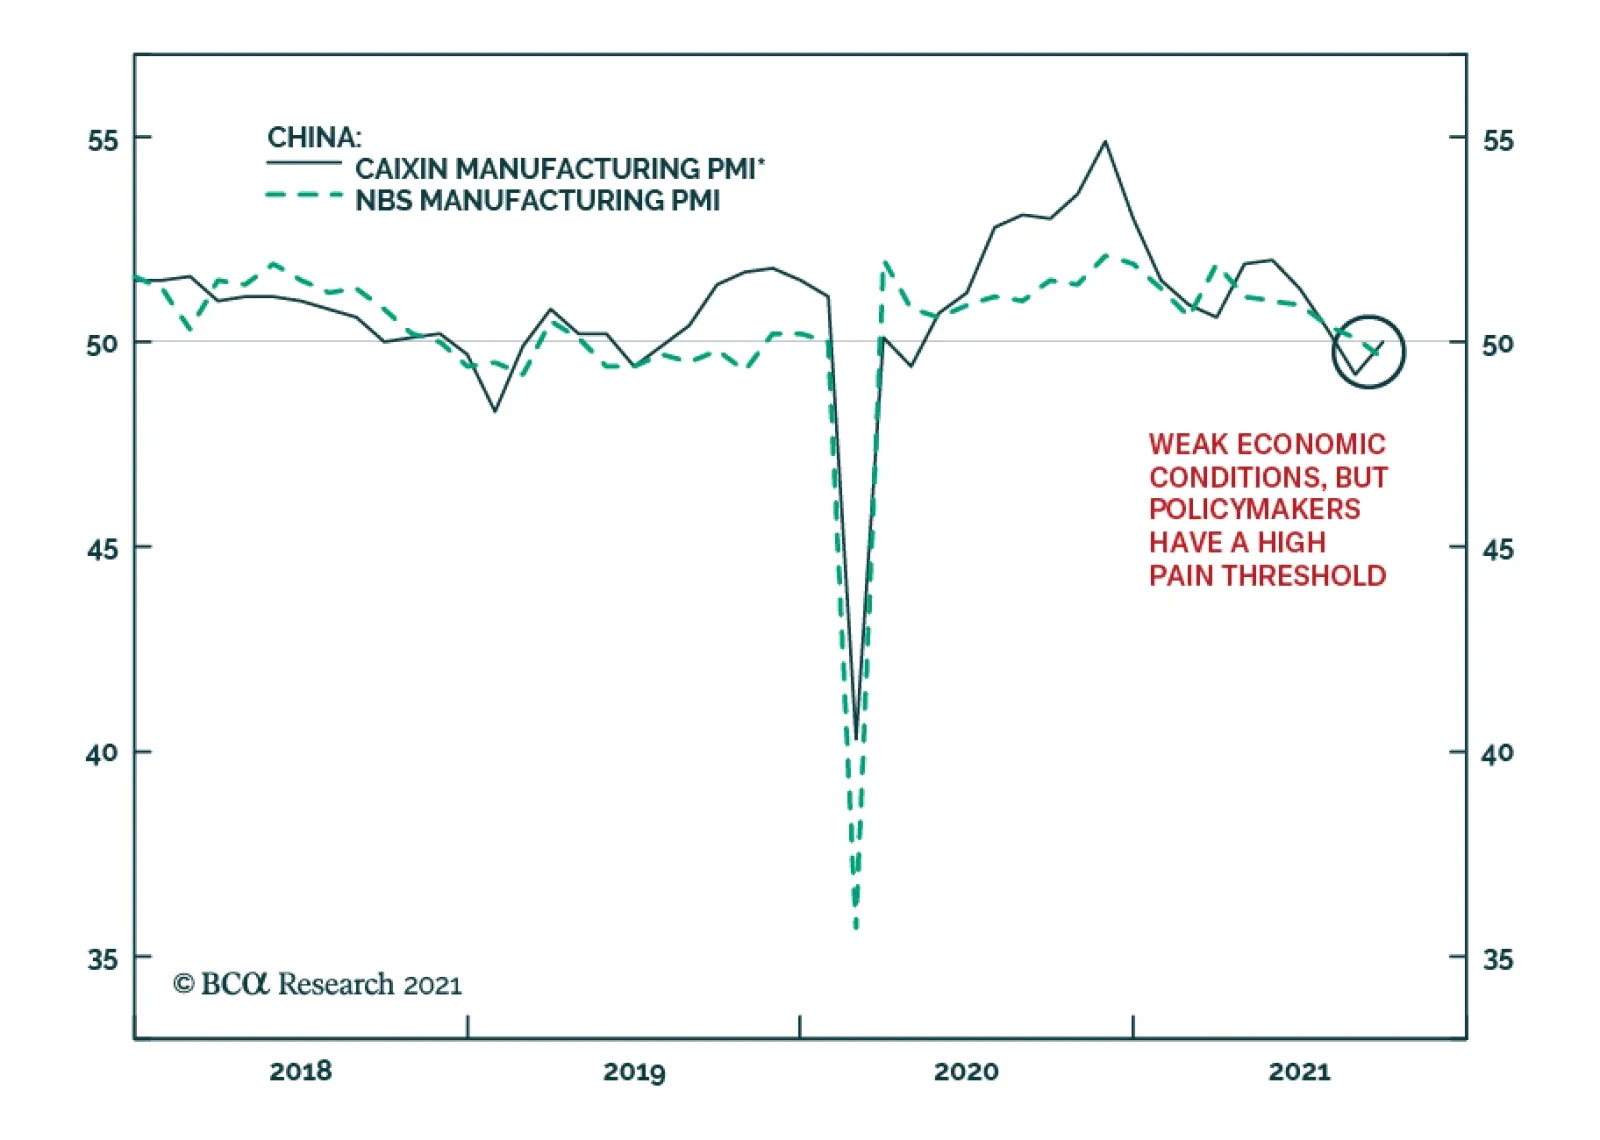
China’s NBS and Caixin Manufacturing PMIs sent a contradictory signal for September. The official manufacturing index slipped into contractionary territory after declining 0.5 points to 49.6. Consensus estimates anticipated a marginal decline to 50.…