Economic Growth

Highlights We cannot predict how China will manage Evergrande precisely but we have a high conviction that it will do whatever it takes to prevent contagion across the property sector. However, China’s stimulus tools are losing their effectiveness over time. The country is due for a prolonged struggle with financial and economic instability regardless of whether Evergrande defaults. A messy default would obviously exacerbate the problem. China’s regulatory crackdowns target private companies and will continue to weigh on animal spirits in the private sector. The government will be forced to use fiscal policy to compensate. The US’s and China’s switch from engagement to confrontation poses a persistent headwind for investor sentiment toward China. The new consensus that investors should buy into China’s “strategic sectors” to avoid arbitrary regulatory crackdowns is vulnerable to its own logic and to sanctions by the US and its allies. Feature China poses a unique confluence of domestic and foreign political risks and global markets are now pricing them. Property giant Evergrande could default on $120 million in onshore and offshore interest payments as early as September 23, or next month, prompting investors to run for cover. Is this crisis fleeting or part of a larger systemic failure? It is a larger systemic failure. We expect a slow-motion, Japanese-style crisis over the coming decade, marked with periodic bailouts and stimulus packages. We recommend investors stay the course: steer clear of China and stay short the renminbi and Taiwanese dollar. Tactically, stick with large caps, defensive sectors, and developed markets within the global equity universe. Strategically, prefer emerging markets that benefit from forthcoming Chinese (and American) stimulus. 1. A “Minsky Moment” Cannot Be Ruled Out The chief fear is whether the approaching default of Evergrande marks China’s “Minsky Moment.” Hyman Minsky’s financial instability hypothesis held that long periods of stable revenues lead to risky financial deals and large accumulations of systemic risk that are underpriced. When revenues cannot cover interest payments, a crash ensues followed by deleveraging. Minsky’s hypothesis speaks to debt crises in an entire economy, yet nobody knows for sure whether China’s economy has reached such a breaking point. China’s national savings rate stands at 45.7% of GDP and nominal growth exceeds the long-term government bond yield. However, a sharp drop in asset prices, especially in the property sector, could change everything, as it could lead to balance sheet recession among corporates and a fall in national income. Evergrande is supposed to make an $84 million interest payment on offshore debt and a $36 million payment on onshore debt this week, and after 30 days it would default. It owes $37 billion in debt payments over the next 12 months but only has $13 billion cash on hand (as of June 30, 2021). Authorities can opt for a full bailout or a partial bailout, in which the company defaults on offshore bonds but not onshore. They could even let the company fail categorically, though that would produce exactly the kind of precipitous drop in property asset prices that would lead to wider financial contagion. State intervention to smooth the crisis is more likely – and the government can easily pressure other companies into acquiring Evergrande’s assets and business divisions. Chart 1Yes, This Could Be China's Minsky Moment
Yes, This Could Be China's Minsky Moment
Yes, This Could Be China's Minsky Moment
Chart 1 shows that China’s corporate debt-to-GDP ratio stands head and shoulders above other countries that experienced financial crises in recent decades, courtesy of our Emerging Markets Strategy. While China can undoubtedly bear large debts due to its savings, the implication is that China has large enough financial imbalances to suffer a full-fledged financial crisis, even if the timing is hard to predict. Household credit is also elevated at 61.7% of GDP, and the household debt-to-disposable-income ratio is now higher than in the United States. About two-thirds of China’s corporate debt is held by state-owned or state-controlled entities, prompting some investors to dismiss the gravity of the risk. However, financial crises often involve the transfer of debt from the state to private sector or vice versa. 59% of bond defaults in H1 2021 have involved state companies. Total debt is the main concern. Don’t take our word for it: China’s Communist Party has warned for the past decade about the danger of “implicit guarantees” and “moral hazard” that encourage financial excesses in the corporate sector. The Xi Jinping administration has tried to induce a deleveraging process since it came to power in 2012-13. Xi’s “three red lines” for the property sector precipitated the current turmoil. Even if Evergrande’s troubles are managed, China’s systemic risks will continue to boil over as its potential growth rate slows and the government continues trying to wring out financial excesses. Chart 2Policy Uncertainty, Financial Stress Can Rise Higher
Policy Uncertainty, Financial Stress Can Rise Higher
Policy Uncertainty, Financial Stress Can Rise Higher
More broadly China is experiencing an unprecedented overlap of economic and political crises: The population is aging and labor force is shrinking; The economic model since 2009 has been changing from export-manufacturing to domestic-oriented, investment-driven growth; Indebtedness is spreading from corporates to households and ultimately the government; The governance model is shifting from “single-party rule” to “single-person rule” or autocracy; The population is reaching middle class status and demanding better quality of life; The international trade environment is turning from hyper-globalization to hypo-globalization; The geopolitical backdrop is darkening with the US and its allies attempting to contain China’s ambitions of regional supremacy. Almost all of these changes bring more risks than opportunities to China over the long haul. The need for rapid policy shifts provides the ostensible reasoning for President Xi Jinping’s decision not to step down but to remain president for the foreseeable future. He will clinch this position at the twentieth national party congress in fall 2022. The implication is that policy uncertainty will continue climbing up to at least 2019 peaks while offshore equity markets will continue to trend lower, as they have done since the onset of the US trade war (Chart 2). Credit default swap rates have so far been subdued but they are showing signs of life. A sharp rise in policy uncertainty and property sector stress would pull them up. Domestic equities (A-shares) have rallied since 2019 but we would expect them to fall back given China’s historic confluence of structural and cyclical challenges, which will create further negative surprises (Chart 2, bottom panel). 2. Beijing Will Provide Bailouts And Stimulus Ad Nauseum Evergrande’s future may be in doubt but Beijing will throw all its power at stopping nationwide financial contagion. True, a policy miscalculation is possible. A tardy or failed intervention cannot be ruled out. However, investors should remember that a clear pattern of bailouts and stimulus has emerged over the course of the Xi Jinping administration whenever a “hard landing” or financial collapse loomed. The government tightens controls on bloated sectors until the financial fallout threatens to undermine general economic and social stability, at which point the government eases policy. It is often forced to stimulate the economy aggressively. Chart 3 shows these cycles in two ways: China’s control of credit through the state-controlled banks, and the frequency of news stories mentioning important terms associated with financial and economic distress: defaults, layoffs, and bankruptcies. These three terms used to be unheard of among China watchers. Under the Xi administration, a higher tolerance of creative destruction has served as the way to push forward reform. The current rise in distress is not extended, suggesting that more bad news is coming, but it also shows that the government has repeatedly been forced to provide stimulus even under the Xi administration. Chart 3Xi Jinping Has Bailed Out System Three Times Already
Xi Jinping Has Bailed Out System Three Times Already
Xi Jinping Has Bailed Out System Three Times Already
Could this time be different? Not likely. The American experience and the pandemic will also force China’s government to ease policy: China learns from US mistakes. The US lurched from Lehman’s failure into a financial crisis, an impaired credit channel, a sluggish economic recovery, a spike in polarization, policy paralysis, a near-default on the national debt, a surge in right- and left-wing populism, the tumultuous Trump presidency, widespread social unrest, a contested leadership succession, and a mob storming the nation’s capitol (Chart 4). This is obviously the nightmare of any Chinese leader and a trajectory that the Xi administration will avoid at any cost. Chart 4Lehman Brothers A Powerful Disincentive For China To Let Evergrande Fail
Lehman Brothers A Powerful Disincentive For China To Let Evergrande Fail
Lehman Brothers A Powerful Disincentive For China To Let Evergrande Fail
Chinese households store their wealth in the property sector, so any attempt at policy restraint or austerity faces a massive constraint. Only a few countries are comparable to China with respect to the share of non-financial household wealth (property and land) within total household wealth. All of them are hosts of property sector bubbles, including the bubbles in Spain and Ireland back in 2007 (Chart 5). A property collapse would destroy the savings of the Chinese people over four decades of prosperity. Chart 5Property Is The Bedrock Of Chinese Households
Five Points On China’s Crisis
Five Points On China’s Crisis
Social instability is already flaring up. Almost all China experts agree that “social stability” is the Communist Party’s bottom line. But note that the Evergrande saga has already led to protests, not only at the company’s headquarters in Shenzhen but also in other cities such as Shenyang, Guangzhou, Chongqing. Protests were filmed and shown on social media (posts have been censored). Protesters demanded repayment for wealth management products gone sour and properties they are owed that have not been built. This is only a taste of the cross-regional protests that would emerge if the broader property sector suffered. The lingering COVID-19 pandemic is still relevant. Investors should not underrate the potential threat that the pandemic poses to the regime. Severe epidemics have occurred about 11% of the time over the course of China’s history and they often have major ramifications. Disease has played a role in the downfall of six out of ten dynasties – and in four cases it played a major role. It would be suicidal for any regime to add self-inflicted economic collapse to a lingering pandemic (Table 1). Table 1Disease Threatens Chinese Dynasties – Not A Time To Self-Inflict A Recession
Five Points On China’s Crisis
Five Points On China’s Crisis
Easing policy does not necessarily mean bringing out the “bazooka” and splurging on money and credit growth, though that is increasingly likely as the crisis intensifies. Notably the July Politburo statement specifically removed language that said China would “avoid sharp turns in policy.” In other words, sharp turns might be necessary. That can only mean sharp reflationary turns, as there is very little chance of doubling down on policy tightening. A counterargument holds that the Chinese government is now exclusively focused on power consolidation to the neglect of financial and economic stability. Perhaps the leadership is misinformed, overconfident, or thinks a financial collapse will better purge its enemies – along the lines of the various political purges under Chairman Mao Zedong. Wealthy tech magnates and property owners could conceivably challenge the return of autocracy. After all, the US political establishment almost “fell” to a rich property baron – why couldn’t China’s Communist Party? Political purges should certainly be expected ahead of next year’s party congress. But not to the point of killing the economy. The government would not be trying to balance policy tightening and loosening so carefully if it sought to induce chaos. It must be admitted, however, that the change to autocracy means that the odds of irrational or idiosyncratic policy have gone up substantially and permanently. Of course, the high likelihood that Beijing will provide bailouts and stimulus should not be read as a bullish investment thesis, even though it would create a pop in oversold assets. The Chinese system is saturated with money and credit, which have been losing their effectiveness in driving growth. Financial imbalances get worse, not better, with each wave of credit stimulus. Beijing is caught between a rock and a hard place. Hence stimulus comes only reluctantly and reactively. But it does come in the end because a financial crash would threaten the life of the regime and preclude all other policy priorities, domestic and foreign. 3. Yes, China’s Regulatory Crackdown Targets The Private Sector Global growth and other emerging economies will get most of the benefit once China stimulates, since China’s own firms will still face a negative domestic political backdrop. Bullish investors argue that the government’s regulatory tightening is misunderstood and overblown. The claim is that China is not targeting the private sector generally but only isolated sectors causing social problems. Costs need to be reduced in property, education, and health to improve quality of life. China shares the US’s and EU’s desire to rein in tech giants that monopolize their markets, abuse consumer data and privacy, and benefit from distorted tax systems. Most of these arguments are misleading. China does not have a strong record on data privacy, equality, social safety nets, rule of law, or “sustainable” growth (as opposed to “unsustainable,” high-debt, high-polluting growth). China actively encourages state champions that monopolize key sectors. Many developed markets have better records in these areas, notably in Europe, yet China is eschewing these regulatory models in preference for an approach that is arbitrary and absolutist, i.e. negative for governance. As for the private sector, animal spirits have been in a long decline throughout the past decade. This is true whether judging by money velocity – i.e. the pace of economic activity relative to the increase in money supply – or by households’ and businesses’ marginal propensity to save (Chart 6). The 2015-16 period shows that even periodic bouts of government stimulus have not reversed the general trend. Regulatory whack-a-mole and financial turmoil will not improve the situation. Chart 6Private Sector Animal Spirits Depressed Throughout Xi Era
Private Sector Animal Spirits Depressed Throughout Xi Era
Private Sector Animal Spirits Depressed Throughout Xi Era
Chart 7Even Official Data Shows Consumer Confidence Flagging
Even Official Data Shows Consumer Confidence Flagging
Even Official Data Shows Consumer Confidence Flagging
Surveys of sentiment confirm that the latest developments will have a negative effect (Chart 7). Cumulatively, the changes in China’s domestic and international policy context are being interpreted as negative for business, entrepreneurship, and economic freedom – notwithstanding the government’s claims to expand opportunity in its “common prosperity” plan. 4. The Withdrawal Of US Friendship Is A Headwind For China Chart 8Other Asians Sought US Friendship, Not Conflict, When Export Models Expired
Other Asians Sought US Friendship, Not Conflict, When Export Models Expired
Other Asians Sought US Friendship, Not Conflict, When Export Models Expired
All of the successful Asian economies – including China for most of the past forty years of prosperity – have tried to stay on the good side of the United States. By contrast, China and the US today are shifting from engagement to confrontation and breaking up their economic ties (Chart 8). This is a problem for China because the US and to some extent its allies will seek to undermine China’s economy and its autocratic model as part of this great power competition. The rise in geopolitical risk is underscored by the Australia-UK-US (AUKUS) agreement, by which the US will provide Australia with nuclear submarines over the next decade. This was a clear demonstration of the US’s “pivot to Asia” and the fact that the US and China are preparing for war – if only to deter it. China’s return to autocracy and clash with the US and Asian neighbors is also leading to a deterioration of its global image, particularly over issues of transparency and information sharing. The dispute over the origins of COVID-19 is a major source of division with the US and other countries. Transparency is important for investors. The World Bank has discontinued its “Ease of Doing Business” rankings after a scandal was revealed in which China’s ranking was artificially bumped up. The last-published trend is still downward (Chart 9). Most recently China has stepped up censorship of its financial news media amid the current market turmoil, which makes it harder for investors to assess the full extent of property and financial risks.1 The US political factions agree on China-bashing if nothing else. The Biden administration has little political impetus to eschew tariffs and export controls. One important penalty will come from the Securities and Exchange Commission, which is likely to ban Chinese firms from US stock exchanges unless they conform to common accounting standards. Hence the dramatic fall in the share prices of Chinese companies listed via American Depository Receipts (ADRs), in both absolute and relative terms (Chart 10, top panel). This threat prompted China’s recent crackdown on its own firms that were attempting to hold initial public offerings on US exchanges. Chart 9US Conflict Exposes China’s Global Influence Campaign
Five Points On China’s Crisis
Five Points On China’s Crisis
The Quadrilateral Forum – the US, Japan, Australia, and India – has agreed to link the semiconductor supply chain to human rights standards, foreclosing China’s participation in that supply chain. US semiconductor firms are among the most exposed to China but they have not suffered over the course of the US-China tech war, suggesting that US vulnerabilities are limited (Chart 10, bottom panel). Chart 10US Regulators Will Kick Chinese Firms While They Are Down
US Regulators Will Kick Chinese Firms While They Are Down
US Regulators Will Kick Chinese Firms While They Are Down
The point is not to exaggerate the strength of the US and its allies but rather the costs to China of actively opposing them. The US has a difficult enough time cobbling together a coalition of states to impose sanctions on Iran over its nuclear program, not to mention forming any coalition that would totally exclude and isolate China. China is far more important to US allies than Iran – it is irreplaceable in the global economy (Chart 11). The EU and China’s Asian neighbors will typically restrain the US’s more aggressive impulses so as not to upset the global recovery or end up on the front lines of a war.2 Chart 11No Substitute For China In Global Economy
Five Points On China’s Crisis
Five Points On China’s Crisis
This diplomatic constraint on the US is probably positive for global growth but not for China per se. American allies are still able to increase the costs on China for pursuing its own state-backed development path and geopolitical sphere of influence. Japan, Australia, and others are likely to veto China’s application to join the Comprehensive and Progressive Trans-Pacific Partnership (CPTPP), while the UK and eventually the US are likely to join it. Investors should view US-China ties as a headwind at least until the two powers manage to negotiate a diplomatic thaw, i.e. substantial de-escalation of tensions. A thaw is unlikely in the lead-up to Xi Jinping’s consolidation of power and the US midterm elections in fall 2022. Presidents Biden and Xi are still working on a bilateral summit, not to mention a more substantial improvement in ties. We doubt a diplomatic thaw would be durable anyway but the important point is that until it happens China will face periodic bouts of negative sentiment from the emerging cold war. Other Asian economies thrived under US auspices – China is sailing in uncharted waters. 5. Global Investors Cannot Separate Civilian From State And Military Investments The word on Wall Street is that investors should align their strategies with those of China’s leaders so as not to run afoul of arbitrary and draconian regulators. For example, instead of “soft tech” or consumer-oriented companies – like those that give people rides, deliver food, or make creative video games – investors should invest in “hard tech” or strategic companies like those that make computer chips, renewable energy, biotechnologies, pharmaceuticals, and capital equipment. There is no question that the trend in China – and elsewhere – is for governments to become more active in picking winners and losers. Industrial policy is back. Investors have no choice but to include policy analysis in their toolbox. However, for global investors, an investment strategy of buying whatever the government says is far from convincing. The most basic investment strategy in keeping with the Xi administration’s goals would be to invest in state-owned enterprises in domestic equity markets. So SOEs should have outperformed the market, right? Wrong. They were in a downtrend prior to the 2015 bubble, the burst of which caused a further downtrend (Chart 12, top panel). Similarly, the preference for “hard tech” over “soft tech” is promising in theory but complicated in practice: hard tech is flat-to-down over the decade and down since COVID-19 (Chart 12, middle panel). It has underperformed its global peers (Chart 12, bottom panel). China’s policy disposition should be beneficial for industrials, health care, and renewable energy. First, China is doubling down on its manufacturing economy. Second, the population is aging and health care is a critical part of the common prosperity plan. Third, green energy is a way of diversifying from dependency on imported oil and natural gas. However, the profile of these sectors relative to their global counterparts is only unambiguously attractive in the case of industrials, which began to outperform even during the trade war (Chart 13). Chart 12State Approved' Trades Still Bring Risks
State Approved' Trades Still Bring Risks
State Approved' Trades Still Bring Risks
Chart 13Beware 'State Approved' Trades
Beware 'State Approved' Trades
Beware 'State Approved' Trades
In Table 2 we outline the valuations and political risks of onshore equity sectors. Valuations are not cheap. Domestic and foreign risks are not fully priced. Table 2China Onshore Equities, Valuations, And (Geo)Political Risks
Five Points On China’s Crisis
Five Points On China’s Crisis
There is a bigger problem for global investors, especially Americans: investing in China’s strategic sectors directly implicates investors in the Communist Party’s domestic human rights practices, state-owned enterprises, and national security goals. “Civil-military fusion” is a well-established doctrine that calls for the People’s Liberation Army to have access to the cutting-edge technology developed by civilians and vice versa. These investments will eventually be subject to punitive measures since the US policy establishment believes it can no longer afford to let US wealth buttress China’s military and technological rise. Investment Takeaways China may or may not work out a partial bailout for Evergrande but it will definitely provide state assistance and fiscal stimulus to try to prevent contagion across the property sector and financial system. Bad news in the coming weeks and months will be replaced by good news in this sense. However, the fact that China will eventually be forced to undertake traditional stimulus yet again will increase its systemic financial risks, in a well-established pattern. The best equity opportunities will lie outside of China, where companies will benefit from global recovery yet avoid suffering from China’s unique confluence of domestic and foreign political risks. We prefer developed markets and select emerging markets in Latin America and Asia-ex-China. Chinese households and businesses are downbeat. This behavior cannot be separated from the historic changes in the economy, domestic politics, and foreign policy. It is hard to see an improvement until the government boosts growth and the 2022 political reshuffle is over. American opposition is a bigger problem for China than global investors realize. Not only are the two economies divorcing but other democracies will distance themselves from China as well – not because of US demands but because their own manufacturing, national security, and ideological space is threatened by China’s reversion to autocracy and assertive foreign policy. Investing in China’s “hard tech” and strategic sectors with government approval is not a simple solution. This approach will directly funnel capital into China’s state-owned enterprises, domestic security forces, and military. As such the US and West will eventually impose controls. Investments may not be liquid since China would suffer if capital ever fled these kinds of projects. Both American and Chinese stimulus is looming this winter but the short run will see more volatility. We are closing our long JPY-KRW tactical trade for a gain of 4.4% Matt Gertken Vice President Geopolitical Strategy mattg@bcaresearch.com Footnotes 1 We have often noted in these pages over the past decade that multilateral organizations overrated improvements in China’s governance based on policy pronouncements rather than structural changes. 2 Still, tensions among the allies should not be overrated since they share a fundamental concern over China’s increasing challenge to the current global order. The EU is pursuing trade talks with Taiwan, and there are ways that the US can compensate France over the nullification of its submarine sales to Australia (most of which are detrimental to China’s security).
BCA Research’s Global Investment Strategy service upgraded its rating on EM equities and currencies to strong overweight After lagging the global indices, EM stocks are set to outperform during the remainder of this year and into 2022. Five factors will…
Dear Client, I will be holding a webcast next Friday, September 24th at 10:00 AM EDT (3:00 PM BST, 4:00 PM CEST, 11:00 PM HKT) with BCA Research’s Chief Emerging Markets Strategist Arthur Budaghyan where we will debate the outlook for EM stocks. As this week’s report conveys, I am bullish, while Arthur is in the bearish camp. Please join us for what is sure to be a fiery debate. Also, instead of our regular report next week, we will be sending you a Special Report written by Matt Gertken, BCA Research’s Chief Geopolitical Strategist, discussing the stability of the American political system. I hope you will find it insightful. We will be back the following week with the GIS Quarterly Strategy Outlook, where we will explore the major trends that are set to drive financial markets in the rest of 2021 and beyond. As always, I will hold a webcast discussing the outlook the week after, on Thursday, October 7th. Best regards, Peter Berezin Chief Global Strategist Highlights After lagging the global indices, EM stocks are set to outperform during the remainder of this year and into 2022. Go long the EM FTSE index versus the global benchmark (ETF proxy: VWO versus VT). Five factors will support EM assets over the coming months: 1) The vaccination campaign in emerging markets is in full swing; 2) Domestic EM inflation will crest; 3) China will stimulate its economy; 4) The US dollar will weaken; and 5) EM valuations have discounted a lot of bad news. Contrary to popular perception, the Chinese government has not launched an indiscriminate attack on tech companies. If anything, heightened geopolitical tensions have made it more important than ever for China to buttress its tech sector. Investors wanting to gain exposure to Chinese tech while still limiting risk should consider writing cash-covered puts. For example, a strategy of selling puts on Alibaba could generate a 9% annualized yield while giving investors access to the stock at a forward PE ratio of only 12.5. Go long an equally-weighted basket consisting of the Russian ruble and Brazilian real against the US dollar. Both currencies enjoy favorable interest rate differentials and will benefit from continued strength in commodity markets. Debating The EM Outlook BCA Research has some of the brightest, most creative strategists in the world. While we often agree on many issues, we sometimes disagree. The near-term outlook for emerging markets is a case in point. My colleague, Chief EM Strategist Arthur Budaghyan, is bearish on emerging markets over a 3-to-6 month horizon. In contrast, I am bullish. In this note, I explain why. I see five reasons why EM assets will do very well during the remainder of the year and into 2022: 1) The vaccination campaign in emerging markets is in full swing; 2) Domestic EM inflation will crest; 3) China will stimulate its economy; 4) The US dollar will weaken; and 5) EM valuations have discounted a lot of bad news. Let’s examine all five reasons in turn. Vaccine Access In Emerging Markets Is Improving The proportion of EM populations which have been vaccinated is rising rapidly (Chart 1). India is now vaccinating 10 million people per day, a number that would have seemed unimaginable just a few months ago. Chart 1EM Vaccination Rates Have Been Ramping Up Rapidly
The Best Trade For The Rest Of 2021: Long EM Equities And Currencies
The Best Trade For The Rest Of 2021: Long EM Equities And Currencies
Globally, about 10 billion doses of vaccine will be produced this year (Chart 2). This does not include potential new mRNA vaccines that China is developing. China-based Walvax Biotechnology is conducting late-stage trials in Nepal, with mass production of the vaccine expected to start in October. Sinopharm is also working on its own mRNA vaccine. Meanwhile, the number of new Covid cases in most EM economies has peaked, permitting a relaxation of lockdown measures (Chart 3). Goldman’s Effective Lockdown Index for China has eased significantly since mid-August, although this week’s outbreak in Fujian province could partially reverse that trend. Chart 2At Least 10 Billion Doses Of Vaccine Will Be Produced This Year
The Best Trade For The Rest Of 2021: Long EM Equities And Currencies
The Best Trade For The Rest Of 2021: Long EM Equities And Currencies
Chart 3EM Lockdown Measures Have Eased As The Number Of New Cases Has Peaked
The Best Trade For The Rest Of 2021: Long EM Equities And Currencies
The Best Trade For The Rest Of 2021: Long EM Equities And Currencies
It is true, as Arthur has pointed out, that vaccine hesitancy is a problem in some emerging markets. However, this may not be as significant an issue as previously believed. The huge spike in cases in highly vaccinated countries such as Israel and the UK shows that herd immunity is a pipe dream. Given this reality, as long as everyone who wants a vaccine is able to receive it, the political pressure to maintain lockdowns will dissipate. Pandemic-Induced Spike In Inflation Is Fading As in most developed economies, many emerging markets have experienced a post-pandemic rise in inflation (Chart 4). Whereas DM central banks generally looked through the inflation spike, many EMs did not have that luxury. Chart 4Inflation Across The EM Universe
The Best Trade For The Rest Of 2021: Long EM Equities And Currencies
The Best Trade For The Rest Of 2021: Long EM Equities And Currencies
Worried about an unmooring of inflation expectations and currency depreciation, central banks in such countries as Brazil, Mexico, Chile, Colombia, Peru, Russia, and Turkey have all raised rates this year. Higher rates have weighed on EM growth and financial markets. The good news is that inflationary pressures are starting to abate. This week’s US CPI report for August showed an absolute decline in prices in pandemic-related categories such as airfares, hotels, admissions, and vehicles (Chart 5). Things are even improving on the semiconductor front. Chart 6 shows that memory chip prices are in a clear downtrend. Chart 5Pandemic-Driven Inflation Is Cresting
The Best Trade For The Rest Of 2021: Long EM Equities And Currencies
The Best Trade For The Rest Of 2021: Long EM Equities And Currencies
Chart 6Chip Prices Are Off Their Highs
Chip Prices Are Off Their Highs
Chip Prices Are Off Their Highs
Chart 7Agricultural Prices Have Stabilized, Which Will Help Cool EM Inflation
Agricultural Prices Have Stabilized, Which Will Help Cool EM Inflation
Agricultural Prices Have Stabilized, Which Will Help Cool EM Inflation
Critically for emerging markets, agricultural prices have stabilized (Chart 7). Historically, food inflation has been a major driver of EM inflation. Chinese Stimulus On The Way Growth in China was quite weak in the first half of the year, averaging only 3.5% on a sequential annualized basis (Chart 8). The Bloomberg consensus estimate is for Q3 growth to hit 4.3%, reflecting the negative impact of lockdown measures and the lagged effect from policy tightening. Growth in the fourth quarter is expected to rebound to only 5.7%. This seems too low to us. Barring a major spike in Covid cases, Chinese industry will be saddled with fewer social distancing restrictions in the fourth quarter. Policy is also turning more stimulative. The PBOC cut bank reserve requirements in July. In the past, cuts in reserve requirements have been a reliable predictor of faster credit growth (Chart 9). Chart 8Chinese Growth Should Accelerate After A Disappointing First Half Of 2021
Chinese Growth Should Accelerate After A Disappointing First Half Of 2021
Chinese Growth Should Accelerate After A Disappointing First Half Of 2021
Chart 9Chinese Stimulus Is On The Way
Chinese Stimulus Is On The Way
Chinese Stimulus Is On The Way
With credit growth back to its 2018 lows, there is little need for further actions to reduce lending. On the contrary, the PBOC’s meeting with financial institutions on August 23rd revealed a desire to increase credit availability. Partly reflecting this development, new bank loans rose to RMB 1.22 trillion in August, up from RMB 1.08 trillion in the prior month. Chart 10EM Stocks Have Done Well When Global Industrial Stocks Have Outperformed
EM Stocks Have Done Well When Global Industrial Stocks Have Outperformed
EM Stocks Have Done Well When Global Industrial Stocks Have Outperformed
On the fiscal side, the Ministry of Finance stated on August 27th its intention to ramp up fiscal spending by increasing local government bond issuance. As of the end of August, local governments had used up only 50% of their annual debt issuance quota, compared to 77% at the same time last year and 93% in 2019. To reinforce the need for more stimulus, the authorities announced an additional RMB 300 billion in credit support for SMEs during the latest State Council meeting held on September 1st. Local Chinese government spending has typically flowed into infrastructure. Increased infrastructure spending should buttress metals prices while providing a tailwind for global industrial stocks. I agree with Arthur’s assessment that industrials will be a winning equity sector over the coming years. EM stocks have usually beaten the global benchmark during periods when global industrial stocks were outperforming (Chart 10). A Weaker US Dollar Will Benefit Emerging Markets EM stocks tend to perform best when the US dollar is on the back foot (Chart 11). We expect the greenback to weaken over the next 12 months. As a countercyclical currency, the dollar is likely to struggle in an environment of above-trend global growth (Chart 12). Chart 11EM Stocks Tend To Outperform The Global Benchmark When The Dollar Is Weakening
EM Stocks Tend To Outperform The Global Benchmark When The Dollar Is Weakening
EM Stocks Tend To Outperform The Global Benchmark When The Dollar Is Weakening
Chart 12The Dollar Is A Countercyclical Currency
The Dollar Is A Countercyclical Currency
The Dollar Is A Countercyclical Currency
Interest rate differentials have moved sharply against the dollar (Chart 13). The US trade deficit has surged over the past 16 months. The way the US has been financing its trade deficit – relying heavily on fickle equity inflows – also leaves the dollar in a vulnerable position (Chart 14). Chart 13Interest Rate Differentials Have Moved Against The Dollar
Interest Rate Differentials Have Moved Against The Dollar
Interest Rate Differentials Have Moved Against The Dollar
Chart 14Volatile Equity Inflows Have Been Financing The US Trade Deficit, Putting The Dollar In A Vulnerable Position
Volatile Equity Inflows Have Been Financing The US Trade Deficit, Putting The Dollar In A Vulnerable Position
Volatile Equity Inflows Have Been Financing The US Trade Deficit, Putting The Dollar In A Vulnerable Position
Go Long BRL And RUB Against a backdrop of broad-based dollar weakness, EM currencies will strengthen. Currently, the 12-month interest rate differential between Brazil and the US stands at 8.7%, up from a low of 2.1% last year. Russian rates have also risen rapidly relative to US rates (Chart 15). The Russian ruble will benefit from the cyclical recovery in oil prices. Bob Ryan and BCA’s commodity team project that the price of Brent will rise 5% to $80/bbl in 2023, whereas market expectations are for a 12% decline (Chart 16). Likewise, Brazil will gain from both higher oil prices and rising Chinese demand for metals. Chart 15Interest Rate Differentials Favor The RUB And BRL Versus The USD
Interest Rate Differentials Favor The RUB And BRL Versus The USD
Interest Rate Differentials Favor The RUB And BRL Versus The USD
Chart 16Oil Prices Have More Upside
Oil Prices Have More Upside
Oil Prices Have More Upside
Accordingly, we are initiating a new trade going long an equally-weighted basket consisting of BRL/USD and RUB/USD. Are EMs A Value Trap? Emerging market stocks currently trade at a Shiller PE ratio of 14.7, compared to 36.8 for the US, 22.2 for Europe, and 24.1 for Japan. The EM discount to the global index is as large now as it was during the late 1990s. Other valuation measures tell a similar story (Chart 17). Chart 17AEM Equities Are Trading At A Large Discount (I)
The Best Trade For The Rest Of 2021: Long EM Equities And Currencies
The Best Trade For The Rest Of 2021: Long EM Equities And Currencies
Chart 17BEM Equities Are Trading At A Large Discount (II)
The Best Trade For The Rest Of 2021: Long EM Equities And Currencies
The Best Trade For The Rest Of 2021: Long EM Equities And Currencies
A low PE ratio for EM stocks could be justified based on weak expected earnings growth. However, it is far from clear that such an expectation is warranted. While EM earnings growth has lagged the US since 2011, this follows a decade when EM earnings grew much faster than in the US (Chart 18). Chart 18AEM Earnings Have Moved Sideways Since 2011 After Blazing Higher Over The Preceding Decade (I)
EM Earnings Have Moved Sideways Since 2011 After Blazing Higher Over The Preceding Decade (I)
EM Earnings Have Moved Sideways Since 2011 After Blazing Higher Over The Preceding Decade (I)
Chart 18BEM Earnings Have Moved Sideways Since 2011 After Blazing Higher Over The Preceding Decade (II)
EM Earnings Have Moved Sideways Since 2011 After Blazing Higher Over The Preceding Decade (II)
EM Earnings Have Moved Sideways Since 2011 After Blazing Higher Over The Preceding Decade (II)
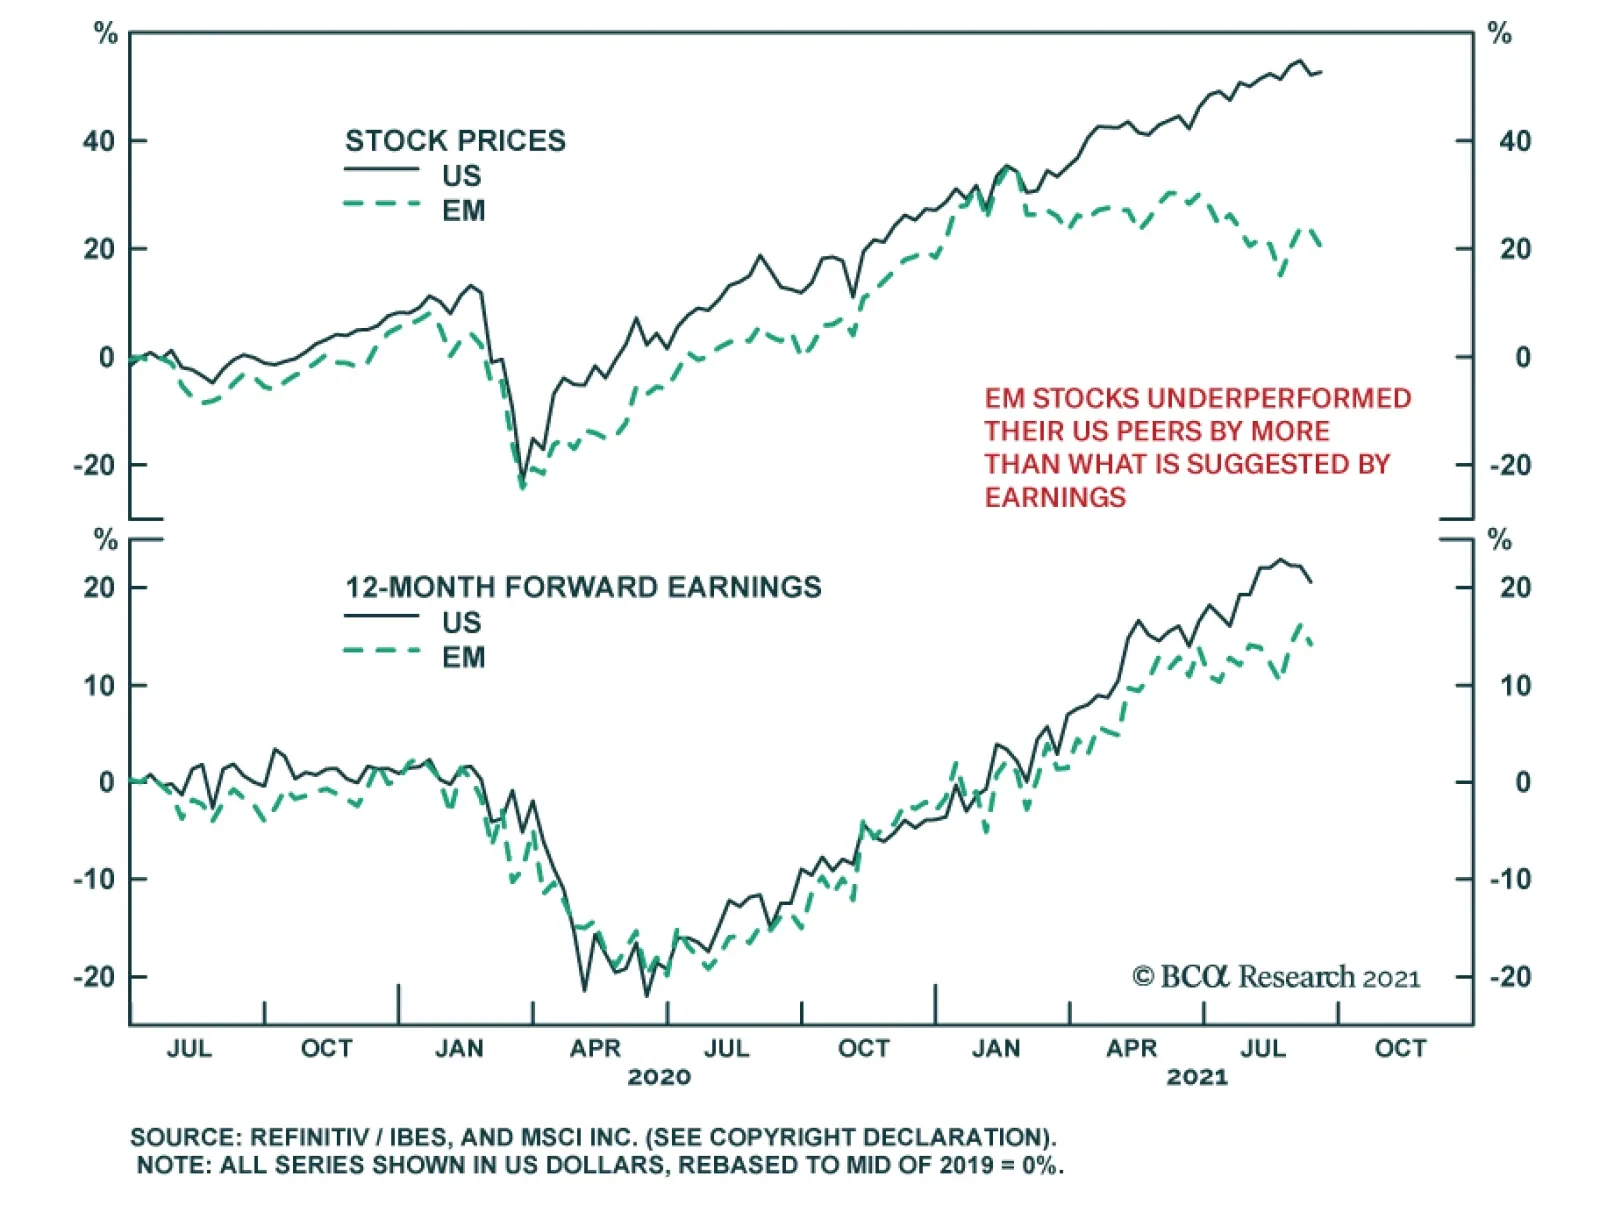
Chart 19EM Stocks Underperformed Their US Peers By More Than What Is Suggested By Earnings
EM Stocks Underperformed Their US Peers By More Than What Is Suggested By Earnings
EM Stocks Underperformed Their US Peers By More Than What Is Suggested By Earnings
On that note, it is worth mentioning that US earnings have risen by only 6 percentage points more than EM earnings since mid 2019 (20% versus 14%), even as EM stocks have underperformed their US peers by 29% over this period (52% versus 23%) (Chart 19). China’s Regulatory Crackdown The regulatory crackdown on Chinese tech companies has weighed on the sector. Chinese tech stocks have underperformed their global tech peers by 48% since February (Chart 20). Chart 20Chinese Tech Stocks Have Been Underperforming Their Global Tech Peers
Chinese Tech Stocks Have Been Underperforming Their Global Tech Peers
Chinese Tech Stocks Have Been Underperforming Their Global Tech Peers
Chinese tech is 44% of the China investable index and 15% of the MSCI EM index. Thus, the outlook for Chinese stocks is relevant not just for China-focused investors, but for EM investors more broadly (especially those who invest in index products). The current crackdown bears some resemblance to the one in 2018, which saw Tencent lose $20 billion in market capitalization in a single day. Like other Chinese tech names, Tencent shares quickly recovered from that incident. Contrary to popular perception, the Chinese government has not launched an indiscriminate attack on tech companies. If anything, heightened geopolitical tensions have made it more important than ever for China to buttress its tech sector. Rather, what the government has done is restrain companies that it either perceives as working against the national interest (i.e., addictive video game makers and expensive after-school tutoring companies) or that have too much sway over the public. Private tech companies in sectors such as semiconductors or clean energy continue to receive government support. A plausible outcome is that China’s leading consumer-oriented internet companies will go out of their way to pledge allegiance to the Communist Party just as US companies have pledged allegiance to woke ideology. If that were to happen, the Chinese government may allow them to operate normally, cognizant of the fact that it is easier to monitor a few large internet companies than many small ones. While such an outcome is far from assured, current valuations offer enough cushion to prospective investors. As we go to press, Alibaba is trading at 16.4-times earnings, Baidu is trading at 17.9-times earnings, and Tencent is trading at 26.7-times current year earnings. In comparison, the NASDAQ 100 trades at nearly 30-times earnings. Investment Conclusions Sentiment towards EM stocks is very bearish (Chart 21). Investor angst towards China is especially elevated, with the media replete with stories about the tech crackdown and problems at Evergrande, the country’s largest property developer. Chart 21Sentiment Towards EM Stocks Is Highly Bearish
Sentiment Towards EM Stocks Is Highly Bearish
Sentiment Towards EM Stocks Is Highly Bearish
All these downside risks to EM assets are well known. What are less well known are the upside risks stemming from higher vaccination rates, an easing of domestic inflationary pressures, Chinese stimulus, a weaker US dollar, and favorable valuations. With that in mind, we are upgrading our rating on EM equities and currencies to strong overweight in the view matrix at the back of this report. We are also reinstating a long EM/Global equity trade (ETF proxy: VWO versus VT). The risk-reward of buying Chinese internet stocks is reasonably appealing. Investors who want to mitigate risk should consider writing cash-covered puts. For example, a BABA put with a strike price of $130 expiring on December 16th 2022 trades for about $16. If the price of BABA does not fall below $130, you will pocket the premium, realizing an annualized yield of 9%. If the price does fall to $130, you get the stock at an attractive PE ratio of 12.5 based on current forward earnings estimates. Peter Berezin Chief Global Strategist pberezin@bcaresearch.com Global Investment Strategy View Matrix
The Best Trade For The Rest Of 2021: Long EM Equities And Currencies
The Best Trade For The Rest Of 2021: Long EM Equities And Currencies
Special Trade Recommendations
The Best Trade For The Rest Of 2021: Long EM Equities And Currencies
The Best Trade For The Rest Of 2021: Long EM Equities And Currencies
Current MacroQuant Model Scores
The Best Trade For The Rest Of 2021: Long EM Equities And Currencies
The Best Trade For The Rest Of 2021: Long EM Equities And Currencies
Highlights The odds of a stronger recovery in EM oil demand next year are rising, as vaccines using mRNA technology are manufactured locally and become widely available.1 This will reduce local lock-down risks in economies relying on less efficacious COVID-19 vaccines – or lacking them altogether – thereby increasing mobility, economic activity and oil demand. Our global crude oil balances estimates are little changed to the end of 2023, which leaves our price expectations mostly unchanged: 4Q21 Brent prices are expected to average $70.50/bbl, while 2022 and 2023 prices average $75 and $80/bbl, respectively (Chart of the Week). The balance of risks to the crude oil market remain to the upside in our estimation. In addition to a higher likelihood of better-than-expected EM demand growth, we expect OPEC 2.0 production discipline to hold, and for the price-taking cohort outside the coalition to continue prioritizing investors' interests. We remain long commodity index exposure – S&P GSCI and COMT – and, at tonight's close, will be getting long the DFA Dimensional Emerging Core Equity Market ETF (DFAE) on the back of increasing local mRNA vaccine production in EM economies. Feature As local production of COVID-19 vaccines employing mRNA technology spreads throughout EM economies, the odds of a stronger-than-expected recovery in oil demand next year will increase. The buildout of production and distribution facilities for this technology is progressing quickly in Asia – e.g., Chinese mRNA tech joint ventures are expected to be in production mode in 4Q21 – Latin America, Africa, and the Middle East.2 Accelerated availability of more efficacious vaccines globally will address the "fault lines" identified by the IMF in its July 2021 update. In that report, the Fund notes a major downside risk to its global GDP growth expectation of 6% this year remains slower-than-expected vaccine rollouts to emerging and developing economies.3 The other major risk identified by the Fund is too-rapid a winddown of policy support in DM economies, which would lead to tighter financial conditions globally. Our global demand expectation is driven by GDP estimates from the IMF and World Bank. The implication of that assumption is the powerful recovery in DM oil demand seen this year will slow while EM demand picks up next year (Chart 2). We proxy DM oil demand with OECD oil consumption and EM demand with non-OECD consumption. We continue to expect overall oil demand to recover by just over 5.0mm b/d this year and 4.4mm b/d next year (Table 1). Chart of the WeekOil Forecasts Hold Steady
Oil Forecasts Hold Steady
Oil Forecasts Hold Steady
Chart 2Higher EM Oil Demand Expected in 2022
Higher EM Oil Demand Expected in 2022
Higher EM Oil Demand Expected in 2022
Table 1BCA Global Oil Supply - Demand Balances (MMb/d, Base Case Balances) To Dec23
Upside Price Risk Rises For Crude
Upside Price Risk Rises For Crude
Global Oil Supply To Remain Steady Hurricane Ida will have removed ~ 30mm barrels of US offshore oil output by the time losses are fully tallied, based on IEA estimates. Even so, in line with the US EIA, we expect offshore US oil production will recover from the damage caused by the storm in 4Q21 and be back at ~ 1.7mm b/d on average over the quarter. This will allow oil prices to ease slightly from current elevated levels over the balance of the year. Inland, US shale-oil output remains on track to average ~ 9.06mm b/d this year, 9.55mmb/d in 2022 and 9.85mmb/d in 2023, in our modeling (Chart 3). We expect production in the Lower 48 states of the US to remain mostly steady going forward. Production from finishing drilled-but-uncompleted (DUCs) shale-oil wells is the lowest it's been since 2013. Output from these wells will remain relatively low for the rest of the year. This supply was developed during the COVID-19 pandemic, as it was cheaper to bring on than new drilling. For 2022 and 2023 overall, our model points to a slow build-up in US shale-oil output as drilling increases. Going into 2022, we expect continued production discipline from OPEC 2.0, and for the coalition to continue to manage output in line with actual demand it sees from its customers. The 400k b/d being returned monthly to the market over August 2021 to mid-2022 will accommodate demand increases. However, it will be monitored closely in the event demand fails to materialize, as has been OPEC 2.0's wont over the course of the pandemic. Chart 3US Shale-Oil Output Mostly Stable
US Shale-Oil Output Mostly Stable
US Shale-Oil Output Mostly Stable
Oil Markets To Remain Balanced We see markets remaining balanced to the end of 2023, with OPEC 2.0 maintaining its production-management strategy – keeping the level of supply just below the level of demand – and the price-taking cohort led by US shale-oil producers remaining focused on maintaining margins so as to provide competitive returns to investors. On the demand side, EM growth will pick up as DM growth slows. Given our fundamental view, global crude oil balances estimates are little changed to the end of 2023 (Chart 4). This allows inventories to continue to draw this year and next, then to slowly rebuild as production increases toward the end of 2023 (Chart 5). Falling inventories will keep the Brent forward curve backwardated – i.e., prompt-delivery oil will trade higher than deferred-delivery oil. Chart 4Markets Remain Balanced...
Markets Remain Balanced...
Markets Remain Balanced...
Chart 5...And Oil Inventory Continues To Draw
...And Oil Inventory Continues To Draw
...And Oil Inventory Continues To Draw
The backwardated forward curve means OPEC 2.0 producers will continue to realize higher delivered prices on their crude oil than the marginal shale-oil producer, which hedges its production 1-2 years forward to stabilize revenue. This is the primary benefit to the member states in the producer coalition: a backwardated curve pricing closer to marginal cost limits the amount of revenue available to shale-oil producers, and thus restrains output to that which is profitable at the margin. Investment Implications Our supply-demand outlook keeps our price expectations mostly unchanged from last month's forecast. We expect 4Q21 Brent prices to average $70.50/bbl, while 2022 and 2023 prices average $75 and $80/bbl, respectively, as can be seen in the Chart of the Week. WTI prices will continue to trade $2-$4/bbl below Brent over this interval. With fundamentals continuing to support a backwardated forward curve in Brent and WTI, we continue to favor long commodity-index exposure, which benefits from this structure.4 Therefore, we remain long the S&P GSCI and the COMT ETF, which is an optimized version of the GSCI that concentrates on positioning in backwardated futures contracts. The upside risk to oil prices resulting from increasing local production of mRNA vaccines in EM economies that had relied on less efficacious vaccines undoubtedly will increase mobility and raise oil demand, if, as appears likely, the impact of this localization is realized in the near term. This also could boost commodity demand generally, if it allows trade and GDP growth to accelerate in EM economies, which supports our long commodity-index view. The rollout of mRNA technology into EM economies also suggests EM GDP growth could increase at the margin with locally produced mRNA vaccines becoming more available. This would redound to the benefit of trade and economic activity generally.5 It also could help unsnarl the movement of goods globally. The wider implications of a successful expansion of locally produced mRNA vaccines leads us to recommend EM equity exposure on a tactical basis. At tonight's close, we will be getting long the DFA Dimensional Emerging Core Equity Market ETF (DFAE). As this is tactical, we will use a tight stop (10%) for this recommendation. Robert P. Ryan Chief Commodity & Energy Strategist rryan@bcaresearch.com Ashwin Shyam Research Associate Commodity & Energy Strategy ashwin.shyam@bcaresearch.com Commodities Round-Up Energy: Bullish Natural gas demand is surging globally. Record-breaking heat waves in the US are driving demand for gas-fired generation required to meet space-cooling demand. In addition, in the June-August period, the US saw record LNG exports. Europe and Asia are competing for the fuel as both prepare for winter. Brazil also has been a strong bid for LNG, as drought there has reduced hydropower supplies. In Europe, natural gas inventories were drawn hard this past winter as LNG supplies were bid away to Asia to meet space-heating demand. This is keeping Europe well bid now as winter approaches (Chart 6). The US Climate Prediction Center last week gave 70-80% odds of a second La Niña for the Northern Hemisphere winter. Should it materialize, it could again drive cold artic air into their markets, as it did last winter, and push natgas demand higher. Our recommendation to get long 1Q22 $5.00/MMBtu calls vs short 1Q22 $5.50/MMBtu calls last week was up 17% as of Tuesday's close. We remain long. Base Metals: Bullish The slide in iron ore prices from its ~ $230/MT peak earlier this year can be attributed to weak Chinese demand, and the possibility of its persistence through the winter and into next year (Chart 7). The world’s largest steel-producing nation is aiming to limit steel output to no higher than 2020 levels, in a bid to reduce industrial pollution. According to mining.com, provincial governments have directly asked local steel mills to curb output. Regulation in this sector in China will continue to reduce prices of iron ore, a key raw material in steel production. Precious Metals: Bullish The lower-than-expected reading on the US core CPI earlier this week weighed on the USD, and propelled gold prices above the $1,800/oz mark. While markets expected lower consumer prices for August to diminish the Fed’s resolve to taper asset purchases by year-end, we do not think the lower month-on-month CPI number will delay tapering. The timing of the Fed's initial rate hike – expected by markets to occur after the tapering of the central bank's asset-purchase program – will depend on the US labor force reaching "maximum employment." According to BCA Research's US Bond Strategy, this criterion will be met in late-2022 or early-2023. Low-interest rates, coupled with persistent inflation until then, will be bullish for gold prices. Chart 6
Upside Price Risk Rises For Crude
Upside Price Risk Rises For Crude
Chart 7
CHINA IMPORTED IRON ORE GOING DOWN
CHINA IMPORTED IRON ORE GOING DOWN
Footnotes 1 Please see Everest to bring Canadian biotech's potential Covid shots to China, other markets published on September 13, 2021 by indiatimes.com. 2 Examples of this include Brazil's Eurofarma to make Pfizer COVID-19 shots for Latin America, published by reuters.com; Biovac Institute to be first African company to produce mRNA vaccines, published be devex.com; and mRNA Vaccines Mark a New Era in Medicine, posted by supertrends.com. The latter report also discusses the application of mRNA technology to other diseases like malaria. 3 Please see Fault Lines Widen in the Global Recovery published 27 July 2021 by the Fund. 4 Backwardation is the source of roll yield for long-index exposure. This is due to the design of these index products, which buy forward then – in backwardated markets – roll out of futures contract as they approach physical delivery at a higher level and re-establish their exposure in a deferred contract. 5 The lower realized efficacy of Sinopharm and Sinovac COVID-19 vaccines and high reinfection rates in economies using these vaccines are one of the key risks to our overall bullish commodity view. Please see Assessing Risks To Our Commodity Views, which we published on July 8, 2021. It is available at ces.bcaresearch.com. Investment Views and Themes Recommendations Strategic Recommendations Tactical Trades Commodity Prices and Plays Reference Table Trades Closed in 2021 Summary of Closed Trades
Highlights Germany’s election on September 26 is more of an opportunity than a risk for global investors. Coalition formation will prolong uncertainty but the key takeaway is that early or aggressive fiscal tightening is off the table for Germany … and hence the EU. Germany’s left wing is surprising to the upside as predicted, but it is the Social Democrats rather than the Greens who have momentum in the polls. This is a market-positive development. A coalition of only left-wing parties is entirely possible, but there is a 65% chance that the Christian Democrats (or Free Democrats) will take part in the next coalition to get a majority government. This would constrain business unfriendly outcomes. The German economy is likely to slow for the remainder of 2021, but the outlook for 2022 remains bright as the current headwinds facing the country will dissipate, especially if the risk of an aggressive fiscal drag is low. The underperformance of German equities relative to their Eurozone counterparts is long in the tooth. A combination of valuation, earnings momentum and technical factors suggests that German stocks will beat their peers next year. German equities will also outperform Bunds, which offer particularly unattractive prospective returns. Feature Germany’s federal election will be held on September 26. Our forecast that the left wing will surprise to the upside remains on track, albeit with the Social Democrats rather than the Greens surging to the forefront of opinion polls (Chart 1). However, the precise composition of the next government is very much in the air. Chart 1German Election: Social Democrats Take The Lead
German Election: Social Democrats Take The Lead
German Election: Social Democrats Take The Lead
Our quantitative German election model – which we introduce in this special report – predicts that the ruling Christian Democratic Union will outperform their current 21% standing in opinion polls, winning as much as 33% of the popular vote. Subjectively, this seems like an overestimation, but it goes to show that outgoing Chancellor Angela Merkel’s popularity, a historically strong voting base, and the economic recovery will help the party pare its losses this year. This finding, combined with the strong momentum for the Social Democrats, suggests that the election outcome will not be decisive. Germany will end up with either a grand coalition that includes Merkel’s Christian Democrats or a left-wing coalition that lacks a majority in parliament.1 Investors should note that none of the election outcomes are hugely disruptive to domestic or foreign policy. The status quo is unexciting but not market-negative, while a surprise left-wing victory would mean more reflation in the short run but a roll back of some pro-business policies in the long run. More broadly Germany has established a national consensus that rests on European integration, looser fiscal policy, renewable energy, and qualified engagement with autocratic powers like Russia and China. The chief takeaway is that fiscal policy will not be tightened too soon – and could be loosened substantially. Germany’s Fiscal Question Outgoing Chancellor Angela Merkel is stepping down after ruling Germany since 2005. The Christian Democratic Union, and its Bavarian sister party the Christian Social Union, together form the “Union” that is hard to beat in German elections, having occupied the chancellor’s office for 57 out of 72 years. However, both the Christian Democrats and the Social Democrats, their main rivals, have been shedding popular vote share since 1990, as other parties like the Greens, Free Democrats, the Left, and Alternative for Germany have gained traction (Table 1). Table 1Germany: Traditional Parties Lose Vote Share Over Time
German Election: Winds Of Change
German Election: Winds Of Change
The Great Recession and European sovereign debt crisis ushered in a new geopolitical and macroeconomic context that Merkel reluctantly helped Germany and the EU navigate. Germany’s clashes with the European periphery ultimately resulted in deeper EU integration, in accordance with Germany’s grand strategy and Merkel’s own strategy. But just as the euro crisis receded, a series of shocks elsewhere threatened to upend Germany’s position as one of the biggest economic winners of the post-Cold War world. The sluggish aftermath of the financial crisis, the Russian invasion of Crimea, the Syrian refugee crisis, the Brexit referendum, and President Trump’s election in the US sparked a retreat from globalization, a direct threat to an export-oriented manufacturing economy like Germany. In the 2017 election the Union lost 13.4 percentage points compared to the 2013 election. Minor parties have gradually gained ground since then. However, through a coalition with the Social Democrats, Merkel and her party managed to retain control of the government. This grand coalition eased the country’s fiscal belt in response to the trade war and global slowdown in 2019, signaling Germany’s own shift away from fiscal austerity. Then COVID-19 struck, prompting a much larger fiscal expansion to tide over the economy amid social lockdowns. Germany was not the largest EU member in terms of fiscal stimulus but nor was it the smallest (Chart 2). It joined with France to negotiate a mutual debt plan to rescue the broader EU economy and deepen integration. Chart 2Germany’s Fiscal Stimulus Ranks In The Middle Of Major Countries
German Election: Winds Of Change
German Election: Winds Of Change
Germany’s pro-EU perspective has been reinforced by Brexit and is not on the ballot in 2021. Immigration and terrorism have temporarily subsided as voter concerns. The focus of the 2021 election is how to get through the pandemic and rebuild the German economy for the future. For investors the chief question is whether conservatives will have enough sway in the next government to try to semi-normalize policy and consolidate budgets in the coming years, or whether a left-wing coalition will take charge, expanding on Germany’s proactive fiscal turn. The latter has consequences for broader EU fiscal normalization as well since Germany is traditionally the prime enforcer of deficit limits. The latest opinion polls point to more proactive fiscal policy. The country’s left-leaning ideological bloc has taken the lead (Chart 3A) and the Social Democratic leader Olaf Scholz has sprung into first place among the chancellor candidates (Chart 3B). Chart 3AGermany: Voting Intentions Favor Left-Leaning Parties
Germany: Voting Intentions Favor Left-Leaning Parties
Germany: Voting Intentions Favor Left-Leaning Parties
Chart 3BSocial Democrats Likely To Take Chancellery
German Election: Winds Of Change
German Election: Winds Of Change
Scholz has served as finance minister and is the face of the country’s recent fiscal stimulus efforts. Public opinion is clearly rewarding him for this stance as well as his party, which was previously in the doldrums.2 The Social Democrats and Greens are calling for more fiscal expansion as well as wage hikes and tax hikes (wealth redistribution) in pursuit of social equality and a greener economy (Table 2). If the Christian Democrats retain a significant role in the future coalition, these initiatives will be blunted – not to say halted entirely. But if the left parties put together a ruling coalition without the Christian Democrats, then they will be able to launch more ambitious tax-and-spend policies. Opinion polls show that voters still slightly favor coalitions that include the Christian Democrats, although momentum has shifted sharply in favor of a left-wing coalition (Chart 4). Table 2German Party Platforms
German Election: Winds Of Change
German Election: Winds Of Change
Chart 4Voters Evenly Split On Whether Next Coalition Should Include CDU
German Election: Winds Of Change
German Election: Winds Of Change
This shift is what we forecast in previous reports but now the question is whether the left-wing parties can actually win enough seats to put together a majority coalition. That is a tall order. Our quantitative election model suggests that the Christian Democrats, having suffered a long overdue downgrade in expectations, will not utterly collapse when the final vote is tallied. While we do not expect them to retain the chancellorship, momentum will have to shift even further in the opposition’s favor over the next two weeks to produce a majority coalition that excludes the Union. Our Quantitative German Election Model Our model is based off the work of Norpoth and Geschwend, who created a simple linear model to predict the vote share that incumbent governing parties or coalitions will obtain in impending elections.3 Their model utilizes three explanatory variables and has a sample size of 18 previous elections, covering elections from 1953 to 2017. Our model updates their original work to make estimates for the 2021 election. Unlike our US Political Strategy Presidential Model, which makes use of both political and economic explanatory variables in real time, our German election model makes predictions based solely on historical political variables, all of which display a high degree of correlation with popular vote share. We will look at economic factors that may affect the election later in this report. The Three Explanatory Variables 1. Chancellor Approval Rating: This variable captures the short-term support rate of the incumbent chancellor. A positive relationship exists between chancellor approval and vote share: higher approval equates to higher vote share for the incumbent party. Merkel’s approval stands at 64% today which is a boon for the otherwise beleaguered Christian Democrats (Chart 5). Chart 5Merkel's Coattails A Boon But Not Enough To Save Her Party
Merkel's Coattails A Boon But Not Enough To Save Her Party
Merkel's Coattails A Boon But Not Enough To Save Her Party
2. Long-term partisanship: This variable shows the long-term support rate of voters for specific parties or coalitions in past elections. It is measured as the average vote share of the incumbent party over the past three elections. A positive relationship with vote share exists here too: higher historical partisanship equates to a higher share of votes in forthcoming elections, and vice versa. This variable clearly gives a boost to the Christian Democrats – although it could overrate them based on past performance, as occurred in 2017 when they underperformed the model’s prediction.4 3. “Time For Change”: This is a categorical variable measured by how many terms the parties or coalition have held office leading into an election. This variable has a negative relationship with vote share outcomes. The longer an incumbent party or coalition holds office, the less vote share they will receive. Effectively, our model punishes parties that hold office for long periods of time. In this case that would be the long-ruling Christian Democrats. Model Estimation And Results Our model is estimated by the following simple equation: Popular Vote Share = constant + ßChancellor Approval Rating + ßLong-Term Partisanship + ßTime For Change Estimating the above model for the 2021 election predicts that the Union will win 32.7% of the vote share (Table 3). If this prediction came true, it would suggest that the ruling party performed almost exactly the same as in 2017. In other words, the party’s strong voter base combined with Merkel’s long coattails are expected to shore up the party. This flies in opinion polling, however, so we think the model is overestimating the Christian Democrats. Table 3Our German Election Quant Model Says CDU Will Not Collapse
German Election: Winds Of Change
German Election: Winds Of Change
Note that even if the Union performs this well, it still will not win enough seats to govern on its own. Potential Union-led coalitions are shown in Table 3, excluding the Social Democrats (see below). For a majority government, a coalition with the Free Democrats and the Greens would need to be formed. This coalition would equate to 53% of the vote share. Otherwise, to obtain a majority, the Union would have to team up with the Social Democrats, which is today’s status quo. We can use the same methodology to predict the vote share for the Social Democrats. We use the support rate of Social Democratic chancellor-candidate Olaf Scholz and calculate the long-term partisanship variable using past Social Democratic vote shares. In this case our model predicts that the Social Democrats will win 22.1% of the vote. If this result were to come true, it would not be enough for the party to govern own its own. Potential Social Democratic-led coalitions are shown in Table 4. The best coalition would be with the Greens and either the Left or the Free Democrats. But in this case the Social Democrats cannot form a government with a vote share above 50%, unless it pairs up with the Christian Democrats. Table 4Our German Election Quant Model Says SPD Has Not Yet Won It All
German Election: Winds Of Change
German Election: Winds Of Change
In other words, either the left-wing parties must build on their current momentum and outperform their historical record in the final election tally, or they will need to form a coalition with the Christian Democrats. This kind of left-wing surge is precisely what we have predicted. But the model helps put into perspective how difficult it will be for the left-leaning parties to get a majority. Scholz is single-handedly trying to overcome the long downtrend of the Social Democrats. His party is rising at the expense of the Greens, and the Left, which puts a lid on the total left-wing coalition size. If these three parties all beat the model and slightly surpass their top vote share in recent memory (SPD at 26%, Greens at 11%, and the Left at 12%), they still only have 49% of the vote. While our model is reliant on historical political data, it is a robust predictor for past election results (Chart 6). The average vote share error between the predicted and realized outcomes over from 1953 to 2013 is 1.7 percentage points. The problem with relying on the model is that the Christian Democrats have broken down from their long-term trend in opinion polls. And while Merkel’s approval is strong, she is no longer on the ballot and her hand-picked successor, Armin Laschet, is floundering in the polls (see Chart 3B above). Chart 6Our German Election Quant Model Has Solid Track Record, But Merkel’s High Approval Rating Caused Overestimate In 2017 And May Do So In 2021
German Election: Winds Of Change
German Election: Winds Of Change
In short, the model is probably overrating the Union but it is also calling attention to the extreme difficulty of the left-wing parties forming a majority coalition. Scholz may have to form a coalition with the Free Democrats or pursue another grand coalition. And if the Social Democrats fail to get the largest vote share, German President Frank-Walter Steinmeier may ask Armin Laschet to try to form a government first. Still, Scholz is the most likely chancellor when all is said and done. Election Model Takeaway Our German election model predicts that the Union will receive 32.9% of the popular vote, while the Social Democrats will receive 22.1%. At the same time, the left-leaning parties, specifically the Social Democrats, clearly have the momentum. Therefore the model may be overrating the incumbent party. But it still calls attention to a high level of uncertainty, the likelihood of a messy election outcome, and a tricky period of coalition formation. The Social Democrats will have to pull off a major surprise, outperforming both history and our model, to lead a majority government without the Christian Democrats.5 We still think this is possible. But we will stick with our earlier subjective probabilities: 65% odds that the Christian Democrats take part in the next coalition, 35% odds that they do not. Bottom Line: The chancellorship will go to the Social Democrats but the coalition will constrain the business unfriendly aspects of their agenda. This is positive for Germany’s corporate earnings outlook. Macro Outlook: A Temporary Economic Dip Our election model does not account for the economic backdrop and hence ignores the “pocketbook voter.” Germany is recovering from the pandemic, which is marginally supportive for an otherwise faltering ruling party. However, the economic data is only good enough to suggest that the Union will not utterly collapse. A rise in unemployment, inflation, and the combination of the two (the “Misery Index”) is a tell-tale sign that the incumbent party will suffer a substantial defeat (Chart 7). However the German economy’s loss of momentum is temporary. Growth will re-accelerate in early 2022. The timing is politically inconvenient for the ruling party but positive news for investors. German economic confidence is deteriorating. The Ifo Business Climate survey has rolled over, lowered by a meaningful decline in the Expectations Survey. Additionally, consumer confidence is turning south, despite already being low (Chart 8). Chart 7Spike In German Misery Index A Tell-Tale Sign Of Poor Election For Incumbent Party
Spike In German Misery Index A Tell-Tale Sign Of Poor Election For Incumbent Party
Spike In German Misery Index A Tell-Tale Sign Of Poor Election For Incumbent Party
Chart 8Deteriorating German Confidence
Deteriorating German Confidence
Deteriorating German Confidence
A combination of factors weighs on German confidence: First, global supply chain bottlenecks are hurting growth. The automotive industry, which is paralyzed by a global chip shortage, accounts for about 20% of industrial production, and its output is once again declining after a sharp but short-lived rebound last year (Chart 9). Similarly, inventories of finished goods are collapsing, which is hurting growth today (Chart 9, second panel). Second, the Delta variant of COVID-19 is causing a spike in infections. The rise in cases prevents containment measures from easing as much as expected, while it also hurts the willingness of households to go out and spend their funds (Chart 9, third panel). Third, German real wages are weak. Negotiated wages are only growing at a 1.7% annual rate, and wages and salaries are expanding at 2.1% annually. Meanwhile, German headline CPI runs at 3.9%. The declining purchasing power of German households accentuates their current malaise. Three crucial forces counterbalance these negatives: First, German house prices are growing at a 9.4% annual rate, which is creating a potent, positive wealth effect (Chart 10). Chart 9Germany's Headwinds
Germany's Headwinds
Germany's Headwinds
Chart 10A Strong Wealth Effect
A Strong Wealth Effect
A Strong Wealth Effect
Second, German household credit remains robust. According to the Bundesbank, the strength in household credit mostly reflects the strong demand for mortgages. Historically, a healthy housing sector is an excellent leading indicator of economic vigor. Third, the Chinese credit impulse is too depressed for Beijing’s political security. The recent decline in the credit impulse to -2.4% of GDP reflects a policy decision in the fall of 2020 to trim down the credit expansion. As a result, Chinese economic growth is slowing. For example, both the Caixin Manufacturing and Services PMIs stand below 50, at post-pandemic lows of 49.2 and 46.7, respectively. In July authorities became uncomfortable and cut the Reserve Requirement Ratio as well as interbank rates to free liquidity and stabilize the economy. A boom is not forthcoming, but the drag on global activity will ebb by next year. Including the headwinds and tailwinds to the economy, German activity will slow down for the remainder of the year before improving anew in 2022. Our election case outlined above – that the conservatives will lose the chancellorship and either be excluded from power or greatly diminished in the Bundestag – means that fiscal policy will not be tightened abruptly and will not create a material risk to this outlook. Chart 11Vaccines Work
Vaccines Work
Vaccines Work
Many of the headwinds will dissipate. The Delta-wave of COVID-19 will diminish. Already, Germany’s R0 is tentatively peaking, which normally precedes a drop in daily new cases. Moreover, Germany’s vaccination campaign is progressing, which limits the impact of the current wave on hospitalization and intensive care-unit usage (Chart 11). Inflation will peak in Germany, which will salvage real wages. As European Investment Strategy wrote last Monday,6 European inflation remains concentrated in sectors linked to commodity prices or directly affected by bottlenecks. Instead, trimmed-mean CPI is muted (Chart 12), which implies that underlying inflationary pressures are small, especially as wage gains are still well contained. Moreover, the one-off impact of the end of the German VAT rebate will also pass. Finally, a stabilization and eventual revival of the Chinese credit impulse will put a floor under German exports, industrial production, and capex (Chart 13). For now, the previous decline in the Chinese credit impulse is consistent with slower German output growth for the remainder of 2021. However, next year, the German industrial sector will start to feel the effect of the current efforts to improve Chinese liquidity conditions. Chart 12Narrow European Inflation
Narrow European Inflation
Narrow European Inflation
Bottom Line: The German economy is set to deteriorate for the remainder of 2021. However, as the current wave of COVID-19 infections ebbs, real wages recover, and China’s credit impulse stabilizes, Germany’s economic activity will re-accelerate in 2022, especially if the upcoming election does not generate a meaningful fiscal shock. We do not think it will. Chart 13China: From Headwinds To Tailwind?
China: From Headwinds To Tailwind?
China: From Headwinds To Tailwind?
Market Implications: German Stocks To Shine German equities are set to outperform their European counterparts and will significantly beat Bunds over the coming 18 months. During the past 5 months, the German MSCI index has underperformed the rest of the Eurozone by 6.2%. The poor performance of German equities is worse than meets the eye. If we adjust for sectoral differences by building equal sector-weight indexes, Germany has underperformed the Euro Area by 22% since early 2017 (Chart 14). Chart 14Not Delivering The Goods
Not Delivering The Goods
Not Delivering The Goods
This underperformance is long in the tooth and should reverse because of four important dynamics. First, German equities are cheap relative to the European benchmark. As Chart 15 highlights, the relative performance of German stock prices has lagged that of profits. This underperformance is also true once we account for the different sectoral composition of the German market. As a result, Germany is cheap on a forward price-to-earnings, price-to-sales, and price-to-book basis versus the Euro Area. Additionally, analysts embed significantly lower long-term and one-year expected growth rates of earnings in Germany than in the rest of the Eurozone, which depresses the German PEG ratios. Second, German operating metrics do not justify the valuation discount of German equities. The return on equity of German stocks stands at 11.39%, which is similar to that of the Euro Area. Profit margins are also comparable, at 5.91% and 5.74%, respectively. However, German firms utilize their capital more efficiently, and their asset turnover stands at 0.3 times compared to 0.2 times for the Eurozone average. Meanwhile, German non-financial firms are less indebted than their Eurozone competitors, which implies that Germany’s return on assets is greater than that of Europe at large (Chart 16). Chart 15Lagging Prices, Not Earnings
Lagging Prices, Not Earnings
Lagging Prices, Not Earnings
Chart 16Why The Discount?
Why The Discount?
Why The Discount?
Third, the drivers of earnings support a German outperformance. Over the past thirty years, commodity prices led the performance of German stocks relative to that of the rest of the Eurozone (Chart 17). While the near-term outlook for natural resource prices is muddy, BCA’s commodity strategists expect Brent prices to average more than $80/bbl in 2023 and industrial metals to outperform energy over the coming years.7 Additionally, German Services PMI are bottoming compared to that of the Eurozone. Over the past decade, this process preceded periods of outperformance by German stocks (Chart 18). Similarly, the collapse in the Chinese credit impulse relative to the robust domestic economic activity in Europe is well reflected in the underperformance of German shares. The Eurozone’s Service PMI is near all-time highs and unlikely to improve further; however, the Chinese credit impulse should recover in the coming quarters. This phenomenon will help German stocks (Chart 19). Chart 17Commodity Bulls Pull Germany
Commodity Bulls Pull Germany
Commodity Bulls Pull Germany
Chart 18German Vs European Activity Matters
German Vs European Activity Matters
German Vs European Activity Matters
Chart 19German Vs Chinese Activity Matters
German Vs Chinese Activity Matters
German Vs Chinese Activity Matters
The German MSCI index is also oversold. The 52-week rate of change of its performance compared to the rest of the Eurozone plunged to its lowest reading since the introduction of the euro in 1999 (Chart 20). Meanwhile, the 13-week rate of change remains low but has begun to improve (not shown). This combination usually heralds a forthcoming rebound in German relative performance. In relation to equities, German Bunds remain an unappealing investment. Based on historical experience, the current yield of -0.36% offered by German 10-year bonds condemns investors to negative returns over the next five years (Chart 21). Chart 20Oversold!
Oversold!
Oversold!
Chart 21Bounded Bunds' Returns
Bounded Bunds' Returns
Bounded Bunds' Returns
Even if realized inflation ebbs in Germany and Europe, inflation expectations remain low and an eventual return to full employment will force CPI swaps higher, especially if the ECB maintains easy monetary conditions and invites further risk-taking in the Eurozone. The global economic cycle will also move from a friend to a foe for Bunds. As Chart 22 illustrates, the recent deceleration in global export growth was consistent with the fresh uptick in the returns of German paper. However, if Chinese credit flows stabilize by year-end and reaccelerate in 2022 while supply-chain bottlenecks dissipate, global export growth will improve. This should hurt Bund prices, especially as the long-term terminal rate proxy embedded in the German curve remains too low. As a result, not only should Bunds underperform German equities, but the German yield curve will also steepen further relative to that of the US, where the Fed will lift the short-end of the curve faster than the ECB. Chart 22Economic Momentum And Bunds Prices
Economic Momentum And Bunds Prices
Economic Momentum And Bunds Prices
Bottom Line: The underperformance of German equities relative to those of the rest of the Eurozone is well advanced, which makes German stocks a bargain. The current deceleration in global and German growth will not extend beyond 2021, which suggests that German stocks prices should converge toward their earnings outperformance next year. Our political forecast suggests that the odds of an early or aggressive fiscal retrenchment are very low. Additionally, German equities will outperform Bunds, which offer particularly poor prospective returns. Matt Gertken Vice President Geopolitical Strategy mattg@bcaresearch.com Mathieu Savary Senior Vice President Mathieu@bcaresearch.com Guy Russell Research Analyst GuyR@bcaresearch.com Jingnan Liu Research Associate JingnanL@bcaresearch.com Footnotes 1 Note that minority governments are rare and have a bad reputation in Germany, partly as a result of the series of weak governments leading up to the 1932 election and Nazi rule. 2 In addition, while the center-left parties can work with the far-left in the Bundestag, the center-right parties cannot work with the far-right Alternative for Germany. Indeed the slightest imputation of a willingness to work with Alternative for Germany cost Merkel’s first pick for successor, Annegret Kramp-Karrenbauer, her job. 3 See: Norpoth, Helmut & Gschwend, Thomas (2010) The chancellor model: Forecasting German elections, International Journal of Forecasting. 26. 42-53. 4 Our model performs well in back-testing but 2017 was an outlier. It correctly predicted the Union to win the highest share of the popular vote but overestimated that vote by seven percentage points. Our only short-term variable, the chancellor’s approval rate, caused a deviation from long-term voting trends. Our other two variables capture medium and long-term effects, which clearly favored the Union. The implication is that Merkel’s high approval rating today could give a misleading impression about the Christian Democrats’ prospects. 5 If they are forced to rely on the Free Democrats instead, that will also constrain the most anti-business elements of their agenda. 6 Please see BCA Research European Investment Strategy Weekly Report, "The ECB Taper Dilemma", dated September 6, 2021, available at eis.bcareseach.com. 7 Please see BCA Research Commodity & Energy Strategy Weekly Report, "Permian Output Approaches Pre-Covid Peak", dated August 19, 2021, available at ces.bcareseach.com.
Feature Chart 1Chinese Offshore Stocks Tumbled Amid Regulatory Crackdowns
Chinese Offshore Stocks Tumbled Amid Regulatory Crackdowns
Chinese Offshore Stocks Tumbled Amid Regulatory Crackdowns
Relative to the global equity index, onshore and offshore Chinese stocks have fallen by 18% and 32%, respectively, since their peaks in mid-February (Chart 1). The panic sell-off in the offshore market, which saw greater losses due to its high concentration in internet stocks, appears to be overdone and may technically rebound in the near term. However, any short-term bounce in Chinese stocks from oversold levels will likely be short-lived (Chart 2). The crackdown on new economy companies reflects socio-political and economic shifts in China, which raises the odds that the restrictions will continue with further actions focused on social welfare and healthcare. August’s official PMIs and economic data indicate a broad-based softening in China’s domestic demand and production. However, compared with 2018/19 when the US-China trade war exacerbated the deterioration in an already slowing economy, the economy now remains well supported by strong exports. Moreover, the magnitude of the slowdown has not exceeded policymakers’ pain thresholds (Chart 3). Chart 2Tactical Bounce Was Short-Lived In Previous Downturns
Tactical Bounce Was Short-Lived In Previous Downturns
Tactical Bounce Was Short-Lived In Previous Downturns
Chart 3China's Economic Recovery Losing Steam, But From An Elevated Level
China's Economic Recovery Losing Steam, But From An Elevated Level
China's Economic Recovery Losing Steam, But From An Elevated Level
In 2018/19, stimulus was measured and the authorities did not meaningfully relax limits on bank lending standards and shadow banking. Furthermore, China recently reiterated its cross-cycle macro policy setting, which means that policymakers will not use significant stimulus to achieve high and short-term economic growth. Given financial stability measures that aim to contain risks associated with the housing market and hidden local government debt, any monetary and fiscal easing will likely help to stabilize credit growth instead of substantially boosting it this year. For the time being, China’s financial assets continue to face downside risks stemming from a confluence of a weakening business cycle and ongoing regulatory tightening. Thus, we recommend investors maintain an underweight allocation to Chinese equities within a global equity portfolio. Qingyun Xu, CFA Associate Editor qingyunx@bcaresearch.com A Shining Moment For Chinese Small And Medium Caps Small and medium-cap (SMID-cap) stocks have outperformed large-caps since February and the recent regulatory restrictions have intensified the situation. The CSI500 index, which comprises 500 SMID-cap companies, has outperformed the large-cap CSI300 by 34% since mid-February (Chart 4, top panel). Uncertainties surrounding the pandemic and corporate earnings growth have fueled extreme dislocations between large-cap and SMID-cap stocks last year. Large-cap stocks were the main contributors to China’s stock rallies in the second half of last year, while the valuation premia in small cap stocks was compressed to near decade lows (Chart 4, bottom panel). Chart 4A Low Valuation Premia And More Policy Support May Further Lift Prices Of SMID-Caps
A Low Valuation Premia And More Policy Support May Further Lift Prices Of SMID-Caps
A Low Valuation Premia And More Policy Support May Further Lift Prices Of SMID-Caps
Chart 5SMID-Caps Tend To Outperform Large-Caps In Late Business Cycle
SMID-Caps Tend To Outperform Large-Caps In Late Business Cycle
SMID-Caps Tend To Outperform Large-Caps In Late Business Cycle
Historically, SMID-caps tend to outperform large-caps in the late cycle of an economic recovery (Chart 5). The spate of regulatory changes aimed at monopolistic behaviors in various sectors has curbed investors’ appetite for the industry leaders. In addition, the government’s increasing efforts to support small and medium corporates (SMEs) will help to shore up confidence in those companies. Therefore, small and medium caps will likely continue to outperform large-cap stocks this year. Fiscal Support: How Much Room In 2H? The July Politburo meeting pledged more fiscal support for the economy later in 2021 and into 2022. We expect local government bond (LGB) issuance to accelerate: a 4.47 trillion RMB new local government bond issuance quota was approved for 2021, including 820 billion in general bonds and 3.65 trillion in special purpose bonds (SPBs). By end-August, 2.37 trillion new local government bonds had been issued, which was only 53% of the entire year’s goal. However, there are some constraints that will likely reduce the reflationary effects on the economy. First, the quota for LGB issuance approved by the National People’s Congress is 16% lower than last year, but the amount of LGBs maturing this year is 30% higher. Therefore, even though this year’s gross LGB issuance has kept pace with that of last year, more than half of the LGBs issued from January to August was used for debt repayment (Chart 6). The move by local governments to use a large portion of their bond issuance quota to pay off existing debt resembles the situation in 2018 when a financial de-risking campaign encouraged local governments to reduce the stockpile of their leverage. As noted in last week’s report, infrastructure investment and the economy did not rebound in 2H2018, even though LGB issuance picked up (Chart 7). Chart 6More Than Half Of LGBs Issued This Year Has Been Used For Debt Repayment
Chinese Small And Medium Caps Are Finding Their Shining Moment
Chinese Small And Medium Caps Are Finding Their Shining Moment
Chart 7Improvement In Infrastructure Investment Was Short-Lived In 2019
Improvement In Infrastructure Investment Was Short-Lived In 2019
Improvement In Infrastructure Investment Was Short-Lived In 2019
Even if we assume that local governments will use all of their remaining bond quota by year end, the gross monthly average in local government bond issuance will be around 580 billion, only slightly higher than in 2H 2020. Secondly, infrastructure investment is discouraged by stringent regulations to approve projects (including project assessment and debt repayment ability) and the accountability of local officials for project failures. Approvals for infrastructure projects remain at the lowest level since March last year (Chart 8). Finally, SPBs made up only about 15% of overall infrastructure spending in the past three years, while the majority came from public-private partnerships (PPP) financing, revenues from government-managed funds, government budgets and bank loans. Falling proceeds from land transfers have dragged down government-managed funds (Chart 9). In addition, government expenditures show no signs of a material increase (Chart 9, bottom panel). Chart 8Infrastructure Investment Will Remain Subdued
Infrastructure Investment Will Remain Subdued
Infrastructure Investment Will Remain Subdued
Chart 9Government Expenditures Remain Muted
Government Expenditures Remain Muted
Government Expenditures Remain Muted
As discussed in previous reports, local government bonds issuance only accounts for 12% of total social financing. As such, without a sizeable acceleration in bank loans, enhanced LGB issuance would not be enough to prompt a substantial increase in infrastructure investment growth. Our argument is underscored by the structural downshift in infrastructure investment since 2017 (Chart 7, top panel). Therefore, additional local government bond issuance this year will help to stabilize but not boost credit growth. August PMIs Confirm Slowing Economic Activity China's official PMIs eased further in August. The non-manufacturing index fell to contractionary territory of 47.5, below the expectation of a more muted 1.3-point decline to 52.0. Similarly, the manufacturing PMI eased by 0.3 points to 50.1, which is a hair above the 50 boom-bust line. Together, weakness in both sectors pushed down the composite index to 48.9 (Chart 10). Stringent restrictions designed to halt rising rates in COVID-19 infections explain much of the deterioration in China’s service-sector activity. The sector will likely rebound in September with the easing in infection levels (Chart 11). Chart 10PMIs Show Slowing Economic Activity
PMIs Show Slowing Economic Activity
PMIs Show Slowing Economic Activity
Chart 11Lingering COVID Effects Curb Service-Sector Recovery In 2H21
Lingering COVID Effects Curb Service-Sector Recovery In 2H21
Lingering COVID Effects Curb Service-Sector Recovery In 2H21
Meanwhile, the construction PMI surprisedly rebounded sharply in August (Chart 10, bottom panel). However, investors should be cautious not to read too much into the idiosyncratic month-on-month moves suggested by the construction PMI. Instead, construction activity has moderated significantly and is set to slow further, hinting at plunged excavator sales and real estate investment in construction (Chart 12). Chart 12Construction Activity Is Unlikely To Pick Up Meaningfully This Year
Construction Activity Is Unlikely To Pick Up Meaningfully This Year
Construction Activity Is Unlikely To Pick Up Meaningfully This Year
It is clear that China’s economy is losing momentum, but greater economic weakness will be needed for policymakers to stimulate meaningfully. Export Sector Remains A Bright Spot China’s exports remain robust. Export growth picked up in August from July on a year-over-year basis. Although the improvement in August reflects a base effect, exports in level reached a new high (Chart 13). Both skyrocketed exports container freight index and strong Korean exports suggest that global demand for Chinese manufacturing goods remains resilient (Chart 14). Even though manufacturing PMIs from developed markets have rolled over, they remain elevated and should continue to support China’s exports (Chart 15). Chart 13Chinese August Exports In Level Reached A New High
Chinese Small And Medium Caps Are Finding Their Shining Moment
Chinese Small And Medium Caps Are Finding Their Shining Moment
Chart 14Exports Will Remain Robust In The Rest Of The Year...
Exports Will Remain Robust In The Rest Of The Year...
Exports Will Remain Robust In The Rest Of The Year...
In contrast to resilient exports, China’s official PMI export new orders subindex has declined for five consecutive months. Even though falling PMI new export orders subindex heralds a slowing in exports growth, a reading of below the 50 boom-bust threshold in the former does not suggest a contraction in the growth rate of the latter. Furthermore, the month-over-month nature of PMI new export orders subindex tends to overstate the volatility in exports. The divergence between the PMI new export orders subindex and real export growth also occurred in 2018/19 during the height of the US-China trade war when export orders were volatile (Chart 16). Chart 15...And Will Continue To Benefit From Strong Global Demand
...And Will Continue To Benefit From Strong Global Demand
...And Will Continue To Benefit From Strong Global Demand
Chart 16A Divergence Between PMI New Export Orders And Export Growth
A Divergence Between PMI New Export Orders And Export Growth
A Divergence Between PMI New Export Orders And Export Growth
Regulatory Tightening In Real Estate Sector Stringent regulations in housing since the beginning of the year have started to cool the sector (Chart 17). However, home prices inflation in tier-one cities is still elevated (Chart 18). Thus, we expect the controls on housing and among property developers will remain in place for the next 6 to 12 months. Chart 17Housing Sector Is Cooling...
Housing Sector Is Cooling...
Housing Sector Is Cooling...
Chart 18...But Housing Prices In First-Tier Cities Keep Rising At A Faster Rate
...But Housing Prices In First-Tier Cities Keep Rising At A Faster Rate
...But Housing Prices In First-Tier Cities Keep Rising At A Faster Rate
Industrial Profits: Rising Prices, Falling Production China’s industrial profit growth remained solid in July despite the waning low base effect. Manufacturing producer prices continued to rise, offsetting weaker production growth (Chart 19). In addition, a low interest-rate environment helped to lift profits in the manufacturing sector by reducing debt servicing costs. While we expect weakening domestic demand and peaking producer prices to weigh on corporate profits in the rest of this year, profit growth is rolling over from a lofty height and will not likely drop sharply in the coming months (Chart 20). In addition, producer prices will likely remain at a historically high level in the next six months given robust global demand for raw materials and persistent global supply shortages. Chart 19Rising Prices And Low Interest Rates Helped To Offset Falling Industrial Production
Rising Prices And Low Interest Rates Helped To Offset Falling Industrial Production
Rising Prices And Low Interest Rates Helped To Offset Falling Industrial Production
Chart 20Peaking Producer Prices Will Weigh On Corporate Profits
Peaking Producer Prices Will Weigh On Corporate Profits
Peaking Producer Prices Will Weigh On Corporate Profits
Meanwhile, there is a large gap between the prices for producer goods and consumer goods, suggesting that manufacturers in mid-to-downstream industries have not been able to fully pass on rising input costs to domestic consumers (Chart 21). Profit growth continues to be disproportionally stronger in the upstream industrial producers than in the downstream industries, while the profit margin in the manufacturing sector remains much more muted (Chart 22). Chart 21Inflation Passthrough From Manufacturers To Domestic Consumers Remains Limited
Inflation Passthrough From Manufacturers To Domestic Consumers Remains Limited
Inflation Passthrough From Manufacturers To Domestic Consumers Remains Limited
Chart 22Profit Growth In Upstream Industries Still Outpaces Manufacturing Sector
Profit Growth In Upstream Industries Still Outpaces Manufacturing Sector
Profit Growth In Upstream Industries Still Outpaces Manufacturing Sector
Table 1
Chinese Small And Medium Caps Are Finding Their Shining Moment
Chinese Small And Medium Caps Are Finding Their Shining Moment
Table 2
Chinese Small And Medium Caps Are Finding Their Shining Moment
Chinese Small And Medium Caps Are Finding Their Shining Moment
Footnotes Market/Sector Recommendations Cyclical Investment Stance
Highlights A decline in the marginal propensity to spend out of both income and wealth over the past few decades generated a flood of excess savings. Facing a chronic shortfall of aggregate demand, central banks had no choice but to cut interest rates. This inflated asset prices. Looking out, the marginal propensity to spend should rise as household deleveraging pressures abate, retiring baby boomers shift from being savers to dissavers, and labor’s share of income increases. While rising bond yields will be a headwind to equities, continued above-trend global growth, upward earnings revisions, forthcoming Chinese fiscal stimulus, and a cresting in the number of new Delta variant cases all justify overweighting stocks on a 12-month horizon. A more cautious stance towards equities will be appropriate in two years’ time once stagflationary forces begin to assert themselves. The Keynesian Cross The “Keynesian Cross” is one of the first diagrams that students encounter in introductory macroeconomic courses (Chart 1). It simply plots Aggregate Expenditure (AE) versus output (Y). Chart 1The Keynesian Cross
Financial Markets Face The Keynesian Cross
Financial Markets Face The Keynesian Cross
Aggregate expenditure consists of personal consumption, capital investment, government expenditure, and net exports: (1)
Financial Markets Face The Keynesian Cross
Financial Markets Face The Keynesian Cross
If spending exceeds output, inventories will decline, causing firms to raise production. In contrast, if output exceeds spending, inventories will increase, prompting companies to cut production. Hence, the economy gravitates towards a level of output where inventories are stable; that is, where AE is equal to Y. Importantly, this level of production may or may not correspond to full employment. Introducing Asset Prices The Keynesian Cross model does not explicitly include asset prices. However, this can be easily rectified by postulating that spending depends on both income and wealth. For example, let us express consumption as: (2)
Financial Markets Face The Keynesian Cross
Financial Markets Face The Keynesian Cross
In this equation, α is the marginal propensity to consume out of wealth (i.e., how much consumption rises for every dollar increase in wealth, W) while β is the marginal propensity to consume out of income, Y.1 An increase in asset prices will boost wealth, leading to more consumption. A Simple But Illuminating Identity Consider the case where inventories are stable. Substituting equation (2) into equation (1) and then dividing by Y yields: (3)
Financial Markets Face The Keynesian Cross
Financial Markets Face The Keynesian Cross
The equation above is an identity. It does not say that a change in one term must lead to a change in another term in any causal sense of the word. All it says is that the terms on the right-hand side of the equation must add up to one. Suppose, for example, that α or β were to decline. If that were to happen, consumption would fall, leading to lower output. In order to restore output to its original level, either wealth would need to rise or some combination of investment, government spending, and net exports would need to increase. Upward Pressure On Savings There are at least three reasons to think that α and β have declined since the early 1980s: Chart 2US Household Debt Burdens Have Eased Significantly Over The Past Decade
US Household Debt Burdens Have Eased Significantly Over The Past Decade
US Household Debt Burdens Have Eased Significantly Over The Past Decade
Deleveraging: The need for households in economies such as the US to repair their balance sheets in the aftermath of the Global Financial Crisis put upward pressure on desired savings, leading to a decrease in β. The inability to use the equity in one’s home to finance consumption also lowered α. To this day, outstanding home equity line of credit (HELOC) balances in the US are a shadow of their former selves (Chart 2). Demographics: Savings vary over the life cycle. In general, savings are highest between the ages of 35 and 60 (Chart 3). The percentage of households in developed economies in their peak savings years began to increase in the late 1970s. While the trend has reversed in recent years, the ratio of workers-to-consumers in most countries (the so-called “support ratio”) remains elevated (Chart 4). Inequality: Higher income households save a greater share of their incomes than lower income households. As Atif Mian, Ludwig Straub, and Amir Sufi documented at last week’s Jackson Hole symposium, the rise in income inequality since 1980 has pushed up desired savings, thus lowering β in the process (Chart 5). Likewise, there is evidence that wealthier households tend to spend less of every additional dollar of wealth than poorer households.2 To the extent that wealth inequality has also increased since 1980, α has declined. Chart 3ASavings Peak Around Middle Age (I)
Savings Peak Around Middle Age (I)
Savings Peak Around Middle Age (I)
Chart 3BSavings Peak Around Middle Age (II)
Savings Peak Around Middle Age (II)
Savings Peak Around Middle Age (II)
Chart 4AIncreased Desired Savings Corresponded To A Rise In Support Ratios (I)
Increased Desired Savings Corresponded To A Rise In Support Ratios (I)
Increased Desired Savings Corresponded To A Rise In Support Ratios (I)
Chart 4BIncreased Desired Savings Corresponded To A Rise In Support Ratios (II)
Increased Desired Savings Corresponded To A Rise In Support Ratios (II)
Increased Desired Savings Corresponded To A Rise In Support Ratios (II)
Chart 5Income Inequality Has Skewed The Composition Of Savings
Financial Markets Face The Keynesian Cross
Financial Markets Face The Keynesian Cross
The Need For Policy Support The decline in α and β over the past few decades could have been offset by an increase in investment or net exports. Unfortunately, at least in the US, that never happened (Chart 6). The US trade deficit in goods and services stood at 3.9% of GDP in Q2 of 2021, the highest in 12 years. The non-petroleum trade deficit is at a record high. Investment spending also remains below the levels reached in the pre-GFC period. The shortfall in aggregate demand put pressure on policymakers to spur the economy. The results were somewhat mixed. Looking at the US, government spending on goods and services rose substantially during the Great Recession. However, spending then proceeded to fall to multi-decade lows as a share of GDP by 2019 (Chart 7). Transfer payments were also broadly stable as a share of GDP in the decade leading up to the pandemic. The Trump tax cuts reduced government revenue by around 1.7% of GDP. However, as we have noted in the past, the impact of the tax cuts on aggregate demand was fairly small. Chart 6US Private Sector Investment Remains Below Its Pre-GFC Peak While The Non-Petroleum Trade Deficit Is At A Record High
US Private Sector Investment Remains Below Its Pre-GFC Peak While The Non-Petroleum Trade Deficit Is At A Record High
US Private Sector Investment Remains Below Its Pre-GFC Peak While The Non-Petroleum Trade Deficit Is At A Record High
Chart 7Fiscal Policy Has Been More Reactive Than Proactive In The US
Fiscal Policy Has Been More Reactive Than Proactive In The US
Fiscal Policy Has Been More Reactive Than Proactive In The US
After surging during the pandemic, both direct government expenditure and transfer payments have come off their highs. Tax rates are also likely to rise for upper income earners and corporations. Nevertheless, with Congress set to pass a $550 billion infrastructure bill and a $3.5 trillion budget reconciliation bill, US fiscal policy will remain more stimulative over the next few years than it was in the pre-pandemic period. The same is likely to be true outside the US (Chart 8). Chart 8Fiscal Policy: Tighter But Not Tight
Financial Markets Face The Keynesian Cross
Financial Markets Face The Keynesian Cross
Central Banks To The Rescue This brings us to monetary policy. In the post-GFC period, lower interest rates helped keep capital investment from falling more than it would have otherwise. In addition, lower rates discouraged savings, thus supporting consumption. And, with other central banks also cutting rates, the decision by the Fed to maintain low rates prevented the dollar from strengthening excessively. Beyond the direct benefits to the economy, lower rates increased the prices of long-duration assets such as equities and homes. This raised W in the equations above. The resulting “wealth effect” stoked consumer spending, while also encouraging new investment (particularly in real estate). Excess Savings Should Diminish Looking out, there are a few reasons to think that α and β will begin trending higher, leading to more spending and less need for ultra-accommodative monetary policies: Chart 9Wealth Accumulation Through The Ages
Financial Markets Face The Keynesian Cross
Financial Markets Face The Keynesian Cross
Deleveraging pressures have abated. In the US, the ratio of household debt-to-disposable income has returned to pre-housing bubble levels. Debt-servicing costs are at a multi-decade low. Baby boomers are leaving the labor force. They hold over half of US household wealth, considerably more than younger generations (Chart 9). As baby boomers transition from being net savers to net dissavers, national savings will fall. Chart 10A Tight Labor Market Eventually Bolsters Wages
A Tight Labor Market Eventually Bolsters Wages
A Tight Labor Market Eventually Bolsters Wages
Governments are working to mitigate income inequality. Not only are redistributionist policies increasingly in vogue, but policymakers are trying to run economies hot. Historically, a tight labor market has curbed income inequality, while driving up workers’ share of overall income (Chart 10). Upside For Bond Yields, Both Near And Far Bond yields in the major economies likely hit a generational low last summer. Yields should rise over the coming years, first as slack diminishes, and later as structural forces reduce the amount of excess savings sloshing around the global economy. In the near term, a cresting of the Delta variant wave will prop up Treasury yields. While the number of new cases in the US continues to rise, the second derivative has turned for the better. A heat map shows that the weekly growth in new cases has slowed substantially in most US states (Chart 11). Chart 11The Delta Variant Wave Is Fading In The US
Financial Markets Face The Keynesian Cross
Financial Markets Face The Keynesian Cross
Globally, the Delta variant wave is abating (Chart 12). The transmission rate has clearly peaked within the G7 (Chart 13). The number of cases has begun to fall in recent hot spots such as Indonesia and Thailand. And, after rising above 100, the 7-day average of new cases in China has fallen back to 30. Chart 12The Delta Wave Is Cresting
Financial Markets Face The Keynesian Cross
Financial Markets Face The Keynesian Cross
Chart 13The Covid Transmission Rate Is Falling Again
The Covid Transmission Rate Is Falling Again
The Covid Transmission Rate Is Falling Again
The tapering of bond purchases by the major central banks should also lift yields. Canada began tapering this past April. BCA’s fixed-income experts expect the Fed to start paring back purchases by the end of this year, with the ECB and BoE following suit in early 2022. We do not expect bond markets to become unhinged. Central banks would strongly push back against an excessive rise in yields. Nevertheless, a move in the US 10-year Treasury yield to 1.8% by early next year seems reasonable. Stocks Can Withstand Rising Bond Yields… For Now Chart 14Equity Valuations and Real Bond Yields Have Tended To Move In Tandem
Equity Valuations and Real Bond Yields Have Tended To Move In Tandem
Equity Valuations and Real Bond Yields Have Tended To Move In Tandem
Equity valuations have broadly tracked real bond yields over the past few years (Chart 14). While higher yields will weigh on equity prices, there are a number of remaining tailwinds for stocks: Growth will remain above trend in the foreseeable future: Bloomberg consensus estimates foresee the global economy growing at an above-trend pace well into next year (Table 1). We agree with this assessment, and in fact, see upside risks to consensus growth forecasts. In particular, Chinese growth is likely to accelerate later this year as credit growth rebounds and fiscal spending increases. Local governments used less than 40% of their annual debt issuance quotas as of the end of July. Typically by that time of the year, they have used 70% of their quotas. Table 1Global Growth Will Remain Above Trend Well Into Next Year
Financial Markets Face The Keynesian Cross
Financial Markets Face The Keynesian Cross
Forward earnings estimates will continue to drift higher: Analysts are usually too optimistic. As a result, they normally have to cut estimates over the course of the calendar year. This year has been different (Chart 15). In early July, analysts expected S&P 500 companies to generate about $45 in EPS in Q2. In the end, they generated about $53. Earnings are projected to decline in absolute terms in Q3 and remain below Q2 levels until the second quarter of next year, when they are anticipated to grow by a meagre 3.5% year-over-year (Table 2). As earnings estimates move up, stock prices will rise, even if P/E multiples move sideways. Chart 15Unusually, Analysts Have Been Revising Earnings Estimates Higher This Year
Unusually, Analysts Have Been Revising Earnings Estimates Higher This Year
Unusually, Analysts Have Been Revising Earnings Estimates Higher This Year
Table 2US Earnings Estimates Have Upside
Financial Markets Face The Keynesian Cross
Financial Markets Face The Keynesian Cross
Rising inflation expectations will lift nominal bond yields more than real yields: Investors expect inflation to come down rapidly over the coming months (Chart 16). The 5-year/5-year forward TIPS breakeven inflation rate is below the Fed’s comfort zone of 2.3%-to-2.5% (Chart 17).3 We think that US inflation will fall fast enough over the next few quarters to allow the Federal Reserve to maintain a fairly accommodative monetary stance, but not as fast as markets are discounting. Chart 16Investors Expect Inflation To Fall Rapidly From Current Levels
Financial Markets Face The Keynesian Cross
Financial Markets Face The Keynesian Cross
The global equity risk premium remains elevated: We measure the equity risk premium (ERP) by subtracting the real 10-year bond yield from the forward earnings yield.4 Based on this measure, the global ERP stands at 634 bps (Chart 18). At the peak of the stock market boom in 2000, the global ERP was barely positive. Even in the US, where valuations are more stretched than abroad, the ERP stands at 574 bps. Remarkably, this is almost exactly where the ERP was in May 2008. An increase in the US 10-year Treasury yield to 1.8% by early next year – representing roughly a 50 basis-point increase from current levels in nominal terms and even less in real terms – would still leave US stocks attractively priced relative to bonds. Chart 17Below The Fed's Comfort Zone
Below The Fed's Comfort Zone
Below The Fed's Comfort Zone
In summary, investors should remain overweight global equities on a 12-month horizon. A more cautious stance towards stocks will be appropriate in two years’ time once stagflationary forces begin to assert themselves. Peter Berezin Chief Global Strategist pberezin@bcaresearch.com Chart 18The Global Equity Risk Premium Remains Elevated
The Global Equity Risk Premium Remains Elevated
The Global Equity Risk Premium Remains Elevated
Footnotes 1 Note that Gross Domestic Product should theoretically equal Gross Domestic Income. Thus, Y can denote either income or output. 2 For example, in a sample of five euro area economies, the European Central Bank found that the marginal propensity to consume out of wealth is higher for households at the lower end of the wealth distribution. 3 The Federal Reserve targets an average inflation rate of 2% for the personal consumption expenditures (PCE) index. The TIPS breakeven is based on the CPI index. Due to compositional differences between the two indices, CPI inflation has historically averaged 30-to-50 basis points higher than PCE inflation. This is why the Fed effectively targets a CPI inflation rate of about 2.3%-to-2.5%. 4 It is necessary to subtract the real bond yield, rather than the nominal bond yield, from the earnings yield because the earnings yield provides an estimate of the real total expected return to shareholders. For further discussion on this, please see Appendix A of the Global Investment Strategy Special Report, “TINA To The Rescue?” dated August 23, 2019. Global Investment Strategy View Matrix
Financial Markets Face The Keynesian Cross
Financial Markets Face The Keynesian Cross
Special Trade Recommendations
Financial Markets Face The Keynesian Cross
Financial Markets Face The Keynesian Cross
Current MacroQuant Model Scores
Financial Markets Face The Keynesian Cross
Financial Markets Face The Keynesian Cross
Highlights Regulatory changes affecting Chinese platform companies are structural – rather than transitory – in nature. These companies might become quasi-SOEs and could be used by the government to achieve its national and geopolitical objectives. China’s regulatory clampdown will produce structurally lower corporate profitability and, thereby, reduce equity valuations for Chinese TMT companies. Chinese policymakers have begun easing monetary and fiscal policies. Money and credit growth will likely bottom in December or so. However, as in H2 2018 and H1 2019, policy will be eased only gradually. During this period EM ex-TMT stocks and industrial metal prices performed poorly. Mainstream EM (countries outside North Asia) will continue suffering from weak growth and rising political volatility, warranting a higher risk premium. The risk-reward tradeoff for EM financial markets is poor. Feature Over the past several days, I have held calls and roundtables with clients located in the EMEA region. In this report, we will share our answers to the most common client questions. Many clients were asking if the selloff in Chinese platform companies is nearing its end or whether much more weakness is to be expected. It is not surprising that with the Hang Seng Tech index down 35% from its February highs, there is great temptation to engage in bottom fishing. So, we start with questions relating to this topic. Chart 1Is This Time Different For Chinese TMT Stocks?
Is This Time Different For Chinese TMT Stocks?
Is This Time Different For Chinese TMT Stocks?
Question: In 2018, the regulatory clampdown on Tencent and other video game companies lasted several months and created a major pullback in their share prices (Chart 1). However, authorities ultimately removed restrictions and these stocks rallied to new highs. Do you expect the same dynamics to emerge this time around? And if not, why? We are witnessing a structural regime shift in the Chinese government’s approach toward platform companies. These changes are much more profound and long lasting than those in 2018. They herald structurally lower corporate profitability and equity multiples for Chinese TMT companies. For these stocks, a bounce from oversold levels is possible over the near term and it could be sharp. However, the rebound will be short-lived, i.e., a cyclical or secular rally is unlikely. Investors – who have not sold – should use this rebound to pare back exposure to Chinese TMT stocks. Chart 2Chinese SOEs: Lackluster Share Price Performance
Chinese SOEs: Lackluster Share Price Performance
Chinese SOEs: Lackluster Share Price Performance
Going forward, these platform companies will be managed in a similar fashion to Chinese state-owned enterprises (SOEs): with the interest of the entire nation in mind, and shareholder interests will take a back seat. China’s SOEs trade at very low multiples and their share prices have been treading water since 2009 (Chart 2). The secular bull market in Chinese TMT share prices is over and more de-rating is likely for the following reasons: Chinese platform/new economy companies possess unique big data that are important to the country’s development. Protecting big data becomes a priority in an era of US-China geopolitical confrontation and amid the elevated risk of cyber attacks. As a result, it is essential for the Chinese government to control companies that possesses big data. Limiting foreign shareholders’ access and decision making in regard to big data is also imperative. We do not believe that Chinese authorities will ever allow these new economy companies to operate as freely as they have in the past. Given platform company importance to both the domestic economy and geopolitical confrontation with the US, we will not be surprised if the government eventually establishes effective control over these platform companies – probably via its affiliated entities. Many of these platform companies are natural monopolies or oligopolies and their profitability should be regulated by authorities according to free market economic textbooks. We discussed this point in the recent report titled Chinese TMT Stocks: A Bad Dream Or A New Reality? Please click on the link to open the report. Going forward, return on equity will be lower than in the past for these stocks, heralding lower valuation multiples. Stocks of many Chinese platform companies trade in the US and are largely owned by US/international (non-Chinese) investors. Neither US nor Chinese authorities want to see shares of Chinese TMT companies trade in the US, albeit for completely different reasons. Chinese authorities want these companies to release little information to their foreign shareholders, especially regarding big data. In turn, the US securities regulator is keen for US investors not to be exposed to the risks of owning Chinese stocks for two main reasons: (1) these companies do not disclose full information and (2) China’s government meddles with the management of these enterprises. Given that authorities from both countries do not support the trading of Chinese stocks in the US, odds are high that the trading of Chinese TMT companies will move from the US to Hong Kong. Moreover, US authorities may recommend US funds avoid owing Chinese stocks. In short, increased government control over Chinese TMT companies and rising geopolitical tensions between the US and the Middle Kingdom may prompt many foreign investors to reduce their exposure to these stocks. This will have negative ramifications on their share prices. Chart 3Little Volatility Spillover From Offshore Into China's Onshore Markets
Little Volatility Spillover From Offshore Into China's Onshore Markets
Little Volatility Spillover From Offshore Into China's Onshore Markets
Question: Don’t you think Chinese authorities may reverse their regulatory clampdown given that Chinese share prices have already dropped a great deal and further weakness could hurt investor and business sentiment? Chinese authorities will not reverse regulatory tightening on platform companies. If investor and business confidence on the mainland is hurt materially, regulators will reduce the intensity of their reforms but will not reverse them. Importantly, the carnage has so far been limited to Chinese offshore financial markets (Chart 3). Neither the onshore equity indexes, nor onshore corporate bonds have sold off much (Chart 3). The majority of platform companies are listed offshore and plunging share prices hurt foreign shareholders more than domestic retail and institutional investors. There is little reason for Chinese policymakers to worry about losses among foreign investors so long as the carnage does not spread to onshore markets. Question: Why would Chinese authorities damage their largest and most successful companies in the new economy sectors? Are they not critical amidst the US-China confrontation? Chinese policymakers understand the importance of platform companies to the country’s domestic growth outlook as well as its geopolitical ambitions. This explains why Chinese authorities seek to establish effective control over decision making in these companies. We elaborated on the strategic importance of big data above. Also, the largest platform companies, such as Alibaba, Tencent and Meituan, have in recent years been acquiring stakes in numerous businesses in Southeast Asia. Beijing might be thinking of using these platform companies to raise its geopolitical influence over other Asian nations and beyond. Many Asian nations will play a prominent role in the US-China confrontation. Whether they side with China or the US will affect the balance of geopolitical power in the region. In this context, having control over soft infrastructure (payment and data systems, among others) in these Asian economies will give Beijing a chance to influence their geopolitical choices, thereby giving China an advantage over the US. Therefore, the Chinese central government might be aiming to establish an effective control over these companies’ strategic decisions. In such a case, shareholder interests will take a back seat in these companies. Question: What about common prosperity initiatives and policies that the Chinese leadership has unveiled in recent weeks? Why now? President Xi will be elected for his third term in the fall of 2022. This constitutes a major political precedent in the Middle Kingdom’s modern history. President Xi wants to secure his support from the bulk of the population. Common prosperity policies entail income and wealth distribution from high-income to middle- and low-income households. Chart 4 and Chart 5 illustrate that there has so far been no equalization of income and wealth distribution. Chart 4China: Income Disparity Has Not Been Narrowing
What Clients Are Asking
What Clients Are Asking
Chart 5Wealth Concentration Remains High In China
Wealth Concentration Remains High In China
Wealth Concentration Remains High In China
It is imperative for President Xi to achieve a meaningful change in income and wealth distribution in the next 12 months before his third term. President Xi’s power stems not from the top 10% of the population but from the remaining (and less wealthy) 90%. Hence, there will be little easing in the push toward common prosperity. If anything, the pace of these initiatives could escalate going forward. As a part of the common prosperity initiatives, companies with excess profitability will be compelled to perform a national duty in the form of financing social programs or providing donations. Large platform companies have already begun making large donations. This trend will intensify in the months ahead. In brief, profits will be distributed away from shareholders of these companies in favor of the general well-being of society. The positive is that low- and middle-income consumer spending in China will be supported by income transfer from companies and wealthy individuals. As a result, investors should favor the companies that sell to low- and middle-income households. Chart 6Chinese Growth Stocks Are Not Yet Cheap
Chinese Growth Stocks Are Not Yet Cheap
Chinese Growth Stocks Are Not Yet Cheap
Going forward, the model of SOEs in China or Russia will be applicable to Chinese platform companies. SOEs in China, Russia and other EM countries often perform national duties at the expense of shareholders. Not surprisingly, their stocks have been trading at much lower multiples than private companies. Presently, Chinese TMT/growth stocks trade at a trailing P/E ratio of 33.5 (Chart 6). We do not expect platform companies’ P/E ratio to drop to the level of SOEs. However, a trailing P/E ratio of 33.5 for China’s TMT companies is still high given: the uncertainty around future business models; a lack of clarity around (still evolving) new regulation; government involvement in their management; the prioritization of national and geopolitical objectives over shareholder interest. Chart 7Mind These Gaps
Mind These Gaps
Mind These Gaps
Question: Isn’t the slowdown in China’s business cycle already well known and priced in related financial markets? Yes, it is well known but we do not think it has been priced in China-exposed plays. There are several market relationships and indicators that lead us to believe so. Both panels in Chart 7 illustrate that industrial metals prices have diverged from the Chinese manufacturing PMI and onshore government bond yields. The latter two variables project the Chinese business cycle. Such a decoupling is unsustainable given that China accounts for 55% of global industrial metal consumption. We continue to expect meaningful downside in industrial metals prices which would hurt EM countries exporting commodities. China’s credit and fiscal spending impulse leads its business cycle by nine months and suggests that economic data will be weakening until Q2 2022 (Chart 8). Finally, net EPS revisions for EM-listed companies remain elevated (Chart 9). Chart 8China's Business Cycle Will Continue Decelerating Well Into Q1 2022
China's Business Cycle Will Continue Decelerating Well Into Q1 2022
China's Business Cycle Will Continue Decelerating Well Into Q1 2022
Chart 9EM EPS Growth Expectations Have Not Yet Been Downgraded
EM EPS Growth Expectations Have Not Yet Been Downgraded
EM EPS Growth Expectations Have Not Yet Been Downgraded
That said, one sentiment indicator that has dropped significantly and is now near its level during previous EM equity lows is the Sentix European investor sentiment index on EM equities (Chart 10). Chart 10European Investor Sentiment On EM Stocks Is Back To Its Previous Lows
European Investor Sentiment On EM Stocks Is Back To Its Previous Lows
European Investor Sentiment On EM Stocks Is Back To Its Previous Lows
Net-net, the risk-reward tradeoff for EM equities and credit markets is not yet attractive. Chinese TMT stocks are vulnerable for reasons discussed above while EM financial markets exposed to China’s old economy are at risk due to decelerating Chinese economic growth. Question: When will authorities in China ease policy? What does it imply for Chinese and EM financial markets? Shouldn’t investors buy China/EM assets now in anticipation of macro policy easing in China? Yes, China has already started easing credit and fiscal policy and will ease more in the coming months. Chart 11 reveals that banks’ excess reserves at the PBOC have turned up and they lead the credit impulse by six months. In turn, the Chinese credit impulse in turn leads EM share price cycles by nine months (Chart 12). Chart 11China's Credit Impulse Will Bottom In Late 2021
China's Credit Impulse Will Bottom In Late 2021
China's Credit Impulse Will Bottom In Late 2021
Chart 12EM Equities Are Not Yet Out Of The Woods
EM Equities Are Not Yet Out Of The Woods
EM Equities Are Not Yet Out Of The Woods
All in all, even though Chinese policymakers have begun easing credit and fiscal policy, financial markets leveraged to the mainland’s old economy could still suffer as growth continues to disappoint in the months to come. Chart 13Chinese Easing In H2 2018 And H1 2019 Did Not Help Much EM Stocks And Metal Prices
Chinese Easing In H2 2018 and H1 2019 Did Not Help Much EM Stocks And Metal Prices
Chinese Easing In H2 2018 and H1 2019 Did Not Help Much EM Stocks And Metal Prices
Importantly, policy easing will be implemented gradually, as in H2 2018 and H1 2019. During this period EM ex-TMT stocks and industrial metal prices performed poorly despite policy easing in China (Chart 13). Question: Given improvements in vaccine availability worldwide, will EM countries close their vaccination gap with developed countries in the coming months? If yes, wouldn’t it allow their economies to catch up, and their financial markets to outperform their DM peers? EM vaccination rates will rise as vaccines become available to developing countries. However, mainstream EM vaccination rates will still remain below those of advanced economies. This gap is due to higher levels of mistrust toward governments in developing countries than in advanced ones. Therefore, the pandemic will continue capping economic activity in mainstream EM. Importantly, the lack of fiscal stimulus, monetary policy tightening and weak banking systems in mainstream EM (i.e., excluding China, Korea and Taiwan) herald weak income and domestic demand growth in these economies. Years of poor income growth and lasting pandemic damage have caused political volatility to flare-up in some countries such as Colombia, Peru, Brazil, South Africa and Malaysia. This trend will likely continue foreshowing a higher risk premium in EM financial markets. Question: What is your inflation outlook for mainstream EM (excluding North Asia)? Will inflation continue to surprise to the upside and will their central banks hike rates enough so that their currencies do not depreciate? We discussed the inflation dynamics and the outlook for local rates for EM in the August 12 report. While commodity price inflation will subside, renewed currency deprecation is the key risk to the inflation outlook in mainstream EM. EM currencies will depreciate because China’s continued slowdown is bearish for EM currencies but bullish for the greenback. The basis is that the US sells little to China while EM are exposed to the Chinese business cycle. Also, domestic demand in mainstream EM will disappoint. That, along with rising political volatility, is negative for their currencies. Finally, high local rates in mainstream EM have often coincided with currency depreciation rather than appreciation. Question: What is the biggest risk in your view? The biggest risk to our view has been and remains TINA (There Is No Alternative). We have strong conviction on fundamentals but very little conviction on fund flows. Given that DM equity and credit markets are expensive and their government bond yields are very depressed, portfolio capital can go into EM financial markets that offer lower valuation than their DM counterparts even though they are not cheap in absolute terms. Our methodology is that fundamentals drive flows in the medium- to-long term. However, with the global financial system flush with liquidity, the importance of fundamentals has declined in recent years. Therefore, we are cognizant that EM markets might not sell off a lot and could bottom at a higher level than warranted by fundamentals. Still, we expect more downside in the coming months because fundamentals are much worse than most investors realize. Chart 14EM Credit Will Continue Underperforming Their US Peers
EM Credit Will Continue Underperforming Their US Peers
EM Credit Will Continue Underperforming Their US Peers
Question: What is your recommended strategy across EM equities, currencies, and fixed-income markets? Global equity portfolios should continue underweighting EM, a recommendation from March 25, 2021. Within the EM equity universe, our overweights are Korea, India, China (preferring onshore to offshore equities), Mexico and Chile. Our underweights are Brazil, Colombia, Peru, South Africa, Turkey, the Philippines and Indonesia. The risk-reward tradeoff for EM currencies remains poor. We continue shorting a basket of BRL, CLP, COP, PEN, ZAR, TRY, PHP, THB and KRW versus the US dollar. Within local markets we overweight Mexico, Russia, Korea, Malaysia, India, China and Chile. Regarding sovereign and corporate credit, we have downgraded EM credit versus US credit on March 25 and this strategy remains intact (Chart 14). The lists of our overweights, underweights and the ones warranting neutral allocation in EM equity, domestic bonds and credit portfolios are presented below and can always be found on the EMS website. Arthur Budaghyan Chief Emerging Markets Strategist arthurb@bcaresearch.com Equities Recommendations Currencies, Credit And Fixed-Income Recommendations
Highlights Our willingness to spend money depends on which ‘mental account’ it occupies. Once windfall income enters our ‘savings mental account’, we will not spend it. Hence, the pandemic’s windfall income receipts will have no sustained impact on spending, or on inflation. This means that US monetary tightening will be later and shallower than the market is pricing. As we learn to live with the pandemic, the massive displacement in spending patterns is normalising. This means that the abnormally high spending on durable goods has a long way to fall. Hence, today we are recommending a new 6-month position: underweight consumer discretionary plays. One easy way of expressing this is to underweight XLY (US consumer discretionary) versus XLP (US consumer staples). Fractal analysis: The US dollar, and base metals versus precious metals. Feature Chart of the WeekNo Tsunami Of Spending Despite Excess Income
No Tsunami Of Spending Despite Excess Income
No Tsunami Of Spending Despite Excess Income
Many people claimed that the war chest of savings that global households accumulated during the pandemic would unleash a tsunami of spending. Well, it didn’t. For example, US consumer spending remains precisely on its pre-pandemic trend (Chart I-1 and Chart I-2). This, despite stimulus checks and other so-called ‘transfer payments’ which boosted aggregate household incomes by trillions of dollars. Indeed, paste over 2020, and you would be forgiven for thinking that there was no pandemic! Chart I-2No Tsunami Of Spending Despite Excess Income
No Tsunami Of Spending Despite Excess Income
No Tsunami Of Spending Despite Excess Income
Of course, households that lost their livelihoods during the pandemic, and thus became ‘liquidity constrained’, did spend the lifeline stimulus payments that they received. Yet in aggregate, households did not spend the excess income received during the pandemic. Moreover, the phenomenon is global – the savings rate in the UK has surged near identically to that in the US (Chart I-3). Chart I-3The Savings Rate Has Surged Everywhere
The Savings Rate Has Surged Everywhere
The Savings Rate Has Surged Everywhere
The excess income built up during the pandemic did not unleash a tsunami of spending. Neither will it unleash a tsunami of future spending. We can say this with high conviction because we have seen the same movie many times before. Previous tranches of stimulus and transfer payments that boosted incomes in 2004, 2008, and 2012 (though admittedly by less than in 2020) had no lasting impact on spending. Whether We Spend Or Save Money Depends On Which ‘Mental Account’ It Occupies Why do windfall income receipts not trigger a tsunami in spending? (Chart I-4) Chart I-4Stimulus Checks Had No Meaningful Impact On Spending
Stimulus Checks Had No Meaningful Impact On Spending
Stimulus Checks Had No Meaningful Impact On Spending
One putative answer comes from Milton Friedman’s Permanent Income Hypothesis. Contrary to the Keynesian belief that absolute income drives spending, Friedman postulated that income comprises a permanent (expected) component and a transitory (unexpected) component. And only the permanent income component drives spending. In the permanent income hypothesis, spending is the result of estimated permanent income rather than a transitory current component. Therefore, for households that are not liquidity constrained, a windfall receipt – like a stimulus payment – will not boost spending if it does not boost estimated permanent income. Nevertheless, this theory does require households to estimate their future permanent incomes, and it is debatable if households can do this. Stimulus and transfer payments that boosted incomes in 2004, 2008, 2012, and 2020 had no lasting impact on spending. We believe that a more real-world answer to how we deal with windfalls comes not from Economics but from the field of Psychology, and the theory known as Mental Accounting Bias. Mental accounting bias states that we segment our money into different accounts, which are sometimes physical, sometimes only mental, and that our willingness to spend money depends on which mental account it occupies. This contrasts with standard economic theory which assumes that money is perfectly fungible, so that a dollar in a current (checking) account is no different to a dollar in a savings account. In practice, money is not fungible, because we attach different emotions to our different mental accounts. A dollar in our current account we will gladly spend, but a dollar in our savings or investment accounts we will not spend. Hence, the moment we move the dollar from our current account into our savings or investment account, our willingness to spend it collapses. This explains why consumption trends have no connection with windfall income receipts once those income receipts end up in our savings mental account. Pulling all of this together, the war chest of savings accumulated during the pandemic is unlikely to change the overall trend in spending. More likely, it will be used to reduce household debt, and thereby constrain the broad money supply. In effect, part of the recent increase in public debt will just end up decreasing private debt, as happened in Japan during the 1990s (Chart I-5). Chart I-5In Japan, Public Debt Ended Up Paying Down Private Debt
In Japan, Public Debt Ended Up Paying Down Private Debt
In Japan, Public Debt Ended Up Paying Down Private Debt
With no permanent boost to spending, the pandemic’s windfall income receipts will have no sustained impact on inflation. As Spending Patterns Normalise, Consumer Discretionary Plays Are Vulnerable While consumer spending remains precisely on its pre-pandemic trend, the sub-components of this spending do not. Specifically, spending on durable goods stands way above its pre-pandemic trend, while spending on services languishes below trend (Chart I-6). Chart I-6The Pandemic Distorted Spending Patterns
The Pandemic Distorted Spending Patterns
The Pandemic Distorted Spending Patterns
This makes perfect sense. Pandemic restrictions on socialising, interacting, and movement meant that leisure, hospitality, in-person shopping, and travel services were unavailable. Therefore, consumers just shifted their firepower to items that could be enjoyed within the pandemic’s confines; namely, durable goods. But now that shift is reversing. In turn, these massive and unprecedented shifts in spending patterns explain the recent evolution of inflation. As booming demand for durable goods created supply bottlenecks, durables prices skyrocketed (Chart I-7). Chart I-7The Pandemic Distorted Prices
The Pandemic Distorted Prices
The Pandemic Distorted Prices
Remarkably though, the 10 percent spike in US durable good price through 2020-21 was the first increase in an otherwise persistently deflationary trend through this millennium (Chart I-8). As such, it was a huge aberration and as Jay Powell pointed out last week in Jackson Hole: Chart I-8The Increase In Durables Prices Was A Huge Aberration
The Increase In Durables Prices Was A Huge Aberration
The Increase In Durables Prices Was A Huge Aberration
“It seems unlikely that durables inflation will continue to contribute importantly over time to overall inflation.” Meanwhile, with services simply unavailable, their prices did not fall, given that the price of something that cannot be bought is a meaningless concept. Moreover, unlike for an unbought durable good, which adds to tomorrow’s supply, an unbought service such as a theatre ticket – whose consumption is time-sensitive – does not add to tomorrow’s supply. Hence, when unavailable services suddenly became available, the initial euphoric demand for limited supply caused these service prices also to surge. But excluding such short-lived euphoria in airfares, car hire, and lodging way from home, services prices remain well-contained. This reinforces our conclusion from the first section. The pandemic’s windfall income receipts will have no sustained impact on inflation. As Jay Powell went on to say: “We have much ground to cover to reach maximum employment, and time will tell whether we have reached 2 percent inflation on a sustainable basis.” All of which means that US monetary tightening will be later and shallower than the market is pricing. Another important investment conclusion is that as we learn to live with the pandemic, the massive displacement in spending patterns is normalising. This means that the abnormally high spending on durable goods has a long way to fall. The abnormally high spending on durables has a long way to fall. Given the very tight connection between spending on durables and the relative performance of the goods dominated consumer discretionary plays in the stock market, this will weigh on consumer discretionary sectors (Chart I-9). Chart I-9As Spending Patterns Normalise, Consumer Discretionary Plays Are Vulnerable
As Spending Patterns Normalise, Consumer Discretionary Plays Are Vulnerable
As Spending Patterns Normalise, Consumer Discretionary Plays Are Vulnerable
Hence, today we are recommending a new 6-month position: underweight consumer discretionary plays. One easy way of expressing this is to underweight XLY (US consumer discretionary) versus XLP (US consumer staples) (Chart I-10). Chart I-10Underweight XLY Versus XLP
Underweight XLY Versus XLP
Underweight XLY Versus XLP
Fractal Analysis Update Fractal analysis suggests that the dollar’s rally since late-Spring could meet near-term resistance, given the incipient fragility on its 65-day fractal structure (Chart I-11). Chart I-11The Dollar's Rally Could Meet Near-Term Resistance
The Dollar's Rally Could Meet Near-Term Resistance
The Dollar's Rally Could Meet Near-Term Resistance
A bigger vulnerability is for the strong and sustained rally in base metals versus precious metals, which is now extremely fragile on its 260-day fractal structure (Chart I-12). We are already successfully playing this through short tin versus platinum, but are adding a new expression: short aluminium versus gold. The profit target and symmetrical stop-loss are set at 13.5 percent. Chart I-12The Massive Rally In Base Metals Versus Precious Metals Is Vulnerable
The Massive Rally In Base Metals Versus Precious Metals Is Vulnerable
The Massive Rally In Base Metals Versus Precious Metals Is Vulnerable
Dhaval Joshi Chief Strategist dhaval@bcaresearch.com Fractal Trading System Fractal Trades 6-Month Recommendations Structural Recommendations Closed Fractal Trades Closed Trades Asset Performance Equity Market Performance Indicators To Watch - Bond Yields Chart II-1Indicators To Watch - Bond Yields ##br##- Euro Area
Indicators To Watch - Bond Yields - Euro Area
Indicators To Watch - Bond Yields - Euro Area
Chart II-2Indicators To Watch - Bond Yields ##br##- Europe Ex Euro Area
Indicators To Watch - Bond Yields - Europe Ex Euro Area
Indicators To Watch - Bond Yields - Europe Ex Euro Area
Chart II-3Indicators To Watch - Bond Yields ##br##- Asia
Indicators To Watch - Bond Yields - Asia
Indicators To Watch - Bond Yields - Asia
Chart II-4Indicators To Watch - Bond Yields ##br##- Other Developed
Indicators To Watch - Bond Yields - Other Developed
Indicators To Watch - Bond Yields - Other Developed
Indicators To Watch - Interest Rate Expectations Chart II-5Indicators To Watch - Interest Rate Expectations
Indicators To Watch - Interest Rate Expectations
Indicators To Watch - Interest Rate Expectations
Chart II-6Indicators To Watch - Interest Rate Expectations
Indicators To Watch - Interest Rate Expectations
Indicators To Watch - Interest Rate Expectations
Chart II-7Indicators To Watch - Interest Rate Expectations
Indicators To Watch - Interest Rate Expectations
Indicators To Watch - Interest Rate Expectations
Chart II-8Indicators To Watch - Interest Rate Expectations
Indicators To Watch - Interest Rate Expectations
Indicators To Watch - Interest Rate Expectations
Highlights China’s credit tightening may have surpassed maximum strength. Monetary policy will remain accommodative and fiscal policy will become more supportive in the rest of the year. However, overall regulatory oversight is still restrictive, limiting the scope of reflationary effects on the economy. There were signs that the “cross-cyclical” approach – a new catchphrase from the July Politburo meeting - emerged even before the start of the pandemic. The current policy backdrop resembles the situation in 2H2018. China’s new “common prosperity” plan, which sets up guidance for long-term policy direction, will likely have cyclical implications. Chinese investable stocks are in oversold territory and will probably rebound in the near term. In the next 6 to 12 months, however, we remain cautious given the lack of a catalyst to revive investor sentiment. Feature Chart 1Chinese Stocks Are Oversold In Absolute Terms
Chinese Stocks Are Oversold In Absolute Terms
Chinese Stocks Are Oversold In Absolute Terms
China’s economic momentum has slowed, while regulatory crackdowns show no signs of dissipating. Meanwhile, Chinese investable stocks in absolute terms have slumped into technically oversold territory (Chart 1). Global investors are looking at fiscal and monetary policy easing for clues to what may be next. A shift in policy direction from restrictive to reflationary will help to shore up market sentiment and the outlook for the economy. Fiscal policy implementation in 1H21 was tighter than budgeted, leaving room for more support in 2H21. The PBoC’s unexpected reserve requirement ratio (RRR) cut in early July may have been a signal that policy tightening has ended. In short, China’s financial tightening has most likely passed its peak strength. Chart 2Valuations Are Almost Back To 2018 Lows
Valuations Are Almost Back To 2018 Lows
Valuations Are Almost Back To 2018 Lows
We have no doubt that China will announce some compensatory measures in the coming months in response to rising downward pressures on the domestic economy. However, we continue to hold the view that the bar for a fresh round of material stimulus is higher today than it was in the past. The policy focus pivoting from a countercyclical to cross-cyclical adjustment, the rising emphasis on common prosperity, and the ongoing regulatory clampdowns in an array of industries, all limit the extent to which authorities can deploy the expected magnitude in infrastructure spending and bank lending. Therefore, we continue to recommend investors remain underweight Chinese stocks versus their global peers – a stance we have maintained since earlier this year – despite cheapened relative valuations in Chinese equities (Chart 2). Shifting To A Cross-Cycle Approach China’s policy shift to a cross-cyclical stance has gained more market attention since the late-July Politburo meeting. However, there were signs that the cross-cyclical approach emerged even before the start of the pandemic. Chart 3Size Of Stimulus Was Already Getting Smaller
Size Of Stimulus Was Already Getting Smaller
Size Of Stimulus Was Already Getting Smaller
During the height of the 2018/19 US-China trade war, policymakers responded to the economic shocks from imposed import tariffs with much more measured stimulus than in previous cycles (Chart 3). President Xi repetitively used the “Long March” analogy during the trade war, warning Chinese citizens to prepare for protracted hardship stemming from conflict with the US.1 The metaphor had important market implications because the attitude was fundamental to how the government handled the cyclical slowdown in 2018/19. Despite aggressive RRR and policy rate cuts in the second half of 2018, authorities maintained tight restrictions on bank lending and local government spending. Consequentially, aggregate credit growth continued to slide through end-2018 (Chart 4). Furthermore, authorities became uneasy about the sharp rise in the rate of credit expansion in Q1 2019. Following a public spat between the Premier Li Keqiang and the central bank, bank lending slowed sharply in the rest of the year. As a result, the improvement in infrastructure investment growth was small and short-lived. Despite an acceleration in local government bond issuance in 2H18 and Q1 2019, infrastructure investment growth remained on a structural downward trend throughout most of 2018 and 2019 (Chart 5). Chart 4China: A Deja Vu Of 2018-2019?
China: A Deja Vu Of 2018-2019?
China: A Deja Vu Of 2018-2019?
Chart 5Improvement In Infrastructure Investment Was Short-Lived In 2019
Improvement In Infrastructure Investment Was Short-Lived In 2019
Improvement In Infrastructure Investment Was Short-Lived In 2019
Chart 6Financial De-Risking Mode Is Still On
Financial De-Risking Mode Is Still On
Financial De-Risking Mode Is Still On
The current policy backdrop resembles the situation in 2H2018: while the central bank has kept interest rates at historically low levels and preemptively cut the RRR rate in July, lending standards remain tight and shadow bank credit continues to shrink (Chart 6). In the past Chinese authorities stimulated substantially following exogenous shocks, but did not stimulate much when business cycle was slowing in an orderly manner. A resurgence of domestic COVID cases and the severe flood in central China in July and August represent exogenous shocks and occured when the economy was losing steam. Hence, there are higher odds authorities will provide some support in response to these exogenous shocks. However, the recurring battle against COVID and lingering tensions with the US have likely prompted Chinese top leadership to extend their cross-cycle strategy. Officials may feel that a modest easing in both monetary and fiscal policies will be sufficient to offset the current economic weakness without overstimulating the economy. Bottom Line: A cross-cycle policy approach means not only responding early to small shocks with piecemeal stimulus to stabilize growth but also limiting the scope of stimulus and preparing for “protracted battles”. The response from Chinese leaders during the trade war with the US in 2018/19 may be a roadmap for policy direction in the next 12 months. Cyclical Implications From “Common Prosperity” President Xi Jinping laid out a plan for “common prosperity”, a guideline for the country’s national policy in the coming decades, at the August 18th Central Committee for Financial and Economic Affairs. Most of the plan’s objectives have 2035 deadlines and will be achieved gradually in multiple phases.2 However, in the next 12 months and leading to the 20th National Party Congress in the fall of 2022, we expect the authorities to accelerate some reform agendas that are consistent with the 14th Five-Year Plan (2021-2025). A key area that may gain momentum is increasing labor income and household consumption share in national output. Both labor compensation and household consumption as a share of GDP improved from 2011 to 2016, but the progress stalled in recent years and further deteriorated last year in the wake of the pandemic (Chart 7). Policy decision makers can reverse the falling share by either boosting income/consumption or lowering the share of capital formation in the national output, or a combination of both. Regulatory tightening in the property market has reduced investment growth in the sector, which accounts for 66% of the country’s total fixed-asset formation (Chart 8). We expect policy restrictions to continue curbing real estate investment in the rest of the year and into 2022, further shrinking the share of capital formation in the aggregate output.3 Chart 7China's Economic Rebalancing Progress Has Stalled In The Past Five Years
China's Economic Rebalancing Progress Has Stalled In The Past Five Years
China's Economic Rebalancing Progress Has Stalled In The Past Five Years
Chart 8Policymakers Are Moving Away From The 'Old Economy' Pillars
Policymakers Are Moving Away From The 'Old Economy' Pillars
Policymakers Are Moving Away From The 'Old Economy' Pillars
Chart 9Recovery In Household Income And Consumption Has Significantly Lagged Other Sectors
Recovery In Household Income And Consumption Has Significantly Lagged Other Sectors
Recovery In Household Income And Consumption Has Significantly Lagged Other Sectors
Recovery in household income and consumption has significantly lagged other sectors in China’s recent economic rebound (Chart 9). In addition to short-term, pandemic-related factors, household consumption has been sluggish due to China’s long-standing imbalanced income distribution. Given that China will be under more pressure to deliver economic progress in 2022, boosting wage growth and consumption will help to facilitate both the nation’s cross-cyclical economic strategy and President Xi’s longer-term reform plan for income and wealth redistribution. If successfully implemented, a rebalancing of labor income and consumption as a share of the national aggregate will have long-term economic benefits. However, for investors with a cyclical time frame, the transition will likely have the following implications on the market: Policymakers will keep a large fiscal budget deficit and increase spending in public services and social welfare, but there will be more pressure on the central government to keep local government debt in check. The increased fiscal burden also means that while the government will provide subsidies for households and key new-economy industries, policy at margin may move away from boosting investment in traditional infrastructure and construction (Chart 10). Chart 10Traditional Infrastructure Investment Will Remain Subdued
Traditional Infrastructure Investment Will Remain Subdued
Traditional Infrastructure Investment Will Remain Subdued
Empirical research shows that lower-income households have a higher marginal propensity to consume.4 Last year China refrained from meaningful stimulus to incentivize consumption. In contrast, the statement from the August 18th meeting indicated the focus is on securing living standards and wages among lower-income households. Common prosperity related policies may boost consumption of staples and some durable goods but will likely discourage splurging in high-end luxury goods and services. Large corporations and high-net-worth individuals will be expected to share social responsibility and the cost of reducing income inequality, either through higher and stricter tax burdens, raising minimum wages for employees, and/or donations. Bottom Line: The “common prosperity” theme will mostly entail long-term policy initiatives, but it may also have some cyclical market repercussions. Investment Recommendations Chart 11Tactical Bounce Gave Way To Cyclical Downturn In Previous Cycles
Tactical Bounce Gave Way To Cyclical Downturn In Previous Cycles
Tactical Bounce Gave Way To Cyclical Downturn In Previous Cycles
We do not rule out the possibility of a tactical (within the next three months) / technical rebound in Chinese stocks. Our August 4th report discussed how prices managed to rebound strongly within 90 days of the policy-triggered market riots in both 2015 and 2018. However, the rallies quickly faded and stocks fell to new lows (Chart 11). Prices bottomed when policy decisively turned reflationary. For now, the risks to Chinese equities are largely to the downside. Although there are some remedial measures to ease monetary and fiscal policies, officials have not sent a clear signal to ease on the regulatory front. Conversely, there are two scenarios that could prompt us to upgrade Chinese stocks to either neutral or overweight in both absolute and relative terms. Chart 12No Clear Signal Chinese Policymakers Will Ease On The Regulatory Front
No Clear Signal Chinese Policymakers Will Ease On The Regulatory Front
No Clear Signal Chinese Policymakers Will Ease On The Regulatory Front
The first scenario is that the economy does not slow further and a modest policy easing is sufficient to stabilize the economic outlook. This may happen if strong global economic growth and demand continue to support China’s export and manufacturing sectors, while domestic household consumption improves. In this case, the downside risks on the overall economy would abate, but the gradual underlying downtrend in China's old economy would be intact. We would need an additional reflationary tailwind, such as a boost from fiscal spending or a reversal of industry policy tightening, to upgrade Chinese stocks to overweight. We have argued in the past that housing appears to be the best candidate; the catalyst is missing at the moment (Chart 12). In the second scenario, Chinese policymakers may determine that the downside risks to growth are unacceptably large given existing slowdowns in the industrial and service sectors, and decide to temporarily reverse course on structural reforms. We will watch for indications of a shift in attitude. For now, we think that China’s leadership has a higher pain threshold than in the past, suggesting that this outcome is not yet probable. Jing Sima China Strategist jings@bcaresearch.com Footnotes 1"Xi Jinping calls for ‘new Long March’ in dramatic sign that China is preparing for protracted trade war", South China Morning Post. 2"Xi stresses promoting common prosperity amid high-quality development, forestalling major financial risks", Xinhua, English.news.cn 3We use fixed-asset investment (FAI) as a proxy for gross fixed capital formation (GFCF) because the National Bureau of Statistics of China does not publish the GFCF breakdown by sectors. GFCF comprises FAI, less the purchase of existing fixed assets, land and some minor items. Historically, the two series have closely tracked each other. 4"The Stimulative Effect of Redistribution", Federal Reserve Bank of San Francisco Market/Sector Recommendations Cyclical Investment Stance