Economic Growth
It is safe to say that the euro area is in a funk today: European real GDP growth dipped to a 1.1% annual rate in the fourth quarter of 2018, while industrial production has plunged by 3.9% on a year-on-year basis. But the markets warned us this would happen:…

Highlights Investors are currently too pessimistic on Europe’s growth prospects. In fact, European growth will soon bottom. European growth and inflation are also set to improve relative to the U.S. This should give investors an opportunity to reassess the long-term outlook for European Central Bank policy relative to the Fed. Global growth dynamics are also moving in an increasingly dollar-bearish direction, which should create a tailwind for the euro. Based on the pricing of European assets relative to the U.S., there is scope to see more capital flows into the euro area, implying that more euro buying is forthcoming. The entire European currency complex is a buy relative to the dollar; while the NOK, the SEK, and even the GBP could outperform the euro, the CHF will underperform. EUR/JPY also has upside. Feature The case to sell the euro is easy to make. European growth has been very poor: PMIs, industrial production and even German exports are all pointing to a contraction in output; and economic surprises are testing levels recorded during the euro area crisis. Most importantly, this economic retrenchment is particularly sharp when compared to the U.S., which suggests that real interest rate differentials should continue to hurt EUR/USD (Chart 1). Chart 1Selling The Euro Seems So Easy...
Selling The Euro Seems So Easy...
Selling The Euro Seems So Easy...
The problem with this narrative is that investors are already well aware of Europe’s woes. Could Europe instead recover and the euro rebound against the dollar? After all, in the past, when investor pessimism towards Europe experienced as pronounced a dip as the one just witnessed, EUR/USD invariably rebounded soon after (Chart 2). Chart 2...But Maybe We Should Look The Other Way
...But Maybe We Should Look The Other Way
...But Maybe We Should Look The Other Way
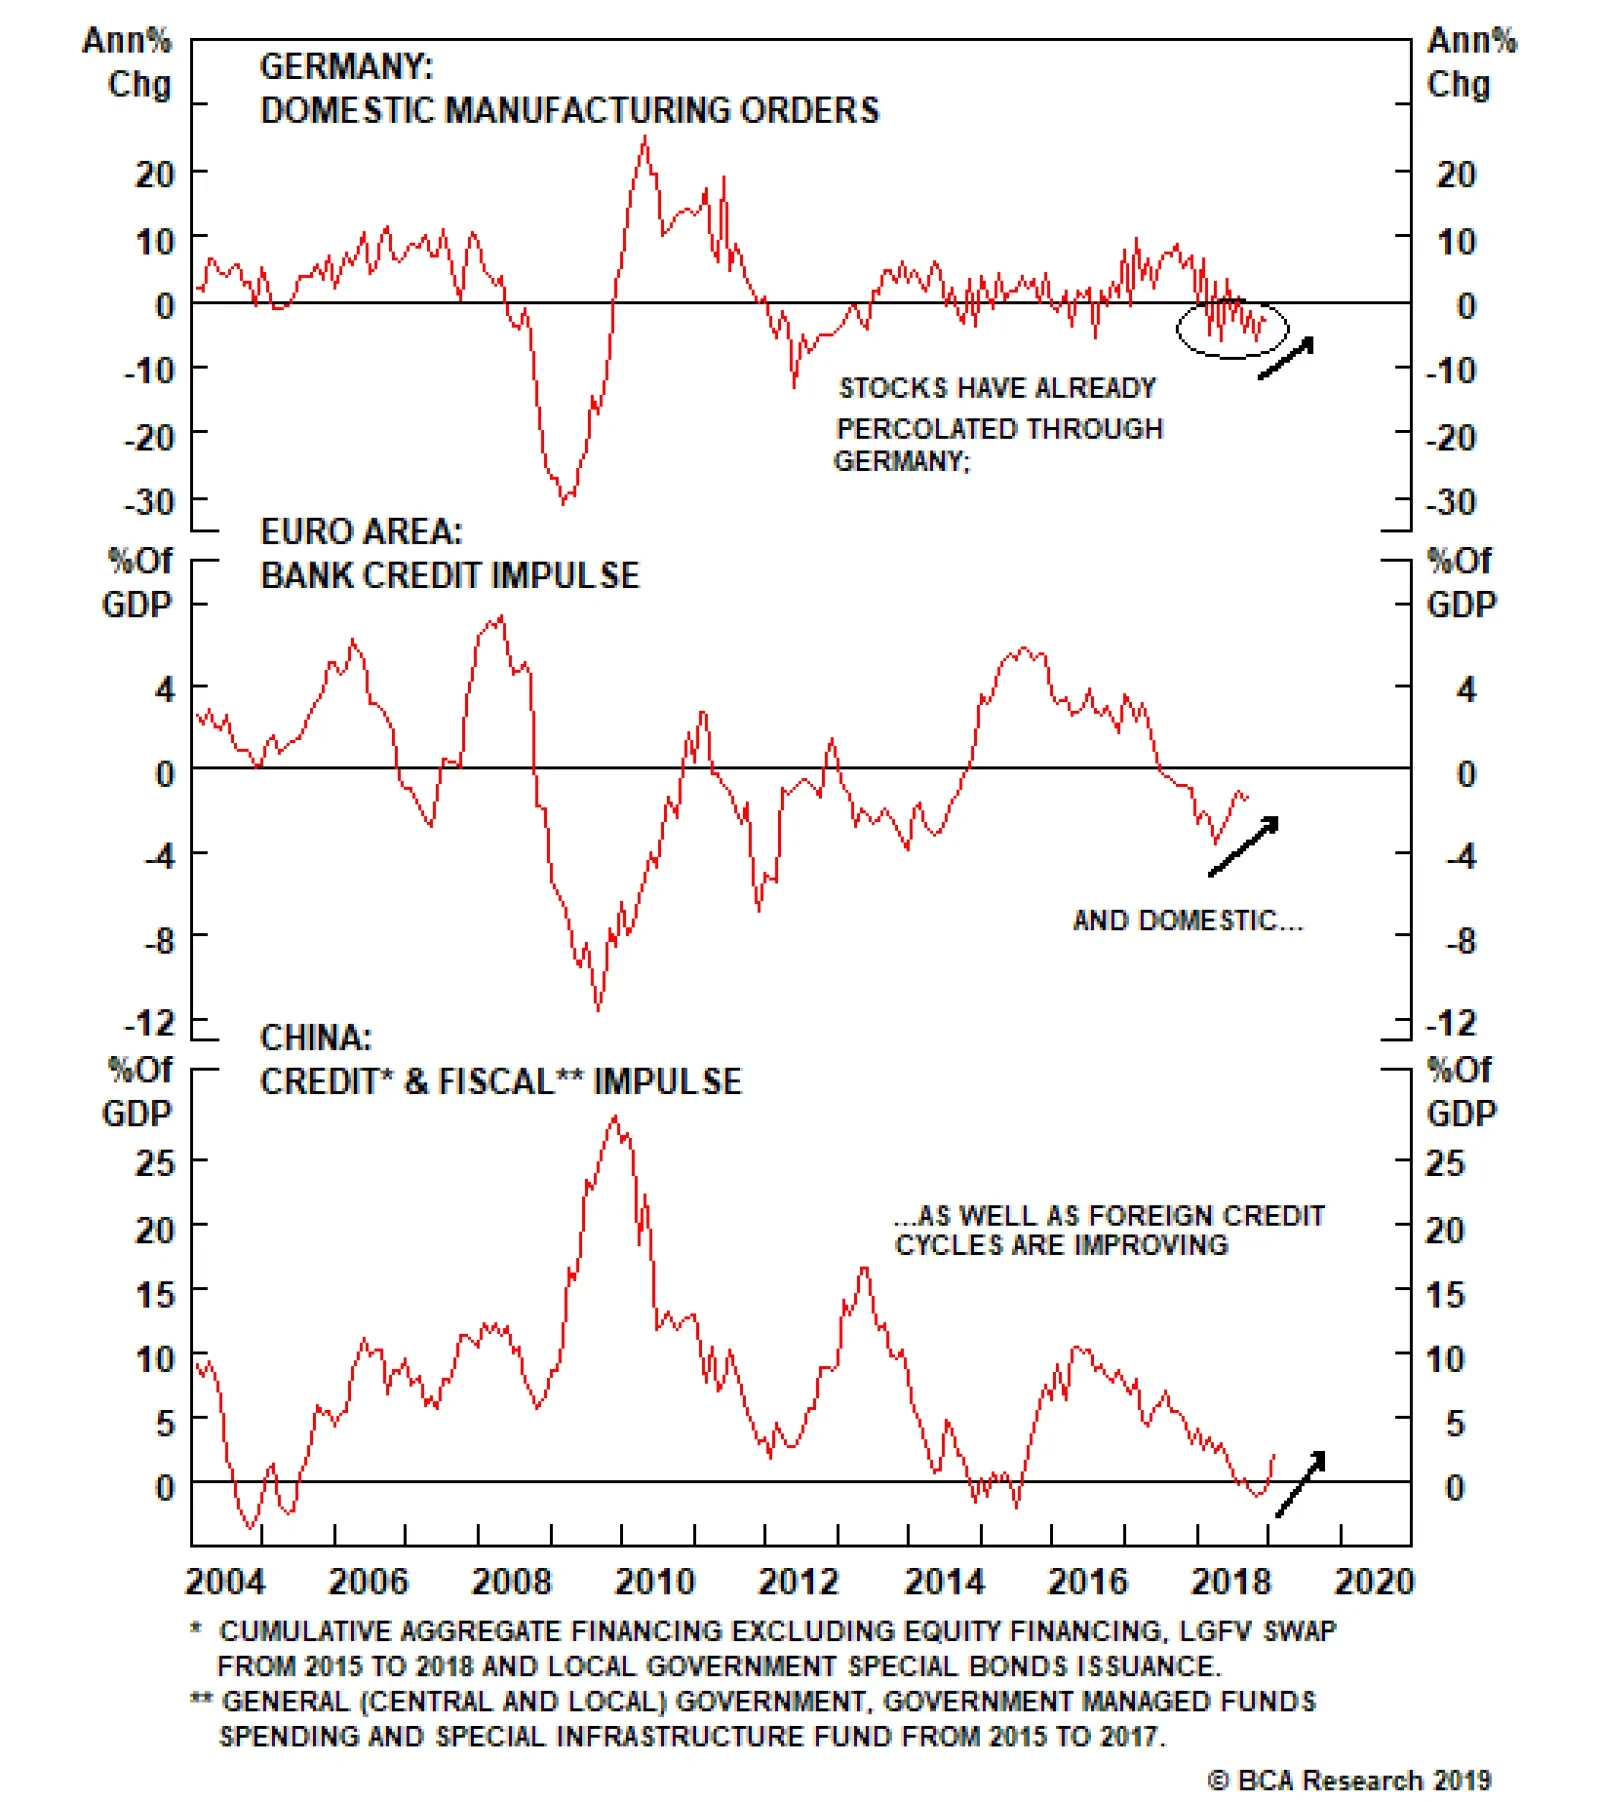
In this piece, we explore what could go right for the euro, and argue that the euro is indeed attractive at current levels. European Growth Has Hit A Nadir It is safe to say that the euro area is in a funk today: European real GDP growth dipped to a 1.1% annual rate in the fourth quarter of 2018, while industrial production has plunged by 3.9% on a year-on-year basis. But the markets warned us this would happen: The euro has fallen 9% from its February 2018 top, German bund yields are again flirting with the 0.1% level and European banks plunged by more than 40% between January and December last year. Going forward, for European yields to remain as depressed as they are, for the euro to fall again by a similar margin, or for domestic plays to suffer large declines, European growth will have to slow even further. We are not expecting such a scenario. Instead, we expect European growth to recover significantly this year. First, when it comes to Germany, the locomotive of Europe, the shock from the implementation of the new WLTP auto emission standards is passing: Automobile production is stabilizing, capex is accelerating and inventories have been pared down. Moreover, the slowdown in foreign demand has already percolated through the domestic economy, as domestic manufacturing orders are already experiencing one of their sharpest declines since the Great Financial Crisis (Chart 3, top panel). Chart 3European Growth Is Set To Rebound
European Growth Is Set To Rebound
European Growth Is Set To Rebound
Another source of optimism comes from the credit market. As the middle panel of Chart 3 illustrates, the European 12-month credit impulse has begun to bottom. This points to stronger euro area-wide domestic demand. Moreover, the Chinese credit and fiscal impulse is also bottoming, suggesting the drag from foreign demand could be dissipating (Chart 3, bottom panel). When looking at other specific trouble spots, Italy first springs to mind. In our view, the most recent deceleration in Italy was mainly a consequence of the tightening in financial conditions that resulted from the surge in Italian yields following the budget standoff between Rome and Brussels. However, the Lega Nord / Five Star Movement coalition has folded and is more or less acquiescing to the EU’s demands. Moreover, the rising probability that the European Central Bank will continue to provide long-term liquidity to the eurozone banking system via some form of new LTRO should diminish the funding risk to the Italian banking system, and thus, the risks to Rome’s fiscal sustainability. This implies that the decline in Italian borrowing costs could deepen (Chart 4), further easing Italian financial conditions and improving the growth outlook in the euro area’s third-largest economy. Chart 4Easing Financial Conditions In Italy
Easing Financial Conditions In Italy
Easing Financial Conditions In Italy
France, too, has had its fair share of problems, though it is interesting that its industrial sector is not suffering as much as Germany’s, as highlighted by a French manufacturing PMI above the 50 boom/bust line. Instead, the French service sector is the one contracting (Chart 5). This bifurcation is likely to be a byproduct of the gilets jaunes protests that have lasted since November 2018 and affected retail trade. However, the intensity of the protests is declining and the French population is getting used to this. As a result, we are seeing a rebound in French household confidence, which implies that consumption, the main engine of French growth, is likely to perk up. Chart 5Fade The Gilets Jaunes, Paris In Spring Is Beautiful
Fade The Gilets Jaunes, Paris In Spring Is Beautiful
Fade The Gilets Jaunes, Paris In Spring Is Beautiful
Finally, euro area fiscal policy is set to be loosened this year, with the fiscal thrust moving from 0.05% of GDP to 0.4% of GDP (Chart 6). The response of French President Emmanuel Macron to the gilets jaunes protests could even make the fiscal policy support slightly bigger this year. Chart 6Positive Fiscal Thrust In 2019
Positive Fiscal Thrust In 2019
Positive Fiscal Thrust In 2019
Ultimately, this combination of factors suggests that the large dip in European industrial production is likely to prove transitory, and that European activity will revert back toward the levels implied by the Belgian Business Confidence Index, which has historically been a good leading indicator of European growth (Chart 7). Chart 7European IP To Follow Brussels' Mood
European IP To Follow Brussels' Mood
European IP To Follow Brussels' Mood
Bottom Line: The deterioration in European growth has captured the imagination of investors. However, the performance of European assets last year forewarned that growth would decelerate meaningfully. What matters now is how growth will evolve. Developments from Germany, France, Italy, the credit channel and the fiscal front all suggest that European activity will perk up soon. It’s All Relative While getting a sense of European growth is important when making a call on EUR/USD, economic trends must also be considered relative to the U.S. Surprisingly, despite notorious European growth underperformance, rays of hope are emerging. A major structural negative for EUR/USD has abated: The European debt crisis is behind us, and the aggregate European banking sector has been getting healthier, albeit slowly. This means that the euro area credit growth is not declining anymore against that of the U.S. This is a very long-term force that dictates multi-year cycles in the EUR/USD. As Chart 8 shows, it will be difficult for EUR/USD to move below 1.10 so long as the broad trend in the relative credit growth does not weaken anew. Chart 8Credit Dynamics Suggest That The Worst Is Over For EUR/USD
Credit Dynamics Suggest That The Worst Is Over For EUR/USD
Credit Dynamics Suggest That The Worst Is Over For EUR/USD
More immediately, the euro area leading economic indicator relative to the U.S. is forming a bottom (Chart 9). Since the U.S. is not benefiting from as large a fiscal boost as in 2018, and financial as well as monetary conditions have tightened there relative to Europe, this suggests the improvement in the euro area relative LEI could continue this year. Chart 9Bottoming European LEI Versus U.S.
Bottoming European LEI Versus U.S.
Bottoming European LEI Versus U.S.
Relative labor market slack is also evolving in a euro-friendly fashion. From 2013 to 2018, the euro area suffered from greater labor market slack than the U.S., courtesy of a double-dip recession and generally more-moribund growth. However, thanks to a 4.2-percentage-point fall in the European unemployment rate since 2013 to 7.9%, the euro area unemployment gap has not only closed, it is also below that of the U.S. Historically, when the U.S. unemployment gap leapfrogs that of Europe, EUR/USD tends to appreciate (Chart 10). Chart 10Less Slack Leads To A Stronger EUR/USD
Less Slack Leads To A Stronger EUR/USD
Less Slack Leads To A Stronger EUR/USD
Relative slack does not only have value in itself, it also matters for relative inflation trends, which have been a crucial determinant of EUR/USD. As Chart 11 illustrates, EUR/USD tends to follow how euro area core CPI evolves relative to the U.S. After sharply falling last year, European relative core inflation is trying to rebound, which at a minimum suggests that EUR/USD has limited downside. Moreover, EUR/USD has correlated positively with German market-based inflation expectations (Chart 11, bottom panel). This suggests that actual relative inflation as well as euro area inflation expectations play a key role in determining perceptions among investors of how ECB policy will evolve relative to the Federal Reserve. Chart 11EUR/USD Trades Off Of Inflation Dynamics
EUR/USD Trades Off Of Inflation Dynamics
EUR/USD Trades Off Of Inflation Dynamics
The recent euro decline has matched the decline in inflation expectations. However, inflation expectations have been much weaker than implied by the level of wage growth in Europe (Chart 12). This suggests that European inflation breakevens have scope to improve, a positive for the euro. Moreover, European wage growth is not only picking up steam in isolation, it is also rising relative to the U.S., which highlights that European inflation should not just stabilize vis-à-vis the U.S., but also accelerate. Chart 12European Wages Point To Rising Inflation Expectations
European Wages Point To Rising Inflation Expectations
European Wages Point To Rising Inflation Expectations
This case is made even more saliently by looking at relative financial conditions. Due to the tightening in U.S. financial conditions compared to the euro area, European headline and core inflation is set to accelerate relative to the U.S. (Chart 13). Again, this reinforces the case that maybe the euro has upside this year. Chart 13Relative Euro Area Inflation Will Rise Thanks To Easier FCI
Relative Euro Area Inflation Will Rise Thanks To Easier FCI
Relative Euro Area Inflation Will Rise Thanks To Easier FCI
Ultimately, for the euro to rise, investors will have to begin pricing in some switch in policy spreads between the ECB and the Fed. In the past, we showed that short-term policy expectations are important, but long-term ones can be even more relevant, especially when a central bank is well along the path of lifting rates, as the Fed is, while the other remains at maximum accommodation, like the ECB is today.1 Currently, investors expect euro area short rates to be only 0.5% 5-years from now (Chart 14, top panel). The spread between the eurozone and U.S. 5-year forward 1-month OIS rates remains near all-time lows, which explains the weakness in the euro. Now that European policy is much more accommodative than the U.S.’s, there’s scope for investors to upgrade the path of long-term euro area rates relative to the U.S. This would be bullish for the euro (Chart 14, bottom panel). Recovering relative credit flows and improving relative slack and inflation dynamics could catalyze this change. Chart 14The ECB Is Never Raising Rates
The ECB Is Never Raising Rates
The ECB Is Never Raising Rates
Bottom Line: To make the euro an attractive buy, European growth and inflation conditions cannot just increase, they need to improve relative to the U.S. Since long-term interest rate expectations are very depressed in Europe relative to the U.S., a small improvement in the relative growth profile could be enough to catalyze a repricing of the ECB vis-à-vis the Fed, creating a powerful tailwind behind the euro. Nothing Happens In A Vacuum Ultimately, exchange rates, like other prices in the economy, do not only respond to domestic determinants but are also influenced by much larger, global forces. This is because those global trends percolate through domestic economies, resulting in changing relative expected returns that drive money across borders, leading to currency movements. In the case of the euro, global growth matters a lot, because European growth is much more sensitive to global economic fluctuations than U.S. growth is. This is particularly true if shocks emanate from emerging markets (Chart 15). Today, global cyclical variables are increasingly pointing toward an end to the global growth slowdown. A stabilization and reacceleration in global activity would support the euro.
Chart 15
First, Chinese monetary conditions have begun to ease, which historically tends to be linked with improvements in European growth relative to the U.S. (Chart 16). Questions remain surrounding this point: How durable will the rebound in Chinese credit be? By how much will Chinese policymakers nurture this bounce? And will this jump be large enough to lift economic activity in the Middle Kingdom? Nonetheless, a reflationary wind from China has begun to blow, and since investors have already discounted much bad news out of Europe, only small improvements could turn the euro around. Chart 16If China Is Really Stimulating, Europe Will Rip A Greater Dividend
If China Is Really Stimulating, Europe Will Rip A Greater Dividend
If China Is Really Stimulating, Europe Will Rip A Greater Dividend
Second, as Chart 17 shows, our Nowcast for global industrial activity has decisively stepped down. Yet, the countercyclical dollar has been flat since October 2018. Historically, the performance of EM carry trades funded in yen tends to lead global growth. Currently the performance of these strategies is stabilizing. If EM carry trades funded in yen can rally further, this will spell trouble for the greenback, helping the euro – the anti-dollar – in the process. Chart 17An Early Positive For Global Growth
An Early Positive For Global Growth
An Early Positive For Global Growth
Third, EUR/USD tends to correlate with the relative performance of global cyclical equities (Chart 18). The stabilization in these sectors since 2015 suggests it will be difficult for the euro to fall further from current levels. In fact, if EM carry trades can rebound more, cyclicals have additional scope to outperform, and the euro could rally. Chart 18Cyclical Stocks Pointing To No Real Downside In EUR/USD
Cyclical Stocks Pointing To No Real Downside In EUR/USD
Cyclical Stocks Pointing To No Real Downside In EUR/USD
Fourth, the prospects for the semiconductor sector are improving. Demand for semis is highly pro-cyclical, and the U.S. Chip Stock Timing Model developed by our U.S. Equity Strategy service colleagues is currently sending a bullish signal.2 Since such developments link to improving global growth prospects, they are also associated with a stronger EUR/USD (Chart 19). This is also consistent with a generally weaker dollar and stronger Asian currencies. Chart 19The Outlook For Semiconductors Point Toward A Stronger Euro And A Weaker Dollar
The Outlook For Semiconductors Point Toward A Stronger Euro And A Weaker Dollar
The Outlook For Semiconductors Point Toward A Stronger Euro And A Weaker Dollar
Finally, the breakout in copper prices, the stabilization in the CRB Raw Industrials Index and the rally in gold prices all support an improving global growth outlook that could lift EUR/USD. Bottom Line: Various indicators, such as Chinese monetary conditions, EM carry trades, semiconductor demand determinants and commodity prices are suggesting that global growth may soon bottom. Such a development should hurt the countercyclical dollar, amounting to a macro tailwind for EUR/USD. The Bad News Is Priced In Ultimately, the capacity of EUR/USD to rally rests on how much investors upgrade their outlook for Europe. It is therefore crucial to get a sense of exactly how uninspiring Europe currently is to global market participants. There is no better gauge of relative economic pessimism than the price of euro area financial assets relative to U.S. ones. Essentially, money talks. On this front, markets already seem to have internalized the known bad news from Europe, and there is scope for a contrarian rally in the euro, especially if, as we expect, European economic activity improves. First, on a 12-month forward P/E ratio basis, euro area equities are trading at the kind of deep discount to U.S. stocks normally symptomatic of a trough in relative sentiment toward Europe. Such a discount is often followed by a rally in EUR/USD (Chart 20). Chart 20Stock Valuations: Investors Do Not Like Europe
Stock Valuations: Investors Do Not Like Europe
Stock Valuations: Investors Do Not Like Europe
Second, retailers’ equities can often give a more focused assessment of how investors perceive the comparative outlook for domestic demand between two nations. Currently, euro area retailers trade at a 16-year low versus their U.S. counterparts (Chart 21). Investors are therefore much more ebullient about the prospects for U.S. domestic demand than in Europe. Interestingly, the euro’s gyrations since 2016 have tracked the direction of the relative performance of retailers but have diverged in terms of levels. This suggests some underlying support for the currency. Chart 21Can European Domestic Demand Really Validate Such Pessimistic Expectations?
Can European Domestic Demand Really Validate Such Pessimistic Expectations?
Can European Domestic Demand Really Validate Such Pessimistic Expectations?
Third, the relative stock-to-bond ratio also often provides a good read on investors’ comparative economic euphoria/pessimism towards two nations. In 2018, the annual performance of the euro area stock-to-bond ratio relative to the U.S. collapsed to levels not recorded since the euro area crisis was at its apex (Chart 22). This further confirms that investors were massively depressed on European growth prospects relative to the U.S. While this indicator is rebounding, it is still in negative territory, implying that market participants still have room to upgrade their assessment of the euro area relative to the U.S. Historically, this kind of setup has been associated with a rebound in the EUR/USD. Chart 22The Stock-To-Bond Ratio Points To Some Upside Potential
The Stock-To-Bond Ratio Points To Some Upside Potential
The Stock-To-Bond Ratio Points To Some Upside Potential
Fourth, European net earnings revisions relative to the U.S. have also hit bombed-out levels and are in the process of improving. Since earnings are tightly linked to global growth and reflect the same information that informs capital flows into a country (Chart 23), sell-side analysts becoming more positive on Europe at the margin could indicate that investors are in the process of re-assessing whether to buy European assets. A decision to do so would support EUR/USD. Chart 23When The Sell-Side Move From Deeply To Mildly Bearish, EUR/USD Rallies
When The Sell-Side Move From Deeply To Mildly Bearish, EUR/USD Rallies
When The Sell-Side Move From Deeply To Mildly Bearish, EUR/USD Rallies
Bottom Line: Financial market pricing suggests that investors are displaying deep pessimism toward the euro area’s relative growth prospects. The euro could be a contrarian buy. Most importantly, there are early signs that this growth pricing is starting to move in favor of Europe. If our economic view on Europe and global growth is correct, this trend has further to go, implying that more capital could move into Europe, creating a potent tailwind for EUR/USD. What Else? Three additional factors need to be considered: Currency valuations, balance-of-payment dynamics, and technicals. First, while it is not as cheap as it once was, the real trade-weighted euro is still trading below its historical average (Chart 24). Purchasing-power considerations can rarely be used as a timing tool, but our confidence in the euro’s upside would be greatly dented if the euro were a very expensive currency. It is not even mildly pricey. Chart 24Euro Valuations: No Headwinds There
Euro Valuations: No Headwinds There
Euro Valuations: No Headwinds There
Second, balance-of-payment considerations have become increasingly euro-positive. The euro area runs a current account surplus of 3.3% of GDP, and despite large FDI outflows – a natural consequence of being a savings-rich economy – the basic balance of payments remains in surplus. Moreover, as fixed-income outflows have been dissipating, the aggregate portfolio flows into Europe have also been improving (Chart 25). The end of the ECB’s Asset Purchase Program should solidify this trend. Chart 25The Euro Area Balance Of Payments Is Increasingly Favorable
The Euro Area Balance Of Payments Is Increasingly Favorable
The Euro Area Balance Of Payments Is Increasingly Favorable
Finally, technical oscillators are behaving increasingly well. As Chart 26 shows, not only does our Intermediate-Term Indicator remains oversold, but also, it is has begun to form a positive divergence with the price of EUR/USD. If the economic outlook is becoming more bullish, such a technical setup can often be translated into significant gains. Chart 26EUR/USD: Oversold And A Positive Divergence Is Forming
EUR/USD: Oversold And A Positive Divergence Is Forming
EUR/USD: Oversold And A Positive Divergence Is Forming
Bottom Line: The euro’s valuation is not as attractive as it once was, but it remains cheap. Moreover, the euro area’s balance-of-payment dynamics and the EUR/USD’s technical setup both suggest the timing is increasingly ripe to buy the euro against the dollar. Investment Conclusions A trough in European growth, improving growth and inflation prospects relative to the U.S., green shoots for global growth and deep pessimism toward Europe relative to the U.S. all argue that the timing is right to bet on a euro rebound. At this point, the durability of the euro rebound remains unclear. Investors are under-appreciating the ability of the Fed to raise rates this year, which could help the dollar. On the other hand, they seem even more sanguine toward the ECB ever lifting rates. Ultimately, the capacity of the euro to rebound on a long-term basis against the dollar will be constrained by global growth. This means that China will continue to play a center-stage role for this crucial FX pair. At this point, it is unclear how determined Chinese policymakers are to reflate their economy. Thus, we recommend investors monitor Chinese policy to gauge how long to stay in the euro. For the time being, enough pieces are falling into place to warrant buying EUR/USD for three to six months. However, if the Chinese credit impulse can continue on its recent rebound, the durability of a euro rally could be extended, implying that the euro may be in the process of forming a long-term bottom against the dollar. A strengthening euro should support the entire European currency complex against the dollar. In fact, the NOK, the SEK and the GBP may even outperform the EUR. The NOK is being boosted by rising oil prices, a more hawkish central bank, better valuations and an even healthier balance of payments. The SEK is also supported by a Riksbank that is slightly more hawkish than the ECB, and better valuations; it also benefits from a Swedish economy that is even more pro-cyclical than the euro area’s. The GBP also benefits from a greater valuation discount than the euro, and political developments in the U.K. are beginning to move toward a more clear-cut positive outcome on the Brexit front.3 The countercyclical and expensive CHF will prove the European laggard. Finally, EUR/JPY is also set to continue its rebound that began on January 4th. In fact, it may be one of the best vehicles to express a euro-bullish view because it is less sensitive to what the Fed does than EUR/USD is. Rising bond yields are an unmitigated positive for EUR/JPY, and BCA firmly believes that U.S. Treasury yields have upside, whether or not the Fed goes back to lifting rates. The Fed will mostly impact whether it is the real or inflation component that lifts Treasury yields. Bottom Line: The entire European currency complex is set to rise along with the euro against the greenback. In fact, the NOK, the SEK and the GBP are likely to outperform the euro, while the CHF should underperform. EUR/JPY may in fact offer the best risk-adjusted returns to play a euro rebound. While it is clear that at this moment that buying the euro makes sense, the principal risk lies around how long this rally will last. We are increasingly convinced that the euro has made a low for the cycle and that its long-term outlook is looking increasingly bright. Mathieu Savary, Vice President Foreign Exchange Strategy mathieu@bcaresearch.com Footnotes 1 Please see the EUR/USD: Focus On The Western Shores Of The Atlantic section of the Foreign Exchange Strategy Weekly Report, titled “Canaries In The Coal Mine Alert: EM/JPY Carry Trades”, dated December 1, 2017, available at fes.bcaresearch.com 2 Please see U.S. Equity Strategy Weekly Report, titled “Reflationary Or Recessionary”, dated February 25, 2019, available at uses.bcaresearch.com 3 Please see European Investment Strategy Weekly Report, titled “Why A Catastrophic No-Deal Might Be Good… For The EU”, dated February 28, 2019, available at eis.bcaresearch.com Trades & Forecasts Forecast Summary Core Portfolio Tactical Trades Closed Trades
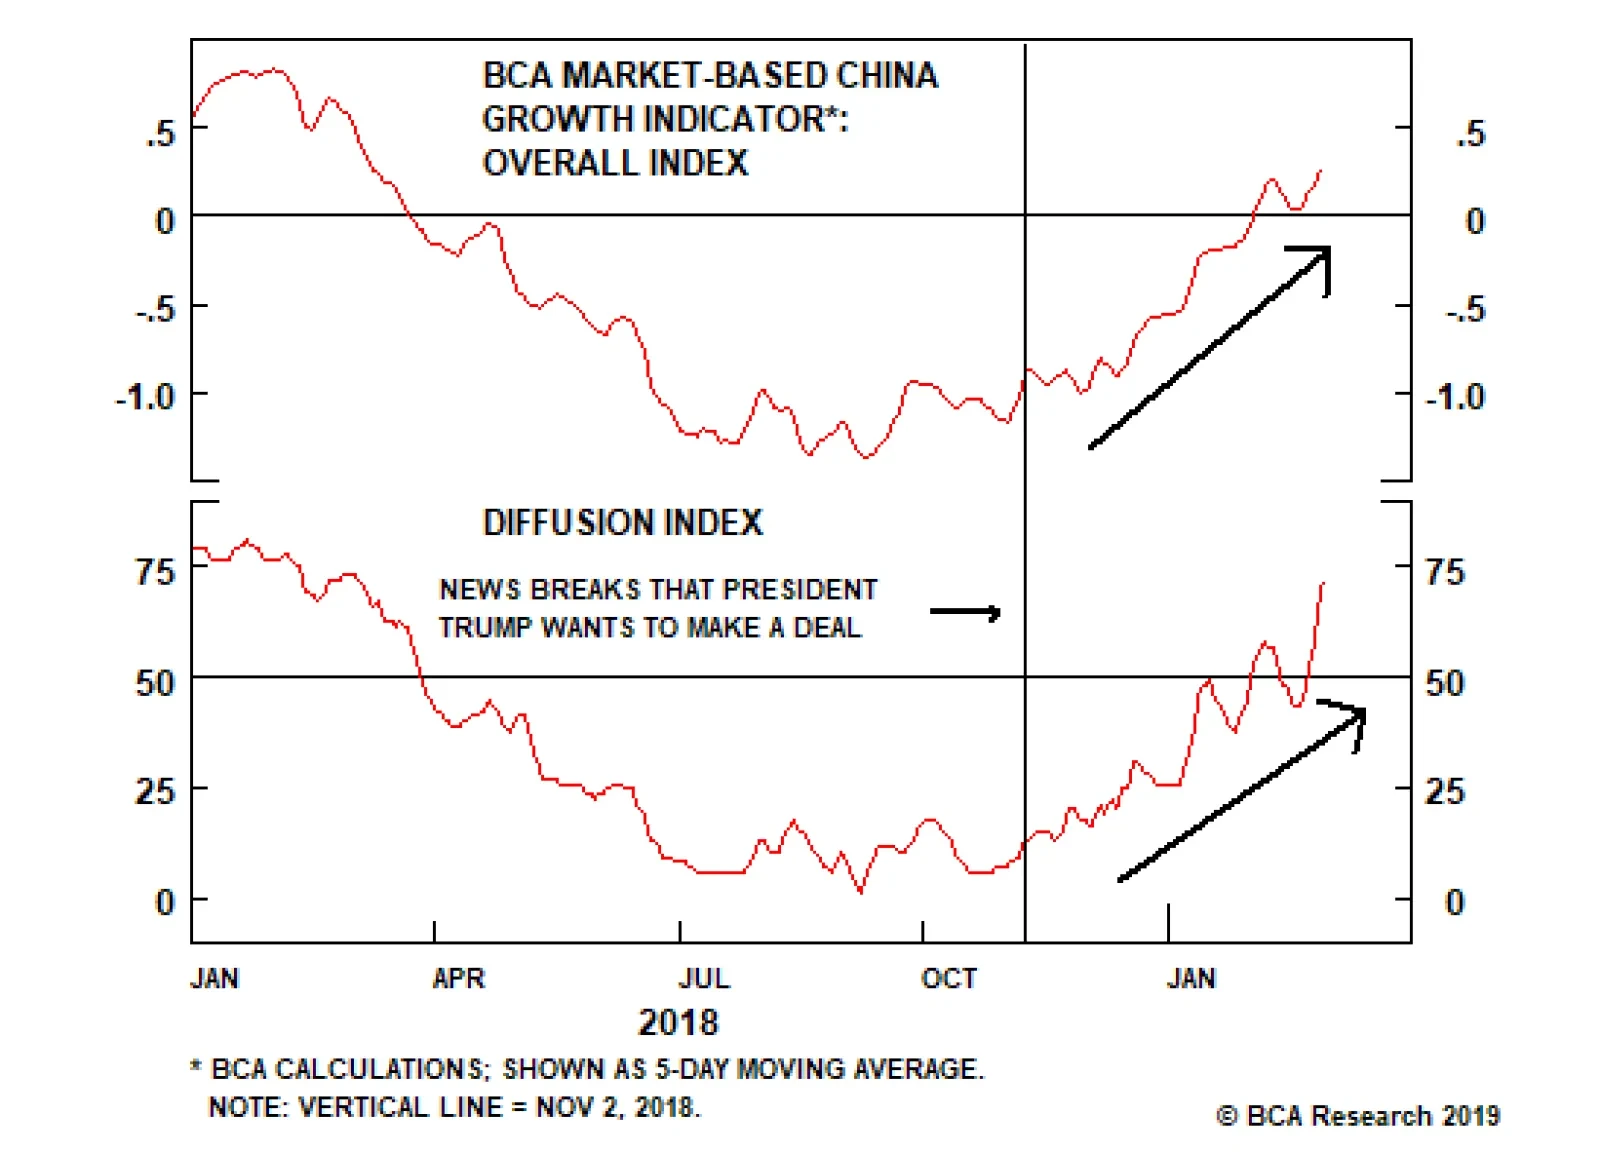
The chart above provides confirmation that trade talks have been the primary driver behind the rally in China-related assets. Both the BCA Market-Based China Growth Indicator and the diffusion index of its 17 components began to improve when the prospect of a…
Highlights Fed: With financial conditions easing and core inflation more likely to rise than fall, the majority of Fed officials will feel justified lifting rates again in the second half of this year. The best way to position for the resumption of rate hikes is to sell the 5-year or 7-year part of the Treasury curve and buy a duration-matched barbell consisting of the short and long ends of the curve. These sorts of positions currently offer positive carry, meaning you get paid as you wait for the market to price rate hikes back in. Corporate Spreads: Maintain an overweight allocation to corporate bonds (both investment grade and high-yield) with the exception of the Aaa credit tier. But be prepared to reduce exposure when spreads reach our target levels. Economy: Tracking estimates for 2018 Q4 and 2019 Q1 real GDP have fallen significantly during the past two weeks. The decline in tracking estimates is heavily influenced by an abnormal December retail sales report. That impact will reverse in 2019. Feature The Federal Reserve’s “on hold” strategy is now well known and has been completely discounted in the market. In fact, the overnight index swap curve is priced for 9 bps of rate cuts during the next 12 months and 21 bps of cuts during the next 24 months (Chart 1). Chart 1Primary Dealers Still Looking For Hikes
Primary Dealers Still Looking For Hikes
Primary Dealers Still Looking For Hikes
At this point, the only thing that’s unclear is how the Fed will respond to the economic data going forward. Will it be eager to re-start rate hikes at the first sign of calm? Or perhaps the Fed is leaning toward a strategy where the next move will be a rate cut in the face of flagging economic growth? Survey Says Unfortunately, last month’s FOMC meeting was not accompanied by an updated Summary of Economic Projections. We therefore don’t know how policymakers have revised their rate hike expectations since December. However, the New York Fed’s Survey of Primary Dealers was updated in January, and it shows that the median primary dealer still expects two rate hikes this year. The only change between the December and January surveys is that the median primary dealer now expects one of the 2019 rate hikes in June and the other in December. In the December survey, both 2019 rate hikes were anticipated before the end of June (Chart 1). Typically, the median primary dealer and the median FOMC participant have very similar views on the future interest rate trajectory. Counting The Minutes The next stop on our search for clarity is the minutes from the January FOMC meeting, which were released last week. The January minutes provide a lot of insight into the thought processes of different FOMC participants. Unfortunately, they also reveal a serious lack of cohesion amongst the group. All in all, the document might confuse more than it clarifies. A few key excerpts from the document drive this point home. Referring to “global economic and financial developments”: Many participants observed that if uncertainty abated, the Committee would need to reassess the characterization of monetary policy as “patient” and might then use different language. This suggests that many Fed participants view the pause in rate hikes as a result of slower non-U.S. growth and tighter financial conditions. They also suggest that if global growth improves and financial conditions ease it would be appropriate to abandon a “patient” stance. … several […] participants argued that rate increases might prove necessary only if inflation outcomes were higher than in their baseline outlook. This second statement is much more dovish than the first. It suggests that several participants think that even improving global growth and an easing of financial conditions would not be sufficient to re-start rate hikes. They would also need to see inflation come in stronger than expected. Several other participants indicated that, if the economy evolved as they expected, they would view it as appropriate to raise the target range for the federal funds rate later this year. Finally, this last statement reveals that several other participants disagree with the view that an unexpected rise in inflation is a pre-condition for further rate hikes. What can we make of all this mess? The first thing that seems clear is that all Fed members view easier financial conditions as a pre-condition for further rate hikes. In this regard, we are already well on our way. Financial conditions have eased considerably since the start of the year, with the stock-to-bond total return ratio up sharply and credit spreads, the VIX and the dollar all off their highs (Chart 2). Chart 2Financial Conditions Are Easing
Financial Conditions Are Easing
Financial Conditions Are Easing
Second, all FOMC participants need more confidence that inflation will return to target before re-starting rate hikes, but this bar seems higher for some than for others. Year-over-year core and trimmed mean CPI are currently running at 2.15% and 2.19%, respectively. This is slightly below the 2.4% level that is consistent with the Fed’s inflation target (Chart 3).1 The minutes suggest that some FOMC participants would be comfortable re-starting rate hikes as long as core inflation moves higher in the next few months and approaches the Fed’s target from below. Some others, however, may need to see an overshoot of the Fed’s inflation target before recommending rate hikes. Chart 3Core Inflation Needs To Move Higher
Core Inflation Needs To Move Higher
Core Inflation Needs To Move Higher
Depressed inflation expectations, as seen in the TIPS market or the Michigan Consumer Sentiment survey, are a related issue (Chart 3, bottom 2 panels). The Fed will probably want to see upward movement in both of these measures before resuming rate hikes. In fact, New York Fed President John Williams warned last week that the “persistent undershoot of the Fed’s [inflation] target risks undermining the 2 percent inflation anchor.” He added that “the risk of the inflation expectations anchor slipping toward shore calls for a reassessment of the dominant inflation targeting framework.”2 Williams has long been an advocate for a monetary policy framework where the Fed targets an overshoot of its inflation target in the future to “make up” for undershooting its target in the past, i.e. some form of price level targeting. The Fed is currently conducting a year-long investigation into whether it should switch to this sort of regime and we learned last week that the Fed will announce the results of its investigation in the first half of 2020. Our own sense is that the Fed will eventually adopt some sort of “history dependent” inflation target as a way to avoid continuously bumping up against the zero-lower bound on interest rates. But this change will not occur this year and maybe not even next year. Of course, the more immediate concern for bond investors is whether inflation pressures will be meaningful enough in the next few months for the Fed to resume rate hikes in 2019. We expect they will be. We have previously shown that base effects alone will pressure year-over-year core CPI higher as we head toward mid-year.3 Meanwhile, other signs also point toward rising core inflation (Chart 4): Chart 4Inflation Pressures Building
Inflation Pressures Building
Inflation Pressures Building
The New York Fed’s Underlying Inflation Gauge is running close to 3% (Chart 4, top panel). The ISM Manufacturing PMI is off its highs, but is still consistent with rising year-over-year core CPI (Chart 4, panel 2). Our CPI Diffusion Index is deep in positive territory, pointing to further near-term upside in the core measure (Chart 4, bottom panel). Bottom Line: With financial conditions easing and core inflation more likely to rise than fall, the majority of Fed officials will feel justified lifting rates again this year. January’s FOMC minutes imply that several Fed members want to see an overshoot of the inflation target before advocating for the resumption of rate hikes, but until the Fed changes its inflation targeting regime they will likely be out-voted. The Best Way To Trade The Fed We continue to recommend a below-benchmark duration bias in U.S. bond portfolios, on the view that rate hikes will exceed depressed market expectations on a 12-month horizon. However, this is not the most attractive way to position for the resumption of Fed rate hikes. The best way to trade the Fed in the current environment is by initiating a duration-neutral yield curve trade where you buy a barbell consisting of the long and short ends of the curve, and sell the 5-year or 7-year maturity. In a prior report we demonstrated that the 5-year and 7-year Treasury yields are most sensitive to changes in our 12-month fed funds discounter.4 That is, when the market starts to price-in more Fed rate hikes, the 5-year and 7-year Treasury yields increase more than other maturities. Similarly, the 5-year and 7-year yields fall the most when our discounter declines. Clearly, this means that if you are short the 5-year/7-year part of the curve versus the wings, you will make money as rate hikes are priced back into the market. Usually the problem with implementing such a trade is that it has negative carry. That is, the 5-year or 7-year bullet typically offers a greater yield than what you would earn on a duration-matched 2/10 or 2/30 barbell. If you don’t time the trade properly, you end up losing money waiting for Fed rate hike expectations to move. However, this is not a problem at the moment. In fact, duration-matched barbells are now positive carry propositions relative to 5-year and 7-year bullets (Chart 5). Chart 5 Barbell Yields Greater Than Bullet Yields
Barbell Yields Greater Than Bullet Yields
Barbell Yields Greater Than Bullet Yields
In other words, if you think rate hikes will resume at some point, you are currently getting paid to wait for the market to catch on. The only way to lose money in this sort of trade is if our 12-month fed funds discounter falls further from its current -9 bps level. We view that as an unlikely scenario. Bottom Line: The best way to position for the resumption of Fed rate hikes is to sell the 5-year or 7-year part of the Treasury curve, and buy a barbell consisting of the long and short ends of the curve. We currently recommend being short the 7-year and long the 2/30 barbell. This trade has positive carry, meaning that you will earn money as you wait for rate hikes to get priced back in. Corporate Spread Targets As we have discussed in prior reports, we think the Fed’s pause opens up a window where corporate bond spreads have room to tighten during the next few months.5 However, we also acknowledge that the window for outperformance is limited. Once financial conditions ease and the Fed resumes rate hikes, the environment will quickly become more difficult for corporate bonds. For this reason, in last week’s report we presented Chart 6. The diamonds in Chart 6 show where corporate 12-month breakeven spreads are today relative to past “Phase 2” periods, which are environments similar to today when the yield curve is quite flat but still positively sloped.6 We argued that we would be quick to reduce corporate bond exposure when the breakeven spreads reach the historical median for Phase 2 periods, i.e. when the diamonds fall to the 50% line in Chart 6.
Chart 6
However, we acknowledge that this is not a helpful guide for investors who don’t have timely access to our valuation metrics. So this week we present Charts 7A and 7B. These charts estimate the option-adjusted spread (OAS) levels for each credit tier of the Bloomberg Barclays corporate bond indexes that would be consistent with the 50% line in Chart 6. To make these estimates we need to assume that the average duration of each index remains constant. The results show the following spread targets: For Aa we target 55 bps. The current OAS is 61 bps. For A we target 84 bps. The current OAS is 94 bps. For Baa we target 128 bps. The current OAS is 161 bps. For Ba we target 186 bps. The current OAS is 236 bps. For B we target 298 bps. The current OAS is 391 bps. For Caa we target 571 bps. The current OAS is 813 bps. We do not recommend an overweight allocation to Aaa-rated corporate bonds, where spreads are already expensive relative to past Phase 2 periods (Chart 7A, top panel). Chart 7aInvestment Grade Spread Targets
Investment Grade Spread Targets
Investment Grade Spread Targets
Chart 7BHigh-Yield Spread Targets
High-Yield Spread Targets
High-Yield Spread Targets
Bottom Line: Maintain an overweight allocation to corporate bonds (both investment grade and high-yield) with the exception of the Aaa credit tier. But be prepared to reduce exposure when spreads reach our target levels. Economic Update We will finally receive GDP data for the fourth quarter of 2018 on Thursday, and investors should ready themselves for a weak number. In fact, the most recent tracking estimates from the New York Fed have real GDP coming in at 2.35% in Q4 and a mere 1.20% in 2019 Q1 (Chart 8). Chart 8Poor GDP Tracking Estimates ...
Poor GDP Tracking Estimates ...
Poor GDP Tracking Estimates ...
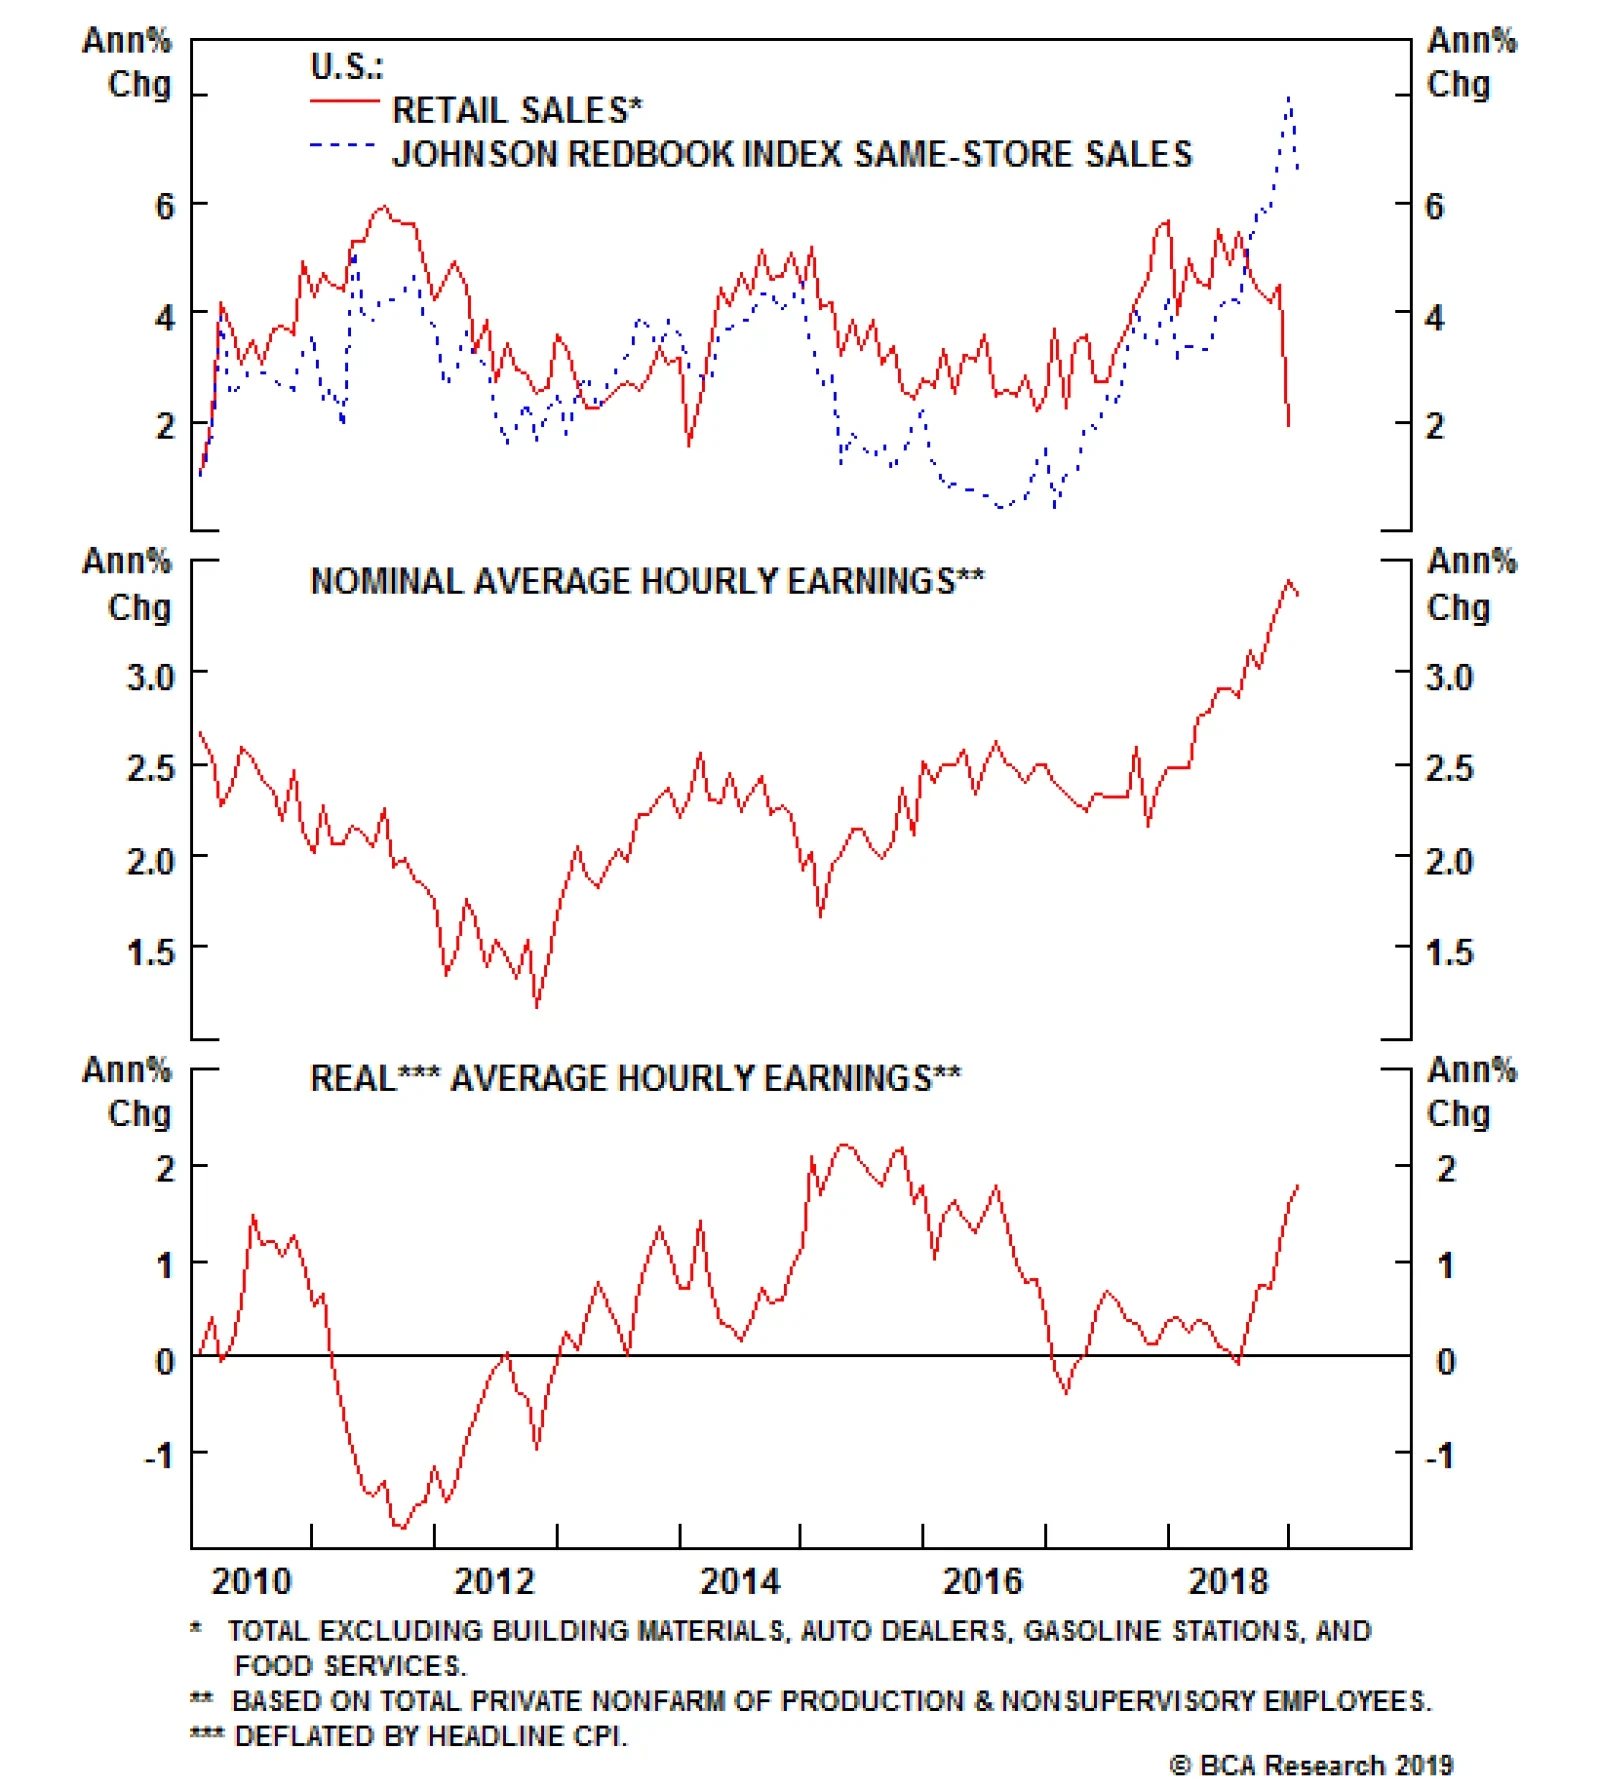
It will come as no surprise that the trend in GDP growth is vital to our interest rate call. In fact, we showed in a recent report that when year-over-year nominal GDP growth falls below the 10-year Treasury yield it is often a good signal that monetary policy has turned restrictive and that interest rates have peaked for the cycle.7 With that in mind, if we add 1.2% expected real growth in Q1 to the 1.7% average growth rate of the GDP deflator (Chart 8, bottom panel), we can roughly estimate nominal GDP growth of 2.9% in Q1. This remains above the current 10-year Treasury yield, suggesting that monetary conditions would still be accommodative, but just barely. However, we expect the Q1 tracking forecast to improve as new data come in. According to the New York Fed’s model, the weak December retail sales report trimmed 0.41% from its Q1 growth forecast and this report increasingly looks like an aberration. In contrast to the retail sales number, the Johnson Redbook index of same-store sales is growing at a rate close to 5%, and indexes of consumer confidence remain elevated (Chart 9). Chart 9...Driven By Abnormal Retail Sales
...Driven By Abnormal Retail Sales
...Driven By Abnormal Retail Sales
Even the Fed staff’s economic report, as presented in the January FOMC minutes, suggests that December should have been a good month for consumer spending: The release of the retail sales report for December was delayed, but available indicators – such as credit card and debit card transaction data and light motor vehicle sales – suggested that household spending growth remained strong in December. Bottom Line: However, we expect the Q1 tracking forecast to improve as new data come in. According to the New York it seems likely that the partial government shutdown influenced the collection of the December retail sales data and led to an abnormal print. Since the retail sales data feed directly into GDP, the impact will be felt in the next GDP report. But the impact will prove fleeting. Ryan Swift, Vice President U.S. Bond Strategy rswift@bcaresearch.com Footnotes 1 The Fed’s target is for 2% PCE inflation. CPI tends to run about 0.4% above PCE. 12-month core PCE is currently 1.88%, but data only go to November. This is why we refer to CPI in this report, which has data through January. 2 https://www.newyorkfed.org/newsevents/speeches/2019/wil190222 3 Please see U.S. Bond Strategy Weekly Report, “Caught Offside”, dated February 12, 2019, available at usbs.bcaresearch.com 4 Please see U.S. Bond Strategy Weekly Report, “Don’t Position For Curve Inversion”, dated January 22, 2019, available at usbs.bcaresearch.com 5 Please see U.S. Bond Strategy Weekly Report, “Buy Corporate Credit”, dated January 15, 2019, available at usbs.bcaresearch.com 6 For more detail on the different phases of the economic cycle please see U.S. Bond Strategy Special Report, “2019 Key Views: Implications For U.S. Fixed Income”, dated December 11, 2018, available at usbs.bcaresearch.com 7 Please see U.S. Bond Strategy Weekly Report, “Running Room”, dated January 29, 2019, available at usbs.bcaresearch.com Fixed Income Sector Performance Recommended Portfolio Specification
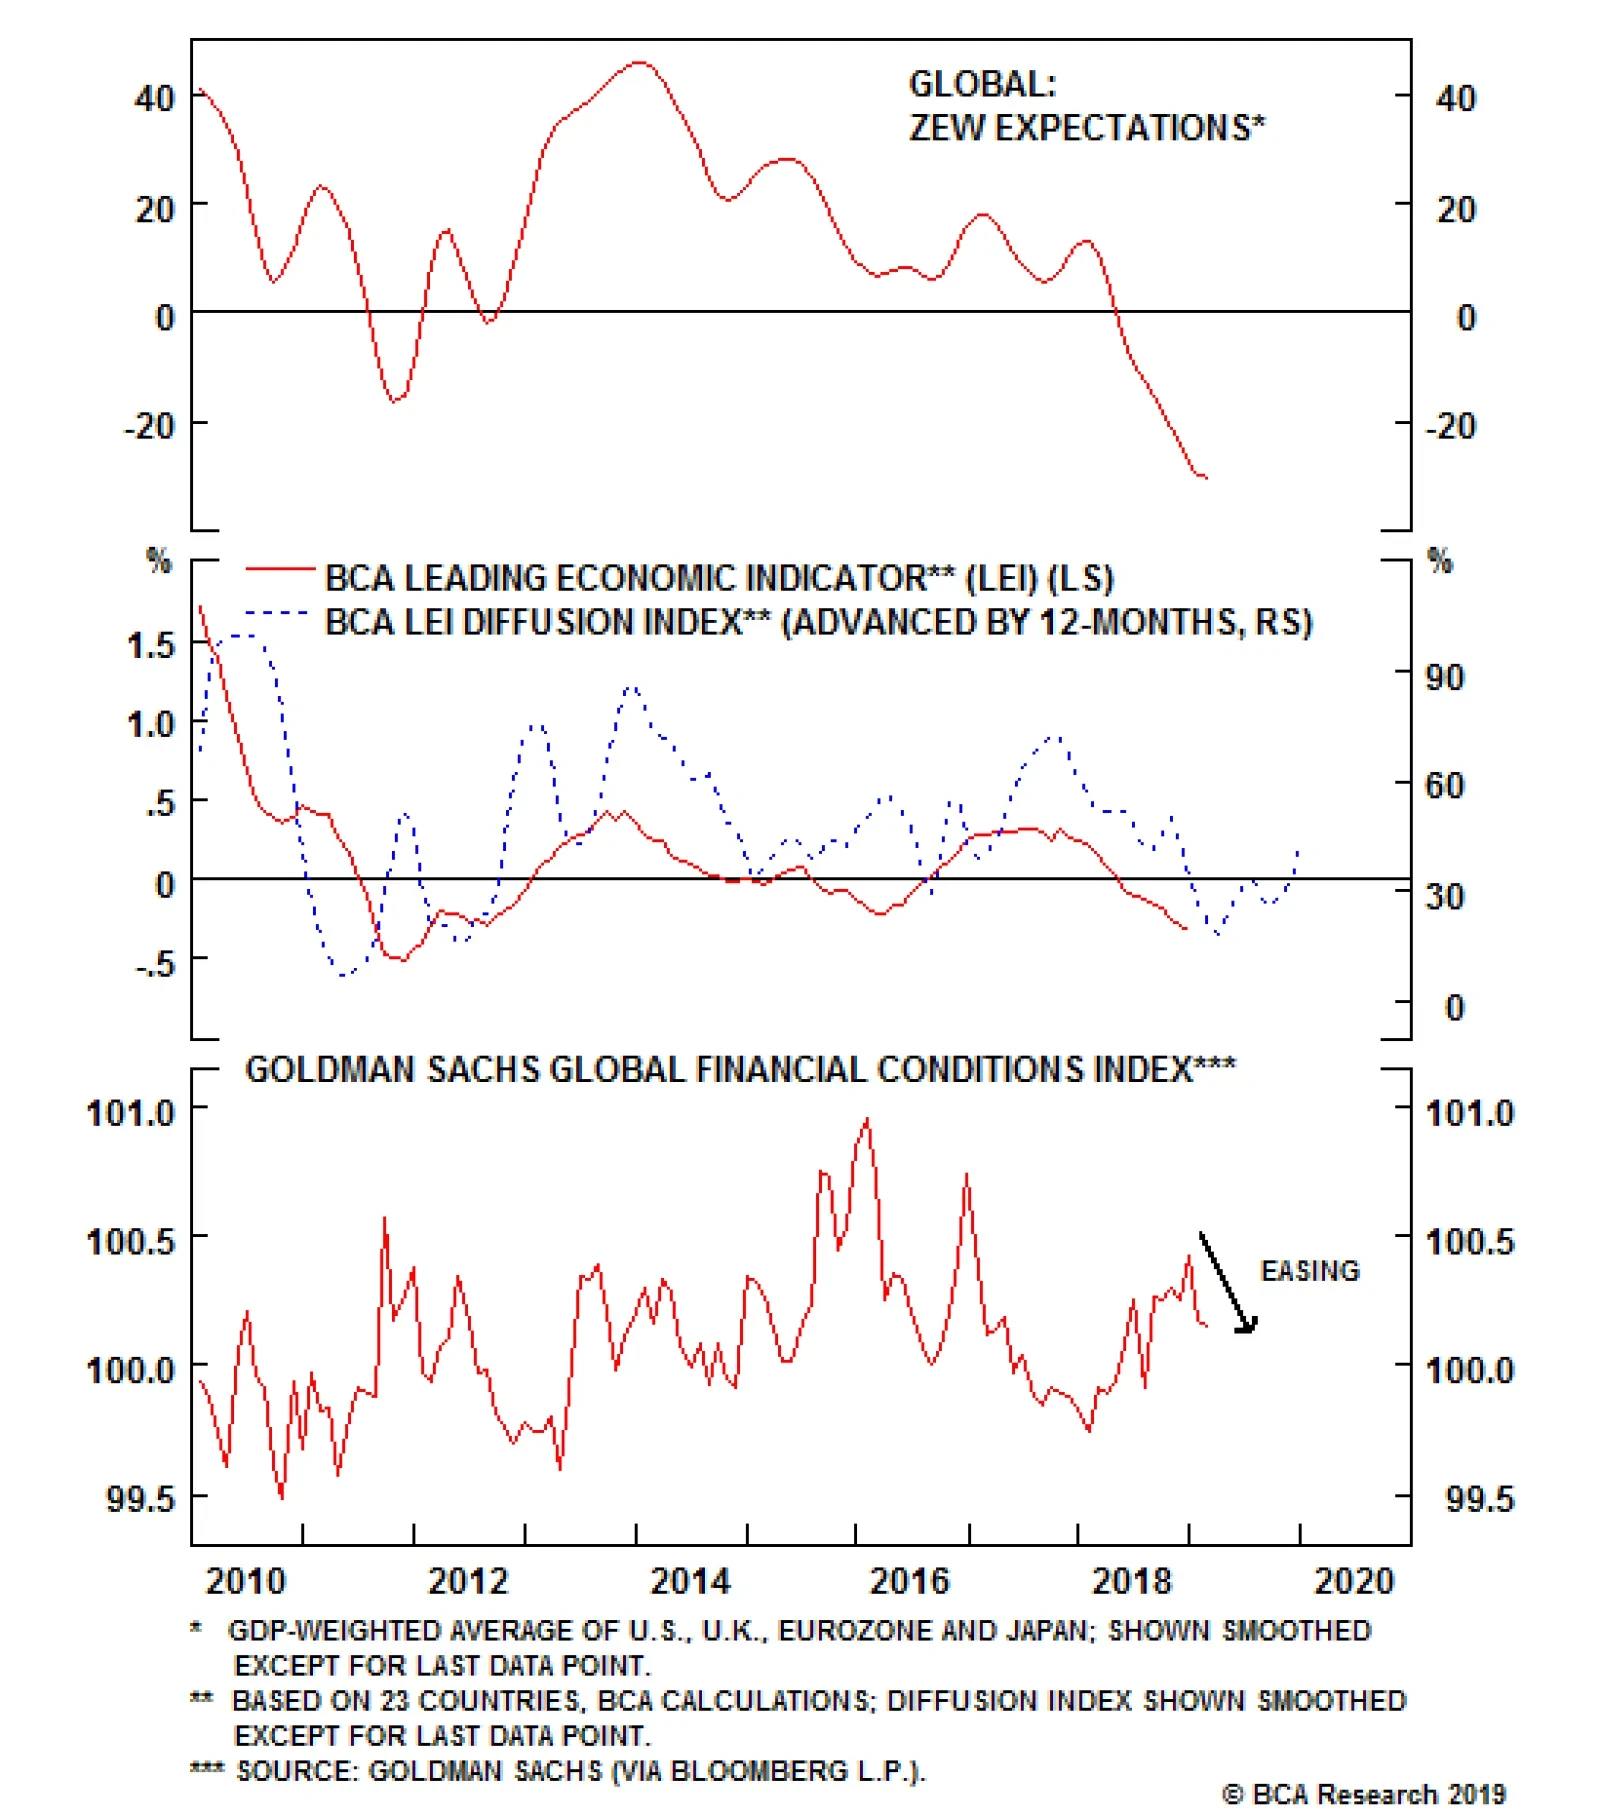
The global growth expectations computed from the German ZEW survey continue to deteriorate. Investors are aware that global growth has slowed, and after the vicious sell-off in equity prices in the fourth quarter of 2018, they seem to extrapolate this…
Highlights Global Growth: Early leading indicators (credit impulses, our global LEI diffusion index) are signaling that the worst of the global economic downturn should soon end. Okun’s Law: In the developed economies, the observed relationships between economic growth and changes in unemployment suggest that the current pullback in global growth will not be severe enough to create slack in labor markets and reduce inflation pressures. Global Bond Allocation: Within dedicated global government bond portfolios, stay underweight the U.S. and Canada, neutral core Europe, and overweight the U.K., Japan and Australia. Remain tactically overweight global credit versus government bonds, at least until mid-year, with policymakers likely to stay cautiously dovish until global uncertainties recede. Feature Is This Risk Rally Too Good To Last? The mood of financial markets has improved significantly over the past few weeks, led by the dovish shift from central bankers that has revived investor risk appetite. Some positive headlines on U.S.-China trade negotiations have also generated hope over prospects for a deal, further fueling the bullish sentiment. The global economic picture remains muddled, though. Non-U.S. growth continues to languish, while the actual near-term state of the U.S. economy is proving difficult to determine given the data issues surrounding the 35-day U.S. government shutdown. Given lingering uncertainties, both political and economic, policymakers do not want to rock the boat by saying anything that might be interpreted as hawkish. With monetary policy no longer a near-term headwind, there is a window for continued outperformance of global risk assets in the next few months. That means higher global equity prices and stable-to-tighter global corporate credit spreads. Yet the seeds for the next wave of market turbulence may already be sewn. There are signs that the global growth downturn may soon end. Credit impulses are starting to pick up in several major economies, while our diffusion index of global leading economic indicators – itself a longer leading indicator – has clearly bottomed (Chart of the Week). The epicenter of global economic weakness, China, continues to deploy monetary and fiscal stimulus measures aimed at stabilizing growth. Meanwhile, the U.S. economy still appears to be in good shape, underpinned by solid consumer fundamentals. Chart of the WeekSunnier Days Ahead?
Sunnier Days Ahead?
Sunnier Days Ahead?
A combination of easier financial conditions and faster economic growth will eventually prove to be incompatible with stable monetary policy, especially with surprisingly firm inflation in the major developed economies. Central bankers will respond by moving away from their current dovish bias, led by the U.S. Federal Reserve. With government bond markets now discounting both stable monetary policy and too-low inflation expectations, the path for global bond yields is eventually higher. While headline inflation rates are cooling in response to the lagged impact of weaker oil prices, the pullback has been far more muted so far compared to similar sharp oil-driven moves in the past (Chart 2). This is because domestically-driven inflation rates for services and wages are much sturdier today in many countries. If BCA’s bullish oil view for 2019 comes to fruition, then the current decline in headline/goods inflation rates may prove to be very short-lived and with little pass-through into core/services inflation. Chart 2Sticky Global Inflation, Despite Lower Oil Prices
Sticky Global Inflation, Despite Lower Oil Prices
Sticky Global Inflation, Despite Lower Oil Prices
This dynamic is not the same in every country, however. When looking at the individual trends of goods inflation and services/wage inflation in the major developed economies, the largest gaps between the two exist in the U.S. and Canada (Chart 3). There, wage growth is accelerating and services inflation rates remain sturdy, despite sharp drops in goods inflation. Chart 3Domestic Inflation Pressures Most Acute In The U.S. & Canada
Domestic Inflation Pressures Most Acute In The U.S. & Canada
Domestic Inflation Pressures Most Acute In The U.S. & Canada
Our recommended government bond allocation at the country level reflects these underlying inflation trends. We are more bearish on bond markets with the most intense domestic inflation pressures – and where future interest rate hikes are most likely – and vice versa. We remain underweight the U.S. and Canada, where wage growth and services inflation are both above the inflation targets of the Fed and Bank of Canada, and where market-based measures of inflation expectations like CPI swap rates have already bottomed (Chart 4). We remain neutral on core Europe (Germany, France) where wage growth has perked up, core/services inflation remains closer to 1% than the 2% target of the ECB, and inflation expectations continue to drift lower. Finally, we remain overweight the U.K., Japan and Australia, all of which have an underlying inflation picture that is muted enough to keep policymakers on hold for at least the next 6-9 months. Chart 4Favor Bond Markets Where Domestic Inflation Pressures Are Weakest
Favor Bond Markets Where Domestic Inflation Pressures Are Weakest
Favor Bond Markets Where Domestic Inflation Pressures Are Weakest
Bottom Line: Early leading indicators (credit impulses, our global LEI diffusion index) are signaling that the worst of the global economic downturn should soon end. Central bankers will remain cautious and dovish in the near-term, however, implying that the current outperformance of global equity and credit markets has more room to run – but also setting up the next upleg for bond yields later this year. Okun’s Law Revisited Central bankers remain wedded to the idea that there is an “exploitable” relationship between unemployment and inflation, a.k.a. the Phillips Curve. A logical extension is that unless policymakers can credibly forecast a reduction in labor demand that pushes unemployment rates beyond levels associated with full employment, inflation will not be expected to decline. Policymakers will have a difficult time staying dovish without believing that inflation pressures are diminishing. One way to measure the relationship between economic growth and changes in economic slack is by using a concept that you may remember from an old macroeconomics class – Okun’s Law. More an empirically observable rule of thumb than any rule based in actual economic theory, Okun’s Law simply measures how much unemployment rates change relative to swings in real GDP growth. Past estimations for the U.S. economy have shown that the long-run coefficient in the Okun’s Law regression is around 2, which means that a 2% fall in real GDP growth should be associated with a 1% increase in the unemployment rate (and vice versa). That coefficient is not the same over shorter time horizons, though, as the unemployment/GDP growth relationship can be impacted by other cyclical factors like changes in hours worked or labor productivity. Charts 5 and 6 show annual real GDP growth (the percentage change over four quarters) versus the change in the unemployment rate over twelve months for the major developed economies (the U.S., U.K., euro area, Japan, Canada, Australia, New Zealand and Sweden) dating back to 1980. There is a reasonably strong relationship between the two series in the charts, although the “fit” does vary from country to country. Chart 5The Okun’s Law Relationship …
The Okun's Law Relationship...
The Okun's Law Relationship...
Chart 6… Still Holds For Most Countries
...Still Holds For Most Countries
...Still Holds For Most Countries
That can be seen in the individual country scatterplots shown in Charts 7 to 14, which plot each quarterly data point of the change in unemployment and real GDP growth. The darker dots represent the period from 1980-2010, while the lighter dots are the post-2010 era. The actual estimated regression, and its R-squared, are also shown in the charts (the equation can be defined as “the estimated change in the unemployment rate for a given pace of real GDP growth”).
Chart 7
Chart 8
Chart 9
Chart 10
Chart 11
Chart 12
Chart 13
Chart 14
For most countries shown, the R-squareds are reasonably good (between 0.55 and 0.70) for a single-factor model like this. The coefficients on the change in real GDP are all between -0.35 and -0.45, which means that a fall in real GDP growth of 3.5 to 4.5 percentage points is consistent with a rise in the unemployment rate of 1 percentage point. The lone country where the Okun’s Law relationship has a relatively poor historical fit is in Japan, which is due to the lack of GDP variability relative to swings in the unemployment rate, especially over the past decade. We can use these estimates of the Okun’s Law coefficient to conduct a “back of the envelope” thought experiment that answers the following question that relates to the current economic and financial market backdrop: how much of a decline in GDP growth is necessary to raise unemployment rates back to full-employment (NAIRU) levels? As we have consistently noted in recent Weekly Reports, global central bankers can only turn so dovish, even after the severe market turbulence seen at the end of last year and with elevated political uncertainty in many locations. Why? Because unemployment rates remain below levels that are consistent with stable inflation. Without a meaningful weakening of labor markets that pushes unemployment rates back above “full employment” levels, policymakers will not be able to lower their inflation forecasts and signal a need for easier monetary policy. In Table 1, we present the estimated Okun’s Law regressions from 1980, along with the real GDP growth rate that falls out of those equations if we assume the employment gaps are closed.1 We also show the consensus 2019 real GDP growth forecasts taken from Bloomberg, as well as the expected change in central bank policy rates over the next year taken from our Central Bank Discounters. The conclusion from the Table is that it would take significant declines in real GDP growth to raise unemployment rates enough for policymakers to become less worried about inflation pressures. Table 12019 Consensus Growth Forecasts Are Well Above Levels That Would Eliminate The Unemployment Gap
Hope Springs Eternal
Hope Springs Eternal
In the U.K., where the unemployment rate is furthest below the OECD’s estimate of the full-employment NAIRU rate, a whopping -3.3 percentage point cut to real GDP growth is needed to raise unemployment back to 5.6%. The required GDP fall is lower in the U.S., with only a -1.6 percentage point decline in real GDP growth need to push the unemployment rate back to the OECD NAIRU estimate of 4.3%. Falls in real GDP growth of between -1.5 and 2.0 percentage points are necessary in most of the other countries to close the “unemployment gap”, except for Japan. Given the weak estimated Okun’s Law relationship in Japan, we are reluctant to put much weight on the results of this thought experiment for Japan. Those “required” declines in real GDP growth are nowhere close to the 2019 consensus Bloomberg forecasts for each country. This is even true in the U.S., where the consensus expects real GDP growth to decline by -0.9 percentage points in 2019. Unsurprisingly, markets are discounting very little change in monetary policy over the next year according to our Central Bank Discounters, with modest odds of a rate cut now discounted in Australia (-19bps), New Zealand (-11bps) and the U.S. (-8bps) and a full 25bp hike now priced in Sweden. Summing it all up, our simple Okun’s Law thought experiment shows that it would take a significantly larger decline in global growth than the consensus, or BCA, expects for central banks to shift even more dovishly in the direction of interest rate cuts. This puts a cyclical floor underneath global bond yields, given that relatively stable policy rates are now discounted. Bottom Line: The observed relationships between economic growth and changes in unemployment suggest that the current pullback in global growth will not be severe enough to create slack in labor markets and an easing of inflation pressures in the developed economies. Robert Robis, CFA, Senior Vice President Global Fixed Income Strategy rrobis@bcaresearch.com Footnotes 1 Given the declining productivity trend seen in all countries over the past 20 years, we have made a downward adjustment to those Okun’s Law estimated coefficients. In other words, we do not think that it will take the same magnitude of GDP loss to generate the same increase in unemployment when labor productivity is low. Recommendations The GFIS Recommended Portfolio Vs. The Custom Benchmark Index
Hope Springs Eternal
Hope Springs Eternal
Duration Regional Allocation Spread Product Tactical Trades Yields & Returns Global Bond Yields Historical Returns
This stunningly poor retail sales number is obviously worrisome, especially as the control group, which enters in the calculation of GDP, fell sharply as well. This catastrophic dataset, along with a poor industrial production reading this morning, caused the…
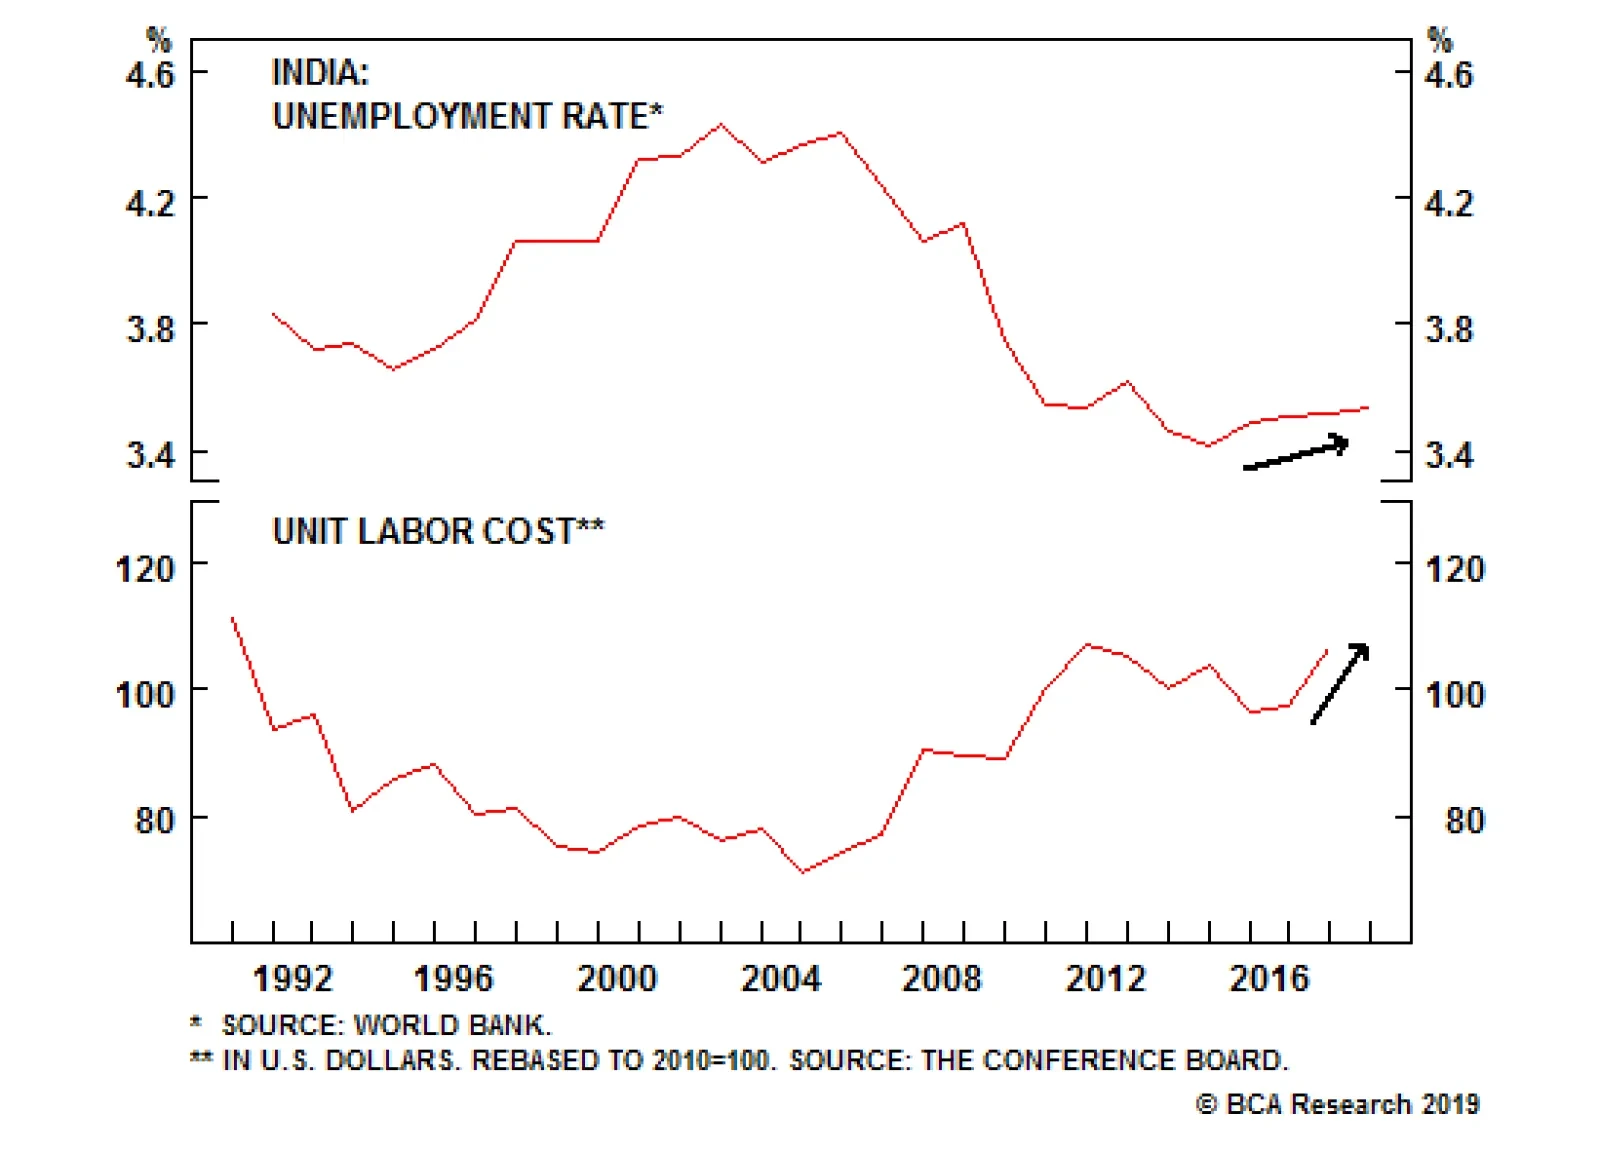
The first concern is the unemployment rate. Even the official unemployment rate is rising despite the fast clip of economic growth and the pro-growth reforms. A leaked government statistical report suggests that unemployment has indeed gone up and labor…
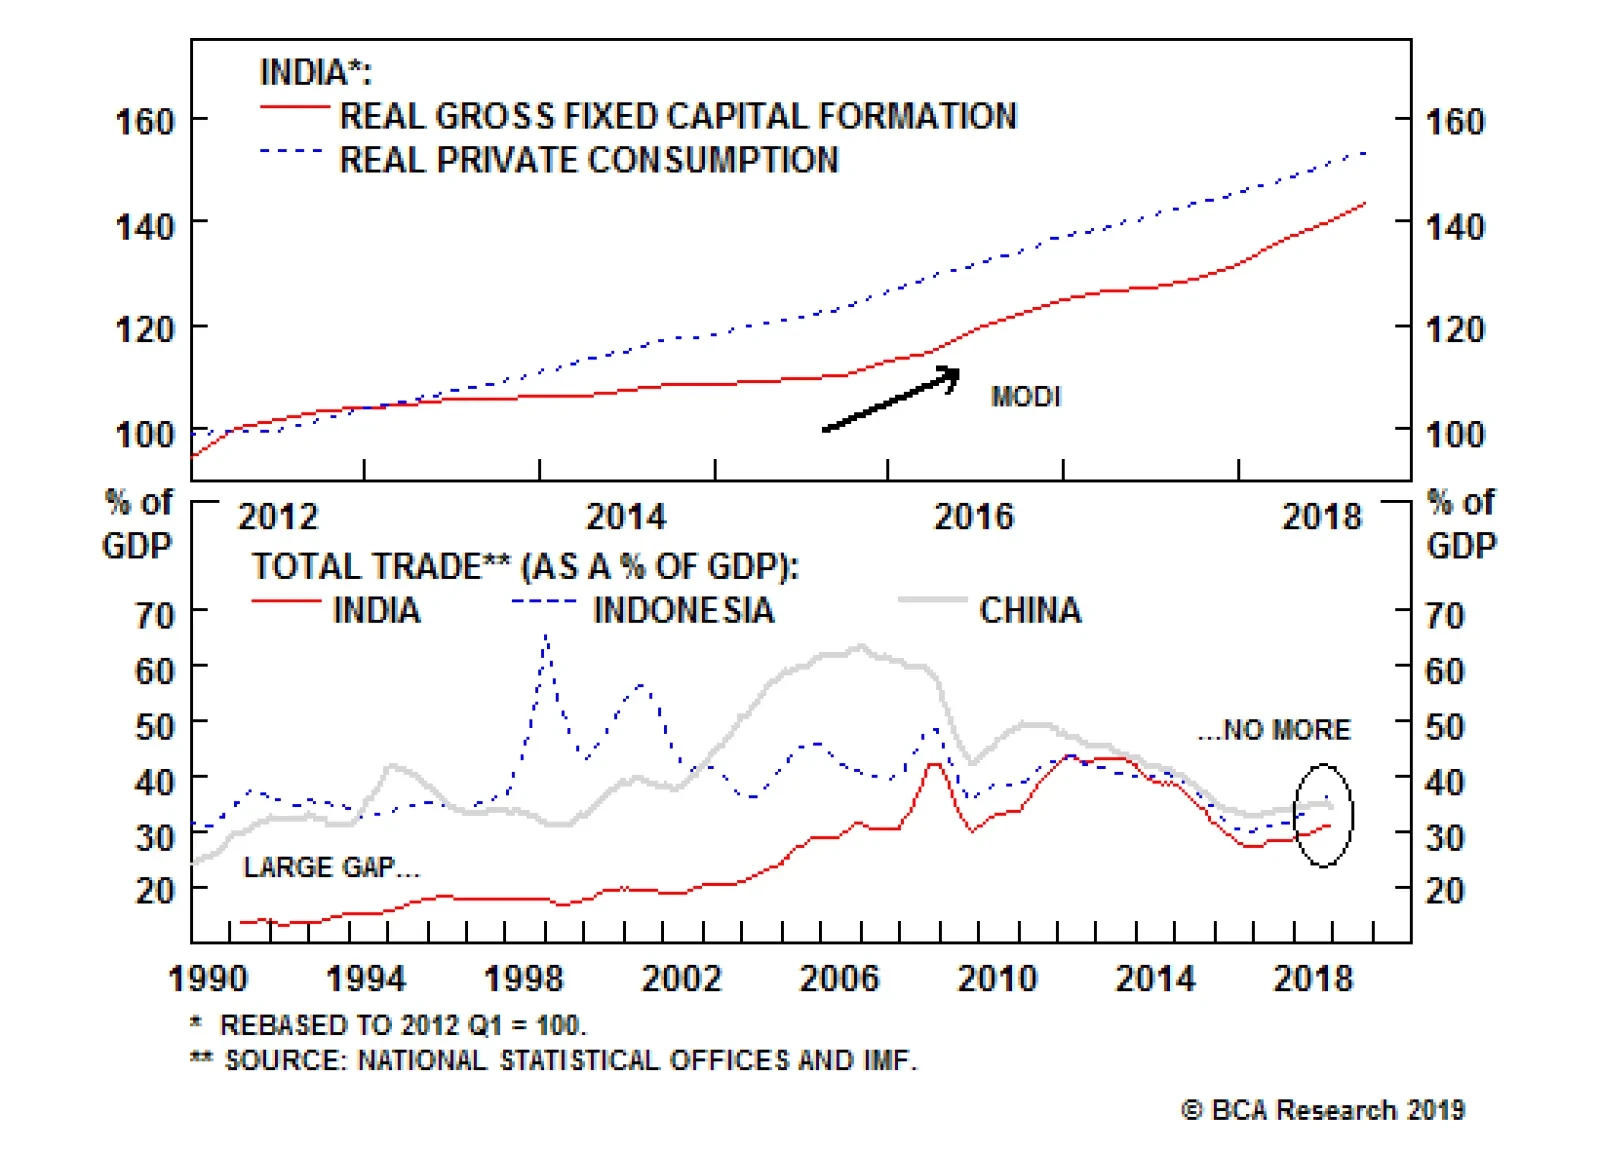
India inherited liberal democracy and rule of law from the British. Its own revolutionary leaders built on this foundation, providing relative stability despite its patchwork of languages, ethnicities, and castes. Democratic checks and balances have led to…
Highlights Uncertainty & Growth: There is currently a strong link between depressed global growth expectations and elevated levels of economic policy uncertainty (U.S.-China trade tensions, Brexit, etc). Monetary Policy: A growing number of central banks have taken “risk management” measures to try and prevent a deeper downturn in actual economic activity by shifting to a less hawkish policy bias – even with tight labor markets. Implications For Bond Yields: We do not expect the current soft patch for global growth to extend into a more prolonged period of weak activity, given that global policy rates remain at highly stimulative levels. This will set up the next wave of rising global bond yields, but likely not until the latter half of 2019 (and focused mostly on U.S. Treasury yields). Feature Central Banks Take Out Some Insurance The list of global central banks taking a more cautious stance on monetary policy expanded last week. The Bank of England and Reserve Bank of Australia both cut their growth forecasts for 2019 and signaled that there was no chance of interest rate increases in the near term. This follows similar guidance provided in recent weeks by the U.S. Federal Reserve, the Bank of Canada and Sweden’s Riksbank. There was even a dovish surprise in the emerging world, with the Reserve Bank of India delivering an unexpected rate cut last week. In Europe, the European Central Bank (ECB) has not yet shifted its already highly-dovish policy guidance (no rate hikes until at least September), but ECB President Mario Draghi recently noted that the downside risks to European growth have increased. The European Commission went a step further and downgraded its growth forecasts for 2019 last week. The Bank of Japan cut its inflation forecast for 2019 last month, also indicating that monetary policy would remain unchanged over at least the rest of the year. The language used by all of these policymakers to explain their dovish turn was eerily similar, highlighting elevated global uncertainty weighing on growth expectations and, through plunging asset prices, tightening financial conditions (Chart of the Week). The sources of that uncertainty are well known to investors: U.S.-China tariff negotiations, slowing global trade, Brexit, domestic U.S. political squabbles (i.e. government shutdowns over “The Wall”). Until those developments begin to get resolved, uncertainty will continue to weigh on economic confidence. Chart of the WeekThe “Risk Management” Approach To Setting Monetary Policy
The 'Risk Management' Approach To Setting Monetary Policy
The 'Risk Management' Approach To Setting Monetary Policy
21st Century central bankers mostly subscribe to a “risk management” approach to policymaking. This means setting policy dovish enough to cut off downside tail risks to growth during periods of elevated uncertainty about the economic outlook – especially when inflation is below policymaker targets. Yet central bankers remain devoted followers of the Phillips Curve framework. There is a limit to how dovish they can become while unemployment is low and wage growth is increasing. This limits how far government bond yields can fall if growth does not slow enough to cause unemployment to rise. So far, the softer global growth seen in recent quarters has not resulted in any increase in unemployment rates in the major developed economies. Of course, employment is a lagging variable. If the current soft patch for growth extends into a more prolonged slowdown in the coming months, resulting in companies cutting hiring or shedding labor to protect weakening profitability, then there is room for bond yields to continue to fall as markets begin to price in easier monetary policy. That is not our expectation. The U.S. economy remains on solid footing, and we anticipate additional policy actions from China to stabilize economic growth and put a floor under global trade activity. This will eventually cause central bankers to move back to a less dovish policy stance more consistent with trends in unemployment and inflation, with the U.S. Fed leading the way on that front in the latter half of 2019. The eventual result will be higher U.S. Treasury yields, both in absolute terms and relative to government bond yields of the other major developed economies. Bottom Line: There is currently a strong link between depressed global growth expectations and elevated levels of economic policy uncertainty. Central banks are taking the appropriate “risk management” measures to prevent a deeper downturn in actual economic activity by shifting to a less hawkish policy bias – even with tight labor markets. The Link Between Economic Confidence & Monetary Policy The pro-risk rally that opened 2019 endured its first test last week, with several major market prices – including the S&P 500 index, U.S. high-yield spreads, the 10-year Italy-Germany government bond yield differential and the DXY index of the U.S. dollar - bouncing off key medium-term moving averages (Chart 2). Purely from a technical analysis perspective, a test of the primary trends established in the latter half of 2018 (bearish equities and credit, bullish the U.S. dollar) was to be expected, particularly given the severity of the past selloff in global equity markets. Chart 2The First Test For The 2019 Risk Rally
The First Test For The 2019 Risk Rally
The First Test For The 2019 Risk Rally
Investor sentiment towards global growth, however, remains pessimistic. Nervousness over the outcome for the U.S.-China trade talks, with the March 1 deadline fast approaching, is an obvious source of concern given how slowing Chinese import demand has spilled over so dramatically into weaker global trade activity (Chart 3). Yet there are several other dates for investors to fret about in the near term, including the deadline for a deal to avert another U.S. government shutdown (this Friday), the U.S. debt ceiling deadline (also March 1) and “Brexit day” in the U.K. (March 29). Chart 3A China-Led Slowing Of Global Trade
A China-Led Slowing Of Global Trade
A China-Led Slowing Of Global Trade
Yet this current soft patch for the global economy is occurring alongside an extreme divergence between plunging growth expectations and more stable readings on current economic conditions. The fall in expectations is visible in the most countries, according to data series that measure confidence for businesses, consumers and investors. One such set of data that we pay close attention to is the ZEW survey. The ZEW survey, produced by a prominent German economic think tank, is most well-known for the data related to Germany itself. The ZEW also produces similar survey data measuring readings on “current conditions” and “expectations” for other major developed economies: the U.S., U.K., Japan, France, and Italy (as well as an aggregate measure for the entire euro area). This makes the ZEW data useful for conducting cross-country analysis of economic sentiment, as the survey structure and questions are consistent for each country. Looking at the individual country readings from the ZEW data, shown in Charts 4 and 5, it is clear that the depressed readings on global growth sentiment are similar across all major countries. Yet at the same time, the individual ZEW Current Conditions indices, while off their cyclical peaks, are exhibiting more diverse trends. The U.S., in particular, stands out as having a very robust reading on Current Conditions, which lines up with the overall firmness of the U.S. economic data. Chart 4A Co-Ordinated Decline Of Expectations, Not Actual Growth
A Co-Ordinated Decline Of Expectations, Not Actual Growth
A Co-Ordinated Decline Of Expectations, Not Actual Growth
Chart 5The European Growth Slump Is Broad-Based
The European Growth Slump Is Broad-Based
The European Growth Slump Is Broad-Based
The strong correlation between the ZEW Expectations readings suggests that there is a common factor causing market participants to become more worried about the outlook for global growth. These can all be summarized under “uncertainty”, for which we also have data available at the country level from the Economic Policy Uncertainty indices developed by researchers Scott Baker, Nick Bloom and Steven Davis.1 In Charts 6 and 7, we plot the Policy Uncertainty indices against the ZEW growth expectations indices for the individual countries/regions for which the ZEW conducts its surveys. The growth expectations data is shown inverted to correlate with the Policy Uncertainty indices. The visual relationship shows that the current period of elevated Policy Uncertainty has occurred alongside the plunge in growth expectations, seen most strongly in the U.S., U.K. and Italy. Chart 6Uncertainty Slamming Sentiment Hardest In The U.S. & U.K.
Uncertainty Slamming Sentiment Hardest In The U.S. & U.K.
Uncertainty Slamming Sentiment Hardest In The U.S. & U.K.
Chart 7Germany Weathering The Storm Better Than Italy & France
Germany Weathering The Storm Better Than Italy & France
Germany Weathering The Storm Better Than Italy & France
But can this link between uncertain and growth expectations result in an actual slowing of economic activity? Can slumping expectations become a self-fulfilling prophecy? One way to look at this is to see how growth expectations evolve relative to current economic growth. We show those gaps between the Current Conditions and Growth Expectations components of the ZEW survey in Charts 8 and 9. A rising line indicates a wide gap between Current Conditions and Expectations and vice versa. We also add real GDP growth in each panel of the charts, to compare that “ZEW Gap” to actual growth outcomes. Chart 8The “ZEW Gap” Now At Levels That Have Heralded Past Downturns …
The 'ZEW Gap' Now At Levels That Have Heralded Past Downturns...
The 'ZEW Gap' Now At Levels That Have Heralded Past Downturns...
Chart 9… Within Europe Too …
...Within Europe Too...
...Within Europe Too...
The current gap between the two measures is at or near the widest levels seen in the history of the ZEW data dating back to the early 1990s. The previous times that the ZEW Gap reached such levels, economic growth slowed for all the countries in the ZEW survey – most notably in the run-up to the recessions in the early 1990s, early 2000s and 2009. The ZEW Gap also accurately signaled the recessions seen within the euro area after the 2011 European Debt Crisis. The first implication of this result is large discrepencies between strong current growth and expectations almost always resolve themselves with actual weaker growth, if not outright recession – not a good sign for the global economy in the coming quarters. Yet one major difference between today and those prior episodes of a wide ZEW Gap is the level of monetary policy accommodation. In those prior episodes that ended in recession, central bankers raised policy rates to restrictive levels that eventually caused the growth slowdown. This can be seen in Chart 10, where we plot the ZEW Gaps vs the “Monetary Policy Gaps”, defined as the difference between actual central bank policy rates and an estimate of neutral rates derived from a simple Taylor Rule formula.2 Chart 10...But Monetary Policy Is Not Tight This Time
...But Monetary Policy Is Not Tight This Time
...But Monetary Policy Is Not Tight This Time
Today, central banks are maintaining policy rates far below levels of neutral consistent with long-run potential growth and economies operating at or beyond full capacity – even with inflation rates that are below central bank targets. This should help cushion the blow from weakening growth expectations stemming from the current period of elevated economic uncertainty. The root cause of all recessions is always monetary policy that becomes too restrictive. Typically, that occurs directly through central banks hiking rates above neutral and actively engineering a growth slowdown. It can also occur if an external shock to growth is severe enough to depress economic activity faster than policymakers can identify the slowdown and respond with easier monetary policy. The latter appears to be the outcome that investors are most worried about today. Yet with central banks now turning more dovish in response to elevated uncertainty, at a time when monetary policy appears already highly stimulative, the odds of a monetary policy error crushing growth are low. We are more worried about the opposite outcome, where policymakers are giving more stimulus to a global economy that does not necessarily need it, given that overly tight monetary policy is not the main problem at the moment. In other words, policymakers who have become more dovish today will need to become less dovish later, if and when the current laundry list of uncertainties begin to get resolved. We think that is only a real issue in the U.S. at the moment, though. Our Central Bank Monitors continue to indicate that tighter monetary policy is still required in the U.S. (Chart 11), unlike the Monitors from the U.K., euro area and Japan – the other countries where we have looked at the expectations/uncertainty relationship. Thus, we expect U.S. Treasury yields to have more upside than German Bund, U.K. Gilt or Japanese government bonds over the next 6-12 months. Chart 11The Message From Our CB Monitors - Stay Underweight U.S. Treasuries
The Message From Our CB Monitors - Stay Underweight U.S. Treasuries
The Message From Our CB Monitors - Stay Underweight U.S. Treasuries
Bottom Line: We do not expect the current soft patch for global growth to extend into a more prolonged period of weak activity, given that global policy rates remain at highly stimulative levels. This will set up the next wave of rising global bond yields, but likely not until the latter half of 2019 (and focused mostly on U.S. Treasury yields). Robert Robis, CFA, Senior Vice President Global Fixed Income Strategy rrobis@bcaresearch.com Footnotes 1 The full set of global Policy Uncertainty Indices, with data downloads and methodological descriptions, can be found at www.policyuncertainty.com. 2 Neutral Policy Rate = Potential GDP growth + central bank inflation target + (0.5 x (current inflation minus central bank inflation target)) +( 0.5 * the IMF estimate of the output gap)). Recommendations The GFIS Recommended Portfolio Vs. The Custom Benchmark Index
A Crisis Of Confidence?
A Crisis Of Confidence?
Duration Regional Allocation Spread Product Tactical Trades Yields & Returns Global Bond Yields Historical Returns