Emerging Markets

Listen to a short summary of this report Executive Summary Sales & Profit Margins: The Two Propellers That Powered The Post-GFC US Rally
What Has Driven US Outperformance Post-GFC And Can This Persist?
What Has Driven US Outperformance Post-GFC And Can This Persist?
US equity markets underperformed the global benchmark by 10% over 2000-08. Since then, the US has outperformed the global benchmark by about 170%. So, what has driven the US’ chartbusting performance in the post-GFC period? If we break down the US’ price performance into three parts – namely price-to-earnings ratio, net profit margins, and sales – then it becomes clear that growth in the latter two elements played a key role in driving US outperformance in the post-GFC era. Can the US’ outperformance relative to global markets persist going forward? It appears unlikely that the US’ high profit margins can sustain these levels of growth going forward. Distinct from the mean reversion argument, the US’ high profit margins are unusually concentrated amongst a fistful of firms. US firms may also find it challenging to maintain high sales growth as US GDP growth slows and given that America’s antitrust philosophy may soon undergo a once-in-a-generation change. Finally, it is worth noting that ‘sector composition’ effects played a significant role in driving US outperformance over 2008-22. Given that we expect outperforming sectors like Tech to become underperformers, this effect could become weaker going forward, thereby subverting another source of the US’ outperformance. Bottom Line: Forecasting is a tenuous science but given that the two prime propellers of the US’ performance engine are likely to confront headwinds going forward, investors should consider reducing allocations to US equities over a longer term, strategic horizon. Dear Client, I am meeting clients in Asia this week while also working on our Fourth Quarter Strategy Outlook, which will be published next week, followed by my webcast the week after. In lieu of our regular report this week, you are receiving a Special Report from my colleague, Ritika Mankar, discussing the sources of US equity outperformance over the past 14 years and the likely path ahead. Best Regards, Peter Berezin, Chief Global Strategist US Stock Market Dominance – It Wasn’t Always This Way Let us assume that you could travel back in time, and today was December 31, 2008. On this day you know that US and Japanese equity markets have underperformed the global benchmark (Chart 1). You also know that Europe (i.e., EU-27) has done marginally better than the US, while Emerging Markets (EM) have been the star outperformer. Let us further assume that by close of play today you have to deploy US$10bn across these four equity markets (across the US, Europe, Japan, and EM). As if the task of taking this decision on the last day of this historic year was not enough, let us assume that the funds you invest must be locked in until the fall of 2022. Finally, let us add one more condition to this task – let us suppose that you have no idea how markets would perform over the 2008-22 period, but you have perfect foresight about how the nominal GDP of these four regions would look like in 2022. Specifically, you know that EM GDP will have a terrific run between 2008 to 2022, US GDP will increase but by a far less impressive degree, European GDP will grow only slightly, and Japan’s GDP would be lesser in 2022 than it was in 2008 (Chart 2). Chart 1US Equities Underperformed The Global Benchmark By 10% Over 2000-08
US Equities Underperformed The Global Benchmark By 10% Over 2000-08
US Equities Underperformed The Global Benchmark By 10% Over 2000-08
Chart 2EM GDP Has More Than Doubled Since The GFC
What Has Driven US Outperformance Post-GFC And Can This Persist?
What Has Driven US Outperformance Post-GFC And Can This Persist?
Chart 3US Equities Outperformed The Global Benchmark By About 170% Over 2008-22YTD
US Equities Outperformed The Global Benchmark By About 170% Over 2008-22YTD
US Equities Outperformed The Global Benchmark By About 170% Over 2008-22YTD
If you were to take an investment decision based only this information, what is certain is that the fund you manage would underperform by a painful degree. This is because we now know that even though US markets had poor momentum in 2008, and the US’ GDP expansion paled relative to EM, US equity markets outperformed global markets by a wide margin since 2008 (Chart 3). On the other hand, despite positive momentum and high GDP growth, EM emerged as a distant second-best performer. Japan miraculously made it to third place despite a contraction in nominal GDP, and finally Europe ended up being the worst performer. If market momentum and GDP growth cannot explain these market movements, then what drove the US' outstanding performance in the post-GFC period? In this Special Report, we delve into answering this question in detail. The purpose of peeling the onion of the US' performance is simple – we hope to extract the insights that investors need to construct alpha-generating portfolios, in a world where forward time travel is not a possibility (yet). The US’ Performance Has Been Powered More By Earnings, Less By Valuations The two basic building blocks of any equity index are its earnings and its price-to-earnings ratio. The former captures the fundamentals backing an index, while the latter quantifies the valuation element. Breaking down the US’ performance into these two parts shows that earnings have been the prime factor that have propelled the rise of US equity markets in the post-GFC era (Chart 4). That earnings have been an important driver of the US’ outperformance becomes even more apparent when US earnings are compared to that of other major markets. For instance, the steep expansion in US earnings contrasts with the situation across the Atlantic. In Europe, earnings have trended lower relative to the global benchmark since 2008 and an increase in relative valuations has helped lend a floor to the index (Chart 5). The earnings report card for Japan and EM, on the other hand, have been surprisingly similar as earnings failed to rise meaningfully in both these geographies in the post-GFC period (Chart 6 and 7). Chart 4Earnings Have Played A Key Role In Propelling The Post-GFC US Rally
What Has Driven US Outperformance Post-GFC And Can This Persist?
What Has Driven US Outperformance Post-GFC And Can This Persist?
Chart 5European Equities Supported More By Valuation Multiples
What Has Driven US Outperformance Post-GFC And Can This Persist?
What Has Driven US Outperformance Post-GFC And Can This Persist?
Chart 6Earnings Growth Has Been Unimpressive In Japan Too
What Has Driven US Outperformance Post-GFC And Can This Persist?
What Has Driven US Outperformance Post-GFC And Can This Persist?
Chart 7Earnings Have Trended Lower In EM Since 2008
What Has Driven US Outperformance Post-GFC And Can This Persist?
What Has Driven US Outperformance Post-GFC And Can This Persist?
In summary, the US' price-to-earnings ratio has had a meaningful role in driving US outperformance in the post-GFC period (Chart 8), but earnings expansion has played an outsized role (Chart 9). Chart 8Relative Valuation Multiples Have Played A Key Role In Supporting European Markets
What Has Driven US Outperformance Post-GFC And Can This Persist?
What Has Driven US Outperformance Post-GFC And Can This Persist?
Chart 9Earnings Expansion In The US Has Been Phenomenal
What Has Driven US Outperformance Post-GFC And Can This Persist?
What Has Driven US Outperformance Post-GFC And Can This Persist?
In fact, the growth in earnings in the US in the post-GFC era has been so noteworthy that if US equity market prices were to be broken down into its two building blocks i.e., earnings and price-to-earnings ratio, then the lion’s share of US equity market prices today would be attributed to its earnings (Chart 10). Expectedly, this contrasts with the situation in Europe where equity market prices have managed to stay afloat owing to a re-rating in its price-to-earnings ratio (Chart 11). These attribution analysis numbers are not meant to be taken literally, but rather, reflect the relative role played by earnings and price-to-earnings ratios in supporting the prices of regional indices. Chart 10US Equities: Supported More By Earnings
What Has Driven US Outperformance Post-GFC And Can This Persist?
What Has Driven US Outperformance Post-GFC And Can This Persist?
Chart 11EU Equities: More Reliant On Multiples
What Has Driven US Outperformance Post-GFC And Can This Persist?
What Has Driven US Outperformance Post-GFC And Can This Persist?
The Unsung Hero Behind The US’ Outperformance - Record Sales Expansion The index of a region can also be envisaged as the product of three elements, namely: (1) its price-to-earnings ratio; (2) its net profit margins; and (3) its sales. In other words: Price = (Price / Earnings) x (Earnings / Sales) x (Sales) While the US' healthy earnings tend to attract disproportionate investor attention, this formulation shows how a surge in US sales was the bigger driver of US outperformance (Chart 12). US profit margins experienced a sharp surge relative to global profit margins over the 2008-12 period, but then this parameter flatlined. US sales, on the other hand, have managed to register a steady march upwards over the entirety of the post-GFC period. The growth in sales of listed American corporations has in fact been so remarkable that a grand total of ten American firms now have annual sales of over $200 billion – which marks an all-time high for the US (Chart 13). Chart 12Post-GFC US Rally Powered By Record Sales Expansion
What Has Driven US Outperformance Post-GFC And Can This Persist?
What Has Driven US Outperformance Post-GFC And Can This Persist?
Chart 13The US Is Home To Ten Firms With Revenues Of +$200bn
What Has Driven US Outperformance Post-GFC And Can This Persist?
What Has Driven US Outperformance Post-GFC And Can This Persist?
Furthermore, the US’ lead on sales today is meaningful not only by its own historical standards, but by cross-country standards too. The rise in US sales has meant that the US is now home to half of the twenty largest listed corporations globally (Table 1). Conversely, Europe and Japan, despite being the third and fourth largest economies of the world, respectively, together account for only three names on this list. Notably however, Emerging Markets have managed to punch above their weight and are home to six of the top twenty firms by sales globally. Table 1The US Today Dominates The Global List Of Top 20 Firms By Revenue
What Has Driven US Outperformance Post-GFC And Can This Persist?
What Has Driven US Outperformance Post-GFC And Can This Persist?
The steep rise in America’s sales in the post-GFC world is also unique because no other major market has experienced such a clear upward move in sales as the US has. Europe and Japan in fact saw their sales-per-share trend downwards in the post-GFC period (Chart 14 and Chart 15). Emerging markets were the only other major global market where sales-per-share managed to stay steady relative to the global benchmark (Chart 16). Chart 14Europe’s Sales Have Trended Lower Post-GFC
What Has Driven US Outperformance Post-GFC And Can This Persist?
What Has Driven US Outperformance Post-GFC And Can This Persist?
Chart 15Japan’s Sales Also Trended Lower Post-GFC
What Has Driven US Outperformance Post-GFC And Can This Persist?
What Has Driven US Outperformance Post-GFC And Can This Persist?
Finally, thanks to the high growth in US sales, the contribution of sales to US equity prices is far higher than the contribution of its net profit margins or its price-to-earnings ratio (Chart 17). This once again is in sharp contrast to a market like Europe, where only a smidgeon of the European equity prices pie can be attributed to its sales. Chart 16EM Sales Have Expanded Marginally Post-2008
What Has Driven US Outperformance Post-GFC And Can This Persist?
What Has Driven US Outperformance Post-GFC And Can This Persist?
Chart 17The Main Engine That Powers US Markets Is ‘Sales’
What Has Driven US Outperformance Post-GFC And Can This Persist?
What Has Driven US Outperformance Post-GFC And Can This Persist?
Chart 18US Profit Margins Have Also Been Expanding Steadily Post-GFC
What Has Driven US Outperformance Post-GFC And Can This Persist?
What Has Driven US Outperformance Post-GFC And Can This Persist?
Distinct from the role played by growing sales, the US’ stellar post-GFC performance has also been powered by growing profit margins. It is notable that the US has experienced an unusually strong upward movement in its profit margins in the post-GFC period (Chart 18). Japan is the only other region which has seen its profit margins expand post-GFC, with both Europe and EM having experienced a fall in profit margins from the levels seen in 2008. A Quick Note On Dividends: The US Lags On Dividend Yields But Leads On Buybacks Thus far we have focused on the returns generated by the US market relative to the world and the factors that drove US outperformance since the GFC. If one were to focus on the dividend yield component, then it is notable that the US lags its peers on this front. Post-GFC, the first major cresting of dividend yields globally took place in 2009-10. Then the next major move down in yields took place in 2020 (Chart 19). While globally, yields have now recovered from this last dip, the US finds itself lagging on this metric which matters for pension funds that rely on annuities (Chart 20). Not only have dividend yields in the US almost halved since the GFC, but the gap between dividend yields offered by the US and other markets has widened over the last few years. Europe however has managed to stay the undisputed leader when it comes to dividend yields through most of the 21st century. Chart 19Global Dividend Yields Have Recovered From The Post-2020 Fall
What Has Driven US Outperformance Post-GFC And Can This Persist?
What Has Driven US Outperformance Post-GFC And Can This Persist?
Chart 20US Lags Global Markets On Dividend Yields
What Has Driven US Outperformance Post-GFC And Can This Persist?
What Has Driven US Outperformance Post-GFC And Can This Persist?
Chart 21Pace Of Buybacks In The US Has Been Meaningful
Pace Of Buybacks In The US Has Been Meaningful
Pace Of Buybacks In The US Has Been Meaningful
Notably, however, while the US lags its peers on dividend yields, it leads when it comes to buybacks. The latter is evident from the fact that proxy measures of shares outstanding have trended lower in the US in the post-GFC period, as compared to the rest of the world (Chart 21). Finally, it is important to note that both the growth in dividends-per-share as well as the absolute level of dividends in the US has been high. This parameter has increased by 2.4 times since 2008 and US dividends in absolute terms are nearly 5 times that of Europe’s dividends today. The only reason why dividend yields have stayed low despite this is because US equity prices have had a stellar run in the post-GFC period. Can This Extent Of US Outperformance Persist? Having delved into the drivers of the US’ performance, we now know that a record expansion in sales and net profit margins have driven its outstanding performance in the post-GFC era. This in turn means that the probability of the US continuing to outperform over the next few years will be closely linked to its ability to maintain a lead on these two parameters. So how is the US positioned with respect to both these factors? The US’ High Profit Margins Appear Unsustainable, For A Wide Range Of Reasons We have established the fact that expanding profit margins have been a supporting driver of the US’ outperformance in the post-GFC period. Now, the consensus view is that US profit margins are extraordinarily high and that they will eventually come down to earth. The logic for this argument is often grounded in mean reversion. We have also previously highlighted that most of the increase in US profit margins has occurred due to rising margins within the tech sector and the accompanying increase in the market cap weight of tech within benchmark indices. Chart 22US High Profit Margins Are Concentrated Amongst Top Firms
What Has Driven US Outperformance Post-GFC And Can This Persist?
What Has Driven US Outperformance Post-GFC And Can This Persist?
Aside from these reasons, two more factors could lead to the compression of US profit margins over the next few years. Firstly, it is worth noting that the US' high profit margins are unusually concentrated amongst a handful of firms. While the US as a market is characterized by high margins at the headline level, profit margins of companies below the top tier are notably lower than that of the top tier (Chart 22). If profit margins were uniformly high across the US listed space and the divergence was low, then the probability of sustaining elevated margins would have been higher. But given that the US uniquely suffers from a high profit margin concentration problem, the probability of the sustainability of US high profit margins appears lower. Secondly, history suggests that in the globalized world that we live in, any region’s profit margins fail to persist above the global average beyond a maximum of 15 years (Table 2). This makes sense and is in line with economic theory which suggests that when profitability in a particular market is excessive, then new firms will enter this space, increase competition, and thereby exert downward pressure on the incumbents’ profit margins. Table 2Regional Profit Margins Seldom Persist Above The Global Average Beyond 15 Years
What Has Driven US Outperformance Post-GFC And Can This Persist?
What Has Driven US Outperformance Post-GFC And Can This Persist?
Given that US profit margins have now persisted above global levels for almost 13 years, if history were to repeat itself, then it appears highly likely that US profit margins would trend towards the global average over the next 2 years. US Sales Growth: A Peak Appears Nigh We now know that the rapid sales expansion experienced by US firms has been the prime driver of the US stock market outperformance since the GFC. However, the prognosis for this variable also appears shaky for the US. Chart 23US GDP And Sales Tend To Move In Lockstep
What Has Driven US Outperformance Post-GFC And Can This Persist?
What Has Driven US Outperformance Post-GFC And Can This Persist?
The key macro variable which has the tightest theoretical link to the sales generated by the companies in a country is the country’s nominal GDP. Even as companies headquartered in the US end up selling to the global economy, history suggests that the link between the US’ nominal GDP and the sales generated by listed American firms are closely linked (Chart 23). Given that the pace of US nominal GDP growth is set to slow over the next few years (relative to both its past and relative to other major economies), US companies’ sales growth could end up slowing too (Chart 24). Also, given that the US revenue-to-nominal GDP ratio is already elevated, it is likely that even as the US’ nominal GDP keeps growing, the pace of conversion of this GDP into revenues will stay the same or may even diminish over the coming decade. Chart 24US GDP Growth Is Set To Slow
What Has Driven US Outperformance Post-GFC And Can This Persist?
What Has Driven US Outperformance Post-GFC And Can This Persist?
Then from a bottom-up perspective, we are also of the view that the US economy’s ability to spawn mega-sized companies (by sales) may become increasingly compromised over the next decade. This is because a peculiar stagnation is in the works in the middle tier of American firms, which tend to become the mega-sized corporations of tomorrow. Finally, the US' antitrust philosophy is likely to undergo a once-in-a-generation change under the Biden administration. This could mean that America’s mega-scaled firms (which have had a free run up until now) could end-up baiting regulatory attention, restricting their ability to grow sales. US Price Performance: Strong Sector Effects Are Unlikely To Persist Chart 25Sector Composition Effect: Strongest For The US
What Has Driven US Outperformance Post-GFC And Can This Persist?
What Has Driven US Outperformance Post-GFC And Can This Persist?
Lastly, it is worth noting that the price performance of the broad US equity index subverts the role played by “sector composition” in driving the US' outperformance. The fact that returns generated by the US benchmark are higher than the returns generated by a hypothetical US index which weights all sectors equally suggests that “sector composition” effects had a meaningful role in driving US outperformance. In fact, as compared to other major markets, the sector composition effect is the most prominent for the US (Chart 25). Another way of quantifying the role of sector effects is to compare the US’ market cap expansion relative to a global benchmark after removing the market cap of top-performing sectors. Expectedly, US outperformance relative to the global benchmark over the post-GFC period gets substantially reduced if the market cap of the three top-performing sectors (namely Information Technology, Consumer Discretionary, and Health Care) is adjusted for (Chart 26). To complicate matters, the sector composition effect in the US has been unwinding but remains high (Chart 27). Given that we expect outperforming sectors like Tech to turn into underperformers, the sector constitution effect in the US could weaken going forward, thereby subverting another source of US outperformance. Chart 26Extent Of US Outperformance Weakens Sans Tech, Consumer Discretionary, And Health Care
What Has Driven US Outperformance Post-GFC And Can This Persist?
What Has Driven US Outperformance Post-GFC And Can This Persist?
Chart 27Sector Composition Effect In The US Remains High
What Has Driven US Outperformance Post-GFC And Can This Persist?
What Has Driven US Outperformance Post-GFC And Can This Persist?
Investment Conclusions The prime drivers of US outperformance relative to the global benchmark in the post-GFC period have been ascendant sales and rising net profit margins. Forecasting is a tenuous science but given that both these propellers of the US equity market engine are set to face headwinds, investors should consider reducing allocations to US equities over a longer term, strategic horizon. Ritika Mankar, CFA Editor/Strategist Ritika.Mankar@bcaresearch.com
Executive Summary Higher Brent Prices, Stronger Upside Bias
Higher Brent Prices, Stronger Upside Bias
Higher Brent Prices, Stronger Upside Bias
The Fed is pacing a globally synchronized monetary-policy tightening cycle as the war in Ukraine escalates, following Russia’s mobilization of 300k reserve forces. Despite central-bank tightening, the intensification of the war increases the odds of higher inflation. This will keep the USD well bid. Russia’s threat to cut oil supplies to states observing the G7 price cap will test US and EU resolve as winter sets in. Retaliatory output cuts by Russia could send Brent crude oil prices above $200/bbl. The Biden administration remains fearful its G7 price cap and EU sanctions on Russian oil exports will spike prices. The US will make 10mm barrels of crude from its SPR available in November as a palliative. Our base case Brent forecast is slightly lower, averaging $105/bbl this year from $110/bbl, due to weaker realized prices. On the back of this, we expect 4Q22 Brent to average $106/bbl, and for 2023 to average $118/bbl, up slightly vs. last month. WTI will trade $3-$5/bbl lower. Bottom Line: The economic war pitting the EU and its allies against Russia could escalate and widen as more Russian troops pour into Ukraine. This raises the odds of expanded conflict outside Ukraine, and higher war-driven inflation. Our baseline forecast for 2023 remains intact, with a strong bias to the upside. We remain long the COMT and XOP ETFs to retain exposure to commodities. Feature The Fed is pacing a globally synchronized monetary-policy tightening cycle at a time when the war in Ukraine is escalating. Russia’s mobilization of a reported 300k reserve forces raises the spectre of an expansion of the Ukraine war – perhaps crossing into a NATO state’s border – if tactical nuclear, biological, or chemical weapons are used. This is a low-probability outcome, but it would increase the odds of significantly higher inflation should it come to pass.1 The US central bank lifted its Fed funds rate 75 bps Wednesday to a range of 3% - 3.25% – and strongly indicated further rate hikes will follow. The Fed is one of numerous banks increasing policy rates. This synchronous monetary-policy tightening has not been observed for 50 years, and raises the odds of a global economic recession, according to the World Bank.2 The World Bank notes that since 1970, recessions have been “preceded by a significant weakening of global growth in the previous year, as has happened recently,” and, importantly, “all previous global recessions coincided with sharp slowdowns or outright recessions in several major economies.” The withdrawal of monetary and fiscal support “are necessary to contain inflationary pressures, but their mutually compounding effects could produce larger impacts than intended, both in tightening financial conditions and in steepening the growth slowdown.” Markets are acting in a manner consistent with this assessment, but, in our view, need to expand the risk set to include a higher likelihood of a war widening beyond Ukraine. While this is not our base case, it is worthwhile recalling the link between war and inflation. Prior to and during the 20th century’s two world wars, then the Korean and Vietnam wars, US CPI inflation rose sharply (Chart 1).3 Price controls and tighter monetary policy were needed to address these inflationary episodes. Chart 1A Wider Ukraine War Would Stoke Inflation
Oil Markets Anxiously Enter 4Q22
Oil Markets Anxiously Enter 4Q22
Stronger USD Remains Oil-Demand Headwind Fed policy will continue to push US interest rates higher, which will push the USD higher on the back of continued global demand for dollar-denominated assets. This will keep the cost of most commodities ex-US higher in local currency terms, which, all else equal, will weaken commodity demand in general, and oil demand in particular. This will be compounded if tighter monetary policy at systemically important central banks (led by the Fed) results in a global recession in 2023. This is especially true for EM oil demand: The income elasticity of EM oil consumption is 0.61, which means a 1% decrease (increase) in real EM GDP translates into a 0.61% decrease (increase) in oil demand, all else equal. In our base case, we expect global oil demand to grow 2.2mm b/d this year and 1.91mm b/d next year, roughly in line with the US EIA’s and IEA’s estimates (Chart 2). We expect EM demand will increase 1.25mm b/d this year, and 1.90mm b/d next year, accounting for almost all of global growth. As before, we expect China’s oil demand growth to be de minimus this year, on the back of its zero-tolerance COVID-19 policy. EM remains the key driver of our global oil demand assumptions, which, in our modeling, are a function of real income (GDP). Offsetting the stronger USD effects on demand is gas-to-oil switching demand, resulting from record-high LNG prices this year. This will add 800k b/d to demand globally this winter (November – March). Chart 2Global Oil Demand Holding Up
Global Oil Demand Holding Up
Global Oil Demand Holding Up
Oil Supply Getting Tighter Oil supply will remain challenged this year and next, as core OPEC 2.0 – the Kingdom of Saudi Arabia (KSA) and the United Arab Emirates (UAE) – approaches the limit of what it can supply to the market and still retain sufficient spare capacity to meet unexpected supply shocks (Chart 3). Among the anticipated shocks we believe core OPEC 2.0 is aware of is the loss of 2mm b/d of Russian crude oil output over the next year, due to the imposition of EU embargoes on seaborne crude oil and refined products, which will go into effect 5 December 2022 and 5 February 2023, respectively. The continued inability of non-core OPEC 2.0 states to maintain higher production – “The Other Guys” in our nomenclature – is another foreseeable shock (Chart 4). This is becoming acute for OPEC 2.0, given The Other Guys account for most of the 3.6mm b/d of below-quota output currently registered by the producer coalition.4 This is a record gap between expected production and actual production from OPEC 2.0, which was registered in August. Chart 3Core OPEC 2.0 Conserves Supplies
Oil Markets Anxiously Enter 4Q22
Oil Markets Anxiously Enter 4Q22
Chart 4'Other Guys' Production Keeps Falling
Oil Markets Anxiously Enter 4Q22
Oil Markets Anxiously Enter 4Q22
Net, demand will continue to outpace supply in our base case (Chart 5, Table 1). This will require continued inventory draws for the next year or so, as core OPEC 2.0 continues to conserve supplies (Chart 6). Chart 5Demand Continues To Outpace Supply
Demand Continues To Outpace Supply
Demand Continues To Outpace Supply
Chart 6Inventory Will Continue Drawing
Inventory Will Continue Drawing
Inventory Will Continue Drawing
Table 1BCA Global Oil Supply - Demand Balances (MMb/d, Base Case Balances) To Dec23
Oil Markets Anxiously Enter 4Q22
Oil Markets Anxiously Enter 4Q22
Russian Wild Card Battlefield losses in Ukraine are forcing Russia’s military to activate some 300k reserve troops. These losses again are prompting veiled threats to deploy nuclear and perhaps chemical weapons, which drew a sharp warning from US President Biden.5 Further economic losses will begin mounting in a little more than two months, as the first of two major EU oil-import embargoes and a ban on insuring/re-insuring vessels carrying Russian crude and products takes hold. In addition, a US-led G7 price cap on Russian oil purchases will go into effect with the December embargo on seaborne crude imports into the EU.6 We continue to expect Russia will be forced to shut in ~ 2mm b/d of crude oil production by the end of next year – taking output from a little more than 10mm b/d to ~ 8mm b/d.7 Russian’s President Putin already has threatened to cut off oil supplies to anyone abiding by the G7 price cap.8 In our modeling, a unilateral 2mm b/d cut in Russian output – in addition to the lost sales from the EU embargoes and insurance/reinsurance bans – would take Brent prices above $200/bbl (Chart 7). On the downside, a severe global recession that removes 2mm b/d of demand next year could send prices below $60/bbl. Equally plausible cases for either outcome can be made, given current supply-demand fundamentals and the geopolitical backdrop discussed above. This can be seen in the lack of skew in the options markets, which is measured by the difference in out-of-the-money call and put implied volatilities (Chart 8). The skew sits close to zero at present – meaning options buyers are not giving higher odds to a sharp upside or downside move at present.9 Chart 7Higher Brent Prices, Stronger Upside Bias
Higher Brent Prices, Stronger Upside Bias
Higher Brent Prices, Stronger Upside Bias
Chart 8Option Skew Shows Up Or Down Moves Equally Likely
Option Skew Shows Up Or Down Moves Equally Likely
Option Skew Shows Up Or Down Moves Equally Likely
In our modeling and analysis, we continue to believe the balance of risk is to the upside. As can be seen in Chart 6, inventories are below the 2010-14 five-year average – OPEC 2.0’s original target when it was formed – which means KSA and the UAE will be able to respond to any demand shocks that cause unintended inventory accumulation (e.g., the sort that occurred during the COVID-19 pandemic or the OPEC market-share war of 2015-16). Managing the upside risk is more difficult: KSA and the UAE are close to the limits of what they can supply and still carry sufficient spare capacity to meet unexpected production losses. KSA’s crude oil output is just over 11mm b/d, and the UAE’s is at 3.2mm b/d, according to OPEC’s Monthly Oil Market Report. This puts both within 1mm b/d of their max production capacity of 12mm and 4mm b/d. Both got close to producing at these max levels in early 2020, when Russia provoked a market share war; this was quickly reversed as a magnitude of the COVID-19 demand destruction became apparent. The only other large producer outside the OPEC 2.0 coalition capable of increasing and sustaining higher output is the US shales, which are producing at 7.8mm b/d and have pushed total US crude oil output to 12.2mm b/d (Chart 9). Leading producers in the shales have foreclosed any sharp increase in output this year, given tight labor markets and services and equipment markets in the US. Chart 9US Shales Close To Max Output
US Shales Close To Max Output
US Shales Close To Max Output
Investment Implications Global crude oil markets remain tight, with demand continuing to exceed supply. The risk that the economic war pitting the EU and its allies against Russia could expand to a more kinetic confrontation involving additional states is higher, as more Russian troops are called up to serve in Ukraine. If the additional troops do not reverse Russia’s battlefield losses – or if Ukraine looks like it will win this war – Putin likely will feel cornered, and get more desperate.10 We believe Putin will first attempt to impose as much economic pain on the West as possible by cutting off all natural gas and oil flows to the EU and states and firms observing the G7 price cap. However, if that does not force the West to relent on its economic war with Russia, a war with NATO could evolve in which tactical nukes or other weapons of mass destruction are employed. At that point, Putin would have concluded there would be nothing he could do to restore Russia’s standing as a world power. Any plume – nuclear, biological or chemical (NBC) – that crosses a NATO border likely would be treated as an act of war. NATO would have to act at that point. This is not our expectation, nor is it any part of our base case. But it is a higher non-trivial risk than it was last month or last week. This raises the odds of higher war-driven inflation, as well, which will further complicate central-bank monetary policy at a time of war. Our baseline forecast remains intact, with a strong bias to the upside. We remain long the COMT and XOP ETFs to retain exposure to commodities. Robert P. Ryan Chief Commodity & Energy Strategist rryan@bcaresearch.com Ashwin Shyam Research Analyst Commodity & Energy Strategy ashwin.shyam@bcaresearch.com Paula Struk Research Associate Commodity & Energy Strategy paula.struk@bcaresearch.com Commodities Round-Up Energy: Bullish In its September update, the US EIA reported natural gas consumption will hit record levels in 2022, increasing by 3.6 Bcf/d to just under 87 Bcf/d on average, led by increases in the electric power residential and commercial sectors (Chart 10). US natural gas consumption in the electric power sector will increase in 2022 due to limitations at coal-fired power plants and weather-driven demand. It is expected to decrease in 4Q22 and in 2023, due to more renewable electricity generation capacity. Natural gas consumption in the residential and commercial sectors for 2023 is expected to be similar as 2022 levels. Base Metals: Bullish According to Eurometaux, a consortium of European metal producers, approximately 50% of the EU’s zinc and aluminum production capacity is offline due to high power prices. More operations are expected to shut as European power prices remain elevated and metal prices drop on recessionary fears (Chart 11). The decision to reopen a smelter following a shutdown is expensive and can result in long wait times. This will make the bloc’s manufacturers heavily reliant on metal imports from other states, which likely will lead to higher pollution from these plants. Aluminum supply is particularly vulnerable to this power crisis since one ton needs an eye-watering 15 megawatt-hours of electricity – enough to power five homes in Germany for a year. Precious Metals: Neutral The Fed’s additional 75-bps rate hike will strengthen the USD and weaken gold prices. Geopolitical risk has been a tailwind for the greenback thus far, as investors rush to the USD instead of the yellow metal for safe-haven investments. If this trend continues, along with further Fed rate increases, the additional risk arising from Putin’s reserve force mobilization and possible expansion of the Ukraine war will boost the USD and leave gold in the doldrums. Chart 10
Oil Markets Anxiously Enter 4Q22
Oil Markets Anxiously Enter 4Q22
Chart 11
Oil Markets Anxiously Enter 4Q22
Oil Markets Anxiously Enter 4Q22
Footnotes 1 Please see Vladimir Putin mobilises army reserves to support Ukraine invasion, published by ft.com on September 21, 2022. 2 Please see Is a Global Recession Imminent?, published by the World Bank on September 15, 2022. The report notes, “Policymakers need to stand ready to manage the potential spillovers from globally synchronous withdrawal of policies supporting growth. On the supply-side, they need to put in place measures to ease the constraints that confront labor markets, energy markets, and trade networks.” 3 Please see One hundred years of price change: the Consumer Price Index and the American inflation experience, published by the US Bureau of Labor Statistics in April 2014. 4 Please see OPEC+ supply shortfall now stands at 3.5% of global oil demand, published 20 September 2022 by reuters.com. 5 Please see Biden warns Putin over nuclear, chemical weapons, published by politico.eu on September 17, 2022. 6 Please see EU Russian Oil Embargoes, Higher Prices, which we published on August 18, 2022, for discussion. 7 We include Russia among “The Other Guys” in our balances estimates. 8 Please see Explainer: The G7's price cap on Russian oil begins to take shape, published by reuters.com on September 19, 2022. 9 We use the standard measure of skew – i.e., the difference between 25-delta calls and puts – to determine whether option market participants are discounting a higher likelihood of an up or down move, respectively. 10 Please see CIA director warns Putin's 'desperation' over Russia's failures in Ukraine could lead him to use nukes, published by businessinsider.com on April 15, 2022. Investment Views and Themes Strategic Recommendations Trades Closed in 2022
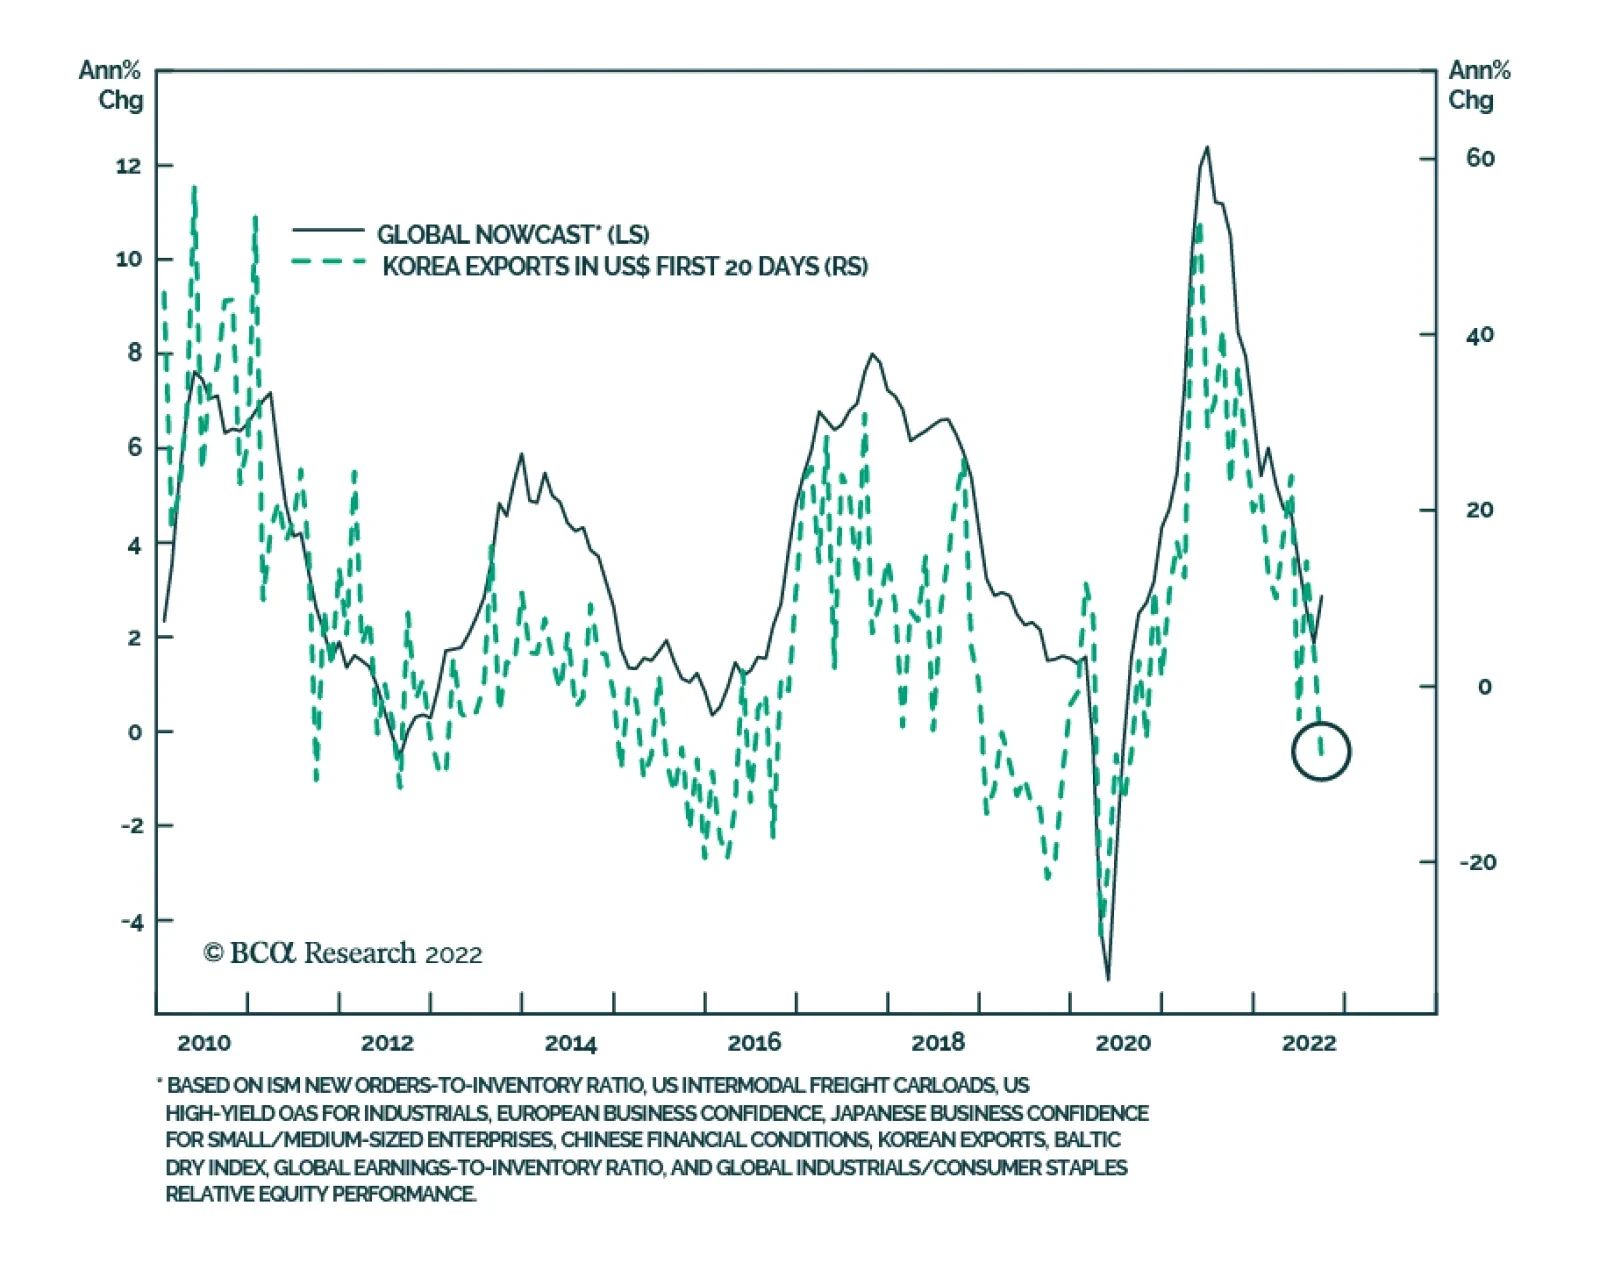
South Korea’s exports in the first 20 days of September are signaling that global trade is weakening sharply. Exports fell by 8.7% y/y following a 3.8% y/y increase in the prior month. That said a fewer number of working days is in part to blame for this…
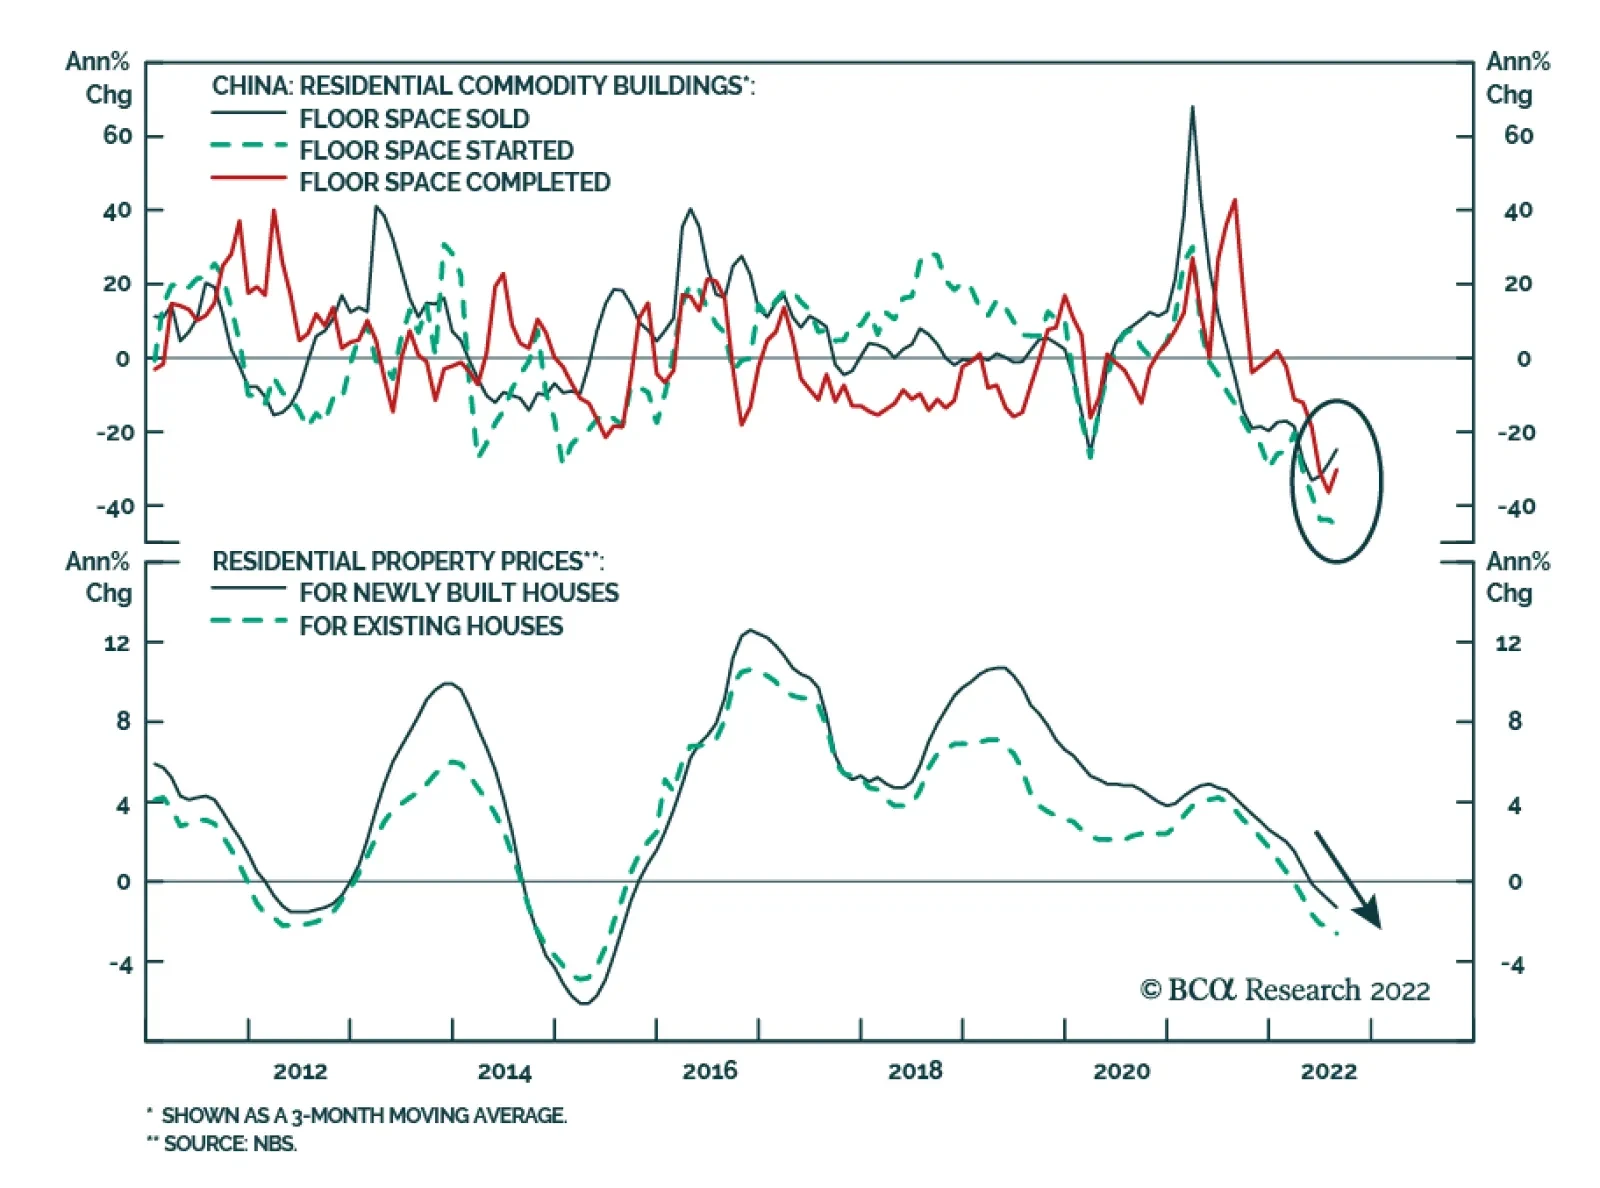
According to BCA Research’s China Investment Strategy service, China’s property market continues to face potent headwinds. China’s property market woes continued in August with a further weakening in housing market indicators. Home sales tumbled by 25% in…
Executive Summary The Chinese Economy Is Facing Deflationary Pressures
The Chinese Economy Is Facing A Risk of Deflation
The Chinese Economy Is Facing A Risk of Deflation
China’s economy is facing a deflationary threat. Core consumer price inflation is below 1%, and producer (ex-factory) price inflation has decelerated rapidly and will soon deflate. Bank loan growth remains subdued due to the deepening property market slump and lackluster credit demand in the private sector. In view of the reluctance of households and enterprises to spend, invest and hire, the multiplier of stimulus in this cycle will be lower than in previous ones. China’s property market woes continued in August and a turnaround is not likely in the near term. China’s overseas shipments are set to contract in the months ahead. China needs to reduce interest rates and weaken its exchange rate to battle deflationary pressures and reflate the system. Thus, Chinese authorities will not prevent a further depreciation in the yuan versus the US dollar - as long as the decline is orderly and gradual. Bottom Line: The risk-reward profile remains unattractive for Chinese stocks in absolute terms. For global equity portfolios, we recommend a neutral allocation to Chinese onshore stocks and an underweight stance in investable stocks. Escalating deflationary pressures mean that onshore asset allocators should continue to favor government bonds over stocks. Recovery prospects for China’s economy remain dim. Despite August’s better-than-expected growth in industrial output and retail sales, economic activity in the months ahead will be weighed down by a lingering real estate slump, recurring disruptions linked to Covid and a budding contraction in exports. Related Report China Investment StrategyThe Party Congress And Beyond As discussed in our previous report, China’s transition from zero Covid tolerance to a managed approach to living with the virus will be a measured but protracted process. The conditions are not yet in place for a pivotal change in the country’s dynamic zero-Covid strategy. Thus, the risk of outbreaks and ensuing lockdowns still constitute a major hurdle for private domestic demand in the near term. China’s exports are set to shrink in the coming months due to a relapse in global demand for consumer goods (ex-autos). Domestic and external headwinds confronted by China underscore that the primary economic risk is deflation. Chinese policymakers need to lower interest rates and allow the currency to depreciate to battle deflationary pressures. Odds are high that the PBoC will cut rates further. However, the efficacy of reflationary efforts is doubtful due to three factors: uncertainty over the dynamic zero-Covid policy and the outlook for Omicron; persistent real estate woes; and the downbeat sentiment among corporates and households. Chart 1Upsides In Chinese Equity Prices Are Capped Without Aggressive Stimulus
Upsides In Chinese Equity Prices Are Capped Without Aggressive Stimulus
Upsides In Chinese Equity Prices Are Capped Without Aggressive Stimulus
Therefore, our outlook for China’s business cycle remains a U-shaped recovery with risks skewed to the downside in the next few months. Consistently, the risk-reward of Chinese stocks remains poor. Their absolute performance is also at risk from a further selloff in US/global equities as discussed in the latest Emerging Markets Strategy report. We continue to recommend a neutral stance on Chinese onshore stocks and underweight allocation for Chinese offshore stocks within a global equity portfolio (Chart 1). Depressed Credit Demand And Low Stimulus Multiplier Demand for credit from China’s private sector remains depressed, reflected by a very muted credit impulse when local government bond issuance is excluded (Chart 2). Critically, banks have been unable to accelerate the pace of lending even after the PBoC cut rates and urged them to boost lending (Chart 3). Chart 2The Credit Impulse Remains Muted
The Credit Impulse Remains Muted
The Credit Impulse Remains Muted
Chart 3Subdued Loan Growth Despite Lower Interest Rates
Subdued Loan Growth Despite Lower Interest Rates
Subdued Loan Growth Despite Lower Interest Rates
The growth rate of medium-to-long-term consumer loans, which are primarily composed of residential mortgages, continues to plunge (Chart 4, top panel). New household loan origination is contracting (Chart 4, bottom panel). Our proprietary measure of marginal propensity to spend for households dropped to an all-time low, mirroring consumers’ downbeat sentiment (Chart 5). Chart 4Household Loan Demand Is Depressed...
Household Loan Demand Is Depressed...
Household Loan Demand Is Depressed...
Chart 5...And Sentiment Remains in The Doldrums
...And Sentiment Remains in The Doldrums
...And Sentiment Remains in The Doldrums
Corporate credit flow improved slightly with medium-to-long-term corporate loan growth ticked up in August (Chart 6). While it is difficult to quantify, it is likely that the recent modest improvement in corporate loan growth was mainly due to state-owned banks’ lending to local government financing vehicles (LGFV) to purchase land. The latter is de-facto bailing out local governments that heavily depend on land sales. Land transfer revenues made up 23% of local government aggregate expenditure in the past 12 months (Chart 7). Chart 6Corporate Loan Growth Slightly Improved In August
Corporate Loan Growth Slightly Improved In August
Corporate Loan Growth Slightly Improved In August
Chart 7Land Sales Are Critical For Local Government Financing
Land Sales Are Critical For Local Government Financing
Land Sales Are Critical For Local Government Financing
Chart 8Corporates' Investment Sentiment Is Worsening
Corporates' Investment Sentiment Is Worsening
Corporates' Investment Sentiment Is Worsening
Consistent with poor business sentiment, enterprises’ investment expectation deteriorated in August (Chart 8). Given private-sector’s reluctance to borrow, the multiplier of stimulus will be lower than that in previous cycles. Consequently, China’s policymakers have no choice but to bump up fiscal stimulus and cut interest rates even more. Property Market: No Turnaround In Sight Yet China’s property market woes continued in August with a further weakening in housing market indicators (Chart 9). Home sales tumbled by 25% in August from a year ago. Real estate investment shrinkage deepened and home price deflation accelerated. Property market indicators probably will begin to show a rate-of-change improvement in the coming months due to a more favorable base effect. However, their annual growth rates will remain deeply negative, probably posting a double-digit retrenchment from a year ago. In brief, the level of housing sales will continue withering (Chart 10, top panel). Chart 9Housing Market Activity And Prices
Housing Market Activity And Prices
Housing Market Activity And Prices
Chart 10Shrinking Sales = Less Funding
Shrinking Sales = Less Funding
Shrinking Sales = Less Funding
Shrinking home sales mean a scarcity of funding for real estate developers who heavily rely on advance payments from homebuyers to finance their projects (Chart 10, middle and bottom panels). Hence, a contraction in property investment will remain intact for the next three to six months and housing construction activities will stay depressed (Chart 11). Chart 11Less Funding = Reduced Completions And Investments
Less Funding = Reduced Completions And Investments
Less Funding = Reduced Completions And Investments
Chart 12Households Are Reluctant To Buy When House Prices Are Falling
Households Are Reluctant To Buy When House Prices Are Falling
Households Are Reluctant To Buy When House Prices Are Falling
Interestingly, to revive housing sales, Guangzhou (a southern Chinese metropolis) plans to loosen price controls to allow new house prices to drop up to 20%. Other provinces might follow suit. This would eventually make housing more affordable, but homebuyers might be reluctant to buy until house prices bottom (Chart 12). Therefore, an imminent rebound in home sales is unlikely. Overseas Shipments Are Set To Shrink China’s export growth, in both value and volume terms, slowed noticeably in August. The global demand for goods continues to dwindle, which does not bode well for Chinese overseas shipments. Imports for processing trade,1 which historically led China’s exports growth by three months, sank in August (Chart 13). In addition, Shanghai’s export container freight index has plummeted sharply (Chart 14). Both signal an impending shrinkage in the country’s exports volume. Chart 13Plummeted Processing Imports Herald A Downtrend In Exports
Plummeted Processing Imports Herald A Downtrend In Exports
Plummeted Processing Imports Herald A Downtrend In Exports
Chart 14A Sign Of Exports Relapse
A Sign Of Exports Relapse
A Sign Of Exports Relapse
Notably, the country’s exports to the US began to wither in August and this trend will only accelerate in the months ahead. We elaborated on the reasons for the global trade contraction in a previous report. Consistently, the continued underperformance of global cyclical stocks versus defensives, which historically has been a good leading indicator of global manufacturing cycles, points to a worldwide manufacturing downturn (Chart 15). This will be bad news for China, which is the largest manufacturing hub in the world. Deflationary Pressures Will Intensify The Chinese economy is facing a deflationary threat with core consumer inflation below 1% and producer (ex-factory) price inflation falling sharply (Chart 16). Chart 15Global Manufacturing Is Heading Into A Contraction
Global Manufacturing Is Heading Into A Contraction
Global Manufacturing Is Heading Into A Contraction
Chart 16The Chinese Economy Is Facing A Risk of Deflation
The Chinese Economy Is Facing A Risk of Deflation
The Chinese Economy Is Facing A Risk of Deflation
As weaknesses in domestic demand, real estate price and exports deepen, deflationary pressures in the mainland economy will likely intensify. Producer prices will begin deflating in the coming months. Manufactured goods prices have already deflated modestly, which will dampen investment in the industrial sector (Chart 17). Deflationary pressures are set to proliferate given that manufacturing output accounts for one-third of China’s GDP and manufacturing investment accounts for 32% of the nation’s overall fixed-asset investment. Investment in the real estate sector deteriorated severely in August. The downtrend in manufacturing and property investments will cap China’s overall capital spending growth through the end of this year, despite the ongoing rebound in infrastructure investment (Chart 18). Chart 17Manufacturing Prices Are Deflating
Manufacturing Prices Are Deflating
Manufacturing Prices Are Deflating
Chart 18Weakness In Property And Manufacturing Investments Will Cap Overall Capital Spending
Weakness In Property And Manufacturing Investments Will Cap Overall Capital Spending
Weakness In Property And Manufacturing Investments Will Cap Overall Capital Spending
Chart 19Sluggish Household Consumption
Sluggish Household Consumption
Sluggish Household Consumption
Weak income growth and an unwillingness by consumers to spend have taken a heavy toll on retail sales and the service sector since early this year. The growth in goods sales volume edged up in August but remains lackluster and well below pre-pandemic levels (Chart 19). In addition, online retail sales of services continued to shrink (Chart 19, bottom panel). More Downside In The RMB China needs to reduce its interest rates and weaken its exchange rate to battle deflationary pressures. Therefore, Chinese authorities will not mind more deterioration in the yuan versus the US dollar as long as it is gradual. The PBoC lowered the banks’ foreign exchange (FX) deposit reserve requirement ratio (RRR) from 8% to 6%, effective September 15. However, this will have little impact on altering the current weakening trend of the RMB. The balance of FX deposits at commercial banks was US$910 billion at the end of August. A 2% decrease in the FX deposit reserve ratio will only free about US$18 billion in FX liquidity, which is not large compared with US$80 billion in China’s net portfolio outflows through bond and stock connects so far this year. Capital outflows from China will likely persist for the next few months due to the disappointing economic recovery and widening interest rate differential relative to the US (Chart 20). Moreover, slumping exports will heighten selling pressures on the yuan and increase the government’s tolerance for a weaker currency. The FX settlement rate by banks on behalf of clients has continued to drop, which reflects the reluctance of exporters to sell their foreign currency receipts to banks on the expectation that the RMB will weaken even more (Chart 21). Chart 20China-US Rate Differentials Indicate RMB Depreciation
China-US Rate Differentials Indicate RMB Depreciation
China-US Rate Differentials Indicate RMB Depreciation
Chart 21Contracting Exports Will Weigh On The RMB
Contracting Exports Will Weigh On The RMB
Contracting Exports Will Weigh On The RMB
Furthermore, despite a 12% depreciation against the US dollar since this March, the RMB remains strong in trade-weighted terms (Chart 22). Finally, the RMB is modestly cheap, which does not constitute sufficient conditions for the exchange rate reversal, especially when macro fundamentals warrant a weaker currency (Chart 23). In short, we expect that the RMB has another 5% to fall versus the US dollar. Chart 22RMB Is Strong In Trade-Weighted Terms
RMB Is Strong In Trade-Weighted Terms
RMB Is Strong In Trade-Weighted Terms
Chart 23The RMB Is Modestly Cheap But Might Undershoot
The RMB Is Modestly Cheap But Might Undershoot
The RMB Is Modestly Cheap But Might Undershoot
Stay Cautious On Chinese Equities Deflationary pressures confronted by the Chinese economy suggest that onshore asset allocators should continue to favor government bonds over stocks (Chart 24). Chart 24China's Onshore Stock-To-Bond Ratio Will Continue Relapsing
China's Onshore Stock-To-Bond Ratio Will Continue Relapsing
China's Onshore Stock-To-Bond Ratio Will Continue Relapsing
Chart 25A-Shares Have Broken Below Their 6-Year Moving Average
A-Shares Have Broken Below Their 6-Year Moving Average
A-Shares Have Broken Below Their 6-Year Moving Average
The onshore CSI 300 stock index had broken through its 6-year moving average technical support, which will become new resistance for the index (Chart 25). The Hang Seng Tech index, which tracks Chinese offshore tech stocks/platform companies, has failed to break above its 200-day moving average (Chart 26). The above tell-tale signs raise the odds of cyclical new lows in these indexes. Within Chinese equities, we continue to recommend overweighting interest rate sensitive sectors, such as consumer staples, utilities and autos (Chart 27). Chart 26Chinese Tech Stocks Still Appear Brittle
Chinese Tech Stocks Still Appear Brittle
Chinese Tech Stocks Still Appear Brittle
Chart 27Interest Rate Sensitive Sectors Benefit From Loosening Monetary Conditions
Interest Rate Sensitive Sectors Benefit From Loosening Monetary Conditions
Interest Rate Sensitive Sectors Benefit From Loosening Monetary Conditions
Finally, we reiterate our long A-share index / short MSCI Investable stock index recommendation, a position we initiated in March 2021. Qingyun Xu, CFA Associate Editor qingyunx@bcaresearch.com Table 1China Macro Data Summary
China: Battling Deflationary Pressures
China: Battling Deflationary Pressures
Table 2China Financial Market Performance Summary
China: Battling Deflationary Pressures
China: Battling Deflationary Pressures
Footnotes 1 Processing trade refers to the business activities of importing raw materials, components and accessories, and then re exporting the finished products after processing or assembly. Strategic Themes Cyclical Recommendations
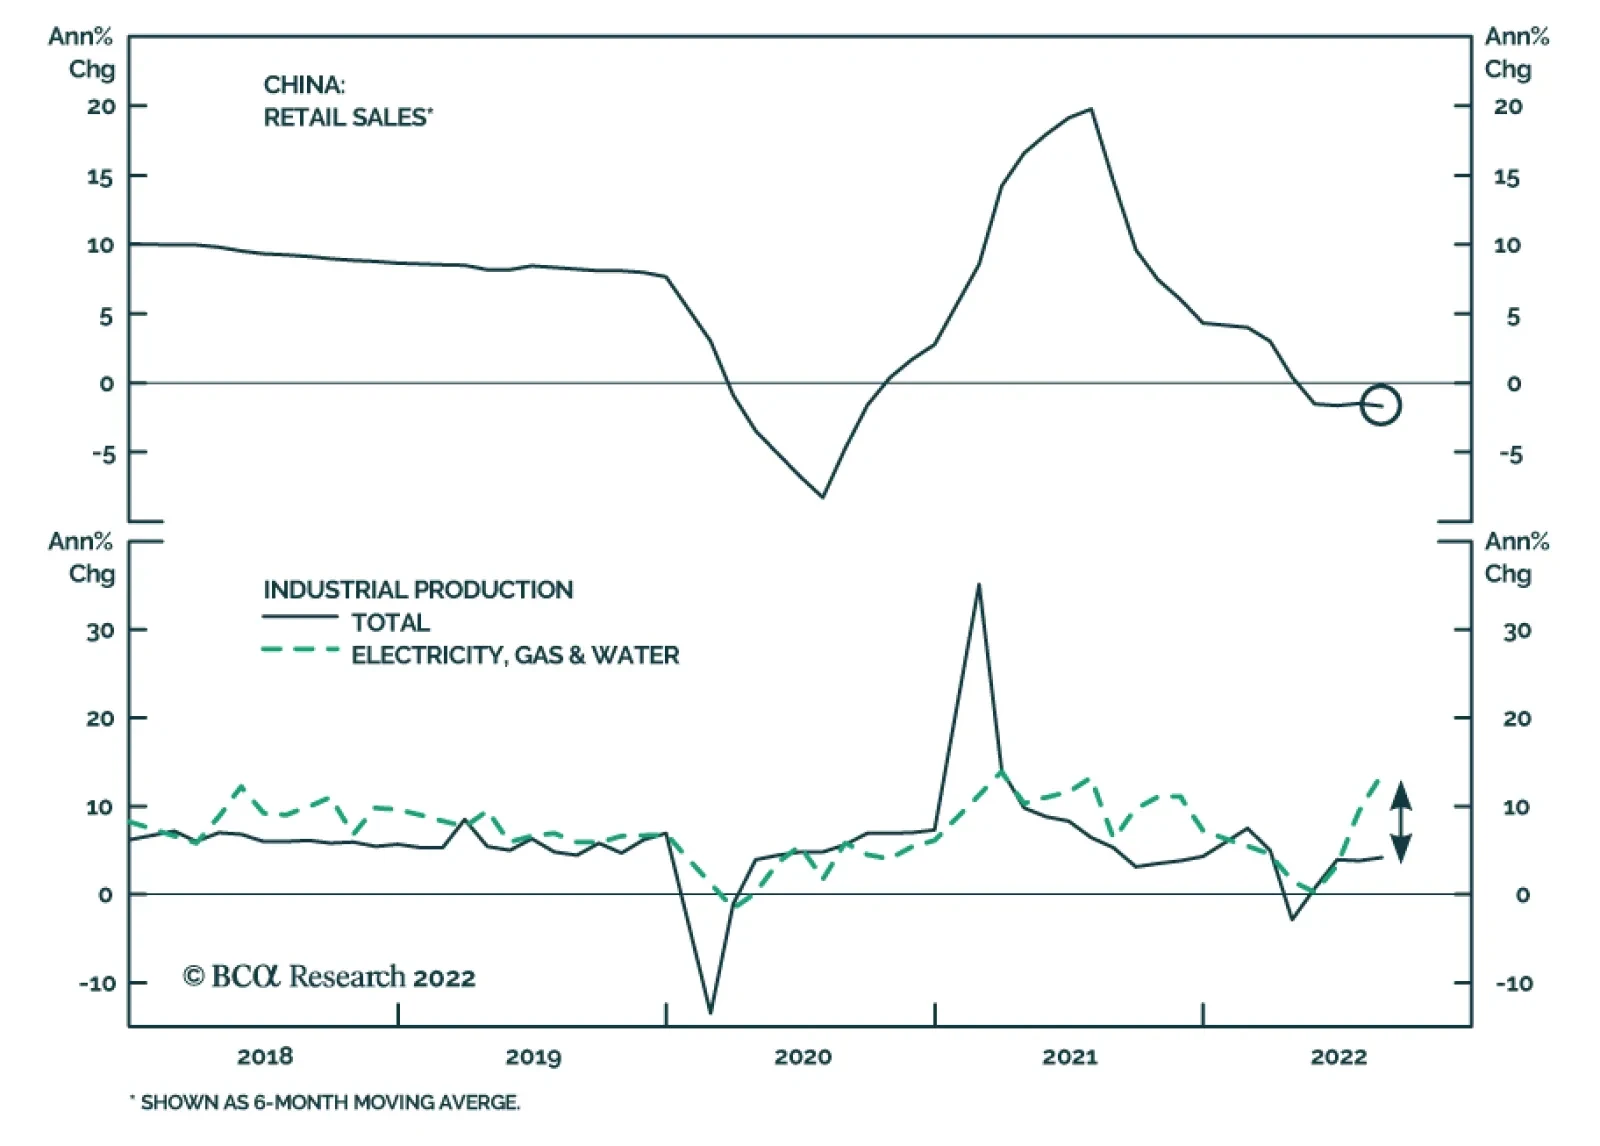
On the surface, Chinese industrial production, retail sales and fixed asset investments appeared to improve in August. Industrial production rose by 4.2% y/y following 3.8% y/y in July, retail sales growth accelerated to 5.4% y/y from 2.7% y/y, and fixed…
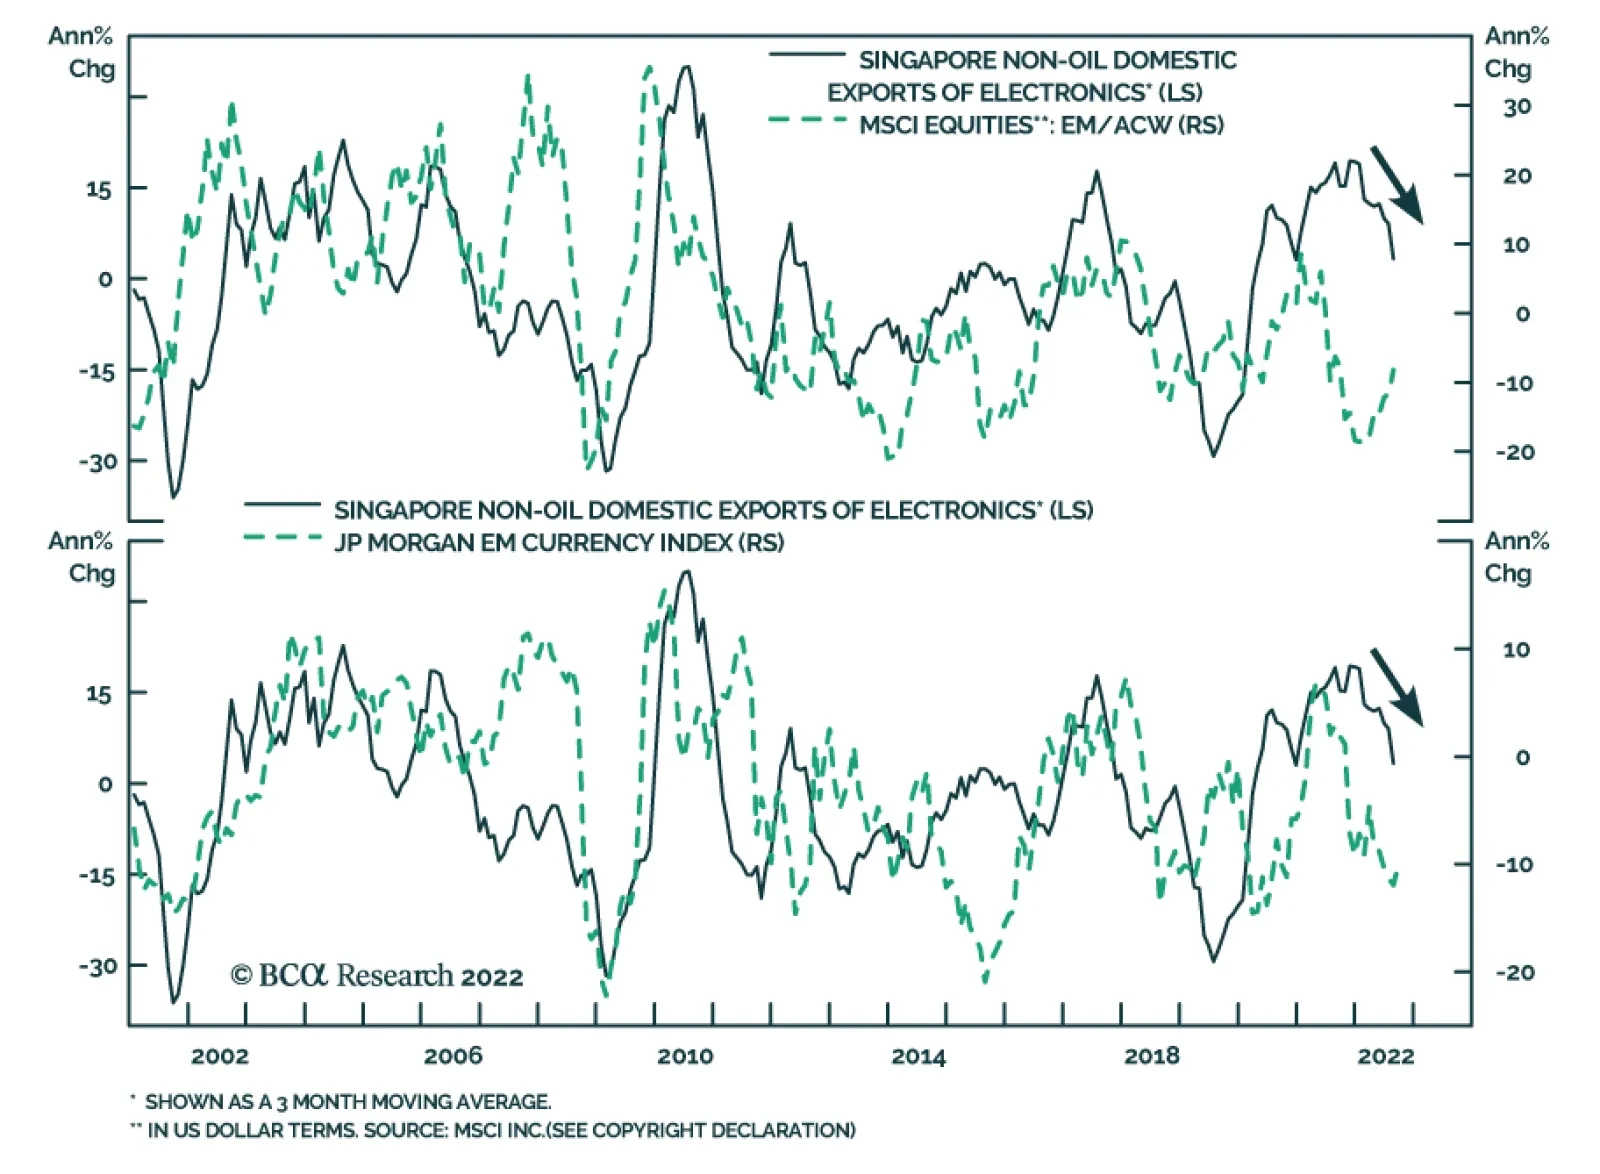
The pulse from Singapore’s trade numbers continue to send a warning about the global trade cycle. Singapore’s non-oil domestic exports fell by 3.9% m/m in August while electronic exports registered the first year-on-year contraction since November 2020.…
Executive Summary The US inflation surprise increases the odds of both congressional gridlock and recession, which increases uncertainty over US leadership past 2024 and reduces the US’s ability to lower tensions with China and Iran. Despite the mainstream media narrative, the Xi-Putin summit reinforces our view that China cannot reject Russia’s strategic partnership. The potential for conflict in Taiwan forces China to accept Russia’s overture. For the same reason the US and China cannot re-engage their economies sustainably, even if Biden and Xi somehow manage to reduce tensions after the midterm elections and twentieth national party congress. Russia could reduce oil exports as well as natural gas, intensifying the global energy shock. Ukraine’s counter-offensive and Europe’s energy diversification increase the risk of Russian military and economic failure. The Middle East will destabilize anew and create a new source of global energy supply disruptions. US-Iran talks are faltering as expected. Russian Oil Embargo Could Deliver Global Shock
Xi-Putin Summit, Ukraine Offensive, Iran Tensions
Xi-Putin Summit, Ukraine Offensive, Iran Tensions
Asset Initiation Date Return LONG GLOBAL DEFENSIVES / CYCLICALS EQUITIES 2022-01-20 19.1% Bottom Line: Stay long US stocks, defensive sectors, and large caps. Avoid China, Taiwan, eastern Europe, and the Middle East. Feature Several notable geopolitical developments occurred over the past week while we met with clients at the annual BCA Research Investment Conference in New York. In this report we analyze these developments using our geopolitical method, which emphasizes constraints over preferences, capabilities over intentions, reality over narrative. We also draw freely from the many valuable insights gleaned from our guest speakers at the conference. China Cannot Reject Russia: The Xi-Putin Summit In Uzbekistan Presidents Xi Jinping and Vladimir Putin are meeting in Uzbekistan as we go to press and Putin has acknowledged China’s “questions and concern” about the war in Ukraine.1 They last met on February 4 when Xi gave Putin his blessing for the Ukraine invasion, promising to buy more Russian natural gas and to pursue a “no limits” strategic partnership (meaning one that includes extensive military cooperation). The meeting’s importance is clear from both leaders’ efforts to make it happen. Putin is leaving Russia despite rising domestic criticism over his handling of the Ukraine war and European energy war. Ukraine is making surprising gains in the battlefield, particularly around Kharkiv, threatening Russia’s ability to complete the conquest of Donetsk and the Donbas region. Meanwhile Xi is leaving China for the first time since the Covid-19 outbreak, despite the fact that he is only one month away from the most important political event of his life: the October 16 twentieth national party congress, where he hopes to clinch another five, ten, or fifteen years in power, expand his faction’s grip over the political system, and take over Mao Zedong’s unique title as chairman of the Communist Party. We do not yet know the full outcome of the Uzbek summit but we do not see it as a turning point in which China turns on Russia. Instead the summit reinforces our key point to investors all year: China cannot reject Russia. Russia broke energy ties with Europe and is fighting a proxy war with NATO. The Putin regime has lashed Russia to China’s side for the foreseeable future. China may not have wanted to move so quickly toward an exclusive relationship but it is not in a position to reject Russia’s diplomatic overture and leave Putin out to dry. The reason is that China is constrained by the US-led world order and like Russia is attempting to change that order and carve a sphere of influence to improve its national security. Beijing’s immediate goal is to consolidate power across the critical buffer territories susceptible to foreign interests. It has already consolidated Tibet, Xinjiang, Hong Kong, and to some extent the South China Sea, the critical approach to Taiwan. Taiwan is the outstanding buffer space that needs to be subjugated. Xi Jinping has taken it upon himself to unify China and Taiwan within his extended rule. But Taiwanese public opinion has decisively shifted in favor of either an indefinite status quo or independence. Hence China and Taiwan are on a collision course. Regardless of one’s view on the likelihood of war, it is a high enough chance that China, Taiwan, the US, and others will be preparing for it in the coming years. Chart 1US Arms Sales To Taiwan
Xi-Putin Summit, Ukraine Offensive, Iran Tensions
Xi-Putin Summit, Ukraine Offensive, Iran Tensions
The US is attempting to increase its ability to deter China from attacking Taiwan. It believes it failed to deter Russia from invading Ukraine – and Taiwan is far more important to US economy and security than Ukraine. The US is already entering discussions with Taiwan and other allies about a package of severe economic sanctions in the event that China attacks – sanctions comparable to those imposed on Russia. The US Congress is also moving forward with the Taiwan Policy Act of 2022, which will solidify US support for the island as well as increase arms sales (Chart 1).2 Aside from China's military preparation – which needs to be carefully reviewed in light of Russia’s troubles in Ukraine and the much greater difficulty of invading Taiwan – China must prepare to deal with the following three factors in the event of war: 1. Energy: China is overly exposed to sea lines of communication that can be disrupted by the United States Navy. Beijing will have to partner with Russia to import Russian and Central Asian resources and attempt to forge an overland path to the Middle East (Chart 2). Unlike Russia, China cannot supply its own energy during a war and its warfighting capacity will suffer if shortages occur or prices spike. 2. Computer Chips: China has committed at least $200 billion on a crash course to build its own semiconductors since 2013 due to the need to modernize its military and economy and compete with the US on the global stage. But China is still dependent on imports, especially for the most advanced chips, and its dependency is rising not falling despite domestic investments (Chart 3). The US is imposing export controls on advanced microchips and starting to enforce these controls on third parties. The US and its allies have cut off Russia’s access to computer chips, leading to Russian shortages that are impeding their war effort. Chart 2China’s Commodity Import Vulnerability
Xi-Putin Summit, Ukraine Offensive, Iran Tensions
Xi-Putin Summit, Ukraine Offensive, Iran Tensions
Chart 3China's Imports Of Semiconductors
China's Imports Of Semiconductors
China's Imports Of Semiconductors
3. US Dollar Reserves: China is still heavily exposed to US dollar assets but its access will be cut off in the event of war, just as the US has frozen Russian, Iranian, Venezuelan, and Cuban assets over the years. China is already diversifying away from the dollar but will have to move more quickly given that Russia had dramatically reduced its exposure and still suffered severely when its access to dollar reserves was frozen this year (Chart 4). Where will China reallocate its reserves? To developing and importing natural resources from Russia, Central Asia, and other overland routes. Chart 4China's US Dollar Exposure
China's US Dollar Exposure
China's US Dollar Exposure
Russia may be the junior partner in a new Russo-Chinese alliance but it will not be a vassal. Russia has resources, military power, and regional control in Central Asia that China needs. Of course, China will maintain a certain diplomatic distance from Russia because it needs to maintain economic relations with Europe and other democracies as it breaks up with the United States. Europe is far more important to Chinese exports than Russia. China will play both sides and its companies will develop parallel supply chains. China will also make gestures to countries that feel threatened by Russia, including the Central Asian members of the Shanghai Cooperation Organization (SCO). But the crucial point is that China cannot reject Russia. If the Putin regime fails, China will be diplomatically isolated, it will lose an ally in any Taiwan war, and the US will have a much greater advantage in attempting to contain China in the coming years and decades. Russo-Chinese Alliance And The US Dollar Many investors speculate that China’s diversification away from the US dollar will mark a severe downturn for the currency. This is of course possible, given that Russia and China will form a substantial anti-dollar bloc. Certainly there can be a cyclical downturn in the greenback, especially after the looming recession troughs. But it is harder to see a structural collapse of the dollar as the leading global reserve currency. The past 14 years have shown how global investors react to US dysfunction, Russian aggression, and Chinese slowdown: they buy the dollar! The implication is that a US wage-price spiral, a Russian détente with Europe, and a Chinese economic recovery would be negative for the dollar – but those stars have not yet aligned. Related Report Geopolitical StrategyThe Geopolitical Consequences Of The Ukraine War The reason China needs to diversify is because it fears US sanctions when it invades Taiwan. Hence reducing its holdings of US treasuries and the dollar signals that it expects war in future. But will other countries rush into the yuan and yuan-denominated bonds if Xi is following in Putin’s footsteps and launching a war of choice, with damaging consequences for the economy? A war over Taiwan would be a global catastrophe and would send other countries plunging into the safe-haven assets, including US assets. Nevertheless China will diversify and other countries will probably increase their yuan trade over time, just as Russia has done. This will be a cyclical headwind for the dollar at some point. But it will not knock the US off the premier position. That would require a historic downgrade in the US’s economic and strategic capability, as was the case with the United Kingdom after the world wars. China will continue to stimulate the economy after the party congress. A successful Chinese and global economic rebound next year – and a decision to pursue “jaw jaw” with the US and Taiwan rather than “war war” – would be negative for the dollar. Hence we may downgrade our bullish dollar view to neutral on a cyclical basis before long … but not yet and not on a structural basis. Bottom Line: Favor the US dollar and the euro over the Chinese renminbi and Taiwanese dollar. Underweight Chinese and Taiwanese assets on a structural basis. Ukraine’s Counter-Offensive And A Russian Oil Embargo Ukraine launched a counter-offensive against Russia in September and achieved significant early victories. Russians fell back away from Kharkiv, putting Izyum in Ukrainian hands and jeopardizing Russia’s ability to achieve its war aim of conquering the remaining half of Donetsk province and thus controlling the Donbas region of eastern Ukraine. Russian positions also crumbled west of the Dnieper river, which was always an important limit on Russian capabilities (Map 1). Map 1Status Of Russia-Ukraine War: The Ukrainian Counter-Offensive (September 15, 2022)
Xi-Putin Summit, Ukraine Offensive, Iran Tensions
Xi-Putin Summit, Ukraine Offensive, Iran Tensions
Some commentators, such as Francis Fukuyama in the Washington Post, have taken the Ukrainian counter-offensive as a sign that the Ukrainians will reconquer lost territory and Russia will suffer an outright defeat in this war.3 If Russia cannot conquer the Donbas, its control of the “land bridge” to Crimea will be unsustainable, and it may have to admit defeat. But we are very skeptical. It will be extremely difficult for Ukrainians to drive the Russians out of all of their entrenched positions. US military officials applauded Ukraine’s counter-offensive but sounded a cautious note. The chief problem is that neither President Putin nor the Russian military can afford such a defeat. They will have to double down on the Donbas and land bridge. The war will be prolonged. Ultimately we expect stalemate, which will be a prelude to ceasefire negotiations. But first the fighting will intensify and the repercussions for global economy and markets will get worse. Russia’s war effort is also flagging because Europe is making headway in finding alternatives for Russian natural gas. Russia has cut off flows through the Nord Stream pipeline to Germany, the Yamal pipeline to Poland, and partially to the Ukraine pipeline system, leaving only Turkstream operating normally. Yet EU gas storage is in the middle of its normal range and trending higher (Chart 5). Chart 5Europe Handling Natural Gas Crisis Well … So Far
Xi-Putin Summit, Ukraine Offensive, Iran Tensions
Xi-Putin Summit, Ukraine Offensive, Iran Tensions
Of course, Europe’s energy supply is still not secure. Cold weather could require more heating than expected. Russia has an incentive to tighten the gas flow further. Flows from Algeria or Azerbaijan could be sabotaged or disrupted (Chart 6). Chart 6Europe’s NatGas Supply Still Not Secure
Xi-Putin Summit, Ukraine Offensive, Iran Tensions
Xi-Putin Summit, Ukraine Offensive, Iran Tensions
Chart 7Europe Tipping Into Recession Anyway
Europe Tipping Into Recession Anyway
Europe Tipping Into Recession Anyway
Russia’s intention is to inflict a recession on Europe so that it begins to rethink its willingness to maintain a long-term proxy war. Recession will force European households to pay the full cost of the energy breakup with Russia all at once. Popular support for war will moderate and politicians will adopt more pragmatic diplomacy. After all they do not have an interest in prolonging the war to the point that it spirals out of control. Clearly the economic pain is being felt, as manufacturing expectations and consumer confidence weaken (Chart 7). Europe’s resolve will not collapse overnight. But the energy crisis can get worse from here. The deeper the recession, the more likely European capitals will try to convince Ukraine to negotiate a ceasefire. However, given Ukraine’s successes in the field and Europe’s successes in diversification, it is entirely possible that Russia faces further humiliating setbacks. While this outcome may be good for liberal democracies, it is not good for global financial markets, at least not in the short run. If Russia is backed into a corner on both the military and economic fronts, then Putin’s personal security and regime security will be threatened. Russia could attempt to turn the tables or lash out even more aggressively. Already Moscow has declared a new “red line” if the US provides longer-range missiles to Ukraine. A US-Russia showdown, complete with nuclear threats, is not out of the realm of possibility. Russia could also start halting oil exports, as it has threatened to do, to inflict a major oil shock on the European economy. Investors will need to be prepared for that outcome. Bottom Line: Petro-states have geopolitical leverage as long as global commodity supplies remain tight. Investors should be prepared for the European embargo of Russian oil to provoke a Russian reaction. A larger than expected oil shock is possible given the risk of defeat that Russia faces (Chart 8). Chart 8Russian Oil Embargo Could Deliver Global Shock
Xi-Putin Summit, Ukraine Offensive, Iran Tensions
Xi-Putin Summit, Ukraine Offensive, Iran Tensions
US-Iran Talks Falter Again This trend of petro-state geopolitical leverage was one of our three key views for 2022 and it also extends to the US-Iran nuclear negotiations, which are faltering as expected. Tit-for-tat military action between Iran and its enemies in the Persian Gulf will pick up immediately – i.e. a new source of oil disruption will emerge. If global demand is collapsing then this trend may only create additional volatility for oil markets at first, but it further constrains the supply side for the foreseeable future. It is not yet certain that the talks are dead but a deal before the US midterm looks unlikely. Biden could continue working on a deal in 2023-24. The Democratic Party is likely to lose at least the House of Representatives, leaving him unable to pass legislation and more likely to pursue foreign policy objectives. The Biden administration wants the Iran deal to tamp down inflation and avoid a third foreign policy crisis at a time when it is already juggling Russia and China. The overriding constraints in this situation are that Iran needs a nuclear weapon for regime survival, while Israel will attack Iran as a last resort before it obtains a nuclear weapon. Yes, the US is reluctant to initiate another war in the Middle East. But public war-weariness is probably overrated today (unlike in 2008 or even 2016) and the US has drawn a hard red line against nuclear weaponization. Iran will retaliate to any US-Israeli aggression ferociously. But conflict and oil disruptions will emerge even before the US or Israel decide to launch air strikes, as Iran will face sabotage and cyber-attacks and will need to deter the US and Israel by signaling that it can trigger a region-wide war. Chart 9If US-Iran Talks Fail, Iraq Will Destabilize Further
If US-Iran Talks Fail, Iraq Will Destabilize Further
If US-Iran Talks Fail, Iraq Will Destabilize Further
Recent social unrest in Iraq, where the nationalist coalition of Muqtada al-Sadr is pushing back against Iranian influence, is only an inkling of what can occur if the US-Iran talks are truly dead, Iran pushes forward with its nuclear program, and Israel and the US begin openly entertaining military options. The potential oil disruption from Iraq presents a much larger supply constraint than the failure to remove sanctions on Iran (Chart 9). A new wave of Middle Eastern instability would push up oil prices and strengthen Russia’s hand, distracting the US and imposing further pain on Europe. It would not strengthen China’s hand, but the risk itself would reinforce China’s Eurasian strategy, as Beijing would need to prepare for oil cutoffs in the Persian Gulf. Iran’s attempts to join the Shanghai Cooperation Organization should be seen in this context. Ultimately the only factor that could still possibly convince Iran not to make a dash for the bomb – the military might of the US and its allies – is the same factor that forces China and Russia to strengthen their strategic bond. The emerging Russo-Chinese behemoth, in turn, acts as a hard constraint on any substantial reengagement of the US and Chinese economies. The US cannot afford to feed another decade of Chinese economic growth and modernization if China is allied with Russia and Central Asia. Of course, we cannot rule out the possibility that the Xi and Biden administrations will try to prevent a total collapse of US-China relations in 2023. If China is not yet ready to invade Taiwan then there is a brief space for diplomacy to try to work. But there is no room for long-lasting reengagement – because the US cannot simply cede Taiwan to China, and hence China cannot reject Russia, and Russia no longer has any options. Bottom Line: Expect further oil volatility and price shocks. Sell Middle Eastern equities. Favor North American, Latin American, and Australian energy producers. Investment Takeaways Recession Risks Rising: The inflation surprise in the US in August necessitates more aggressive Fed rate hikes in the near term, which increases the odds of rising unemployment and recession. US Policy Uncertainty Rising: A recession will greatly increase the odds of US political instability over the 2022-24 cycle and reduce the incentive for foreign powers like Iran or China to make concessions or agreements with the US. European Policy Uncertainty Rising: We already expected a European recession. Russia’s setbacks make it more likely that it will adopt more aggressive military tactics and economic warfare. Chinese Policy Uncertainty Rising: China will continue stimulating next year but its economy will suffer from energy shocks and its stimulus is less effective than in the past. It will likely increase economic and military pressure on Taiwan, while the US will increase punitive measures against China. It is not clear that it will launch a full scale invasion of Taiwan – that is not our base case – but it is possible so investors need to be prepared. Long US and Defensives: Stay long US stocks over global stocks, defensive sectors over cyclicals, and large caps over small caps. Buy safe-havens like the oversold Japanese yen. Long Arms Manufacturers: Buy defense stocks and cyber-security firms. Short China and Taiwan: Favor the USD and EUR over the CNY. Favor US semiconductor stocks over Taiwanese equities. Favor Korean over Taiwanese equities. Favor Indian tech over Chinese tech. Favor Singaporean over Hong Kong stocks. Matt Gertken Chief Geopolitical Strategist mattg@bcaresearch.com Footnotes 1 Tessa Wong and Simon Fraser, “Putin-Xi talks: Russian leader reveals China's 'concern' over Ukraine,” BBC, September 15, 2022, bbc.com. 2 US Senate Foreign Relations Committee, “The Taiwan Policy Act of 2022,” foreign.senate.gov. 3 Greg Sargent, “Is Putin facing defeat? The ‘End of History’ author remains confident,” Washington Post, September 12, 2022, washingtonpost.com. Strategic Themes Open Tactical Positions (0-6 Months) Open Cyclical Recommendations (6-18 Months) Regional Geopolitical Risk Matrix
Executive Summary Liquidity Will Shrink Further In Hong Kong
Liquidity Will Shrink Further In Hong Kong
Liquidity Will Shrink Further In Hong Kong
The HKD is facing its most critical test in several decades. While the peg is likely to survive (Feature Chart), the economic costs for Hong Kong SAR will be far reaching. Critically, monetary policy in Hong Kong SAR is being tailored behind a hawkish Fed, while economic ties with China increasingly warrant easier policy settings. This tug of war will be resolved via a reset in domestic spending and asset prices. Equity shares have been the first shoe to drop. Real estate values and consumer spending will be next. A hypothetical delinking of the peg will see the HKD depreciate since it is expensive on a real effective exchange rate basis. Longer term, the rising use of the RMB in Hong Kong SAR will render the peg a relic. It will also fit with China’s aims to internationalize the RMB. Bottom Line: The HKD peg is likely to survive in the near term, but the economic repercussions from maintaining the linked exchange-rate system will trigger a rethinking by the Hong Kong Monetary Authority (HKMA) and mainland authorities. Eventually, HKD could be replaced by the CNY. For now, HKD interest rates are slated to rise further, which will have ramifications for domestic spending and asset prices. Feature Chart 1HKD Has Been Tracking Interest Rates
HKD Has Been Tracking Interest Rates
HKD Has Been Tracking Interest Rates
The Hong Kong dollar (HKD) has been trading on the weak side of its convertibility band since May. In theory, this suggests there is intense pressure for the peg to be delinked, which should lead to a much weaker exchange rate. In practice, interest rates in Hong Kong have failed to keep up with the surge in US rates, which has led to widening interest rate differentials between Hong Kong and the US. As a result, investors have embarked on a massive carry trade, funding USD purchases with HKDs (Chart 1). HKD’s weakness has raised questions about whether the exchange rate could face a crisis of confidence. This will be a severe blow to the HKMA whose sole role is currency stability, with the HKD being the underlying bedrock of Hong Kong’s financial system. In this report, we suggest that the HKD will survive this crisis, just as it has navigated previous shocks since 1983. The brunt of the adjustment will be domestic, first from Hong Kong equities, but spreading to real estate and consumer spending. Longer term, the HKD might become a relic as transactions in Hong Kong are increasingly conducted in RMB. Will The Peg Be Sustained? Historically, currency pegs more often than not fail. Specific to the HKD, the peg is facing its most critical test in decades but is likely to survive for a few reasons. First, every HKD that the region of Hong Kong has ever printed is backed by USD reserves, to the tune of 1.8 times. Quite simply, FX reserves are much higher than the Hong Kong monetary base (Chart 2). This suggests the HKMA’s “convertibility promise” remains credible. Second, Hong Kong also ranks favorably when looking at the ratio of broad money supply to FX reserves. Every 42.3 cents of broad money creation can be backed by foreign currency, a ratio much higher than China and on par with Singapore (Chart 3). With a monetary base fully backed by FX reserves and a broad money-to-FX reserve ratio largely in line with other linked exchange rate systems, our bias is that the peg will remain in place at least over a cyclical horizon (12-18 months). Chart 2In Theory, The HKMA Can Defend The Peg
In Theory, The HKMA Can Defend The Peg
In Theory, The HKMA Can Defend The Peg
Chart 3The HKMA Ranks Favorably To The PBoC
The HKMA Ranks Favorably To The PBoC
The HKMA Ranks Favorably To The PBoC
This credibility will come at a huge cost to the domestic economy, however. By having a fixed exchange rate system and an open capital account, Hong Kong has given up control over domestic monetary policy. Consequently, it must import monetary policy from the US. As interest rates rise in the US, demand for US dollar deposits from Hong Kong concerns goes up, putting downward pressure on the exchange rate. To maintain the convertibility ratio, the HKMA must drain the system of Hong Kong dollars to lift domestic interest rates. This is quite visible not only from the drop in foreign exchange reserves, but also the drawdown in the aggregate balance of domestic banks parked at the HKMA (Chart 4). From May 11 through August, the HKMA has absorbed a total of HKD 213 billion, shrinking the aggregate balance in the banking system by more than 60%. Chart 4Liquidity Will Shrink Further In Hong Kong
Liquidity Will Shrink Further In Hong Kong
Liquidity Will Shrink Further In Hong Kong
Historically, the aggregate balance has had to drop much more to restore an equilibrium between interest rates in the US and Hong Kong SAR. The implication is that liquidity will continue to be drained from the system to ultimately defend the peg, and local interest rates will rise. There is one important caveat: Hong Kong SAR’s net international investment position stands at 580% of GDP, much higher than broad money supply. As such, the Hong Kong SAR does not have a solvency problem. What it faces is too much domestic liquidity, which is pushing HKD interest rates lower (Chart 5). Chart 5The HKD Is Facing A Liquidity, Rather Than A Solvency Crisis
The Future Of The Hong Kong Dollar Peg
The Future Of The Hong Kong Dollar Peg
Ramifications Of The USD Peg When the HKD was tied to the US dollar in 1983, it made economic sense. Hong Kong SAR’s economy was more linked via trade to the US, compared to China (Chart 6). As such, stability vis-à-vis the US dollar was a vital appeal for traders, financiers, and all industries tied to the Hong Kong hub. Since then, there has been a tectonic shift in economic dependence. Exports to China now account for almost 60% of the total, while those to the US have fallen well below 8%. Quite simply, Hong Kong SAR still imports monetary policy from the US, while it is increasingly dependent on the Chinese economy. Nonetheless, there have been a few adjustments. The use of the RMB in Hong Kong SAR has been gradually gaining momentum. RMB deposits have risen to over HKD 800bn. As a share of narrow money supply (M1), it is almost 50% (Chart 7). There are also over 140 licensed banks in Hong Kong allowed to engage in RMB-based business. Chart 6Hong Kong And China Are Tied To The Hip
Hong Kong And China Are Tied To The Hip
Hong Kong And China Are Tied To The Hip
Chart 7Hong Kong Is Transitioning Into A Defacto RMB System
Hong Kong Is Transitioning Into A Defacto RMB System
Hong Kong Is Transitioning Into A Defacto RMB System
These links extend beyond just banking turnover. First introduced in 2014, the southbound trading links between China and Hong Kong SAR have become a major conduit for mainland investors to gain exposure to foreign firms. The China-Hong Kong stock connect has now handled over 2.6tn RMB in cumulative flows. This represented as high as 40% of the equity turnover in Hong Kong SAR (Chart 8). Capital account transactions have also been progressively relaxed, and the issuance of RMB bonds has been rising rapidly since 2008. Chart 8Lots Of Financial Links Between The HKD and RMB
Lots Of Financial Links Between The HKD and RMB
Lots Of Financial Links Between The HKD and RMB
Hong Kong SAR’s strengthening ties with China comes with some good news. The increase in Chinese domestic liquidity is lowering the cost of capital for local enterprises. At the same time, it might also be fuelling very low domestic interest rates, forcing locals to chase higher rates elsewhere. This does not affect the peg if people sell the RMB to buy other currencies, including the dollar or maybe even the HKD. The bad news is that Hong Kong has now become a high-beta play on China as both economies are inexorably interlinked. Chart 9 shows that consumers in Hong Kong SAR tend to have much more volatile spending patterns compared to China, especially when economic growth is about to slow. One reason is that Hong Kong concerns are highly levered notably to the property market (Chart 10). For example, the debt service ratio in Hong Kong SAR sits at 32% of disposable income, much higher than China or other indebted economies (Chart 11). This makes the economy very vulnerable to rising interest rates. Chart 9Hong Kong Is Economically More Volatile Than China
Hong Kong Is Economically More Volatile Than China
Hong Kong Is Economically More Volatile Than China
Chart 10Hong Kong Cannot Escape A Hard Landing (Part 1)
Property Prices In Hong Kong Will Drop
Property Prices In Hong Kong Will Drop
Chart 11Hong Kong Cannot Escape A Hard Landing (Part 2)
Hong Kong Cannot Escape A Hard Landing (Part 2)
Hong Kong Cannot Escape A Hard Landing (Part 2)
The bottom line is that as the HKMA withdraws domestic liquidity, this will reassert downward pressure on business activity and asset prices, particularly real estate. With private consumption a whopping 65% of GDP, household deleveraging will also prove to be a formidable headwind for domestic spending. Outside interest rates, Hong Kong SAR remains a trade hub. If global trade slows down meaningfully, this will lead to a deterioration in the current account. This triple whammy from slowing global trade, rising interest rates and consumer deleveraging could prove indigestible for Hong Kong assets. Policy Options Chart 12The Government Could Bail Out Hong Kong
The Government Could Bail Out Hong Kong
The Government Could Bail Out Hong Kong
As highlighted above, the HKD peg will remain in place for the foreseeable future, but this will come at a huge cost. The advantage of the HKD peg is that the choice of the nominal anchor, the US dollar, renders it credible. As a financial hub, this is crucial for Hong Kong. Meanwhile, such an anchor also imposes fiscal discipline since government deficits cannot be monetized by money printing. In the case where the government tries to be profligate, the rise in inflation will lower real rates and lead to capital outflows. This will force the HKMA to sell US dollars and absorb local currency. Indeed, over the past several years, government debt in Hong Kong has been close to nil (Chart 12). The drawback of a fixed exchange-rate regime is that Hong Kong SAR has relinquished control over independent monetary policy. Such a union was justified when the economic cycles between the US and Hong Kong SAR were in sync, but now the region needs easier policy settings. The roadmap of the late 1990s could be what is in store for Hong Kong SAR. In short, the peg survived but the region went through a severe internal devaluation. During the Asian crisis, property prices fell by more than 60%. If that were to occur today, it would herald a prolonged period of high unemployment and stagnant wages to realign the region’s competitiveness with its trading partners. Hong Kong SAR stocks have already borne the brunt of an internal adjustment and are trading at very cheap multiples (Chart 13). The MSCI Hong Kong stock index is composed of mostly financials (47% of market cap) and property stocks (21% of market cap). As HKD rates are rising, loan growth in Hong Kong SAR is contracting and net interest margins have collapsed (Chart 14). This does not bode well for the near-term performance of financials. Chart 13Markets Have Already Discounted A Pessimistic Scenario For Hong Kong Shares
Markets Have Already Discounted A Pessimistic Scenario For Hong Kong Shares
Markets Have Already Discounted A Pessimistic Scenario For Hong Kong Shares
Chart 14Banks In Hong Kong Are Facing A Tough ##br##Reckoning
Banks In Hong Kong Are Facing A Tough Reckoning
Banks In Hong Kong Are Facing A Tough Reckoning
The good news is that similar to the late 1990s, banks are unlikely to go bust. Hong Kong SAR banks are well capitalized and delinquency rates are quite low, suggesting a banking crisis is unlikely to be a source of pain for the HKD peg (Chart 15). In fact, Hong Kong SAR banks rank favorably among their global peers in terms of capital adequacy (Chart 16). Chart 15Banks In Hong Kong Are Well Capitalized (Part 1)
Banks In Hong Kong Are Well Capitalized (Part 1)
Banks In Hong Kong Are Well Capitalized (Part 1)
Chart 16Banks In Hong Kong Are Well Capitalized (Part 2)
The Future Of The Hong Kong Dollar Peg
The Future Of The Hong Kong Dollar Peg
Specific to the currency, Hong Kong is also running recurring current account surpluses. This is boosting its FX reserves (Chart 17). That lends credibility to the peg in the near term. The bad news is that as the domestic economy slows down, and global trade comes close to a standstill, these surpluses could evaporate. One cost to Hong Kong is that the peg to the US dollar has made HKD incrementally expensive. Our model shows that the real effective exchange for HKD is about 2.5 standard deviations above fair value (Chart 18). Our view on the US dollar is that we could see depreciation over a 12-to-18-month horizon, but an overshoot in the near term is quite likely. A drop in the US dollar will help realign competitiveness in the HKD. Meantime, the market has also been pushing the currency towards the weaker side of its convertibility band. Chart 17Balance Of Payments Remain Favorable For The HKD
Balance Of Payments Remain Favorable For The HKD
Balance Of Payments Remain Favorable For The HKD
Chart 18The HKD Is Expensive
The HKD Is Expensive
The HKD Is Expensive
Longer term, as Hong Kong SAR continues to become more entwined with China, a peg to the CNY will make sense. This process will be the initial step in the region’s official embrace of the RMB system. That said, the process will be gradual since the US dollar remains very much a reserve currency, and the relevance of Hong Kong SAR as a financial center hinges upon easy access to the USD. What is more likely is that any re-pegging to the RMB will come many years down the road, when the yuan has become a fully convertible currency. The de-pegging of the HKD from the USD or adjusting the peg is as much a political discussion as an economic one. Political conditions for this change are not yet present given such a change will have major ramifications for the economy of Hong Kong SAR and will likely also reverberate through financial asset prices. One can imagine a scenario where HKD yields are forced to adjust to a new nominal anchor. Investors have been convinced through almost 30 years of history to treat the HKD as a proxy for the US dollar. That said, the economic pain associated with maintaining the HKD-USD peg will ensure authorities accelerate the use of RMBs in Hong Kong, with a goal of eventually adopting the yuan as the de facto currency. Adopting a currency board akin to Singapore is another option that makes sense, especially since this would give the HKMA scope to link to cheaper currencies, such as the yen and euro. That said, this is unlikely to be politically palatable, especially for Beijing. A link to the yuan that already does this job makes sense. Finally, there is always the option to fully float the peg, but this would probably increase currency volatility. This is unlikely in the near term. The Goldilocks scenario for policymakers is when the US dollar eventually depreciates against major currencies, easing financial conditions for Hong Kong SAR concerns. This will dovetail nicely with the goals of the monetary authorities, maintain credibility while easing financial concerns for a very levered economy. Investment Conclusions The HKD peg will remain in place, but the financial dislocations will lead to significant internal devaluation in Hong Kong SAR. As US interest rates rise, the HKD will be under considerable pressure. The HKMA will have no choice but to allow HKD interest rates to rise. This will tip the property market and thrust the economy into deflation and a recession. Chinese bonds are the best hedge against this risk. Avoid property and financial shares for the time being. Were the peg to break today, the HKD will depreciate according to our valuation models. This suggests markets are right to push the HKD-linked rate towards the weaker end of the convertibility band. Despite the economic and financial pain, the HKMA will not abandon the peg. That means carry trades will continue to make money. Using the HKD as a funding currency still makes sense in the near term. In long run, the economic pain associated with maintaining the HKD-USD peg will make authorities in Beijing accelerate the use of the RMB in Hong Kong’s special administrative region. The eventual goal will be for Hong Kong SAR to adopt the yuan as its currency. Chester Ntonifor Foreign Exchange Strategist chestern@bcaresearch.com Qingyun Xu, CFA Associate Editor qingyunx@bcaresearch.com Trades & Forecasts Strategic View Cyclical Holdings (6-18 months) Tactical Holdings (0-6 months) Limit Orders Forecast Summary
Executive Summary Liquidity Will Shrink Further In Hong Kong
Liquidity Will Shrink Further In Hong Kong
Liquidity Will Shrink Further In Hong Kong
The HKD is facing its most critical test in several decades. While the peg is likely to survive (Feature Chart), the economic costs for Hong Kong SAR will be far reaching. Critically, monetary policy in Hong Kong SAR is being tailored behind a hawkish Fed, while economic ties with China increasingly warrant easier policy settings. This tug of war will be resolved via a reset in domestic spending and asset prices. Equity shares have been the first shoe to drop. Real estate values and consumer spending will be next. A hypothetical delinking of the peg will see the HKD depreciate since it is expensive on a real effective exchange rate basis. Longer term, the rising use of the RMB in Hong Kong SAR will render the peg a relic. It will also fit with China’s aims to internationalize the RMB.. Bottom Line: The HKD peg is likely to survive in the near term, but the economic repercussions from maintaining the linked exchange-rate system will trigger a rethinking by the Hong Kong Monetary Authority (HKMA) and mainland authorities. Eventually, HKD could be replaced by the CNY. For now, HKD interest rates are slated to rise further, which will have ramifications for domestic spending and asset prices. Feature Chart 1HKD Has Been Tracking Interest Rates
HKD Has Been Tracking Interest Rates
HKD Has Been Tracking Interest Rates
The Hong Kong dollar (HKD) has been trading on the weak side of its convertibility band since May. In theory, this suggests there is intense pressure for the peg to be delinked, which should lead to a much weaker exchange rate. In practice, interest rates in Hong Kong have failed to keep up with the surge in US rates, which has led to widening interest rate differentials between Hong Kong and the US. As a result, investors have embarked on a massive carry trade, funding USD purchases with HKDs (Chart 1). HKD’s weakness has raised questions about whether the exchange rate could face a crisis of confidence. This will be a severe blow to the HKMA whose sole role is currency stability, with the HKD being the underlying bedrock of Hong Kong’s financial system. In this report, we suggest that the HKD will survive this crisis, just as it has navigated previous shocks since 1983. The brunt of the adjustment will be domestic, first from Hong Kong equities, but spreading to real estate and consumer spending. Longer term, the HKD might become a relic as transactions in Hong Kong are increasingly conducted in RMB. Will The Peg Be Sustained? Historically, currency pegs more often than not fail. Specific to the HKD, the peg is facing its most critical test in decades but is likely to survive for a few reasons. First, every HKD that the region of Hong Kong has ever printed is backed by USD reserves, to the tune of 1.8 times. Quite simply, FX reserves are much higher than the Hong Kong monetary base (Chart 2). This suggests the HKMA’s “convertibility promise” remains credible. Second, Hong Kong also ranks favorably when looking at the ratio of broad money supply to FX reserves. Every 42.3 cents of broad money creation can be backed by foreign currency, a ratio much higher than China and on par with Singapore (Chart 3). With a monetary base fully backed by FX reserves and a broad money-to-FX reserve ratio largely in line with other linked exchange rate systems, our bias is that the peg will remain in place at least over a cyclical horizon (12-18 months). Chart 2In Theory, The HKMA Can Defend The Peg
In Theory, The HKMA Can Defend The Peg
In Theory, The HKMA Can Defend The Peg
Chart 3The HKMA Ranks Favorably To The PBoC
The HKMA Ranks Favorably To The PBoC
The HKMA Ranks Favorably To The PBoC
This credibility will come at a huge cost to the domestic economy, however. By having a fixed exchange rate system and an open capital account, Hong Kong has given up control over domestic monetary policy. Consequently, it must import monetary policy from the US. As interest rates rise in the US, demand for US dollar deposits from Hong Kong concerns goes up, putting downward pressure on the exchange rate. To maintain the convertibility ratio, the HKMA must drain the system of Hong Kong dollars to lift domestic interest rates. This is quite visible not only from the drop in foreign exchange reserves, but also the drawdown in the aggregate balance of domestic banks parked at the HKMA (Chart 4). From May 11 through August, the HKMA has absorbed a total of HKD 213 billion, shrinking the aggregate balance in the banking system by more than 60%. Chart 4Liquidity Will Shrink Further In Hong Kong
Liquidity Will Shrink Further In Hong Kong
Liquidity Will Shrink Further In Hong Kong
Historically, the aggregate balance has had to drop much more to restore an equilibrium between interest rates in the US and Hong Kong SAR. The implication is that liquidity will continue to be drained from the system to ultimately defend the peg, and local interest rates will rise. There is one important caveat: Hong Kong SAR’s net international investment position stands at 580% of GDP, much higher than broad money supply. As such, the Hong Kong SAR does not have a solvency problem. What it faces is too much domestic liquidity, which is pushing HKD interest rates lower (Chart 5). Chart 5The HKD Is Facing A Liquidity, Rather Than A Solvency Crisis
The Future Of The Hong Kong Dollar Peg
The Future Of The Hong Kong Dollar Peg
Ramifications Of The USD Peg When the HKD was tied to the US dollar in 1983, it made economic sense. Hong Kong SAR’s economy was more linked via trade to the US, compared to China (Chart 6). As such, stability vis-à-vis the US dollar was a vital appeal for traders, financiers, and all industries tied to the Hong Kong hub. Since then, there has been a tectonic shift in economic dependence. Exports to China now account for almost 60% of the total, while those to the US have fallen well below 8%. Quite simply, Hong Kong SAR still imports monetary policy from the US, while it is increasingly dependent on the Chinese economy. Nonetheless, there have been a few adjustments. The use of the RMB in Hong Kong SAR has been gradually gaining momentum. RMB deposits have risen to over HKD 800bn. As a share of narrow money supply (M1), it is almost 50% (Chart 7). There are also over 140 licensed banks in Hong Kong allowed to engage in RMB-based business. Chart 6Hong Kong And China Are Tied To The Hip
Hong Kong And China Are Tied To The Hip
Hong Kong And China Are Tied To The Hip
Chart 7Hong Kong Is Transitioning Into A Defacto RMB System
Hong Kong Is Transitioning Into A Defacto RMB System
Hong Kong Is Transitioning Into A Defacto RMB System
These links extend beyond just banking turnover. First introduced in 2014, the southbound trading links between China and Hong Kong SAR have become a major conduit for mainland investors to gain exposure to foreign firms. The China-Hong Kong stock connect has now handled over 2.6tn RMB in cumulative flows. This represented as high as 40% of the equity turnover in Hong Kong SAR (Chart 8). Capital account transactions have also been progressively relaxed, and the issuance of RMB bonds has been rising rapidly since 2008. Chart 8Lots Of Financial Links Between The HKD and RMB
Lots Of Financial Links Between The HKD and RMB
Lots Of Financial Links Between The HKD and RMB
Hong Kong SAR’s strengthening ties with China comes with some good news. The increase in Chinese domestic liquidity is lowering the cost of capital for local enterprises. At the same time, it might also be fuelling very low domestic interest rates, forcing locals to chase higher rates elsewhere. This does not affect the peg if people sell the RMB to buy other currencies, including the dollar or maybe even the HKD. The bad news is that Hong Kong has now become a high-beta play on China as both economies are inexorably interlinked. Chart 9 shows that consumers in Hong Kong SAR tend to have much more volatile spending patterns compared to China, especially when economic growth is about to slow. One reason is that Hong Kong concerns are highly levered notably to the property market (Chart 10). For example, the debt service ratio in Hong Kong SAR sits at 32% of disposable income, much higher than China or other indebted economies (Chart 11). This makes the economy very vulnerable to rising interest rates. Chart 9Hong Kong Is Economically More Volatile Than China
Hong Kong Is Economically More Volatile Than China
Hong Kong Is Economically More Volatile Than China
Chart 10Hong Kong Cannot Escape A Hard Landing (Part 1)
Property Prices In Hong Kong Will Drop
Property Prices In Hong Kong Will Drop
Chart 11Hong Kong Cannot Escape A Hard Landing (Part 2)
Hong Kong Cannot Escape A Hard Landing (Part 2)
Hong Kong Cannot Escape A Hard Landing (Part 2)
The bottom line is that as the HKMA withdraws domestic liquidity, this will reassert downward pressure on business activity and asset prices, particularly real estate. With private consumption a whopping 65% of GDP, household deleveraging will also prove to be a formidable headwind for domestic spending. Outside interest rates, Hong Kong SAR remains a trade hub. If global trade slows down meaningfully, this will lead to a deterioration in the current account. This triple whammy from slowing global trade, rising interest rates and consumer deleveraging could prove indigestible for Hong Kong assets. Policy Options Chart 12The Government Could Bail Out Hong Kong
The Government Could Bail Out Hong Kong
The Government Could Bail Out Hong Kong
As highlighted above, the HKD peg will remain in place for the foreseeable future, but this will come at a huge cost. The advantage of the HKD peg is that the choice of the nominal anchor, the US dollar, renders it credible. As a financial hub, this is crucial for Hong Kong. Meanwhile, such an anchor also imposes fiscal discipline since government deficits cannot be monetized by money printing. In the case where the government tries to be profligate, the rise in inflation will lower real rates and lead to capital outflows. This will force the HKMA to sell US dollars and absorb local currency. Indeed, over the past several years, government debt in Hong Kong has been close to nil (Chart 12). The drawback of a fixed exchange-rate regime is that Hong Kong SAR has relinquished control over independent monetary policy. Such a union was justified when the economic cycles between the US and Hong Kong SAR were in sync, but now the region needs easier policy settings. The roadmap of the late 1990s could be what is in store for Hong Kong SAR. In short, the peg survived but the region went through a severe internal devaluation. During the Asian crisis, property prices fell by more than 60%. If that were to occur today, it would herald a prolonged period of high unemployment and stagnant wages to realign the region’s competitiveness with its trading partners. Hong Kong SAR stocks have already borne the brunt of an internal adjustment and are trading at very cheap multiples (Chart 13). The MSCI Hong Kong stock index is composed of mostly financials (47% of market cap) and property stocks (21% of market cap). As HKD rates are rising, loan growth in Hong Kong SAR is contracting and net interest margins have collapsed (Chart 14). This does not bode well for the near-term performance of financials. Chart 13Markets Have Already Discounted A Pessimistic Scenario For Hong Kong Shares
Markets Have Already Discounted A Pessimistic Scenario For Hong Kong Shares
Markets Have Already Discounted A Pessimistic Scenario For Hong Kong Shares
Chart 14Banks In Hong Kong Are Facing A Tough ##br##Reckoning
Banks In Hong Kong Are Facing A Tough Reckoning
Banks In Hong Kong Are Facing A Tough Reckoning
The good news is that similar to the late 1990s, banks are unlikely to go bust. Hong Kong SAR banks are well capitalized and delinquency rates are quite low, suggesting a banking crisis is unlikely to be a source of pain for the HKD peg (Chart 15). In fact, Hong Kong SAR banks rank favorably among their global peers in terms of capital adequacy (Chart 16). Chart 15Banks In Hong Kong Are Well Capitalized (Part 1)
Banks In Hong Kong Are Well Capitalized (Part 1)
Banks In Hong Kong Are Well Capitalized (Part 1)
Chart 16Banks In Hong Kong Are Well Capitalized (Part 2)
The Future Of The Hong Kong Dollar Peg
The Future Of The Hong Kong Dollar Peg
Specific to the currency, Hong Kong is also running recurring current account surpluses. This is boosting its FX reserves (Chart 17). That lends credibility to the peg in the near term. The bad news is that as the domestic economy slows down, and global trade comes close to a standstill, these surpluses could evaporate. One cost to Hong Kong is that the peg to the US dollar has made HKD incrementally expensive. Our model shows that the real effective exchange for HKD is about 2.5 standard deviations above fair value (Chart 18). Our view on the US dollar is that we could see depreciation over a 12-to-18-month horizon, but an overshoot in the near term is quite likely. A drop in the US dollar will help realign competitiveness in the HKD. Meantime, the market has also been pushing the currency towards the weaker side of its convertibility band. Chart 17Balance Of Payments Remain Favorable For The HKD
Balance Of Payments Remain Favorable For The HKD
Balance Of Payments Remain Favorable For The HKD
Chart 18The HKD Is Expensive
The HKD Is Expensive
The HKD Is Expensive
Longer term, as Hong Kong SAR continues to become more entwined with China, a peg to the CNY will make sense. This process will be the initial step in the region’s official embrace of the RMB system. That said, the process will be gradual since the US dollar remains very much a reserve currency, and the relevance of Hong Kong SAR as a financial center hinges upon easy access to the USD. What is more likely is that any re-pegging to the RMB will come many years down the road, when the yuan has become a fully convertible currency. The de-pegging of the HKD from the USD or adjusting the peg is as much a political discussion as an economic one. Political conditions for this change are not yet present given such a change will have major ramifications for the economy of Hong Kong SAR and will likely also reverberate through financial asset prices. One can imagine a scenario where HKD yields are forced to adjust to a new nominal anchor. Investors have been convinced through almost 30 years of history to treat the HKD as a proxy for the US dollar. That said, the economic pain associated with maintaining the HKD-USD peg will ensure authorities accelerate the use of RMBs in Hong Kong, with a goal of eventually adopting the yuan as the de facto currency. Adopting a currency board akin to Singapore is another option that makes sense, especially since this would give the HKMA scope to link to cheaper currencies, such as the yen and euro. That said, this is unlikely to be politically palatable, especially for Beijing. A link to the yuan that already does this job makes sense. Finally, there is always the option to fully float the peg, but this would probably increase currency volatility. This is unlikely in the near term. The Goldilocks scenario for policymakers is when the US dollar eventually depreciates against major currencies, easing financial conditions for Hong Kong SAR concerns. This will dovetail nicely with the goals of the monetary authorities, maintain credibility while easing financial concerns for a very levered economy. Investment Conclusions The HKD peg will remain in place, but the financial dislocations will lead to significant internal devaluation in Hong Kong SAR. As US interest rates rise, the HKD will be under considerable pressure. The HKMA will have no choice but to allow HKD interest rates to rise. This will tip the property market and thrust the economy into deflation and a recession. Chinese bonds are the best hedge against this risk. Avoid property and financial shares for the time being. Were the peg to break today, the HKD will depreciate according to our valuation models. This suggests markets are right to push the HKD-linked rate towards the weaker end of the convertibility band. Despite the economic and financial pain, the HKMA will not abandon the peg. That means carry trades will continue to make money. Using the HKD as a funding currency still makes sense in the near term. In long run, the economic pain associated with maintaining the HKD-USD peg will make authorities in Beijing accelerate the use of the RMB in Hong Kong’s special administrative region. The eventual goal will be for Hong Kong SAR to adopt the yuan as its currency. Chester Ntonifor Foreign Exchange Strategist chestern@bcaresearch.com Qingyun Xu, CFA Associate Editor qingyunx@bcaresearch.com