Emerging Markets

Executive Summary Global Manufacturing / Trade Will Contract
Global Manufacturing / Trade Will Contract
Global Manufacturing / Trade Will Contract
The bar for the Fed to stop hiking rates is still very high. US inflation remains broad based. Core inflation is neither about oil and food prices nor is it about the prices of other individual items. The key variables that will determine inflation’s persistence are wages and unit labor costs. US wage growth is very elevated, and unit labor costs are soaring. Unless the US economy experiences a recession, core inflation will not drop below 3.5%. The Fed and the US stock market (and by extension global risk assets) remain on a collision course. The Fed will not make a dovish pivot until the stock market sell off, and equities cannot rally unless the Fed backs off. The imminent global trade contraction is bad news for EM stocks and currencies as well as global cyclicals. Bottom Line: A hawkish Fed amid a global trade/manufacturing recession is producing a bearish cocktail for global risk assets in general and EM risk assets in particular. Feature The majority of investors and strategists have been expecting an easing of US inflation to allow the Federal Reserve to completely halt or considerably slow the pace of its hiking cycle. For example, the Bank of America Global Fund Managers survey from September (taken before the release of the latest US CPI report) revealed that a net 79% of participants see lower inflation in the next 12 months. We at BCA’s Emerging Markets Strategy team have taken a different view. Even though we have been open to the idea that the annual rate of inflation (especially the headline measure) will drop in the months to come, we have been arguing that US core inflation will remain well above the 3.5-4% range for some time. What matters for the Fed’s policy is the level of core inflation, not just a decline in the inflation rate. With core inflation considerably above the Fed’s 2% target, we have maintained that the FOMC will uphold its hawkish bias. Consequently, global risk assets will continue selling off and the US dollar will overshoot. Analyzing the price dynamics of individual items − such as energy, food, shelter or cars – when assessing the outlook for inflation is akin to missing the forest for the trees. Chart 1US Core-Type Inflation Measures Are Very High
US Core-Type Inflation Measures Are Very High
US Core-Type Inflation Measures Are Very High
When inflation is limited to several individual components of the consumption basket, neither central banks nor financial markets should react. This is true both when the prices of these individual components are rising (inflation) and when they are falling (deflation). However, central banks and, hence, financial markets, should respond to broad-based inflation. Therefore, investors need to look at the forest rather than focus on individual trees. In our February 18, 2022 report, we wrote the following: “US inflation has become broad based. Not only is core CPI surging but also trimmed-mean, median and sticky core consumer price inflation has risen substantially. Median and trimmed-mean price indexes would not be rocketing if inflation was limited to select goods or services. Particularly, the aforementioned measures exclude components with extreme price changes. What might have started as a narrow-based relative price shock has evolved into broad-based genuine inflation. The key to the transition from one-off inflation spikes to persistent genuine inflation is wages, more specifically unit labor costs. Unit labor costs are calculated as nominal wages divided by productivity (the latter is output per hour per employee).” All of these points remain valid today. Chart 1 shows that core, median, trimmed-mean and sticky CPI are all rising at very fast annual rates, ranging from 6% to 7.2%. Hence, underlying inflationary pressures remain broad based and persistent in the US economy. As a result, the bar for the Fed to stop hiking rates is very high. Last week, FOMC member Christopher Waller stated that he would need to see month-on-month core inflation prints of around 0.2% for a period of five to six months before he is comfortable with backing off on rate hikes. In the past three months, the monthly rates of various measures of underlying core inflation have ranged between 0.5-0.65%. Even though oil and food prices have relapsed and freight rates have plunged, US core inflation has still surprised to the upside. The point being is that core inflation is neither about oil and food prices nor is it about the prices of other individual items. We have been arguing for some time that the key variables to watch to determine whether inflation will be persistent are wages and unit labor costs. US wage growth is elevated, and unit labor costs are soaring (Chart 2). Finally, companies have raised prices at an annual rate of 8-9% (Chart 3). Chart 2US Labor Costs Have Been Surging
US Labor Costs Have Been Surging
US Labor Costs Have Been Surging
Chart 3US Companies Have Raised Prices At An 8-9% Annual Rate
US Companies Have Raised Prices At An 8-9% Annual Rate
US Companies Have Raised Prices At An 8-9% Annual Rate
US Stagflation Or Recession? Is the US economy heading into stagflation or recession? How persistent will US inflation prove to be? Over the next several months, US core inflation will prove to be sticky. So, stagflation (weak real growth and high inflation) is the likely outcome over the near term. Beyond this period, say on a 12-month horizon, the US economic outlook is less clear. Chart 4US Corporate Profit Margins Have Peaked
US Corporate Profit Margins Have Peaked
US Corporate Profit Margins Have Peaked
One thing we are certain of is that faced with surging unit labor costs, US companies will attempt to raise their prices to protect their profit margins and profitability. Our proxy for US corporate profit margins signals that margins are already rolling over (Chart 4). Hence, business owners and CEOs will attempt to raise selling prices further. This will lead to one of two possible scenarios for the US economy in the months ahead. Scenario 1: If customers (households and businesses) are willing to pay considerably higher prices, nominal sales will remain very robust, and profits will not collapse, reducing the likelihood of a recession. Yet, this means that inflation will become even more entrenched, and employees will continue to demand higher wages. A wage-price spiral could unravel. The Fed will have to raise rates by much more than what is currently priced in financial markets. This is negative for US share prices. Scenario 2: If customers push back against higher prices and respond by curtailing their purchases, then sales and output volume will relapse, i.e., the economy will enter a recession. In this scenario, inflation will plummet, corporate margins will shrink (prices received will rise much less than unit labor costs) and profits will plunge. Suffering a profit squeeze, companies will lay off employees, and wage growth will decelerate sharply. Although bond yields will drop significantly, the benefit to equities will be offset by plunging corporate profits. We are not certain which of these two scenarios will prevail: it is hard to determine the point at which US consumers will push back against rising prices. Nevertheless, it is notable that in both scenarios, the outlook for stocks is poor. Bottom Line: Inflation is an inert and persistent phenomenon. The inflation genie has escaped from the bottle. When this happens, it is hard to put the genie back. In short, unless the US economy experiences a recession, core inflation will not drop below 3.5%. Still On A Collision Course On February 18 of this year, we published a piece titled A Collision In The Fog Of Inflation?, arguing that the Fed and the US equity market are on a collision course amidst the fog of inflation. Specifically, we noted that “the Fed will not make a dovish pivot until markets sell off, and markets cannot rally unless the Fed backs off.” This reasoning still applies. Barring a major US growth slump, US core inflation will not drop below 3.5%. Hence, the only way for the Fed to bring core inflation toward its 2% target is to tighten policy further. Financial conditions play a critical role in shaping the trajectory of the US economy. US domestic demand might not weaken sufficiently and, hence, US core inflation will not subside below 3.5% unless financial conditions tighten further (Chart 5). That is why a scenario in which US stocks and bonds rally despite the Fed’s continuous tightening is currently unlikely. Presently, there seems to be a dichotomy between the signal from the US yield curve and share prices. Despite the extremely inverted yield curve, US share prices have not yet fallen to new lows (Chart 6). Chart 5US Financial Conditions Have Room To Tighten Further
US Financial Conditions Have Room To Tighten Further
US Financial Conditions Have Room To Tighten Further
Chart 6The US Yield Curve Is In An Equity Danger Zone
The US Yield Curve Is In An Equity Danger Zone
The US Yield Curve Is In An Equity Danger Zone
Chart 7A Negative Bond Term Premium Amid High Volatility Is Paradoxical
A Negative Bond Term Premium Amid High Volatility Is Paradoxical
A Negative Bond Term Premium Amid High Volatility Is Paradoxical
If US share prices do not break below their June lows, US interest rate expectations will rise further. The basis is that the Fed will not cut rates next year unless the economy is in recession and equities are selling off. In addition, there is a paradox in US long-term bonds. Despite exceptional inflation volatility, the Fed’s QT (reducing its bond holdings) and heightened US bond volatility, the US Treasurys’ term premium − the risk premium on bonds − is close to zero (Chart 7). That is why we expect the US bond market’s selloff to persist with 30-year yields pushing toward 4%. Consequently, US share prices will likely break below the major technical support that held up in the past 12 years (Chart 8). If the S&P 500 breaks below its June low, the next technical support is around 3200. Meanwhile, the US dollar will continue overshooting, as we argued in our recent report. Chart 8The S&P 500: Between Support And Resistance Lines
The S&P 500: Between Support And Resistance Lines
The S&P 500: Between Support And Resistance Lines
Chart 9The EM Equity Index Is Still Above Its Long-Term Technical Support
The EM Equity Index Is Still Above Its Long-Term Technical Support
The EM Equity Index Is Still Above Its Long-Term Technical Support
As for EM share prices, they will likely drop another 13-15% to reach their long-term technical support, as illustrated in Chart 9. Bottom Line: The Fed and the US stock market, and by extension global risk assets, remain on a collision course. A Global Manufacturing Recession Is Looming The latest data have corroborated our theme that global manufacturing and trade are heading into recession: Korean and Taiwanese manufacturing PMI new export orders have plunged well below the important 50 lines (Chart 10). Chinese imports for re-export are already contracting. They lead Chinese exports by three months (Chart 11). Chart 10Global Manufacturing / Trade Will Contract
Global Manufacturing / Trade Will Contract
Global Manufacturing / Trade Will Contract
Chart 11Chinese Exports Are About To Shrink
Chinese Exports Are About To Shrink
Chinese Exports Are About To Shrink
Chart 12Emerging Asian Currencies And Global Cyclicals-To-Defensives Stock Performance
Emerging Asian Currencies And Global Cyclicals-To-Defensives Stock Performance
Emerging Asian Currencies And Global Cyclicals-To-Defensives Stock Performance
Chinese import volumes will continue shrinking, and EM ex-China domestic demand will relapse following the ongoing monetary tightening by their central banks. Finally, Emerging Asian currencies have been plunging, and such rapid and large-scale depreciation is a precursor to a global trade/manufacturing recession (Chart 12). Bottom Line: The imminent global trade contraction is bad for EM stocks and currencies as well as global cyclicals. Investment Strategy A hawkish Fed amid a global trade/manufacturing recession is producing a bearish cocktail for EM currencies and risk assets. Absolute-return investors should stay put on EM risk assets. Continue underweighting EM in global equity and credit portfolios. Emerging Asian currencies have more downside given the budding contraction in their exports and the interest rate differential moving further in favor of the US dollar. Commodity prices and commodity currencies remain at risk from the global manufacturing recession and the absence of a revival in Chinese demand. Overall, the US dollar will overshoot in the near term. We continue to short the following currencies versus the USD: ZAR, COP, PEN, PLN and IDR. In addition, we continue to recommend shorting HUF vs. CZK, KRW vs. JPY, and BRL vs. MXN. EM currency depreciation will cause EM credit spreads to widen. Odds are that EM sovereign and corporate bond yields will rise, which is a bearish signal for EM non-TMT stocks, as illustrated in Chart 13. Chart 13EM USD Bond Yields Are Instrumental For EM Share Prices
EM USD Bond Yields Are Instrumental For EM Share Prices
EM USD Bond Yields Are Instrumental For EM Share Prices
Chart 14Beware Of A Breakdown in EM Tech Stocks
Beware Of A Breakdown in EM Tech Stocks
Beware Of A Breakdown in EM Tech Stocks
EM technology stocks are also breaking down. The share prices of TSMC, Samsung and Tencent have all fallen below their long-term technical supports (Chart 14). This negative technical profile coupled with our fundamental assessment point to a further slide in these share prices. Arthur Budaghyan Chief Emerging Markets Strategist arthurb@bcaresearch.com Strategic Themes (18 Months And Beyond) Equities Cyclical Recommendations (6-18 Months) Cyclical Recommendations (6-18 Months)
Executive Summary At the margin, the European Union’s proposed €140 billion “windfall profits” tax on electricity providers not using natural gas to generate power will blunt the message markets are sending to consumers to conserve energy, by distributing this windfall to households to offset higher energy costs. A “solidarity contribution” from oil, gas and coal producers – an Orwellian rendering of “fossil-fuel tax” – will reduce capex at a time when it is needed to expand supply. These measures – the direct fallout of the EU’s failed Russia-engagement policy – will compound policy uncertainty in energy markets, which also will discourage investment in new supply. Efforts to contain energy prices of households and firms in the UK will be borne by taxpayers, who will be left with a higher debt load in the wake of the government’s programs to limit energy costs, and higher taxes to service the debt. EU Still At Risk To Russia Gas Cutoff
EU Energy Markets: "Not Fit For Purpose" For A Reason
EU Energy Markets: "Not Fit For Purpose" For A Reason
Bottom Line: The EU and UK governments are inserting themselves deeper into energy markets, which will distort fundamentals and prices, leaving once-functioning markets “unfit for purpose.” This likely will reduce headline inflation beginning in 3Q22 by suppressing energy prices, and will discourage conservation and capex. Energy markets will remain tight as a result. We were stopped out of our long the COMT ETF with a loss of 5.4% and our XOP ETF with a gain of 24.6%. We will re-open these positions at tonight’s close with 10% stop-losses. Feature The EU is attempting to address decades of failed policy – primarily its Ostpolitik change-through-trade initiative vis-à-vis Russia – in a matter of months.1 This policy was brought to a crashing halt earlier this year by Russia’s invasion of Ukraine, which led to an economic war pitting the EU and its NATO allies against Russia. This conflict is playing out most visibly in energy markets. For investors, the most pressing issue in the short term center around the trajectory of energy prices – primarily natural gas, which, unexpectedly, has become the most important commodity in the world: It sets the marginal cost of power in the EU; forces dislocations in oil and coal markets globally via fuel substitution, and drives energy and food inflation around the world higher by increasing space-heating fuel costs and fertilizer costs. These effects are unlikely to disappear quickly, especially in the wake of deeper government involvement in these markets. The EU is dealing with its energy crisis by imposing taxes on power generators and hydrocarbons producers. It is proposing a €140 billion “windfall profits” tax on electricity providers not using natural gas to generate power, and is advancing a “solidarity contribution” from oil, gas and coal producers – an Orwellian rendering of a “fossil-fuel tax. Lastly, the EU will mandate energy rationing to stretch natural gas supplies over the summer and winter heating season. The tax hikes under consideration will reduce capex at a time when it is needed to expand supply. Related Report Commodity & Energy StrategyOne Hot Mess: EU Energy Policy The UK is taking a different route v. the EU, by having the government absorb the cost of stabilizing energy prices for households and firms directly on its balance sheet. Beginning 1 October, annual energy bills – electricity and gas – will be limited to £2,500. The government is ready to provide support for firms facing higher energy costs out of a £150 billion package that still lacks formal approval via legislation to be dispensed. This obviously has businesses concerned.2 Over the medium to long term, this economic war will realign global energy trade – bolstering the US as the world’s largest energy exporter, and cementing the alliance of China-Russia energy trade. Whether this ultimately evolves into a Cold War standoff remains an open question. EU Policy Failures And The Power Grid’s Limitations Chart 1Russia Plugged The Gap In EU Energy Supply
EU Energy Markets: "Not Fit For Purpose" For A Reason
EU Energy Markets: "Not Fit For Purpose" For A Reason
In addition to its failed Russia policy, the EU’s aggressive support of renewable energy disincentivized domestic fossil fuel production and forced an increased reliance on imports – with a heavy weighting toward Russian hydrocarbons – instead. Once Russia stopped playing the role of primary energy supplier to the EU, the bloc’s energy insecurity became obvious (Chart 1). The EU’s current power-pricing system is forcing households and industries to bear the brunt of energy insecurity and high natgas prices resulting from poor energy policy design.3 And it forces the government to tax energy suppliers – with “windfall profits” taxes ostensibly meant to capture economic rents, as officials are wont to describe the taxes – to fund consumer-support programs. While REPowerEU aims to alleviate the bloc’s energy insecurity by importing non-Russian LNG and increasing renewable energy’s share in the energy mix, both alternatives face bottlenecks, which could delay their implementation. This could keep energy markets in the EU tight over the medium term, until additional LNG capacity comes online in the US and elsewhere. Renewable electricity is not as reliable as electricity generated by fossil fuels on the current power grid, which needs to be constantly balanced to avoid cascading failure. This means power consumed must equal power supplied on a near-instantaneous basis to avoid grid failure. However, given its reliance on variable weather conditions, renewable energy by itself cannot keep the grid balanced, primarily due to the lack of utility-scale storage for renewable power. Battery-storage technology and green-hydrogen energy can be used in conjunction with other renewables to balance the power grid, but they still are nascent technologies and not yet scalable to the point where they can replace hydrocarbon energy sources. Furthermore, the continued addition of small-scale renewables-based power generation located further away from demand centers – cities and industrial complexes – will continue to increase the complexity and scale of the power grid.4 Realizing the importance of incumbent power sources and the infrastructure requirements to diversify away from Russian fuels, the EU labelled investments in natural gas and nuclear power as green investments in July.5 Of the two energy sources, natural gas will likely play a larger role in ensuring the bloc’s energy security over the next 3-5 years, given the polarized views on nuclear power.6 In its most recent attempt to stabilize power prices, the EU plans to redirect “inframarginal” power producers’ windfall profits to households and businesses, provided those producers do not generate electricity using natgas. The Commission did not suggest capping Russian natgas prices since that could be divisive among EU member states, and could further jeopardize the bloc’s energy security. The redistribution of the windfall profits taxes is coupled with calls for mandatory electricity demand reductions in member states. We are unsure of the net effect of these directives on physical power and natural gas balances. However, government interference will feed into the policy uncertainty surrounding electricity and natural gas markets. EU Storage Continues To Build Against all odds, the EU has been aggressively building gas in storage (Chart 2), as demand from Asia has been low during the summer months (Chart 3). This has allowed high Dutch Title Transfer Facility (TTF) prices – the European natgas benchmark – to lure US LNG exports away from Asia (Chart 4). According to Refinitiv data, US exports of LNG to Europe increased 74% y/y to a total of over 1,370 Bcf for the first half of 2022. Chart 2Europe Has Been Aggressively Building Gas Storage
EU Energy Markets: "Not Fit For Purpose" For A Reason
EU Energy Markets: "Not Fit For Purpose" For A Reason
Chart 3US LNG Exports To Asia Dropped In H1 2022
US LNG Exports To Asia Dropped In H1 2022
US LNG Exports To Asia Dropped In H1 2022
Chart 4High TTF Prices Attract US LNG
EU Energy Markets: "Not Fit For Purpose" For A Reason
EU Energy Markets: "Not Fit For Purpose" For A Reason
Since Russian gas flows to Asian states have not been completely cut off, this will reduce ex-EU demand for US LNG, providing much needed breathing room for international LNG markets. However, as the pre-winter inventory-injection period in Asia continues, there is an increasing likelihood the spread between Asian and European gas prices narrows. This could incentivize US producers to export more fuel to Asia, slowing the EU’s build-up of gas storage. US plans to increase LNG export capacity will alleviate current tightness in international gas markets over the medium term, as new export facilities are expected to begin operations by 2024, and be fully online by 2025 (Chart 5). Until US LNG exports increase, global natgas markets will continue to remain tight and prices will be volatile. Chart 5US LNG Export Capacity Projected To Rise
EU Energy Markets: "Not Fit For Purpose" For A Reason
EU Energy Markets: "Not Fit For Purpose" For A Reason
Russia’s Asian Gas Pivot Since the energy crisis began, China has accelerated the rate at which it imports discounted Russian LNG.7 Russia is aiming to increase gas exports to China to replace the sales lost to the EU following its invasion of Ukraine. Russia recently signed a deal with China to increase gas flows by an additional 353 Bcf per year, with both states agreeing to settle this trade in yuan and rouble to circumvent Western currencies, primarily the USD. Additionally, the Power of Siberia pipeline is expected to reach peak transmission capacity of ~ 1,340 Bcf per year by 2025. Chart 6China Will Not Want All Eggs In One Basket
EU Energy Markets: "Not Fit For Purpose" For A Reason
EU Energy Markets: "Not Fit For Purpose" For A Reason
Adding to the China-Russia gas trade is the planned Power of Siberia 2 pipeline, which will have an annual expected capacity of 1,765 Bcf. This will move gas to China from western Siberia via Mongolia, and is expected to come into service by 2030; construction is scheduled to begin in 2024. This will redirect gas once bound toward the EU to China. Russia’s ability to develop and construct the required infrastructure to pivot gas exports to China and the rest of Asia will be hindered by Western sanctions, as international private companies walk away from Russian projects and international investment in that state decline. This is a deeper consequence of the sanctions imposed by the US and its allies, as it denies Russia the capital, technology and expertise needed to fully develop its resource base. On China’s side, even if both Power of Siberia pipelines are developed to operate at full capacity, the world’s largest natgas importer may be wary of becoming overly reliant on Russia for a significant proportion of its gas (and oil) imports. China has developed a diversified network of natgas suppliers, which, as the experience of the EU demonstrates, is the best way to avoid energy-supply shocks (Chart 6). Investment Implications We expect natural gas price volatility to remain elevated over the next 2-3 years. EU governments’ interference with the natgas and power markets' structure and pricing mechanisms – be it via natgas price caps or skimming gas suppliers’ profits – will distort price signals, detaching them from fundamental gas balances. This will perpetuate the energy crisis currently plaguing the EU, by encouraging over-consumption of gas and reducing capex via taxes and levies on profitable companies operating below the market’s marginal cost curve. As a result of the dislocations caused by Russia’s invasion of Ukraine, dislocations in natural gas trade flows will continue, forcing markets to find work-arounds to replace lost Russian pipeline exports in the short-to-medium term. The EU will become more reliant on US LNG supplies, and will – over the next 2-3 years – have to outbid Asian states for supplies. Trade re-routing will take time and likely will lead to sporadic, localized shortages in the interim. The US is the largest exporter of LNG at present, but, by next year, it’s export capacity will max out. It will only start to increase from 2024, reaching full capacity by 2025. While higher export capacity from the world’s largest LNG supplier will help alleviate tight markets, in the interim, global gas prices, led by the TTF will remain elevated and volatile. The EU still receives ~ 80mm cm /d of pipeline gas from Russia, or ~ 7.4% of 2021 total gas consumption on an annual basis (Chart 7). A complete shut-off of Russian gas flows to the EU means the bloc would face even more difficulty refilling storage in time for next winter. This would keep the energy- and food-driven components of inflation high, and constrain aggregate demand in the EU generally. Chart 7EU Still At Risk To Russia Gas Cutoff
EU Energy Markets: "Not Fit For Purpose" For A Reason
EU Energy Markets: "Not Fit For Purpose" For A Reason
We continue to expect global natural gas markets to remain tight this year and next. We also expect natural gas prices to remain extremely volatile – particularly in winter (November – March), when weather will dictate the evolution of price levels. We were stopped out of our long the COMT ETF with a loss of 5.4% and our XOP ETF with a gain of 24.6%. We remain bullish commodities generally and oil in particular, and will re-open these positions at tonight’s close with 10% stop-losses. Robert P. Ryan Chief Commodity & Energy Strategist rryan@bcaresearch.com Ashwin Shyam Research Analyst Commodity & Energy Strategy ashwin.shyam@bcaresearch.com Paula Struk Research Associate Commodity & Energy Strategy paula.struk@bcaresearch.com Commodities Round-Up Energy: Bullish US distillate and jet-fuel stocks recovered slightly in the week ended 9 September 2022, rising by 4.7mm barrels to just over 155mm barrels, according to the US EIA. Distillate inventories – mostly diesel fuel and heating oil – stood at 116mm barrels, down 12% y/y. At 39.2mm barrels, jet fuel stocks are 7% below year-earlier levels. Refiners are pushing units to build distillates going into winter, in order to meet gas-to-oil switching demand in Europe and the US. Distillate inventories have been under pressure for the better part of the summer on strong demand. This is mostly driven by overseas demand. Distillate demand fell by 492k b/d last week, which helped domestic inventories recover. Year-on-year distillate demand was down 1.6% in the US. Ultra-low sulfur diesel prices delivered to the NY Harbor per NYMEX futures specification are up 50% since the start of the year (Chart 8). Base Metals: Bullish On Monday Chile’s government launched a plan to boost foreign investments, which includes providing copper miners with a 5-year break from the ad-valorem tax proposed in a new mining royalty. The plan however does not provide relief from the tax on operating profits, which are also part of the royalty. According to Fitch, the originally planned mining royalty would have significantly depleted copper miners’ profits, disproportionately impacting smaller operators, which cannot avail themselves of the benefits of economies of scale. In a sign that higher taxes spooked bigger players as well, in mid-July, BHP stated that it would reconsider investment plans in Chile if the state proceeded with the mining royalty in its original format. Ags/Softs: Neutral In its September WASDE, the USDA adjusted its supply and demand estimates for soybeans, and made substantial changes to new-crop 2022/23 US production estimates. This reduced acreage and yields by 2.7% from the previous August 2022 forecast. Ukraine’s soybean production was increased in the USDA's estimate. The USDA's soybean projections also include lower ending stocks, which are reduced from 245 million bushels to 200 million bushels. This is 11% below than 2021 levels for beans. The USDA's 2021/22 average price for soybeans remains at $14.35/bu, unchanged from last month but $1.05/bu above the 2021/22 average price (Chart 9). Chart 8NY Harbor ULSD Price Going Down
NY Harbor ULSD Price Going Down
NY Harbor ULSD Price Going Down
Chart 9Soybean Prices Going Down
Soybean Prices Going Down
Soybean Prices Going Down
Footnotes 1 For a discussion of the EU’s past policy mistakes which laid the foundation for current crisis, please see One Hot Mess: EU Energy Policy, which we published on May 26, 2022. It is available at ces.bcaresearch.com. 2 Please see UK business warned of delay to state energy support, published by ft.com on September 13, 2022. 3 The current EU power pricing system is set up so that the most expensive power generator – currently plants using natgas – set the price for the entire electricity market. This system was put in place to incentivize renewably generated power, however, the EU does not have the required infrastructure and technology to be reliant solely on green electricity. 4 For a more detailed discussion on power grid stability, and how renewables will affect it, please ENTSO-E’s position paper on Stability Management in Power Electronics Dominated Systems: A Prerequisite to the Success of the Energy Transition. According to estimates by WindEurope and Hitachi Energy, Europe will need to double annual investments in the power grid to 80 billion euros over the next 30 years to prepare the power grid for renewables. 5 For our most recent discussion on the infrastructure requirements of pivoting away from Russian piped gas, please see Natgas Markets: The Eye Of The Storm, which we published on June 9, 2022. It is available at ces.bcaresearch.com. 6 In 2021, nuclear power constituted majority of France’s energy mix at 36% and had nearly the lowest share for Germany at 5%. In response to the current energy crisis, Germany has opted to restart coal power plants and only keep nuclear plants on standby, signaling that the EU’s largest energy consumer would prefer to use coal despite its carbon emissions target. 7 According to Bloomberg, China signed a tender to receive LNG from Russia’s Sakhalin-2 project through December at nearly half the cost of the spot gas rates at the time. Investment Views and Themes New, Pending And Closed Trades WE WERE STOPPED OUT OF OUR LONG THE COMT ETF WITH A LOSS OF 5.4% AND OUR XOP ETF WITH A GAIN OF 24.6%. WE WILL RE-OPEN THESE POSITIONS AT TONIGHT’S CLOSE WITH 10% STOP-LOSSES. Strategic Recommendations Trades Closed in 2022
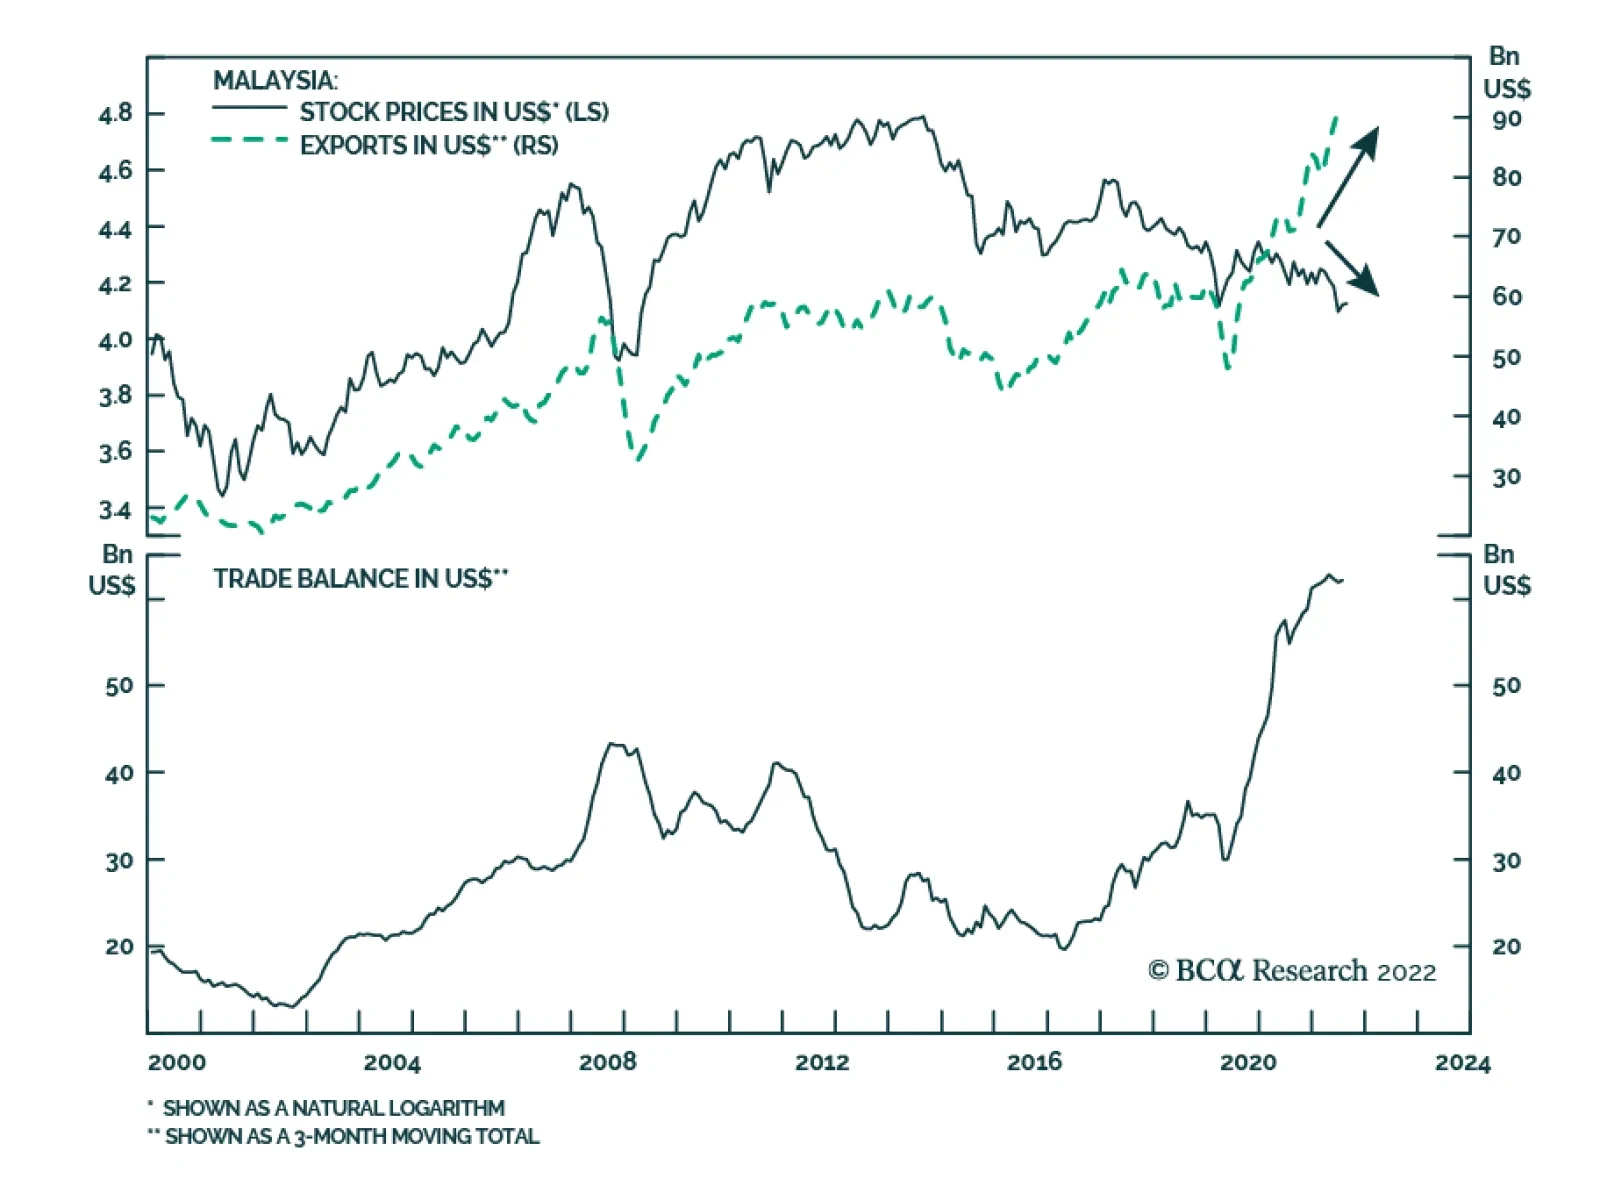
Strong exports have historically benefitted Malaysia’s small, open economy, and in turn, its stock market. However, in a sharp departure from past trends, Malaysian stocks are weakening despite a massive trade bonanza. Our Emerging Markets strategists…
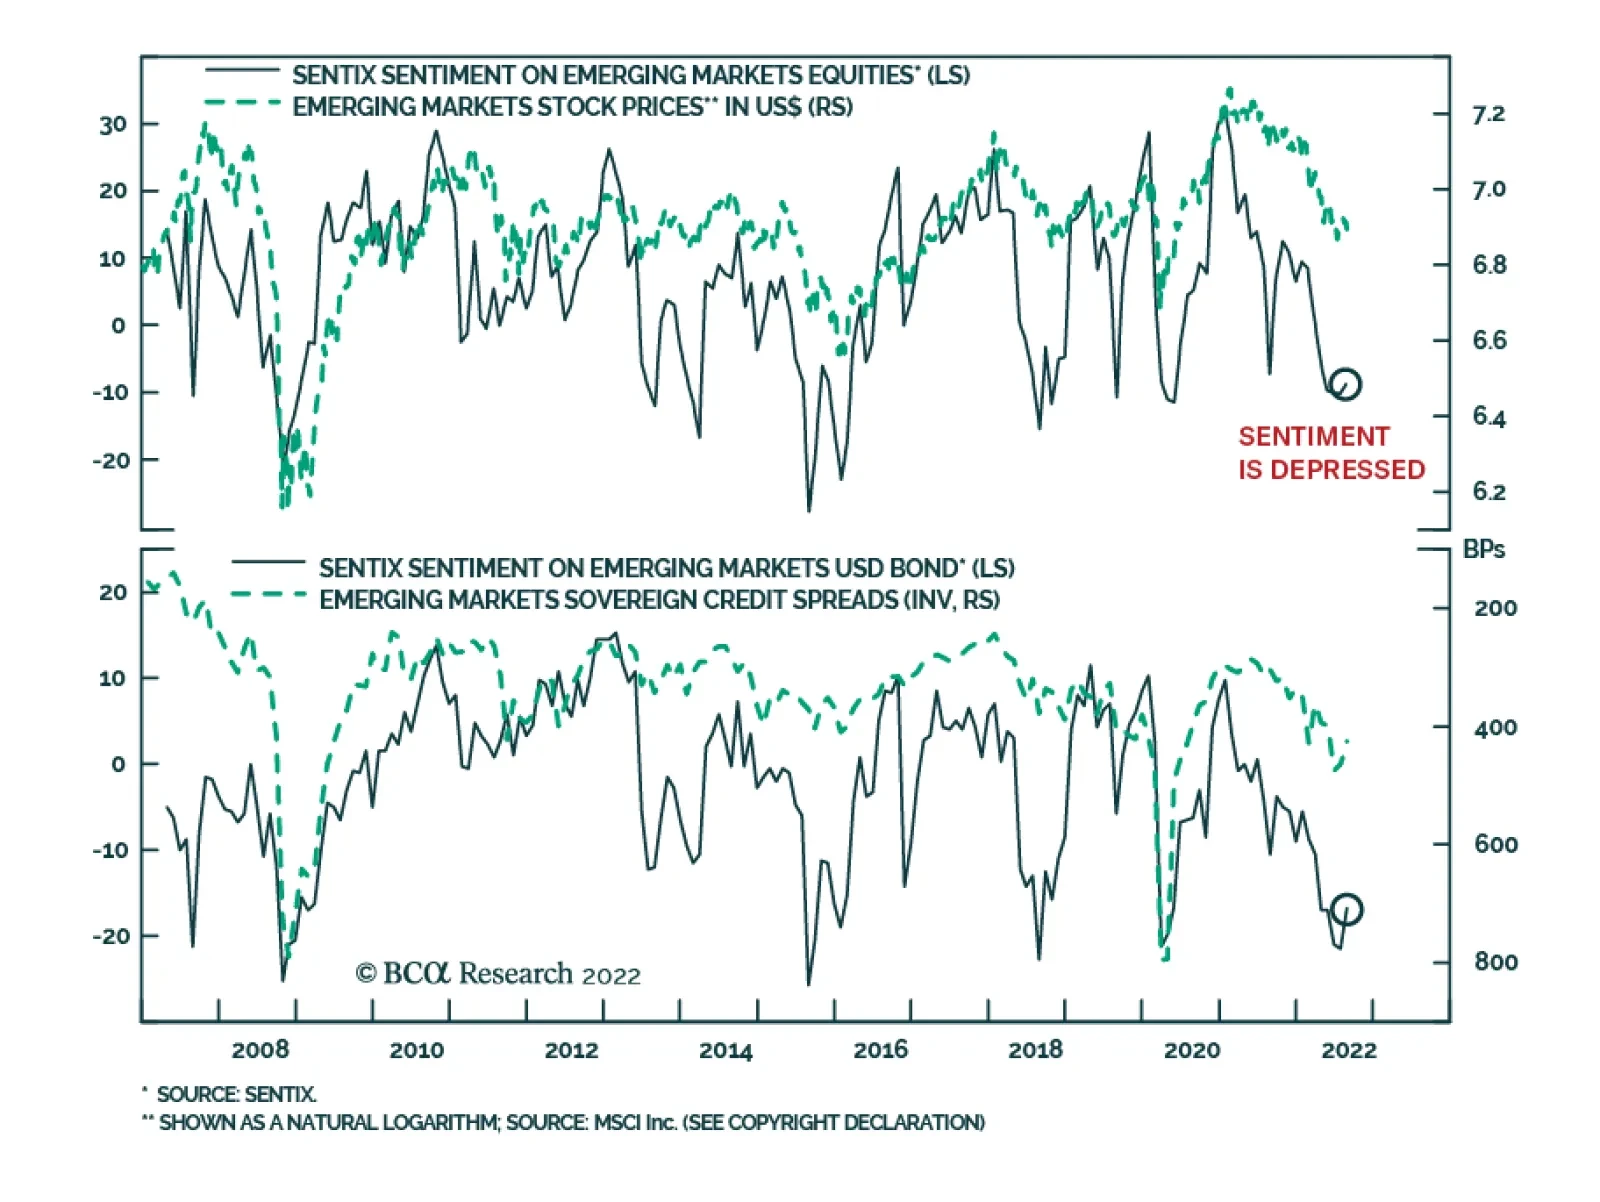
Sentix’s indicators for investor morale towards emerging market equities and bonds ticked up in August. Nevertheless, the latest readings remain extremely depressed and are consistent with pessimism towards emerging market assets. From a contrarian…
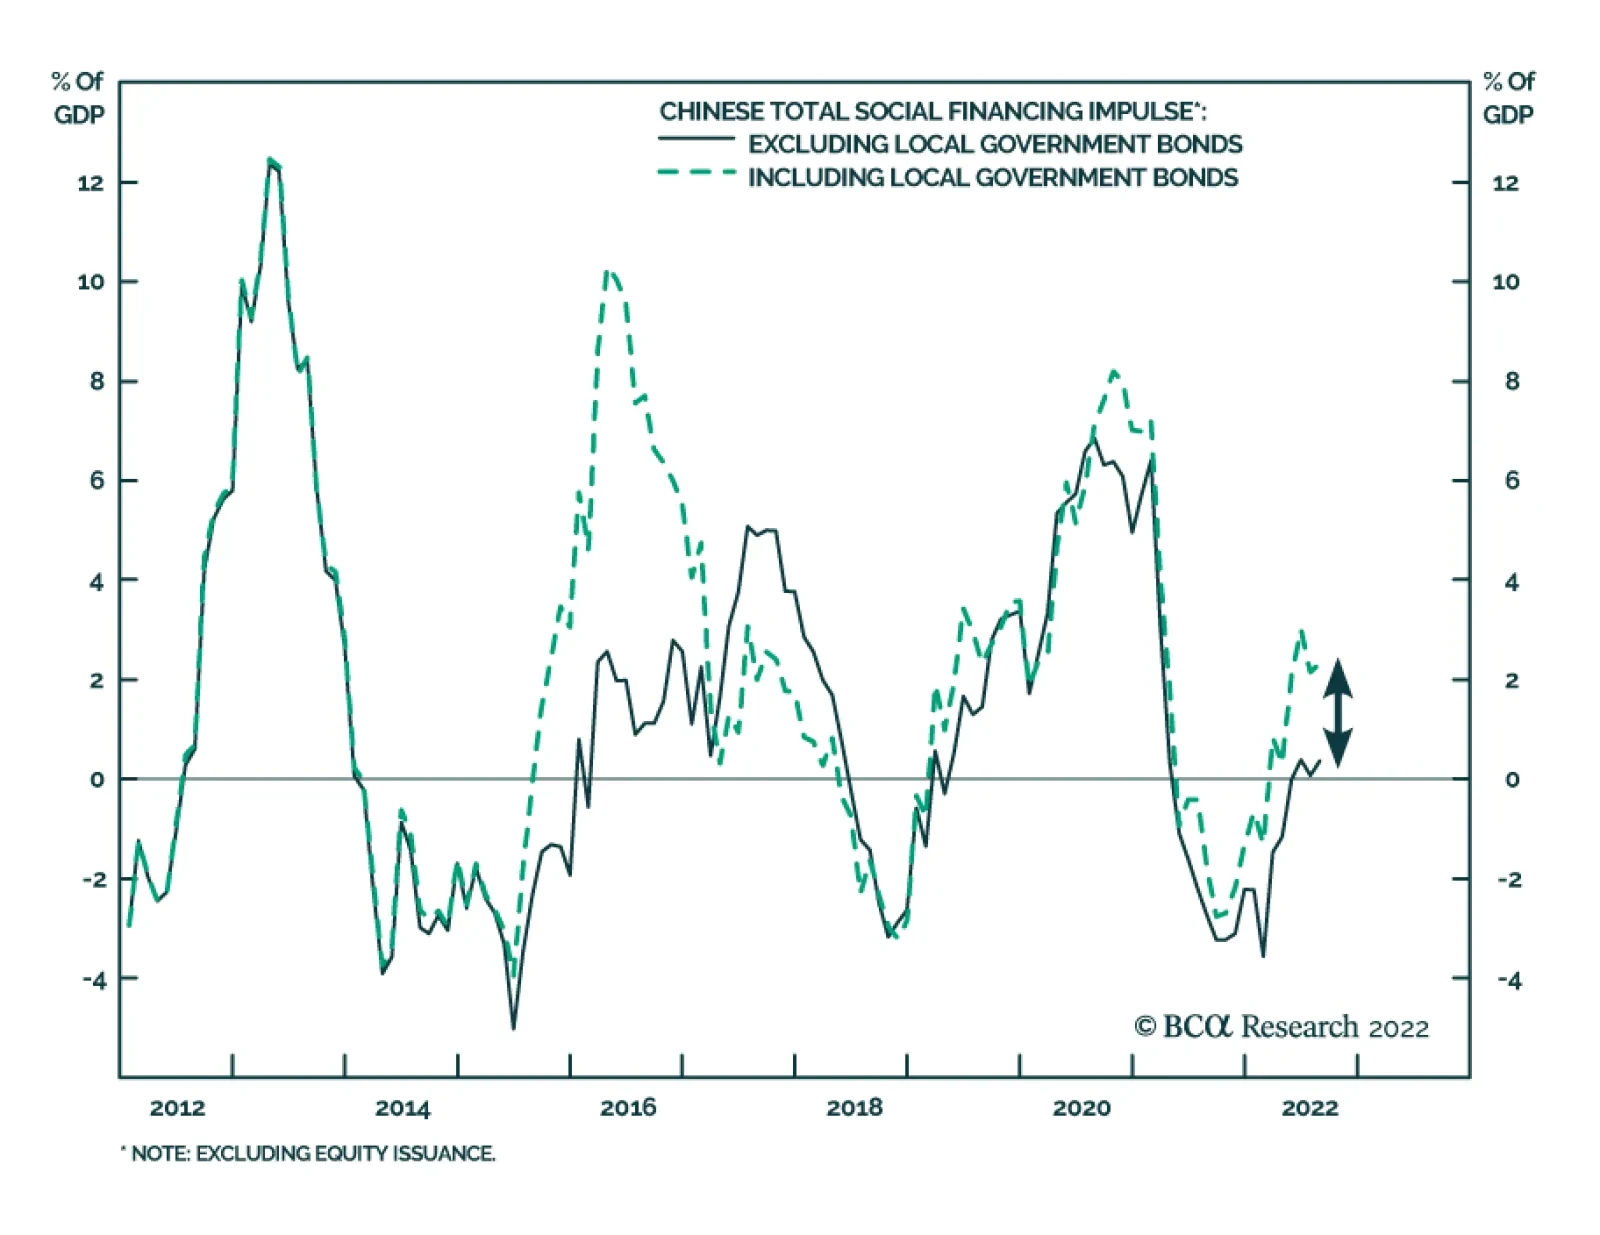
China’s aggregate financing in August tripled to a larger-than-expected CNY 2.43 tr, following a CNY 0.76 tr in July and beating expectations of CNY 2.08 tr. New bank loans doubled, reaching CNY 1.25 tr from CNY 0.68 tr, albeit below expectations. Seasonal…
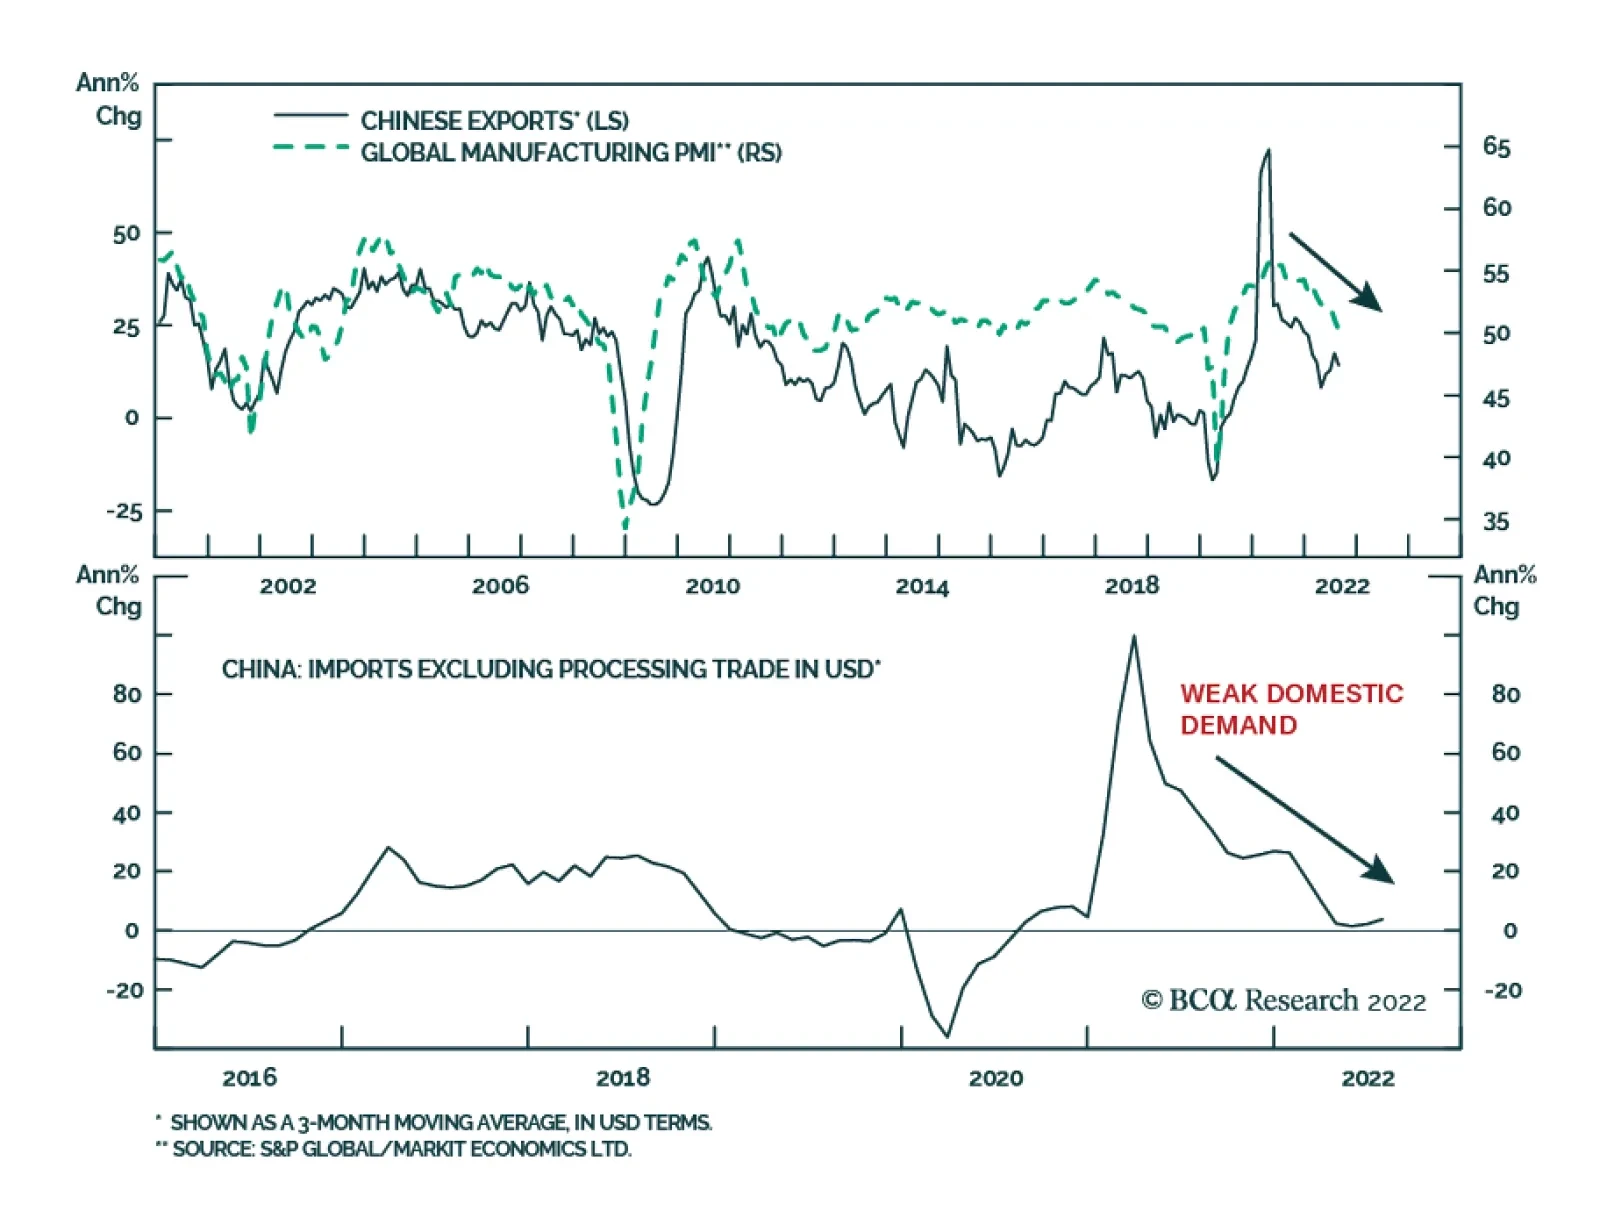
Chinese imports and exports significantly missed expectations in August. Exports grew by 7.1% y/y in US dollar terms, down from 18.0% y/y and largely below the 13.0% y/y anticipated. Imports rose 0.3% y/y in August, down from 2.3% y/y in July and below…
BCA Research’s China Investment Strategy service concludes that the conditions do not seem to be met for a drastic change in Beijing’s dynamic zero-Covid strategy. China’s transition from zero tolerance to an orderly, managed approach to life with an evolving…
Executive Summary A Structural Downshift In China’s Real Estate Investment Growth
Real Estate Investment Growth In China Will Structurally Shift Lower
Real Estate Investment Growth In China Will Structurally Shift Lower
The Politburo has set a date for the much-anticipated 20th Communist Party Congress at which President Xi will most likely secure his third term as general secretary. Although we expect China’s leaders to focus on supporting the economy following the Party Congress, there are high odds that the authorities will underdeliver on policy easing. Beijing may recalibrate its stringent zero-Covid policy next year, but the conditions are presently not yet met for a turnaround in the current strategy. China’s structural issues remain, and policymakers will likely continue to tackle them while downplaying the importance of GDP growth. The housing market remains the epicenter of risk to both China’s financial system and social stability. China’s leaders have incrementally introduced accommodative initiatives, but they still continue to seek reduced leverage among property developers. Investors should be prepared for a scenario that China will avoid “irrigation-type” stimulus in the next six months. Therefore, the economy will continue to expand at below potential growth. Bottom Line: There is a nontrivial risk that China’s stimulus will fall short of market expectations following the upcoming Party Congress. This poses risks to Chinese share prices. Market participants believe that the 20th Communist Party Congress beginning October 16 will be a jumping off point for Chinese leaders to stimulate the economy more aggressively. This would signal a shift in the leadership’s focus, from securing political stability ahead of the Party Congress to ensuring an economic recovery next year. However, to achieve a meaningful and sustainable rebound in economic activity and equity market performance, policymakers will need to overcome two major hurdles: the zero-Covid policy and the "three red lines" regulation for property developers. At the risk of being wrong, we identify some of the factors that will preclude using irrigation type of stimulus after the conclusion of the Party Congress. Given the prevailing headwinds to China’s economy and the lack of “all-in” type of stimulus, we recommend that global equity portfolios stay neutral for now on Chinese onshore stocks and underweight offshore stocks. The Date Is Set! The Politburo’s announcement that the 20th Party Congress would take place earlier than November, in our view, is a sign of political stability and marginally positive for the economy. On the opening day, President Xi will deliver the Party’s work report, which will chart China’s policy trajectory for the next five years and beyond. It is generally believed that President’s Xi’s vision to turn China into an advanced global power will be endorsed by the Party. The earlier date for the Congress is significant for the following reasons: It shows that preparations for the Party Congress are progressing on schedule. President Xi will most likely cement his third term as general secretary, leaving little room for surprises from a political standpoint. The Party Congress will provide some indication whether the leadership will revise policies, including the zero-Covid strategy and industry regulations. Lower-level officials have been waiting to see which way the political winds are blowing. The Party Congress will clarify the situation and allow officials to focus on their economic work. Bottom Line: The Party Congress, along with the Central Economic Work Conference in December, will set the tone for China’s key economic, social, and industry policies for 2023 and beyond. Endgame To The Zero-Covid Strategy? Chart 1The Primary Risk To China's Economic Recovery Is Its Zero-Covid Policy
The Primary Risk To China's Economic Recovery Is Its Zero-Covid Policy
The Primary Risk To China's Economic Recovery Is Its Zero-Covid Policy
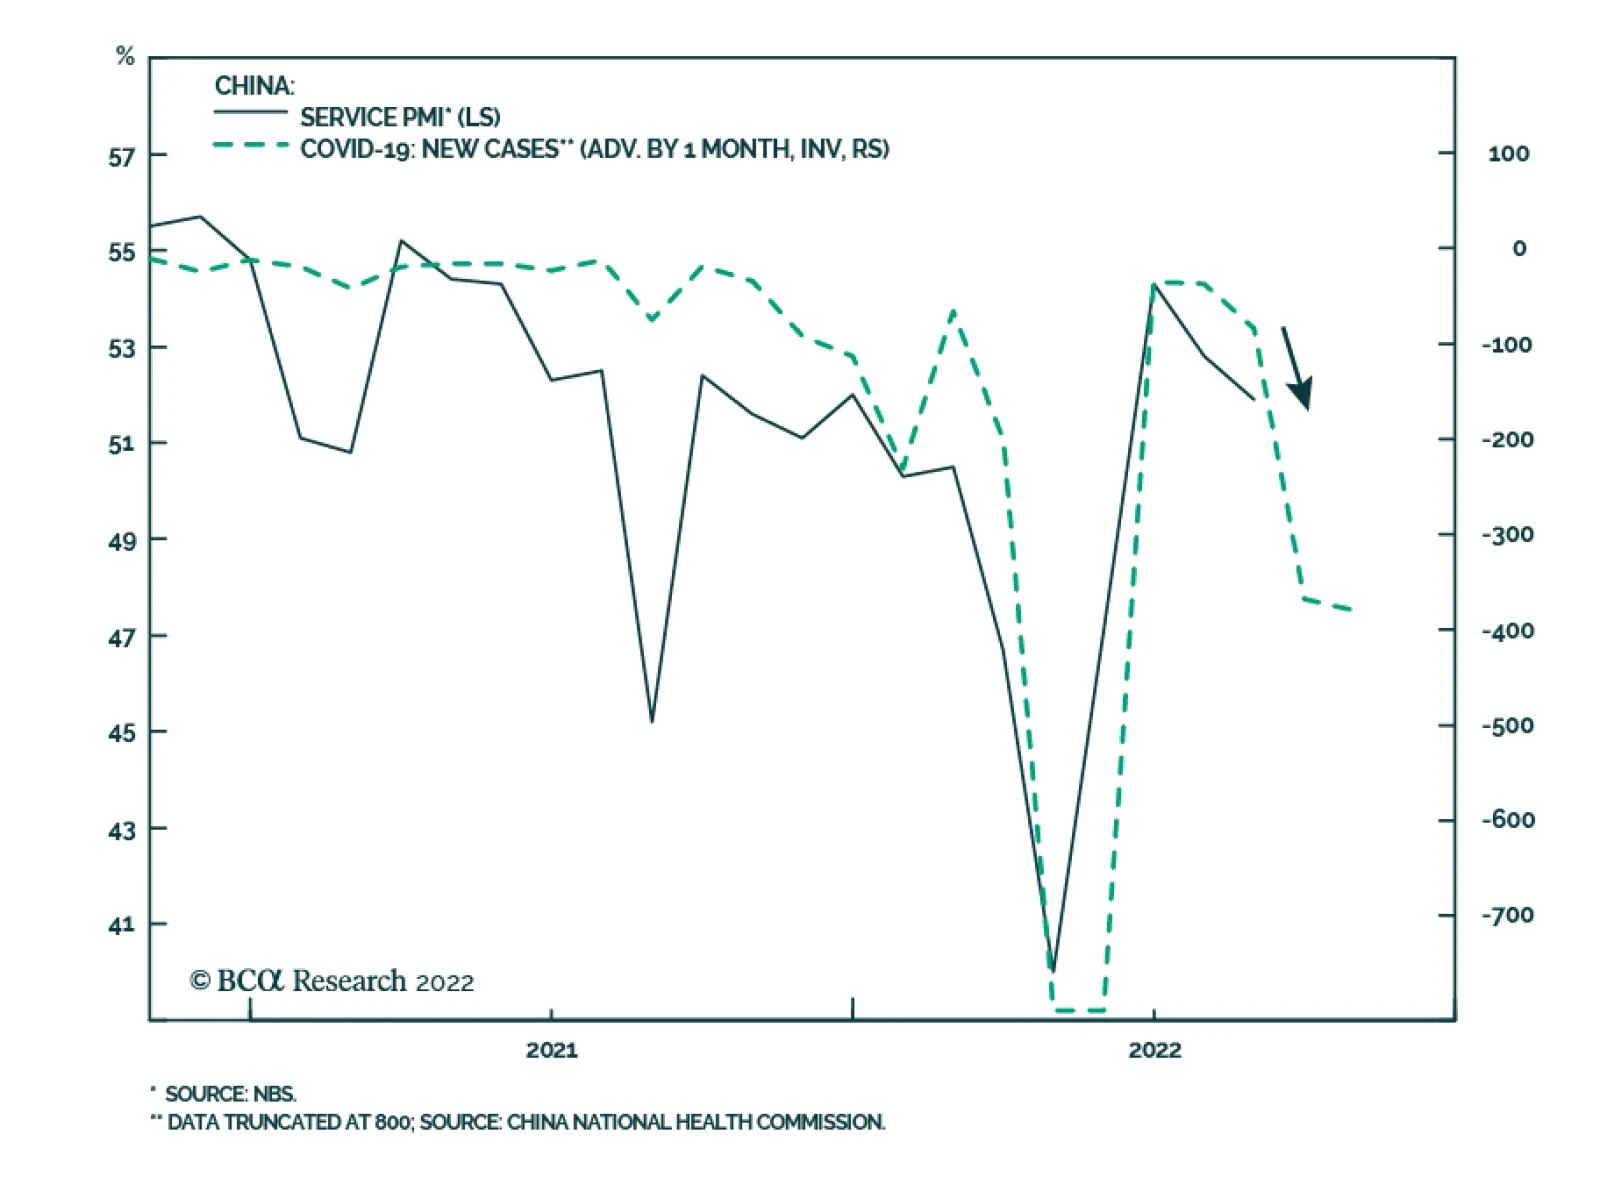
The primary risk to China’s economic recovery is its stringent zero-Covid policy, which has significantly impacted the service sector, household income and consumption (Chart 1). In recent months policymakers have incrementally adjusted their Covid-containment measures, such as shortening the quarantine period for international travelers and streamlining mass testing procedures. However, the fundamental goal of eradicating domestic Covid cases remains intact. The best scenario in the coming year, in our view, is that China will adopt hybrid measures to combat Covid. Countries like Japan, South Korea, New Zealand, and Australia have all adopted a mixed series of Covid-control policies. These include a gradual reduction in testing and quarantine protocols, an increase in targeted vaccination among the elderly, an introduction of antiviral drugs and strengthening the quality of primary care. However, China may not tolerate the level of Covid experienced in these countries, especially since their number of new cases and related deaths have risen of late (Chart 2A and 2B). Chart 2ACovid Case Counts In Other Countries Have Risen Or Remain Elevated...
Covid Case Counts In Other Countries Have Risen Or Remain Elevated...
Covid Case Counts In Other Countries Have Risen Or Remain Elevated...
Chart 2B...Along With Number Of Deaths
...Along With Number Of Deaths
...Along With Number Of Deaths
China sees its extremely low case count as proof that the dynamic zero-Covid policy has succeeded (Chart 3). It argues that if it shifts course and re-opens before proper protective measures have been introduced, then the losses might exceed a million deaths. China’s authorities believe that Hong Kong SAR’s high death rate in the spring is stark proof of that possible scenario (Chart 4). Chart 3China Has Managed To Keep Its Covid Case And Death Counts Extremely Low
China Has Managed To Keep Its Covid Case And Death Counts Extremely Low
China Has Managed To Keep Its Covid Case And Death Counts Extremely Low
Chart 4Situation In HK SAR Earlier This Year Has Probably Sent A Warning Sign To The Mainland
Situation In HK SAR Earlier This Year Has Probably Sent A Warning Sign To The Mainland
Situation In HK SAR Earlier This Year Has Probably Sent A Warning Sign To The Mainland
Thus, a sudden pivot from zero-Covid to living with the virus next year seems farfetched. China’s National Health Commission experts recently stated that victory over the virus would require effective vaccines, treatments and mild variants. We examine these three premises as follows: Covid vaccination rate: China’s overall Covid vaccination rate is high at 90% as of August this year. However, more than 35% of Chinese over age 60 have not received a booster dose and only 61% above age 80 have had a primary vaccination. Given that the majority of China’s population has not been exposed to the virus and is immunologically naïve, unlike their Western counterparts, the population relies completely on immunity acquired through Covid vaccines. Chart 5China's Vaccination Progress Has Stalled
China's Vaccination Progress Has Stalled
China's Vaccination Progress Has Stalled
China’s daily vaccination rate has fallen to below 200,000 per day, sharply down from the peak of 3-5 million per day in March and April (Chart 5). Even if we assume that three doses of China’s domestically produced vaccines are as effective as the West’s mRNA vaccines, at the current pace it would take several years to provide three doses of Covid vaccines to China’s 1.4 billion people. Hence, to significantly loosen zero-Covid policy, we would need to see a huge acceleration in the country’s vaccination rate. Treatment drugs: China okayed the imports and use of Pfizer’s antiviral drug Paxlovid in February and approved its first homegrown Covid antiviral medication “Azvudine” in July. Azvudine’s efficacy in reducing Covid-related hospitalization and deaths remains to be seen. The manufacturer, Genuine Biotech, says that the facility's annual production capacity is 1 billion tablets (each tablet is 1 mg), but is expected to reach 3 billion tablets in the future. Assuming each patient will need 50 mgs of Azvudine to complete a full course of treatment (as instructed by the drug manufacturer), the company can provide enough tablets for approximately 20 million Chinese within one year. To put the number into respective, China has more than 26 million people over age 80, of which more than 10 million have not had their first Covid vaccine. Chart 6The Level Of Beijing's Covid Policy Stringency Remains Elevated
The Level Of Beijing's Covid Policy Stringency Remains Elevated
The Level Of Beijing's Covid Policy Stringency Remains Elevated
Milder variants: Another possibility is if new mild variants emerge next year and they cause no harm or panic among the population. However, there is no guarantee that Beijing will be willing to relent on its Covid policy based on evidence and statistics from other countries where the populations may have received mRNA vaccines. Even statistics provided within China may not warrant a decisive reopening of the economy. A recent study conducted by leading Chinese public health experts found that only 22 of the nearly 34,000 Covid patients hospitalized in Shanghai from March 22 to May 3 developed severe illness. Nonetheless, the study has not prompted policymakers to step back from the tight Covid control protocols (Chart 6). Bottom Line: The conditions do not seem to be met for a drastic change in Beijing’s dynamic zero-Covid strategy. China’s transition from zero tolerance to an orderly, managed approach to life with an evolving Covid virus will likely be long and difficult. The Housing Market Policy Dilemma The other key to achieving a meaningful recovery in China’s economy is through stimulating the country’s housing market. We expect that more accommodative real estate policy initiatives will be introduced later this year and early next year. However, structural headwinds in the property market will limit the government's willingness to stimulate the sector as aggressively as in previous cycles. China’s shrinking working population since 2015 likely led to a peak in the demand for housing in 2017/18. Moreover, it is estimated that China's total population growth will turn negative this year, further suppressing demand (Chart 7). The combination of demographic headwinds and a slowdown in urbanization, means that if policymakers overstimulate the sector as in the past, then they will have a bigger bubble to pop in the future. There is no indication that the authorities will stop focusing on deleveraging and reducing financial risks in the real estate sector. The magnitude of mortgage rate cuts so far this year is much smaller than in the 2008/09 and 2015/16 cycles. Moreover, mortgage rates remain higher than growth in household income and home prices (Chart 8). The positive gaps between mortgage rates and both household income growth and house price appreciation discourage house purchases. Chart 7Demand For Housing In China Is On A Structural Downtrend
Demand For Housing In China Is On A Structural Downtrend
Demand For Housing In China Is On A Structural Downtrend
Chart 8Current Rate Cuts Are Not Enough To Meaningfully Spur Demand For Housing
Current Rate Cuts Are Not Enough To Meaningfully Spur Demand For Housing
Current Rate Cuts Are Not Enough To Meaningfully Spur Demand For Housing
Importantly, while policymakers have intervened and provided liquidity to cash-strapped real estate developers, the “three red lines” policies restraining developers’ leverage remain intact. The message is clear: Beijing will use all necessary tools to prevent systemic risks and social unrest by ensuring the completion of existing housing projects. However, the authorities will continue to force developers to structurally shift their business models and reduce their leverage. Chinese authorities would be more incentivized to bail out the sector if there were risks of widespread mortgage loan defaults among households. In our view, this risk remains low in the next 6 to 12 months. The mortgage down payment ratio is relatively high in China and mortgages are full recourse loans as borrowers are personally liable beyond the collateral (i.e., the property asset). This combination reduces the incentive for homebuyers to stop paying mortgages even in a situation of negative equity (i.e., when the value of the property asset falls below the outstanding mortgage). Indeed, ongoing mortgage boycotts have been isolated to unfinished apartments in stalled projects. The boycotts are driven by homebuyers to pressure developers to finish these projects and are not due to household financial difficulties. There will likely be more defaults by overleveraged developers next year. The sector will consolidate further, with opportunistic, well-funded developers taking advantage of the situation to acquire distressed assets at a discount. Many of these may be state-owned or state-backed companies and investment funds. Chart 9Real Estate Investment Growth In China Will Structurally Shift Lower
Real Estate Investment Growth In China Will Structurally Shift Lower
Real Estate Investment Growth In China Will Structurally Shift Lower
Bottom Line: Policymakers will continue to feed the housing sector with stimulus measures, but the leadership might be reluctant to overstimulate the sector. China’s real estate market dynamics, particularly the completion of existing projects, will likely improve on the margin in the next 6 to 12 months. Structurally, however, China’s home sales and real estate investment growth will continue shifting to a lower gear (Chart 9). Investment Conclusions At the start of the year, China was expected to aggressively stimulate its economy. This was based on the premise that policymakers would not tolerate slower economic growth ahead of the Party Congress. Nonetheless, Chinese leaders downplayed the annual GDP growth target this year, a major deviation from the past. Post October’s Party Congress, we think that the authorities will continue to roll out measures to support the economy, but we recommend that investors remain realistic about the magnitude of policy easing. There are nontrivial risks that policymakers will continue to tackle structural issues, while allowing the economy to muddle through. With piecemeal stimulus, China may still be able to manage a soft landing in its property market and prevent the risks from spilling over to other sectors of the economy. In this case, we will monitor macro and financial market dynamics and change our stance on Chinese equities if warranted (Chart 10A and 10B). Chart 10AWithout More Aggressive Stimulus, Upsides In Chinese Equity Prices Are Capped
Without More Aggressive Stimulus, Upsides In Chinese Equity Prices Are Capped
Without More Aggressive Stimulus, Upsides In Chinese Equity Prices Are Capped
Chart 10BWithout More Aggressive Stimulus, Upsides In Chinese Equity Prices Are Capped
Without More Aggressive Stimulus, Upsides In Chinese Equity Prices Are Capped
Without More Aggressive Stimulus, Upsides In Chinese Equity Prices Are Capped
Lastly, investors should be prepared for greater emphasis of common prosperity policies at the Party Congress. Reducing income inequality and improving social welfare will remain core principles of President Xi’s political agenda. Common property policies mean that there will be a continued shift towards a larger share of labor compensation versus capital in the country’s national income (Chart 11). The pandemic in the past 2.5 years has likely exacerbated the country’s income inequality and discontent among middle-class households. Chart 11Implications Of China’s Common Prosperity Policy
Implications Of China's Common Prosperity Policy
Implications Of China's Common Prosperity Policy
Arthur Budaghyan Chief Emerging Markets Strategist arthurb@bcaresearch.com Jing Sima Consulting China Strategist Strategic Themes Cyclical Recommendations
Highlights Chart 1A Hot Labor Market
A Hot Labor Market
A Hot Labor Market
The balance of data that’s come out during the past month points to a labor market that is not cooling very quickly. In fact, it is cooling much more slowly than we anticipated. First, nonfarm payroll growth of +315k in August is well above the +79k that is needed to maintain the unemployment and participation rates at current levels (Chart 1). Second, what had initially looked like a significant drop in job openings was revised away with the July JOLTS report. While the ratio of job openings to unemployed has leveled-off just below 2.0, it is no longer showing any signs of falling (bottom panel). Finally, the employment component of August’s ISM Manufacturing PMI jumped back above 50 and even initial unemployment claims have reversed their nascent uptrend. The conclusion we draw from this spate of strong employment data is that the Fed’s tightening cycle is not close to over. This means that the average fed funds rate that is priced into markets for 2023 is almost certainly too low. Feature Table 1 Recommended Portfolio Specification Table 2Fixed Income Sector Performance
Still Too Hot
Still Too Hot
Table 3A Corporate Sector Relative Valuation And Recommended Allocation* Table 3BCorporate Sector Risk Vs. Reward*
Still Too Hot
Still Too Hot
Investment Grade: Underweight Chart 2Investment Grade Market Overview
Investment Grade Market Overview
Investment Grade Market Overview
Investment grade corporate bonds outperformed the duration-equivalent Treasury index by 8 basis points in August, bringing year-to-date excess returns up to -267 bps. The average index option-adjusted spread tightened 4 bps on the month, and it currently sits at 145 bps. Our quality-adjusted 12-month breakeven spread ticked up to its 56th percentile since 1995 (Chart 2). A report from a few months ago made the case for why investors should underweight investment grade corporate bonds on a 6-12 month investment horizon.1 The main rationale for this recommendation is that the slope of the Treasury curve suggests that the credit cycle is in its late stages. Corporate bond performance tends to be weak during periods when the yield curve is very flat or inverted. Despite our underweight 6-12 month investment stance, we wouldn’t be surprised to see some modest spread narrowing during the next couple of months as inflation heads lower. That said, spread compression will be limited by the inverted yield curve and the persistent removal of monetary accommodation. A recent report dug deeper into the corporate bond space and concluded that investment grade-rated Energy bonds offer exceptional value on a 6-12 month horizon.2 That report also concluded that long maturity investment grade corporates are attractively priced relative to short maturity bonds. High-Yield: Neutral Chart 3High-Yield Market Overview
High-Yield Market Overview
High-Yield Market Overview
High-Yield underperformed the duration-equivalent Treasury index by 28 basis points in August, dragging year-to-date excess returns down to -519 bps. The average index option-adjusted spread tightened 15 bps on the month and it currently sits at 494 bps, 125 bps above the 2017-19 average and 43 bps below the 2018 peak. The 12-month spread-implied default rate – the default rate that is priced into the junk index assuming a 40% recovery rate on defaulted debt and an excess spread of 100 bps – increased modestly in August. It currently sits at 6.6% (Chart 3). As is the case with investment grade, high-yield spreads could stage a relief rally during the next few months as inflation falls and recession fears abate. However, the inverted yield curve will likely prevent spreads from moving much below the average level seen during the last tightening cycle (2017-19). All that said, even a move back to average 2017-19 levels would equate to a roughly 7% excess return for the junk index if it is realized over a six month period. This return potential is the main reason to prefer high-yield over investment grade in a US bond portfolio. While we maintain a neutral (3 out of 5) allocation to high-yield for now, we will downgrade the sector if spreads tighten to the 2017-19 average or if core inflation falls back to our 4% estimate of its underlying trend.3 MBS: Underweight Chart 4MBS Market Overview
MBS Market Overview
MBS Market Overview
Mortgage-Backed Securities underperformed the duration-equivalent Treasury index by 100 basis points in August, dragging year-to-date excess returns down to -144 bps. We discussed the outlook for Agency MBS in a recent report.4 We noted that MBS’ poor performance in 2021 and early-2022 was driven by duration extension. Fewer homeowners refinanced their loans as mortgage rates rose, and the MBS index’s average duration increased (Chart 4). But now, the index’s duration extension is over. The average convexity of the MBS index is close to zero (panel 3), meaning that duration is now insensitive to changes in rates. This is because hardly any homeowners have an incentive to refinance at current mortgage rates. With the duration extension trade over, the only thing preventing us from increasing exposure to the Agency MBS space is that spreads still aren’t sufficiently attractive. The average index spread versus duration-matched Treasuries is roughly midway between its post-2014 minimum and post-2014 mean (panel 4). Meanwhile, the option-adjusted spread has moved above its post-2014 mean (bottom panel), but at just 42 bps, it still offers less compensation than a Aa-rated corporate bond or a Aaa-rated consumer ABS. At the coupon level, we moved to a neutral allocation across the coupon stack last month, but this month we initiate a recommendation to favor high-coupon (3%-4.5%) securities over low coupon (1.5%-2.5%) ones. Given the lower duration of high coupon MBS, this position will profit from rising bond yields on a 6-12 month investment horizon. Emerging Market Bonds (USD): Underweight Chart 5Emerging Markets Overview
Emerging Markets Overview
Emerging Markets Overview
Emerging Market bonds outperformed the duration-equivalent Treasury index by 156 basis points in August, bringing year-to-date excess returns up to -563 bps. EM Sovereigns outperformed the Treasury benchmark by 117 bps on the month, bringing year-to-date excess returns up to -677 bps. The EM Corporate & Quasi-Sovereign Index outperformed by 180 bps, bringing year-to-date excess returns up to -491 bps. The EM Sovereign index outperformed the duration-equivalent US corporate bond index by 111 bps in August. Meanwhile, the yield differential between EM sovereigns and US corporates moved deeper into negative territory (Chart 5). As such, we continue to recommend a maximum underweight (1 out of 5) allocation to EM sovereigns. The EM Corporate & Quasi-Sovereign Index outperformed duration-matched US corporates by 168 bps in August. The index continues to offer a significant yield advantage versus duration-matched US corporates (panel 4). As such, we continue to recommend a neutral (3 out of 5) allocation to the sector. China is the most important trading partner for most EM countries and thus represents a major source of economic growth. Consequently, Chinese import volumes are a useful gauge for the outlook of EM economies. The persistent contraction of Chinese import volumes (bottom panel) therefore sends a negative signal for EM bond performance. Municipal Bonds: Overweight Chart 6Municipal Market Overview
Municipal Market Overview
Municipal Market Overview
Municipal bonds outperformed the duration-equivalent Treasury index by 126 basis points in August, bringing year-to-date excess returns up to -44 bps (before adjusting for the tax advantage). We view the municipal bond sector as better placed than most to cope with the recent bout of spread volatility. As we noted in a recent report, state & local government revenue growth has been strong, but governments have been slow to hire (Chart 6).5 The result is that net state & local government savings are incredibly high (bottom panel) and it will take some time to deplete those coffers. On the valuation front, munis have cheapened up relative to both Treasuries and corporates since last year. The 10-year Aaa Muni / Treasury yield ratio is currently 82%, up from its 2021 trough of 55%. The yield ratio between 12-17 year munis and duration-matched corporate bonds is also up significantly off its lows (panel 2). We reiterate our overweight allocation to municipal bonds within US fixed income portfolios, and we continue to have a strong preference for long-maturity munis. The yield ratio between 17-year+ General Obligation municipal bonds and duration-matched US corporates is 80%. The same measure for Revenue bonds is 94%, just below parity even without considering municipal debt’s tax advantage. Treasury Curve: Buy 5/30 Barbell Versus 10-Year Bullet Chart 7Treasury Yield Curve Overview
Treasury Yield Curve Overview
Treasury Yield Curve Overview
The Treasury curve bear-flattened in August as investors significantly marked up their 12-month rate expectations. Our 12-month Fed Funds Discounter – the market’s expected 12-month change in the funds rate – rose from 78 bps to 175 bps during the month and this caused the 2-year/10-year Treasury slope to flatten by 8 bps and the 5-year/30-year Treasury slope to flatten by 33 bps (Chart 7). We initiated a position in 5/30 flatteners (short 10-year bullet versus duration-matched 5/30 barbell) in our August 9th report.6 The main reason for this recommendation is our view that the Fed tightening cycle is not close to over. Therefore, it is too soon to position for a steepening of the 5-year/30-year Treasury slope. An analysis of past Fed tightening cycles shows that the 5-year/30-year Treasury slope tends to trough earlier than other segments of the yield curve. However, that trough has always occurred within a window spanning five months before the last Fed rate hike and three months after.7 On average, the 5-year/30-year slope troughs 1-2 months before the last Fed rate hike. Given our view that the Fed tightening cycle still has a lot of room to run, we think it makes sense to bet on a further flattening of the 5-year/30-year slope. This trade looks particularly attractive when you consider that a position short the 10-year bullet and long a duration-matched 5/30 barbell provides a yield pick-up of 12 bps (bottom panel). TIPS: Neutral Chart 8TIPS Market Overview
TIPS Market Overview
TIPS Market Overview
TIPS outperformed the duration-equivalent nominal Treasury index by 8 basis points in August, bringing year-to-date excess returns up to +264 bps. The 10-year TIPS breakeven inflation rate fell 5 bps on the month, moving back into the Fed’s 2.3% - 2.5% comfort zone (Chart 8). Meanwhile, our TIPS Breakeven Valuation Indicator shows that 10-year TIPS are close to fairly valued versus nominals. In a recent report we unveiled our Golden Rule of TIPS Investing.8 In that report we showed that TIPS of all maturities tend to outperform equivalent-maturity nominal bonds whenever headline CPI inflation exceeds the 1-year CPI swap rate during a 12-month period. The 1-year CPI swap rate is currently 2.77%, and we think this will turn out to be too low based on our modeling of headline CPI. While we see value in TIPS relative to nominals, especially at the front-end of the curve, we also suspect that more value will be created during the next few months as CPI prints come in soft. Therefore, we are reluctant to immediately upgrade TIPS to overweight. Instead, we recommend that investors initiate a 2-year/10-year TIPS breakeven inflation curve flattener. The 2/10 TIPS breakeven inflation curve has recently jumped into positive territory (bottom panel), but an inverted inflation curve is much more consistent with the current macro environment where the Fed is battling above-target inflation. ABS: Overweight Chart 9ABS Market Overview
ABS Market Overview
ABS Market Overview
Asset-Backed Securities outperformed the duration-equivalent Treasury index by 27 basis points in August, bringing year-to-date excess returns up to -25 bps. Aaa-rated ABS outperformed by 19 bps on the month, bringing year-to-date excess returns up to -24 bps. Non-Aaa ABS outperformed by 76 bps on the month, bringing year-to-date excess returns up to -28 bps. Substantial federal government support caused US households to build up an extremely large buffer of excess savings during the past two years. This year, consumers are starting to draw down that savings and are even starting to take on more debt. The amount of outstanding credit card debt is still low relative to household income, but it is rising quickly in absolute terms (Chart 9). Elsewhere, consumers are still paying down their credit card balances at high rates (panel 4), but banks are no longer easing lending standards on auto loans or credit cards (panel 3). To us, the prevailing evidence suggests that it will be a long time before delinquencies are a serious problem for consumer ABS. This justifies our overweight recommendation. That said, given that the trend toward consumer re-leveraging is in full swing, it makes sense to turn more cautious at the margin. We therefore close our prior recommendation to favor non-Aaa over Aaa-rated consumer ABS and move to a neutral allocation across the consumer ABS credit curve. Non-Agency CMBS: Overweight Neutral Chart 10CMBS Market Overview
CMBS Market Overview
CMBS Market Overview
Non-Agency Commercial Mortgage-Backed Securities outperformed the duration-equivalent Treasury index by 26 basis points in August, bringing year-to-date excess returns up to -150 bps. Aaa Non-Agency CMBS outperformed Treasuries by 20 bps on the month, bringing year-to-date excess returns up to -103 bps. Non-Aaa Non-Agency CMBS outperformed by 41 bps on the month, bringing year-to-date excess returns up to -280 bps. CMBS spreads remain wide compared to other similarly risky spread products and are currently close to their historic averages. However, the most recent Senior Loan Officer Survey showed tightening lending standards and weaker demand for commercial real estate (CRE) loans (Chart 10). This suggests a more negative back-drop for CRE prices and CMBS spreads and causes us to reduce our recommended allocation from overweight (4 out of 5) to neutral (3 out of 5). Agency CMBS: Overweight Agency CMBS underperformed the duration-equivalent Treasury index by 29 basis points in August, dragging year-to-date excess returns down to -44 bps. The average index option-adjusted spread held flat on the month, close to its long-term average (bottom panel). At 55 bps, the average Agency CMBS spread continues to look attractive compared to other similarly risky spread products. Stay overweight. Appendix A: The Golden Rule Of Bond Investing We follow a two-step process to formulate recommendations for bond portfolio duration. First, we determine the change in the federal funds rate that is priced into the yield curve for the next 12 months. Second, we decide – based on our assessments of the economy and Fed policy – whether the change in the fed funds rate will exceed or fall short of what is priced into the curve. Most of the time, a correct answer to this question leads to the appropriate duration call. We call this framework the Golden Rule Of Bond Investing, and we demonstrated its effectiveness in the US Bond Strategy Special Report, “The Golden Rule Of Bond Investing”, dated July 24, 2018. Chart 11 illustrates the Golden Rule’s track record by showing that the Bloomberg Barclays Treasury Master Index tends to outperform cash when rate hikes fall short of 12-month expectations, and vice-versa. At present, the market is priced for 175 basis points of rate hikes during the next 12 months. Chart 11The Golden Rule's Track Record
The Golden Rule's Track Record
The Golden Rule's Track Record
We can also use our Golden Rule framework to make 12-month total return and excess return forecasts for the Bloomberg Barclays Treasury index under different scenarios for the fed funds rate. Excess returns are relative to the Bloomberg Barclays Cash index. To forecast total returns we first calculate the 12-month fed funds rate surprise in each scenario by comparing the assumed change in the fed funds rate to the current value of our 12-month discounter. This rate hike surprise is then mapped to an expected change in the Treasury index yield using a regression based on the historical relationship between those two variables. Finally, we apply the expected change in index yield to the current characteristics (yield, duration and convexity) of the Treasury index to estimate total returns on a 12-month horizon. The below tables present those results, along with excess returns for a front-loaded and a back-loaded rate hike scenario. Excess returns are calculated by subtracting assumed cash returns in each scenario from our total return projections.
Still Too Hot
Still Too Hot
Appendix B: Butterfly Strategy Valuations The following tables present the current read-outs from our butterfly spread models. We use these models to identify opportunities to take duration-neutral positions across the Treasury curve. The following two Special Reports explain the models in more detail: US Bond Strategy Special Report, “Bullets, Barbells And Butterflies”, dated July 25, 2017, available at usbs.bcaresearch.com US Bond Strategy Special Report, “More Bullets, Barbells And Butterflies”, dated May 15, 2018, available at usbs.bcaresearch.com Table 4 shows the raw residuals from each model. A positive value indicates that the bullet is cheap relative to the duration-matched barbell. A negative value indicates that the barbell is cheap relative to the bullet. Table 4Butterfly Strategy Valuation: Raw Residuals In Basis Points (As Of September 1, 2022)
Still Too Hot
Still Too Hot
Table 5 scales the raw residuals in Table 4 by their historical means and standard deviations. This facilitates comparison between the different butterfly spreads. Table 5Butterfly Strategy Valuation: Standardized Residuals (As Of September 1, 2022)
Still Too Hot
Still Too Hot
Table 6 flips the models on their heads. It shows the change in the slope between the two barbell maturities that must be realized during the next six months to make returns between the bullet and barbell equal. For example, a reading of -7 bps in the 5 over 2/10 cell means that we would expect the 5-year to outperform the 2/10 if the 2/10 slope flattens by less than 7 bps during the next six months. Otherwise, we would expect the 2/10 barbell to outperform the 5-year bullet. Table 6Discounted Slope Change During Next 6 Months (BPs)
Still Too Hot
Still Too Hot
Appendix C: Excess Return Bond Map The Excess Return Bond Map is used to assess the relative risk/reward trade-off between different sectors of the US bond market. It is a purely computational exercise and does not impose any macroeconomic view. The Map’s vertical axis shows 12-month expected excess returns. These are proxied by each sector’s option-adjusted spread. Sectors plotting further toward the top of the Map have higher expected returns and vice-versa. Our novel risk measure called the “Risk Of Losing 100 bps” is shown on the Map’s horizontal axis. To calculate it, we first compute the spread widening required on a 12-month horizon for each sector to lose 100 bps or more relative to a duration-matched position in Treasury securities. Then, we divide that amount of spread widening by each sector’s historical spread volatility. The end result is the number of standard deviations of 12-month spread widening required for each sector to lose 100 bps or more versus a position in Treasuries. Lower risk sectors plot further to the right of the Map, and higher risk sectors plot further to the left. Chart 12Excess Return Bond Map (As Of September 1, 2022)
Still Too Hot
Still Too Hot
Ryan Swift US Bond Strategist rswift@bcaresearch.com Robert Timper Research Analyst robert.timper@bcaresearch.com Footnotes 1 Please see US Bond Strategy / Global Fixed Income Strategy Special Report, “Turning Defensive On US Corporate Bonds”, dated April 12, 2022. 2 Please see US Bond Strategy / Global Fixed Income Strategy Special Report, “Looking For Opportunities In US & European Corporates After The Recent Selloff”, dated May 31, 2022. 3 For more details on this call please see US Bond Strategy Weekly Report, “When The Dual Mandates Clash”, dated June 28, 2022. 4 Please see US Bond Strategy Weekly Report, “The Bond Market Implications Of A 5% Mortgage Rate”, dated April 26, 2022. 5 Please see US Bond Strategy Weekly Report, “Echoes Of 2018”, dated May 24, 2022. 6 Please see US Bond Strategy Weekly Report, “The Great Soft Landing Debate”, dated August 9, 2022. 7 In our analysis we examined seven Fed tightening cycles. The five most recent cycles and the two cycles that occurred during the inflation spike of the early 1980s. 8 Please see US Bond Strategy Special Report, “The Golden Rule Of TIPS Investing”, dated August 23, 2022. Recommended Portfolio Specification Other Recommendations Treasury Index Returns Spread Product Returns
Executive Summary US Military Constraint: Strait Of Hormuz
Will Iran Crisis Be Averted?
Will Iran Crisis Be Averted?
A US-Iran deal would make for a notable improvement in the geopolitical backdrop during an otherwise gloomy year. It would remove the risk of a major new oil shock. We maintain our 40% subjective odds of a deal, which is well below consensus. The risk of failure is underrated. Our conviction level is only moderate because President Biden can make concessions to clinch a deal – and Supreme Leader Khamenei may want to earn some money and time. Yet we have high conviction in our view that the US will ultimately fail to provide Iran with sufficient security guarantees while Iran will pursue a nuclear deterrent. Hence the Middle East will present a long-term energy supply constraint. In the short term, global growth and recession risk will drive oil prices, not any Iran deal. Asset Initiation Date Return LONG GLOBAL AEROSPACE & DEFENSE / BROAD MARKET EQUITIES 2020-11-27 9.3% Bottom Line: Any US-Iran deal will be marginally positive for risky assets. However, the failure of a deal would sharply increase the odds of oil supply disruptions in the short run. Feature Negotiations over Iran’s nuclear program remain in a critical phase. Rumors suggest Iran has agreed to rejoin the 2015 Joint Comprehensive Plan of Action (JCPA) with the United States. But these rumors are unconfirmed, while the International Atomic Energy Agency (IAEA) just announced that Iran has started operating more advanced centrifuges at its Natanz nuclear site.1 In this report we provide a tactical update on the topic. A US-Iran nuclear deal is one item on our checklist for global macro and geopolitical stability (Table 1). We are pessimistic about a deal but it would be a positive outcome for markets. Table 1Not A Lot Of Positive Catalysts In H2 2022
Will Iran Crisis Be Averted?
Will Iran Crisis Be Averted?
A decision could come at any moment so investors should bear in mind our key conclusions about a deal: Chart 1Oil Volatility: The Only Certainty Of Iran Saga
Oil Volatility: The Only Certainty Of Iran Saga
Oil Volatility: The Only Certainty Of Iran Saga
1. Any deal will be a short-term, stop-gap measure to delay a crisis until 2024 or beyond. This is not a small point because a crisis could lead to a large military conflict. 2. The short-run implication of any deal is oil volatility, not a drop in oil prices (Chart 1). Global demand is wobbly and OPEC could cut oil production in reaction to a deal. 3. Over the long run, global supply and demand balances will remain tight even if a deal is agreed. 4. If there is no deal, then a major new source of global supply constraint will emerge immediately due to a new spiral of conflict in the Middle East. Iran’s nuclear program will continue which will prompt threats from Israel and the Gulf Arab states and Iranian counter-threats. We are sticking with our subjective 40/60 odds that a deal will occur – i.e. our conviction level is medium, not high. The Biden administration wants a deal and has the executive authority to conclude a deal. Iran wants sanctions lifted and can buy time with a short-term deal. Our pessimism stems from the fact that neither side can trust the other, the US can no longer give credible security guarantees, and Iran has a strategic interest in obtaining nuclear weapons. A deal can happen but its durability depends on the 2024 US election. Status Of Negotiations Table 2Iran’s Three Demands Of US For Rejoining 2015 Nuclear Deal
Will Iran Crisis Be Averted?
Will Iran Crisis Be Averted?
Ostensibly there were three outstanding Iranian demands over the month of August that needed to be met to secure a deal (Table 2). Iran reportedly dropped the first demand: that the US remove the Iranian Revolutionary Guard Corps from the US State Department’s list of Designated Foreign Terrorist Organizations. This concession prompted the news media to become more optimistic about a deal. This leaves two outstanding demands. Iran wants the IAEA conclude a “safeguards” investigation into unexplained uranium traces found at unauthorized sites in Iran, indicating nuclear activity that has not been accounted for. The IAEA will be very reluctant to halt such a probe on a political, not technical, basis. But it could happen under US pressure. Related Report Geopolitical StrategyRoulette With A Five-Shooter Iran also wants the US to provide a “guarantee” that future presidents will not renege on the nuclear deal and reimpose sanctions like President Trump did in 2019. President Biden cannot give any credible guarantee because the JCPA is an executive action, not a formal treaty, so a different president could reverse it. (The deal always lacked sufficient support in the Senate, even from top Democrats.) Iran is demanding certain diplomatic concessions and/or an economic indemnity in the event of another American reversal. Aside from attempting to incarcerate former President Trump, Biden can only offer empty promises on this front. In what follows we review the critical constraints facing the US and Iran. The US’s Constraints The first constraint on the US is the stagflationary economy. High inflation and oil prices pose a threat to President Biden and the Democrats not only in this year’s midterm elections but also in the 2024 presidential election. A recession is not at all unlikely by that time, given the inverted yield curve (Chart 2). If the US can help maintain stability in the Middle East, then the odds of another major oil supply shock (on top of Russia) will be reduced. Lifting sanctions on Iran will free up around 1 million barrels of oil to feed global demand. With Europe and the US imposing an oil and oil shipping embargo on Russia, the world is likely to lose around two million barrels of crude per day that the Gulf Arab states can only partially make up for, according to our Chief Commodity Strategist Bob Ryan (Table 3). This is a notable material constraint – and the main reason that Bob is more optimistic about an Iran deal than we are. Chart 2US Economic Constraint: Stagflation
US Economic Constraint: Stagflation
US Economic Constraint: Stagflation
Table 3The Oil Math Behind Any Iran Deal
Will Iran Crisis Be Averted?
Will Iran Crisis Be Averted?
However, Saudi Arabia would be alienated by a US-Iran détente. The American view is that Iranian production would threaten Saudi market share and force the Saudis to produce more. But the Saudis are seeing weakening global demand and have signaled that they will cut production. There is still an economic basis for an Iran deal but it is not clear that it will lower prices, especially in the short run. Over the long run the Saudis are a more reliable oil producer than Iran for both economic and geopolitical reasons. The second constraint is political. The US public is primarily concerned about the economy. Stagflation or recession could ultimately bring down the Biden administration. However, in the short run, American voters are much more concerned about domestic social issues (such as abortion access) than they are about foreign policy. In the long run, American voters are likely to maintain their long-held negative view of Iran (Chart 3). So the Biden administration has an incentive to prevent geopolitical events from hurting the economy but not to join arms with Iran in a major diplomatic agreement. The third constraint is military. Americans are not as war-weary today as they were in 2008 or 2016 but they are still averse to any new military conflicts in the Middle East. An Iranian nuclear bomb could change that view – but until a bomb is tested it will persist. Chart 3US Political Constraint: Americans Ignore Foreign Policy, Dislike Iran
Will Iran Crisis Be Averted?
Will Iran Crisis Be Averted?
Chart 4US Military Constraint: Strait Of Hormuz
Will Iran Crisis Be Averted?
Will Iran Crisis Be Averted?
If Iran freezes its nuclear program then it will reduce the odds of a Middle Eastern war and large-scale oil supply disruptions. If Iran does not freeze its nuclear program, then Israel will have to demonstrate a credible military threat against nuclear weaponization, and then Iran will have to demonstrate its region-wide militant capabilities, including the ability to shut down the Strait of Hormuz (Chart 4). The Biden administration wants to delay this downward spiral or avoid it altogether. Chart 5US Strategic Constraint: Avoid Mideast Quagmires
Will Iran Crisis Be Averted?
Will Iran Crisis Be Averted?
The fourth constraint is strategic. The Biden administration wants to avoid conflict if possible because it is attempting to reduce America’s burden in the Middle East so that it can focus on emerging great power competition in Eastern Europe and East Asia. The original motivation for the Iran deal was to enable the US to “pivot to Asia” and counter China. Iranian hegemony in the Middle East is less of a threat than Chinese hegemony in East Asia (Chart 5). This logic is sound if Iran can really be brought to halt its nuclear program. The Europeans need to stabilize and open up the Middle East to create an alternative energy supply to Russia. The Americans need to avoid a nuclear arms race and war in the Middle East that distracts them from China. However, if Iran continues to pursue a nuclear weapon, then the US suffers strategically for doing a short-term deal that provides Iran with time and access to funds. Ultimately the only thing that can dissuade Iran from going nuclear is American power projection in the Middle East – and this capability is also one of the US’s greatest advantages over China. Bottom Line: The US has a strategic, military, and economic interest in concluding a deal that freezes Iran’s nuclear program. It arguably has an interest in a deal even if Iran violates the deal and pursues nuclear weaponization, since that will provide a legitimate basis for what would then become a necessary military intervention. The Biden administration faces some political blowback for a deal but will suffer more if failure to get a deal leads to a Middle Eastern oil shock. For all these reasons Biden administration is attempting to clinch a deal. But Iran is the sticking point. Iran’s Constraints Our reasons for pessimism regarding the nuclear talks hinge on Iran, not the United States. Supreme Leader Ayatollah Ali Khamenei’s goal is to secure the regime and arrange for a stable succession in the coming years. A deal with the Americans made sense in that context. But going forward, if dealing with the Americans does not bring credible security guarantees and yet makes the economy vulnerable again to a future snapback of sanctions, then the justification for the deal falls apart. We cannot read Khamenei’s mind any more than we can read Biden’s mind, so we will look at the material limitations. Chart 6Iran's Economic Constraint: Stagflation
Iran's Economic Constraint: Stagflation
Iran's Economic Constraint: Stagflation
First, the economic constraint: The Iranian economy suffered a huge negative shock from the reimposition of sanctions in 2019 (Chart 6). However, the economy has sputtered through this shock and the Covid-19 shock without collapsing. Social unrest is an ever-present risk but it has not spiraled out of control. There has not been an attempted democratic revolution like in 2009. The upswing in the global commodity cycle has reinforced the regime. Sanctions do not prevent exports entirely. There is still a huge monetary incentive to let the Biden administration lift sanctions if it wants to do so: a deal is estimated to free up $100 billion dollars per year in revenue for the regime for ten years.2 Realistically this should be understood as more than $275 billion for two years since the longevity of the deal is in question. The problem is that Iran’s economy would be fully exposed to sanctions again if the US changed its mind. The bottom line is that the economic constraint does not force Iran to accept a deal but it is enticing. Second comes the political constraint. President Ebrahim Raisi hopes to become supreme leader someday and is loath to put his name on a deal with weak foundations. He originally opposed the deal, was vindicated, and does not now want to jeopardize his political future by making the same mistake as his hapless predecessor, Hassan Rouhani. Opinion polls may not be reliable in putting Raisi as the most popular politician in Iran but they probably are reliable in showing Rouhani at the bottom of the heap (Chart 7). There is a significant political constraint against rejoining the deal. Chart 7Iran’s Political Constraint: Risk Of American Betrayal
Will Iran Crisis Be Averted?
Will Iran Crisis Be Averted?
Chart 8Iran’s Military Constraint: Outgunned, Unsure Of Allies
Will Iran Crisis Be Averted?
Will Iran Crisis Be Averted?
Third comes the military constraint. While Iran is extremely vulnerable to Israeli and American military attack, it is also a fortress of a country, nestled in mountains, and airstrikes may not succeed in destroying the entire nuclear program or bringing down the regime. An attack by Israel could convert an entirely new generation to the Islamic revolution. And Iran may believe that the US lacks the popular support for military action in the wake of Iraq and Afghanistan. Iran may also believe that China and Russia will provide military and economic support (Chart 8). Ultimately, America has demonstrated a willingness to attack rogue states and Iran will try to avoid that outcome, since it could succeed in toppling the regime. But if Iran believes it can acquire a deliverable nuclear weapon in a few short years, then it may make a dash for it, since this solution would be a permanent solution: a nuclear deterrent against western attack, as opposed to temporary diplomatic promises. We often compare Iran’s strategic predicament to that of Ukraine, Libya, and North Korea. Ukraine gave up its Soviet nuclear weapons after the 1994 Budapest Memorandum, which promised that Russia, the US, the UK, France, and China would guarantee its security. Yet Russia ended up invading 20 years later – and none of the others prevented it or sent troops to halt the Russian advance. Separately Libya gave up its nuclear program in 2003 but NATO attacked and toppled the regime in 2011 anyway. Meanwhile North Korea played the diplomatic game with the US, ever inching along on the path toward nuclear weapons, and today has achieved nuclear-armed status and greater regime security. The outflow of refugees from the various regimes shows why Iran will emulate North Korea (Chart 9). Chart 9Iran’s Strategic Constraint: The Need For A Nuclear Deterrent
Will Iran Crisis Be Averted?
Will Iran Crisis Be Averted?
Bottom Line: Iran has a short-term economic incentive to agree to a deal and a long-term military incentive. But ultimately the US cannot provide ironclad security guarantees that would justify halting the quest for a nuclear deterrent. A nuclear deterrent would overcome the military constraint. Therefore Iran will continue on that path. Any deal will be a ruse to buy time. Final Assessment The 2015 deal occurred in a context of Iranian strategic isolation, when American implementation was credible, oil prices were weak, and Iran had not achieved nuclear breakout capacity. Today Iran is not isolated (thanks to US quarrels with Russia and China), American guarantees are not credible (thanks to the polarization of foreign policy), oil prices are not weak (thanks to Russia), and Iran has already achieved nuclear breakout (Table 4). Table 4Iran’s Nuclear Program Status Check, Aug. 31, 2022
Will Iran Crisis Be Averted?
Will Iran Crisis Be Averted?
The US’s strategic aim is to create a balance of power in the region but Iran’s strategic aim is to ensure regime survival. The US’s emerging balancing coalition (Israel and the Gulf Arab states) increases the strategic threat to Iran and hence its need for a nuclear deterrent. While Russia and China formally support the 2015 deal, they each see Iran as a valuable asset in a great power struggle with the United States. Iran sees them the same way. Russia needs Iran as a partner to bypass western sanctions. Regardless, it benefits from Middle Eastern instability, which could entangle the United States. China must develop a deep long-term partnership with Iran for its own strategic reasons and does not look forward to a time when the US divests from that region to impose tougher strategic containment on China. China can survive a US conflict with Iran – and such a conflict could reduce the US ability to defend Taiwan. While neither Russia nor China positively desire Iran to obtain nuclear weapons, neither power stopped North Korea from obtaining the bomb – far from it. Russia assumes that Israel and the US will take military action to prevent weaponization, which would be catastrophic for the region but positive for Russia. China also assumes Israel and the US will act, which reinforces its need to diversify energy options so that it can access Russian, Central Asian, and Middle Eastern oil via pipeline. Investment Takeaways Our negative view on the global economy and geopolitical backdrop is once again being priced into global financial markets as equities fall anew. An Iran deal would delay a notable geopolitical risk for roughly the next 24 months and hence remove a major upside risk for oil prices. This would be marginally positive for global equities, although it will not be the driver. Europe’s and China’s economic woes are the drivers. The failure of a deal would bring major upside risks for oil into the near term and as such would be negative for equities – and could even become the global driver, as Middle Eastern oil disruptions will follow promptly from any failure of the deal. We continue to recommend that investors overweight US equities relative to global, defensive sectors relative to cyclicals, and large caps relative to small caps. We are overweight aerospace and defense stocks, India and Southeast Asia within emerging markets, and underweight China and Taiwan. Matt Gertken Chief Geopolitical Strategist mattg@bcaresearch.com Footnotes 1 See Iran International, “Exclusive: Ex-IAEA Official Says US And Iran To Sign Deal Soon,” August 30, 2022, iranintl.com. See also Francois Murphy, “Iran enriching uranium with more IR-6 centrifuges at Natanz -IAEA,” Reuters, August 31, 2022, reuters.com. 2 See Saeed Ghasseminejad, “Tehran’s $1 Trillion Deal: An Updated Forecast of Iran’s Financial Windfall From a New Nuclear Agreement,” Foundation for Defense of Democracies, August 19, 2022, fdd.org. Strategic Themes Open Tactical Positions (0-6 Months) Open Cyclical Recommendations (6-18 Months) Regional Geopolitical Risk Matrix