Emerging Markets

Listen to a short summary of this report. Executive Summary Higher Real Yields Have Weighed On Equity Valuations
Higher Real Yields Have Weighed On Equity Valuations
Higher Real Yields Have Weighed On Equity Valuations
I had the pleasure of visiting clients in Saudi Arabia, Bahrain, and Abu Dhabi last week. In contrast to the rest of the world, the mood in the Middle East was very positive. While high oil prices are helping, there is also a lot of optimism about ongoing structural reforms. Petrodollar flows are increasingly being steered towards private and public equities. EM assets stand to benefit the most. Producers in the region are trying to offset lost Russian output, but realistically, they will not be able to completely fill the gap in the near term. Today’s high energy prices have largely baked in this reality, as reflected in strongly backwardated futures curves. There was no consensus about how high oil prices would need to rise to trigger a global recession, although the number $150 per barrel got bandied about a lot. Given that most Middle Eastern currencies are pegged to the dollar, there was a heavy focus on Fed policy. Market estimates of the neutral rate in the US have increased rapidly towards our highly out-of-consensus view. Nevertheless, we continue to see modest upside for bond yields over a multi-year horizon. Over a shorter-term 6-to-12-month horizon, the direction of bond yields will be guided by the evolution of inflation. While US CPI inflation rose much more than expected in May, the details of the report were somewhat less worrying, as they continue to show significant supply-side distortions. Bottom Line: Inflation should come down during the remainder of the year, allowing the Fed to breathe a sigh of relief and stocks to recover some of their losses. A further spike in oil prices is a major risk to this view. Dear Client, Instead of our regular report next week, we will be sending you a Special Report written by Chester Ntonifor, BCA Research’s Chief Foreign Exchange Strategist, discussing the outlook for gold. We will be back the following week with the GIS Quarterly Strategy Outlook, where we will explore the major trends that are set to drive financial markets in the rest of 2022 and beyond. As always, I will hold a webcast discussing the outlook the following week, on Thursday, July 7th. Best regards, Peter Berezin Chief Global Strategist Peter in Arabia I had the pleasure of visiting clients in Saudi Arabia, Bahrain, and Abu Dhabi last week. This note summarizes my impressions and provides some commentary about recent market turmoil. The Mood in the Region is Very Positive In contrast to the rest of the world, the mood in the Middle East was upbeat. Obviously, high oil prices are a major contributor (Chart 1). Across the region, stock markets are still up for the year (Chart 2). Chart 1Oil Prices Have Shot Up
Oil Prices Have Shot Up
Oil Prices Have Shot Up
Chart 2Middle Eastern Stock Markets Are Doing Relatively Well This Year
Middle Eastern Stock Markets Are Doing Relatively Well This Year
Middle Eastern Stock Markets Are Doing Relatively Well This Year
That said, I also felt that investors were encouraged by ongoing structural reforms, especially in Saudi Arabia where the Vision 2030 program is being rolled out. The program seeks to diversify the Saudi economy away from its historic reliance on petroleum exports. A number of people I spoke with cited the Saudi sovereign wealth fund’s acquisition of a majority stake in Lucid, a California-based EV startup, as the sort of bold move that would have been unthinkable a few years ago. I first visited Riyadh in May 2011 where I controversially delivered a speech entitled “The Coming Commodity Bust” (oil was $120/bbl then and copper prices were near an all-time high). The city has changed immensely since then. The number of restaurants and entertainment venues has increased exponentially. The ban on women drivers was lifted only four years ago. In that short time, it has become a common-day occurrence. Capital Flows Into and Out of the Region are Reflecting a New Geopolitical Reality In addition to high oil prices and structural reforms, geopolitical considerations are propelling significant capital inflows into the region. The freezing of Russia’s foreign exchange reserves sent a shockwave across much of the world, with a number of other EM countries wondering if “they are next.” Ironically, the Middle East has emerged as a neutral player of sorts in this multipolar world, and hence a safer destination for capital flows. On the flipside, the region’s oil exporters appear to be acting more strategically in how they allocate their petrodollar earnings. Rather than simply parking the proceeds of oil sales in overseas US dollar bank accounts, they are investing them in ways that further their economic and political goals. One clear trend is that equity allocations to both overseas public and private markets are rising. Other emerging markets stand to benefit the most from this development, especially EMs who have assets that Middle Eastern countries deem important – assets tied to food security being a prime example. Assuming that the current level of oil prices is maintained, we estimate that non-US oil exports will rise to $2.5 trillion in 2022, up from $1.5 trillion in 2021 (Chart 3). About 40% of this windfall will flow to the Middle East. That is a big slug of cash, enough to influence the direction of equity markets. Chart 3Oil Exporters Reaping The Benefits Of High Oil Prices
An Oasis Of Optimism: Notes From The Middle East
An Oasis Of Optimism: Notes From The Middle East
Middle Eastern Energy Producers Will Boost Output, But Don’t Expect Any Miracles in the Short Term Russian oil production will likely fall by about 2 million bpd relative to pre-war levels over the next 12 months. To help offset the impact, OPEC has already raised production by 200,000 barrels and will almost certainly bump it up again following President Biden’s visit to the region in July (Chart 4). The decision to raise production to stave off a super spike in oil prices is not entirely altruistic. The region’s oil exporters know that excessively high oil prices could tip the global economy into recession, an outcome that would surely lead to much lower oil prices down the road. There was not much clarity on what that tipping point is, but the number $150 per barrel got bandied around a lot. Politics is also a factor. A further rise in oil prices could compel the US to make a deal with Iran, something the Saudis do not want to see happen. Still, there is a practical limit to how much more oil the Saudis and other Middle Eastern producers can bring to market in the near term. Today’s high energy prices have largely baked in this reality, as reflected in strongly backwardated futures curves (Chart 5). Chart 4Output Trends In The Major Oil Producers
Output Trends In The Major Oil Producers
Output Trends In The Major Oil Producers
Chart 5Energy Prices On Both Sides Of The Atlantic
An Oasis Of Optimism: Notes From The Middle East
An Oasis Of Optimism: Notes From The Middle East
Data on Saudi’s excess capacity is notoriously opaque, but I got the feeling that an extra 1-to-1.5 million bpd was the most that the Kingdom could deliver. The same constraints apply to natural gas. Qatar is investing nearly $30 billion to expand its giant North Field, which should allow gas production to rise by as much as 60%. However, it will take four years to complete the project. The share of Qatari liquefied natural gas (LNG) going to Europe has actually declined this year. About 80% of Qatar’s LNG is sold to Asian buyers under long-term contracts that cannot be easily adjusted. And even if those contracts could be rewritten, this would only bring limited benefits to Europe. For example, Germany has no terminals to accept LNG imports, although it is planning to build two. While there was plenty of sympathy to Europe’s plight in the region, there was also a sense that European governments had been cruising for a bruising by doubling down on strident anti-fossil fuel rhetoric over the past decade without doing much to end their dependence on Russian oil and gas. In that context, few in the region seemed willing to bend over backwards to help Europe. In the meantime, the US remains Europe’s best hope. US LNG shipments to Europe have tripled since last year. The US is now sending nearly three quarters of its liquefied gas to Europe. This has pushed up US natural gas prices, although they still remain a fraction of what they are in Europe. Huge Focus on the Fed Chart 6Most Of The Increase In Bond Yields Has Been In The Real Component
Most Of The Increase In Bond Yields Has Been In The Real Component
Most Of The Increase In Bond Yields Has Been In The Real Component
Most Middle Eastern currencies are pegged to the dollar, and hence the region effectively imports its monetary policy from the US. Not surprisingly, clients were very focused on the Federal Reserve. Many expressed concern about the abrupt pace of rate hikes. One of our high-conviction views is that the neutral rate of interest in the US has risen as the household deleveraging cycle has ended, fiscal policy has become structurally looser, and a growing number of baby boomers have transitioned from working (and saving) to retirement (and dissaving). The markets have rapidly priced in this view over the course of 2022. The 5-year/5-year forward Treasury yield – a proxy for the neutral rate – has increased from 1.90% at the start of the year to 3.21% at present. Most of this increase in the market’s estimate of the neutral rate has occurred in the real component. The 5-year/5-year forward TIPS yield has climbed from -0.49% to 0.84%; in contrast, the implied TIPS breakeven inflation rate has risen from only 2.24% to 2.37% (Chart 6). Implications of Higher Bond Yields on Equity Prices and the Economy Chart 7Higher Real Yields Have Weighed On Equity Valuations
Higher Real Yields Have Weighed On Equity Valuations
Higher Real Yields Have Weighed On Equity Valuations
As both theory and practice suggest, there is a strong negative correlation between real bond yields and equity valuations. Chart 7 shows that the S&P 500 forward P/E ratio has been moving broadly in line with the 5-year/5-year forward TIPS yield. The bad news is that there is still scope for bond yields to rise over the long haul. Our fair value estimate of 3.5%-to-4% for the neutral rate is about 25-to-75 basis points above current pricing. The good news is that a high neutral rate helps insulate the economy from a near-term recession. Recessions typically occur only when monetary policy turns restrictive. A few clients cited the negative Q1 GDP reading and the near-zero Q2 growth estimate in the Atlanta Fed GDPNow model as evidence that a US recession is either close at hand or has already begun (Chart 8). Chart 8Underlying US Growth Is Expected To Be Solid In Q2
An Oasis Of Optimism: Notes From The Middle East
An Oasis Of Optimism: Notes From The Middle East
We would push back against such an interpretation. In contrast to the -1.5% real GDP print, real Gross Domestic Income (GDI) rose by 2.1% in Q1. Conceptually, GDP and GDI should be equal, but since the two numbers are compiled in different ways, there can often be major statistical discrepancies. A simple average of the two suggests the US economy still grew in the first quarter. More importantly, real final sales to private domestic purchasers rose by 3.9% in Q1. This measure of economic activity – which strips out the often-noisy contributions from inventories, government expenditures, and net exports – is the best predictor of future GDP growth of any item in the national accounts (Table 1). Table 1A Good Sign: Real Final Sales To Private Domestic Purchasers Rose By 3.9% In Q1
An Oasis Of Optimism: Notes From The Middle East
An Oasis Of Optimism: Notes From The Middle East
As far as Q2 is concerned, real final sales to private domestic purchasers are tracking at 2.0% according to the Atlanta Fed model – a clear deceleration from earlier this year, but still consistent with a generally healthy economy. Growth will probably slow in the third quarter, reflecting the impact of higher gasoline prices, rising interest rates, and lower asset prices. Nevertheless, the fundamental underpinnings for the economy – low household debt, $2.2 trillion in excess savings, a dire need to boost corporate capex and homebuilding, and a strong labor market – remain in place. The odds of a recession in the next 12 months are quite low. Gauging Near-Term Inflation Dynamics A higher-than-expected neutral rate of interest implies that bond yields will probably rise from current levels over the long run. Over a shorter-term 6-to-12-month horizon, however, the direction of yields will be guided by the evolution of inflation. While the core CPI surprised on the upside in May, the details of the report were somewhat less worrying, as they continue to show significant supply-side distortions. Excluding vehicles, core goods prices rose 0.3% in May, down from a Q1 average of 0.7% (Chart 9). Recent commentary from companies such as Target suggest that goods inflation will ease further. Chart 9Goods Inflation Is Moderating, While Service Price Growth Is Elevated
An Oasis Of Optimism: Notes From The Middle East
An Oasis Of Optimism: Notes From The Middle East
Stripping out energy-related services, services inflation slowed slightly to 0.6% in May from 0.7% in April. A deceleration in wage growth should help keep a lid on services inflation over the coming months (Chart 10). Chart 10A Deceleration In Wage Growth Should Help Keep Services Inflation Contained
An Oasis Of Optimism: Notes From The Middle East
An Oasis Of Optimism: Notes From The Middle East
During his press conference, Fed Chair Powell described the rise in inflation expectations in the University of Michigan survey as “quite eye-catching.” Although long-term inflation expectations remain a fraction of what they were in the early 1980s, they did rise to the highest level in 14 years in June (Chart 11). Powell also noted that the Fed’s Index of Common Inflation Expectations has been edging higher. The Fed’s focus on ensuring that inflation expectations remain well anchored is understandable. That said, there is a strong correlation between the level of gasoline prices and inflation expectations (Chart 12). If gasoline prices come down from record high levels over the coming months, inflation expectations should drop. Chart 11Consumer Long-Term Inflation Expectations Keep Rising, But Are Still Not At Historically High Levels
Consumer Long-Term Inflation Expectations Keep Rising, But Are Still Not At Historically High Levels
Consumer Long-Term Inflation Expectations Keep Rising, But Are Still Not At Historically High Levels
Chart 12Lower Gasoline Prices Would Help Soothe Consumer Fears Over Inflation
Lower Gasoline Prices Would Help Soothe Consumer Fears Over Inflation
Lower Gasoline Prices Would Help Soothe Consumer Fears Over Inflation
The Fed expects core PCE inflation to fall to 4.3% on a year-over-year basis by the end of 2022. This would require month-over-month readings of about 0.35 percentage points, which is slightly above the average of the past three months (Chart 13). Our guess is that the Fed may be highballing its near-term inflation projections in order to give itself room to “underpromise and overdeliver” on the inflation front. If so, we could see inflation estimates trimmed later this year, which would provide a more soothing backdrop for risk assets. Chart 13AUS Inflation Will Fall By More Than The Fed Expects If The Monthly Change In Core PCE Is Less Than 0.35% (I)
US Inflation Will Fall By More Than The Fed Expects If The Monthly Change In Core PCE Is Less Than 0.35% (I)
US Inflation Will Fall By More Than The Fed Expects If The Monthly Change In Core PCE Is Less Than 0.35% (I)
Chart 13BUS Inflation Will Fall By More Than The Fed Expects If The Monthly Change In Core PCE Is Less Than 0.35% (II)
US Inflation Will Fall By More Than The Fed Expects If The Monthly Change In Core PCE Is Less Than 0.35% (II)
US Inflation Will Fall By More Than The Fed Expects If The Monthly Change In Core PCE Is Less Than 0.35% (II)
Concluding Thoughts on Investment Strategy According to Bank of America, fund managers cut their equity exposure to the lowest since May 2020. Optimism on global growth fell to a record low. Meanwhile, bears outnumbered bulls by 39 percentage points in this week’s AAII poll (Chart 14). If the stock market is about to crash, it will be the most anticipated crash in history. In my experience, markets rarely do what most people expect them to do. Chart 14Sentiment Towards Equities Is Pessimistic
Sentiment Towards Equities Is Pessimistic
Sentiment Towards Equities Is Pessimistic
Chart 15Global Equities Are More Attractively Valued After The Recent Sell-Off
Global Equities Are More Attractively Valued After The Recent Sell-Off
Global Equities Are More Attractively Valued After The Recent Sell-Off
Chart 16US And European EPS Estimates Have Been Trending Higher This Year
US And European EPS Estimates Have Been Trending Higher This Year
US And European EPS Estimates Have Been Trending Higher This Year
US equities are trading at 16.3-times forward earnings, with non-US stocks sporting a forward P/E ratio of 12.1 (Chart 15). Despite the decline in share prices, earnings estimates in both the US and Europe have increased since the start of the year (Chart 16). The consensus is that those estimates will fall. However, if our expectation that a recession will be averted over the next 12 months pans out, that may not happen. A sensible strategy right now is to maintain a modest overweight to stocks while being prepared to significantly raise equity exposure once clear evidence emerges that inflation has peaked. Peter Berezin Chief Global Strategist peterb@bcaresearch.com Follow me on LinkedIn Twitter View Matrix
An Oasis Of Optimism: Notes From The Middle East
An Oasis Of Optimism: Notes From The Middle East
Special Trade Recommendations Current MacroQuant Model Scores
An Oasis Of Optimism: Notes From The Middle East
An Oasis Of Optimism: Notes From The Middle East
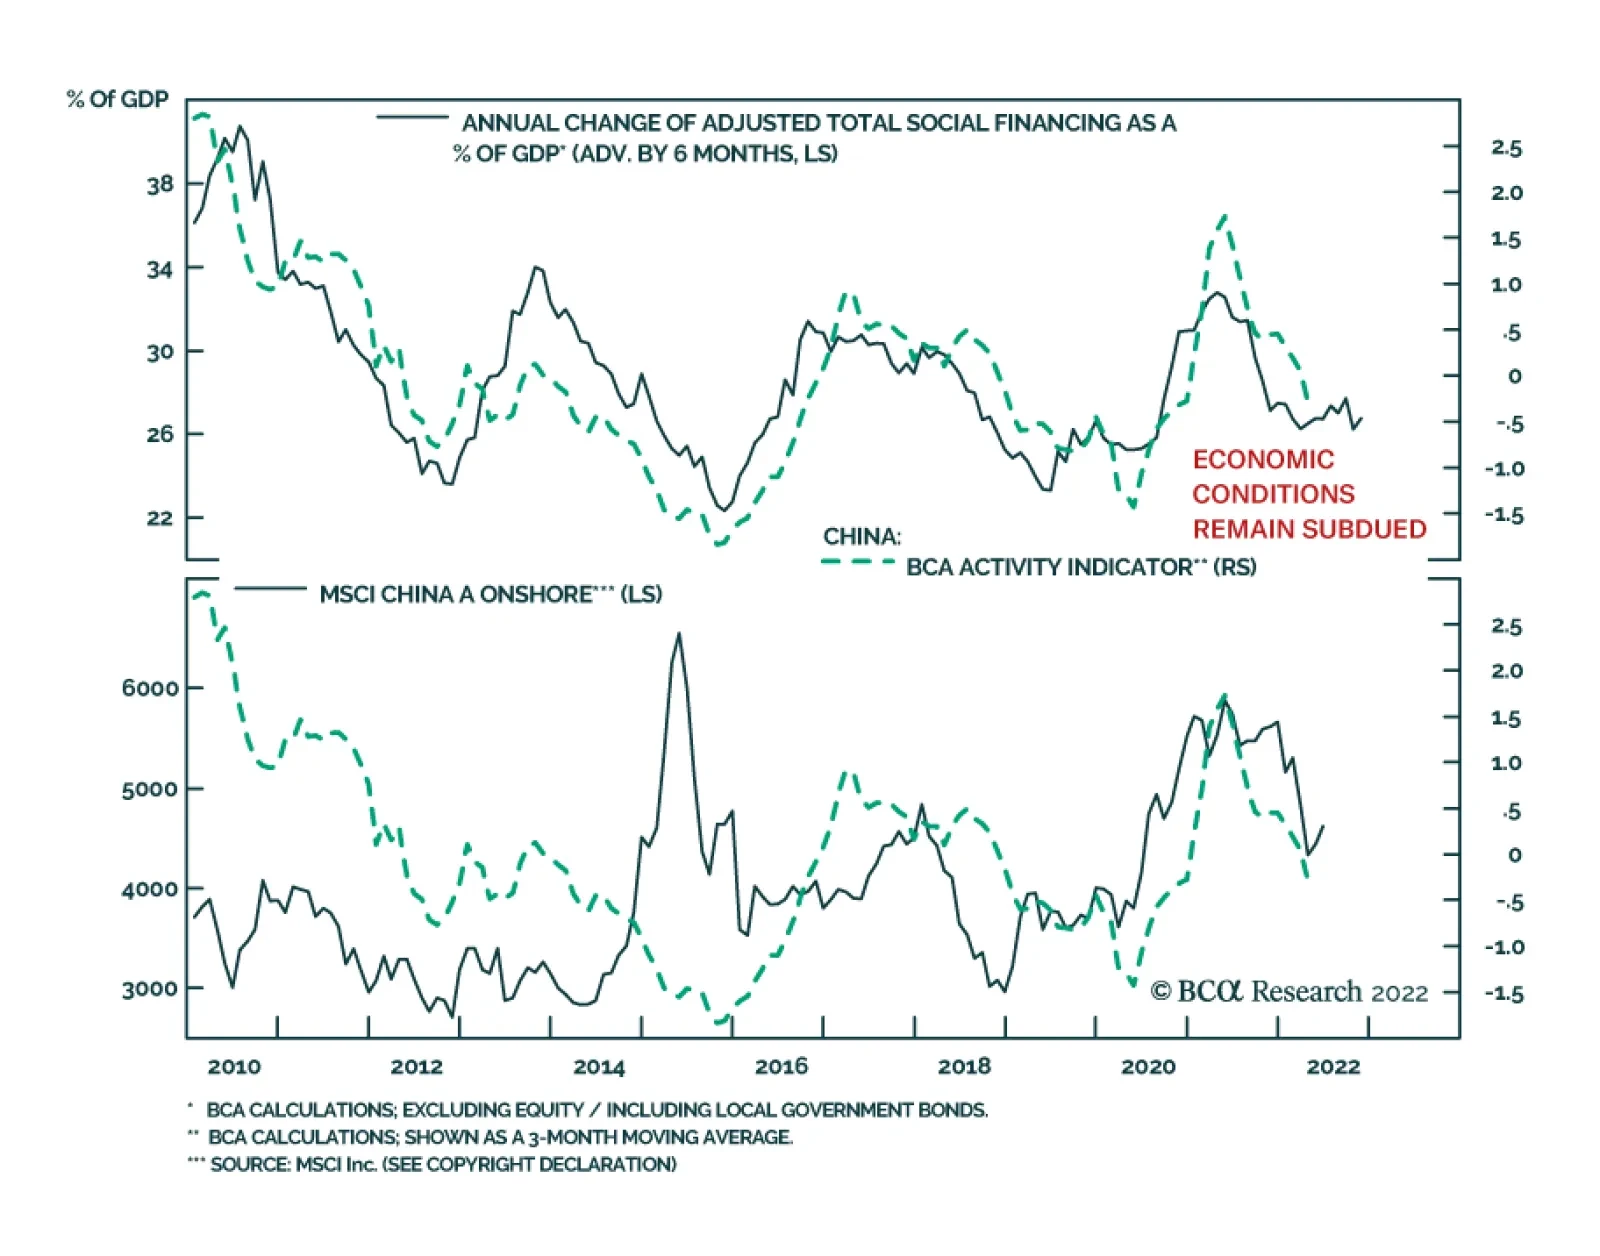
Chinese economic data surprised to the upside in May. Industrial production grew by 0.7% y/y against an anticipated 0.9% y/y decline and following a 2.9% contraction. The decline in retail sales was less severe in May (6.7% y/y) than it was in April (11.1%…
Executive Summary Was FAANGM A Bubble?
Was FAANGM A Bubble?
Was FAANGM A Bubble?
US inflation has become broad-based, and the labor market is very tight. Wages are a lagging variable, and they will be rising rapidly in the coming months, even as the economy slows. Although US growth will be slowing and global trade will be contracting, the Fed will remain hawkish over the coming months. This is an unprecedented environment and is negative for global and EM risk assets. The US trade-weighted dollar will continue to appreciate as long as the Fed sounds and acts in a hawkish manner and global trade contracts. Consistent with a US dollar overshoot, EM financial markets will undershoot. Even though EM equity and local bond valuations have become attractive, their fundamentals are still negative. A buying opportunity in EM will occur when the Fed makes a dovish pivot and China stimulates more aggressively. We reckon that these conditions will fall into place sometime in H2 this year. Bottom Line: For now, we recommend that investors stay defensive in absolute terms and underweight EM within global equity and credit portfolios. The dollar has more upside in the near term but a major buying opportunity in EM local currency bonds is approaching. Feature Last week, after a two and a half year hiatus, I travelled to Europe to visit clients. I also took the opportunity catch up with Ms. Mea, a global portfolio manager and a long-standing client. Prior to the pandemic, we met regularly to discuss global macro and financial markets. She was happy to resume our in-person meetings, and we met in Amsterdam over dinner last Friday. This report provides the key points of our conversation for the benefit of all clients. Ms. Mea: I am very happy that we are again able to meet in person. Video meetings are good, but in-person meetings are better. One’s body language often gives away their level of confidence regarding investment recommendations. Answer: Agreed. My meetings with clients this week have reminded me of the value of in-person meetings. Chart 1Our Calls On Various EM Asset Classes
Our Calls On Various EM Asset Classes
Our Calls On Various EM Asset Classes
Ms. Mea: Before our meeting I reviewed the evolution of your investment views since the pandemic erupted. Let me try to summarize them, and correct me if I miss something. Even though you upgraded your medium-term view on Chinese growth in May 2020 due to the stimulus, you remained skeptical of the rally in global risk assets. In Q2 2020, you upgraded your stance on EM bonds and in July 2020 you lifted the recommended allocation to EM equities and currencies from underweight to neutral (Chart 1). In the summer and fall of 2020, you were still wary of a deflationary relapse in developed economies. However, since January 2021, your outlook for the US shifted drastically to overheating and inflation. Since then, you have been very vocal about inflation risks in the US. At the same time, you have been warning about a major slowdown in Chinese growth. Regarding financial markets, in March 2021, you downgraded EM stocks and bonds to underweight and recommended shorting select EM currencies versus the US dollar (Chart 1). I should say that your call on US inflation and China’s slowdown have played out very well over the past 18 months. Let’s zero in on US inflation. It was just last year that many investors and analysts claimed that inflation is good for stocks because it helps their top line growth. Why then have global markets panicked? Chart 2Record Wealth Destruction In US Stocks And Bonds
Record Wealth Destruction In US Stocks And Bonds
Record Wealth Destruction In US Stocks And Bonds
Answer: Not many people have a deep understanding of inflation and its impact on financial markets because most investors lack experience in navigating financial markets during an inflation era. In fact, the US equity and bond market selloffs of the past 12 months have wiped out about $12 trillion and $3.5 trillion off their respective market value. This adds up to a combined $15.5 trillion or about 60% of US GDP and already exceeds the wipeouts during the March 2020 crash and all other bear markets (Chart 2). The way we think about macro and markets must change in an inflation regime. In our seminal February 25, 2021 Special Report titled A Paradigm Shift In The Stock-Bond Relationship, we made the case that the US economy and its financial markets were about to enter a new paradigm of higher inflation. We argued that US core CPI would spike well above 2% and US share prices and US government bond yields would become negatively correlated. A similar paradigm shift occurred in 1966 (Chart 3). In short, we argued that the era of low US inflation was over, and as a result, equities and bonds would selloff simultaneously. This will remain the roadmap for investors as long as core inflation is high. Chart 3A Paradigm Shift: US Stock Prices And Bond Yields Correlation Over Decades
A Paradigm Shift: US Stock Prices And Bond Yields Correlation Over Decades
A Paradigm Shift: US Stock Prices And Bond Yields Correlation Over Decades
Ms. Mea: Do you think the Fed is behind the curve? Answer: Yes, the Fed has fallen behind the curve, and, as we have repeatedly argued over the past 12 months, the US inflation genie is out of the bottle. There is a lot of confusion in the global investment community about how we should think about inflation, and about how and when the various measures of inflation matter. As consumers, we care about headline inflation because it affects our purchasing power. So, changes in all goods and service prices, including energy and food, matter to consumers. However, this does not mean that central banks should target and set policy based on headline inflation. Rather, central banks should target genuine broad-based inflation in the economy before it becomes entrenched. Ms. Mea: Can you explain why in certain cases a surge in energy, food and other prices leads to entrenched inflation but in other cases it does not? Answer: Let me give you an example. When consumers experience rapidly rising food and energy prices, they will likely demand faster wage growth from their employers. If businesses are enjoying strong demand for their goods/services and facing a tight labor market, they might have little choice but to agree to pay raises to sustain their business. Companies will then attempt to protect their profit margins by hiking their selling prices. Households may accept higher prices given their incomes are rising. This dynamic could cause inflation to become broad-based and entrenched. In this case, central banks should lift rates to slow the economy materially and cool off the labor market to end the wage-price spiral. If employees fail to negotiate hefty pay raises, odds are that inflation will not become broad-based. The more households spend on energy and food, the less income they will have to spend on other items, causing their discretionary spending to contract. In this case, there is no rush for central banks to tighten policy. If monetary authorities tighten materially, the economy will experience a full-fledged recession. In short, wage dynamics will determine whether inflation becomes broad-based. Labor market conditions will ultimately dictate this outcome. Ms. Mea: But why are wages more important than the price of fuel or food in determining whether inflation becomes broad-based? Answer: To be technically correct, unit labor costs, not wages, are key to inflation dynamics. Unit labor cost = (wage per hour) / (productivity). Productivity is output per hour. Given that labor is the largest cost component of US businesses, unit labor costs will swell and profit margins will shrink when salaries rise faster than productivity. CEOs and business owners always do their best to protect the their profit margins. Thus, accelerating unit labor costs will lead them to raise their selling prices. In the wake of wage gains, consumers might accept higher goods and service prices. If they do and go on to demand even higher wages, the economy will enter a wage-price spiral. This is why wage costs, more specifically unit labor costs, are the most important variable to monitor. If high energy and food prices lead employees to demand faster wage growth from their employers, and if they are granted wage increases above and beyond their productivity advances, inflation will become more broad-based and genuine. If consumers push back against higher prices, i.e., reduce their spending, corporate profits will plunge, and companies will freeze investment and lay off employees. Wages will slow and inflation will wane. Ms. Mea: Are all economies currently experiencing a wage-price spiral? Answer: The US and some other countries have been experiencing a wage-price spiral over the past 12 months. In other countries, including many developing economies, a wage-price spiral is currently absent. In the US, labor demand exceeds supply by the widest margin since 1950 (Chart 4). The upshot is that wages will continue to rise in response to persistently high inflation (Chart 5). Chart 4US Labor Demand Is Exceeding Labor Supply By The Widest Margin Since 1950
US Labor Demand Is Exceeding Labor Supply By The Widest Margin Since 1950
US Labor Demand Is Exceeding Labor Supply By The Widest Margin Since 1950
Chart 5US Wage Growth Is Already Very High
US Wage Growth Is Already Very High
US Wage Growth Is Already Very High
Wages in the US are currently rising at a rate of 6-6.5% or so. US productivity growth is around 1.5%. As a result, unit labor costs are rising at a 4.5-5% annual rate, the fastest rate for corporate America in the past 40 years (Chart 6). As Chart 6 demonstrates, unit labor costs have been instrumental in defining core CPI fluctuations over the past 70 years in the US. Chart 6US Unit Labor Costs Are Rising At The Fastest Rate Since 1982
US Unit Labor Costs Are Rising At The Fastest Rate Since 1982
US Unit Labor Costs Are Rising At The Fastest Rate Since 1982
Chart 7US Core Of Core Inflation Is High And Not Falling
US Core Of Core Inflation Is High And Not Falling
US Core Of Core Inflation Is High And Not Falling
In short, both surging unit labor costs and the acceleration of super core CPI measures like trimmed-mean CPI and median CPI suggest that US inflation has become broad-based and a wage-inflation spiral has taken hold in the US (Chart 7). Critically, wages are a lagging variable and are not reset all at once for all employees. American employees will continue to demand substantial wage hikes both to offset the last 12 months of lost purchasing power and to protect their purchasing power for the next 12 months. Hence, we will be witnessing faster wage growth in the coming months even as the economy slows. For many continental European economies and for several EM economies, wage growth is still weak. Chart 8 illustrates that nominal wage growth in India, Indonesia, China and Mexico are very subdued. Sluggish wage gains in emerging economies are consistent with the profile of their domestic demand. Domestic demand in these large developing economies remains extremely weak. In many cases, the level of domestic demand in real terms is still below its pre-pandemic level (Chart 9). Chart 8EM Wages Are Very Tame
EM Wages Are Very Tame
EM Wages Are Very Tame
Chart 9EM Domestic Demand Is Depressed
EM Domestic Demand Is Depressed
EM Domestic Demand Is Depressed
In China, deflation, rather than inflation, is the main economic threat. Headline and core inflation are within a 1-2% range (Chart 10), domestic demand is very weak, and the unemployment rate has risen in the past 12 months. Chart 10China's Inflation Is Subdued
China's Inflation Is Subdued
China's Inflation Is Subdued
Ms. Mea: Do you expect the US economy to contract? Answer: US growth will decelerate substantially, and certain segments of the economy could shrink for a couple of quarters. My expectation is that US corporate profits will contract materially. Slowing top line growth, narrowing profit margins, shrinking global trade and a strong dollar are all major headwinds for the S&P 500 EPS. EM EPS are also heading towards a major contraction. This is why I view EM fundamentals as negative even though EM valuations have become attractive. Ms. Mea: You have recently written that global trade volumes are about to contract. What is your rationale and is there any evidence that this is already happening? Answer: US and EU demand for consumer goods ex-autos has been booming over the past two years. Households have overspent on goods ex-autos (Chart 11). Given that their disposable income is contracting in real terms and a preference to spend on services, households will markedly curtail their purchases of consumer goods in the coming months. This will hurt global manufacturing in general, and emerging Asia in particular. Some forward-looking indicators are already signaling a contraction in global trade: US retail inventories (in real terms) have swelled (Chart 12, top panel). US retailers will dramatically reduce their orders. Chart 11Global Trade Volumes Will Shrink In H2 2022
Global Trade Volumes Will Shrink In H2 2022
Global Trade Volumes Will Shrink In H2 2022
Chart 12US Import Volumes Are Set To Contract
US Import Volumes Are Set To Contract
US Import Volumes Are Set To Contract
Besides, US railroad carload is already shrinking, signaling reduced goods shipments (Chart 12, bottom panel). Taiwanese shipments to China lead global trade and they point to an impending slump (Chart 13, top panel). Also, the Taiwanese manufacturing shipments-to-inventory ratio has dropped below 1 (Chart 13, bottom panel). Finally, industrial metal prices are breaking down despite easing lockdowns in China and continued sanctions on Russia (Chart 14). This is a sign of downshifting global manufacturing. Chart 13A Red Flag For Global Trade
A Red Flag For Global Trade
A Red Flag For Global Trade
Chart 14Industrial Metal Prices Are Breaking Down
Industrial Metal Prices Are Breaking Down
Industrial Metal Prices Are Breaking Down
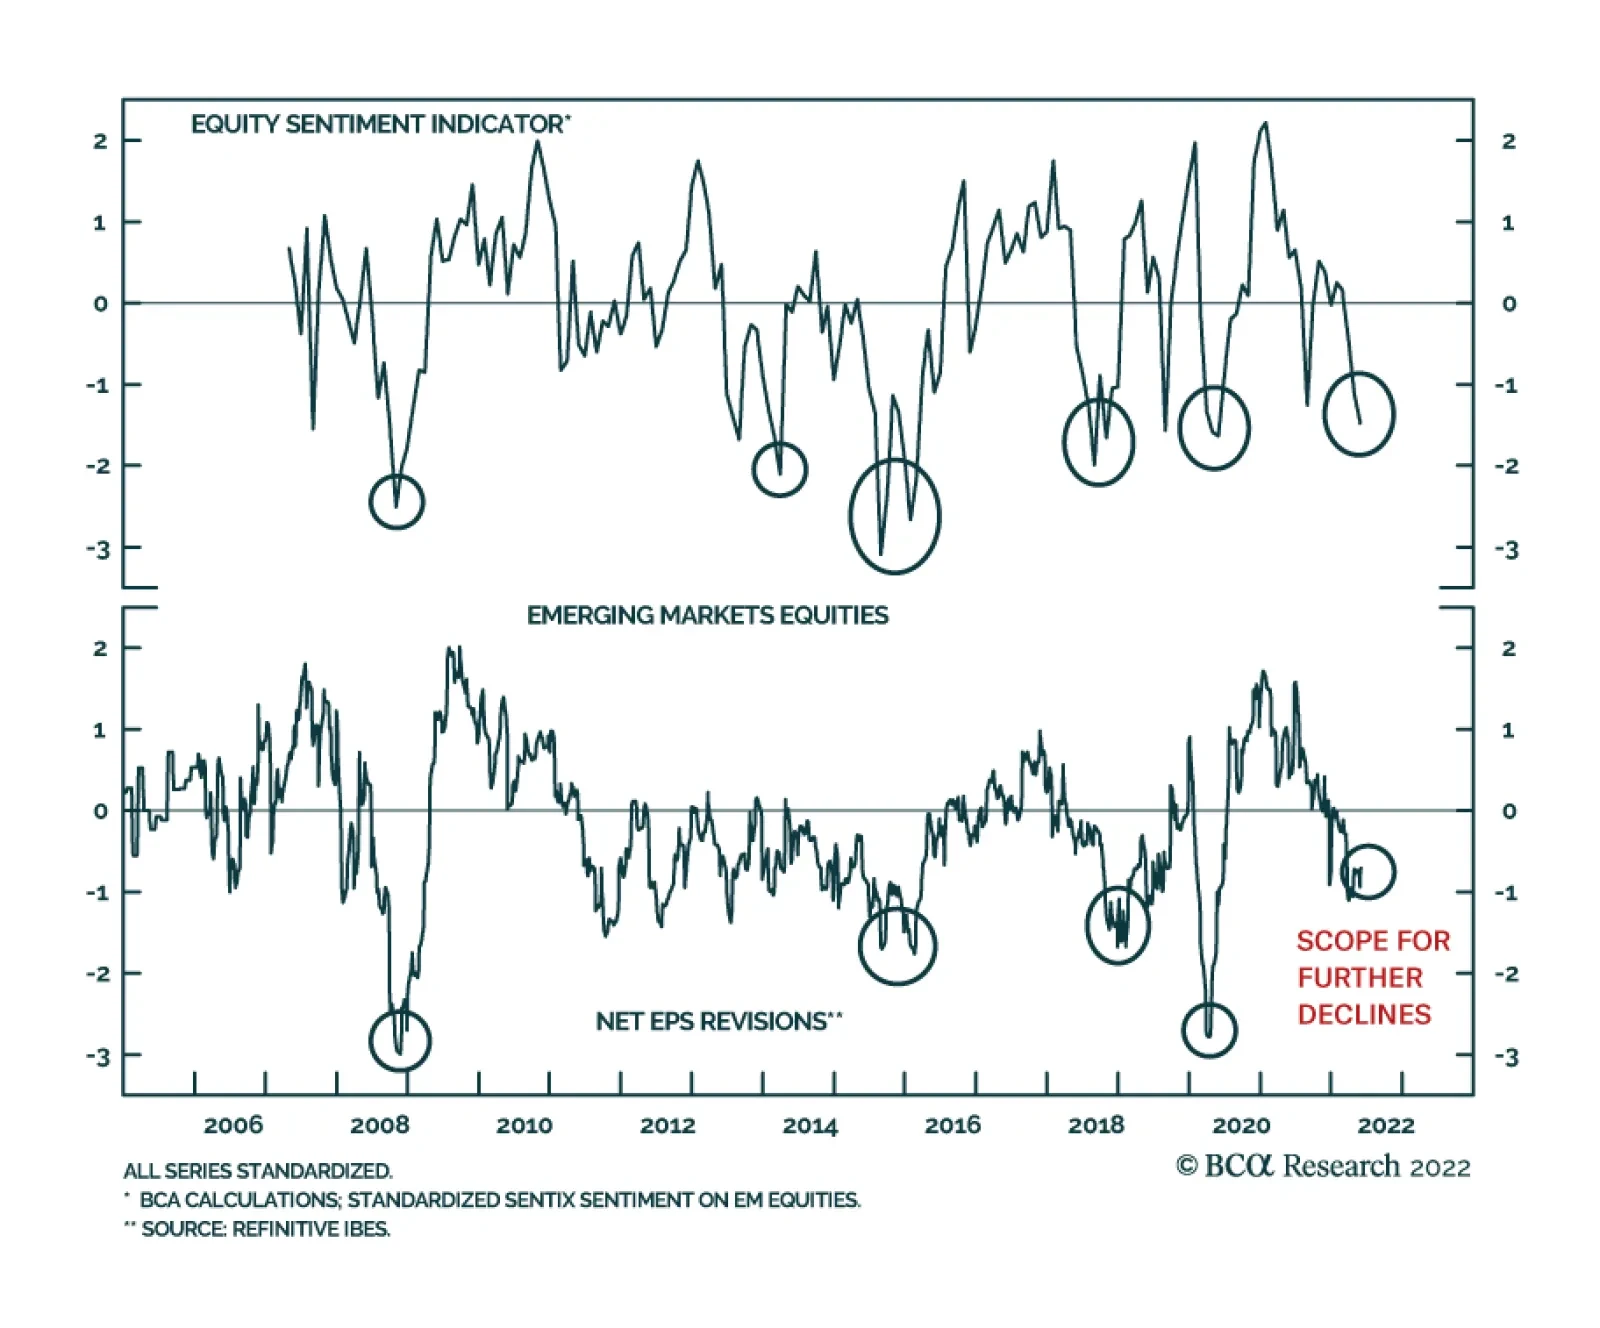
Ms. Mea: Won’t a global trade contraction push down goods prices and help US inflation? Answer: Correct, it will bring down US goods inflation but not services inflation. Importantly, as we discussed above, US inflation has already spilled into wages and has become broad-based. Plus, it is hovering well above the Fed’s target. Hence, the Fed cannot dial down its hawkishness now, even if goods price inflation drops significantly. In brief, even though US growth will be slowing and global trade will be contracting over the coming months, the Fed is likely to remain hawkish. This is an unprecedented environment and is negative for global and EM risk assets. Ms. Mea: What are the financial market implications of entrenched inflation in the US and the lack of genuine inflationary pressures in many emerging economies? Answer: As long as the Fed sounds and acts in a hawkish manner and/or global trade contracts, the US trade-weighted dollar will continue to appreciate. The greenback is a countercyclical currency and rallies when global trade slumps. On the whole, the USD will likely overshoot in the near run. Consistent with a US dollar overshoot, EM financial markets will undershoot. Even though investor sentiment on EM equities and USD bonds is very low (Chart 15), a final capitulation selloff is still likely. In short, EM valuation and positioning are positive for future potential returns yet their fundamentals (business cycle, profits, return on capital, etc.) are still negative. A buying opportunity in EM will emerge when the Fed makes a dovish pivot, China stimulates more aggressively, and EM equity and bond valuations improve further. We reckon that these conditions will fall into place sometime in H2 this year. If the Fed turns dovish early without taming US inflation, it will fall behind the inflation curve and the US dollar will begin its bear market. Investors will respond by embracing EM financial assets. EM local currency bonds in particular offer value (Chart 16). Prudent macro policies and the lack of wage pressures entail a good medium-to-long term opportunity in EM local currency bonds. Chart 15Investor Sentiment On EM Stocks And USD Bonds Is Low
Investor Sentiment On EM Stocks And USD Bonds Is Low
Investor Sentiment On EM Stocks And USD Bonds Is Low
Chart 16US TIPS Yields Should Roll Over For EM Local Bond Yields To Decline
US TIPS Yields Should Roll Over For EM Local Bond Yields To Decline
US TIPS Yields Should Roll Over For EM Local Bond Yields To Decline
As EM currencies put in a bottom, local yields will come down. This will help their equity markets. Ms. Mea: Speaking of a capitulation selloff, how far can it go? Both for EM stocks as well as the S&P 500? Chart 17S&P500: Where Is Technical Support Line?
S&P500: Where Is Technical Support Line?
S&P500: Where Is Technical Support Line?
Answer: As long as US bond yields and oil prices do not start falling on a consistent basis, the S&P 500 will remain under selling pressure. Technicals can help us gauge the likely magnitude of the move. The S&P 500 has dropped to a major technical support, but it will likely be broken. The next support is around 3100-3200 (Chart 17). The EM equity index is sitting on a technical support now (Chart 18). The next support level is 15-17% below the current one. Chart 18EM Stocks in USD Terms Could Drop Another 15%
EM Stocks in USD Terms Could Drop Another 15%
EM Stocks in USD Terms Could Drop Another 15%
Critically, US equity investors should also consider whether the US equity bull market that has been in place since 2009 is over. If it is, then the S&P 500 bear market could last long, and prices could drop significantly. Chart 19Was FAANGM A Bubble?
Was FAANGM A Bubble?
Was FAANGM A Bubble?
A few observations that investors should keep in mind: First, over the past 12 years, FAANGM stocks have followed the profile of the Nasdaq 100 (Chart 19). In short, FAANGM stocks have risen as much as the Nasdaq 100 index did in the 1990s. Second, when retail investors rush into an asset class, it often signals the final phase of the bull market. Once the bull market ends, the ensuing bear market is vicious. The behavior of tech/internet stocks and the broader S&P 500 fits this profile extremely well. For several years after the Lehman crash, individual investors were hesitant to buy US stocks. However, the resilience of US equities led to a buy the dip mentality in 2019-20. Retail investors joined the equity party en masse in early 2020. The post retail frenzy hangover is usually very painful and prolonged. Based on this roadmap, it seems that the 2020-21 retail-driven rally was the final upleg in the S&P 500 bull market. By extension, we have entered a bear market that could be vicious and extended. All the excesses of the 10-year FAANGM and S&P500 bull markets will need to be worked out before a new bull market emerges. Finally, a high inflation regime raises the bar for the Fed to rescue the stock market. This also entails lower equity multiples than we have in the S&P500 now. Ms. Mea: What do you make of EM’s recent outperformance versus DM stocks? When will you upgrade EM versus DM? Answer: Indeed, EM stocks have recently outperformed DM stocks. We might be witnessing a major transition in global equity market leadership. We have held for some time that an equity leadership change from the US to the rest of the world and from TMT stocks to other segments of the global equity market would likely take place during or following a major market selloff. The ongoing equity bear market seems to be exactly that catalyst. Chart 20For EM Equities To Outperform, USD Needs To Weaken
For EM Equities To Outperform, USD Needs To Weaken
For EM Equities To Outperform, USD Needs To Weaken
If the S&P 500 bull market is over, the global equity leadership will also change away from US and TMT stocks to other stock markets and sectors. That said, to upgrade EM stocks, we need to change our view on the USD because EM relative equity performance versus DM closely tracks the inverted trade-weighted US dollar (Chart 20). In the near term, we believe the greenback has more upside potential. In particular, Asian currencies and equity markets cannot outperform when the Fed is hawkish and global trade is contracting. Latin American currencies have benefited since early this year from the spike in commodity prices. However, worries about a US recession, a strong dollar and a lack of strong recovery in the Chinese economy will push industrial metal prices lower. As shown in Chart 14 above, industrial metal prices are breaking down. This is a bad omen for Latin American markets. On the whole, we will likely be upgrading EM versus DM later this year. For now, we recommend that investors stay defensive and underweight EM within global equity and credit portfolios. We also continue to short the following currencies versus the USD: ZAR, COP, PEN, PLN, PHP and IDR; as well as HUF vs. CZK, and KRW vs. JPY. A major buying opportunity in local currency bonds is approaching. Arthur Budaghyan Chief Emerging Markets Strategist arthurb@bcaresearch.com
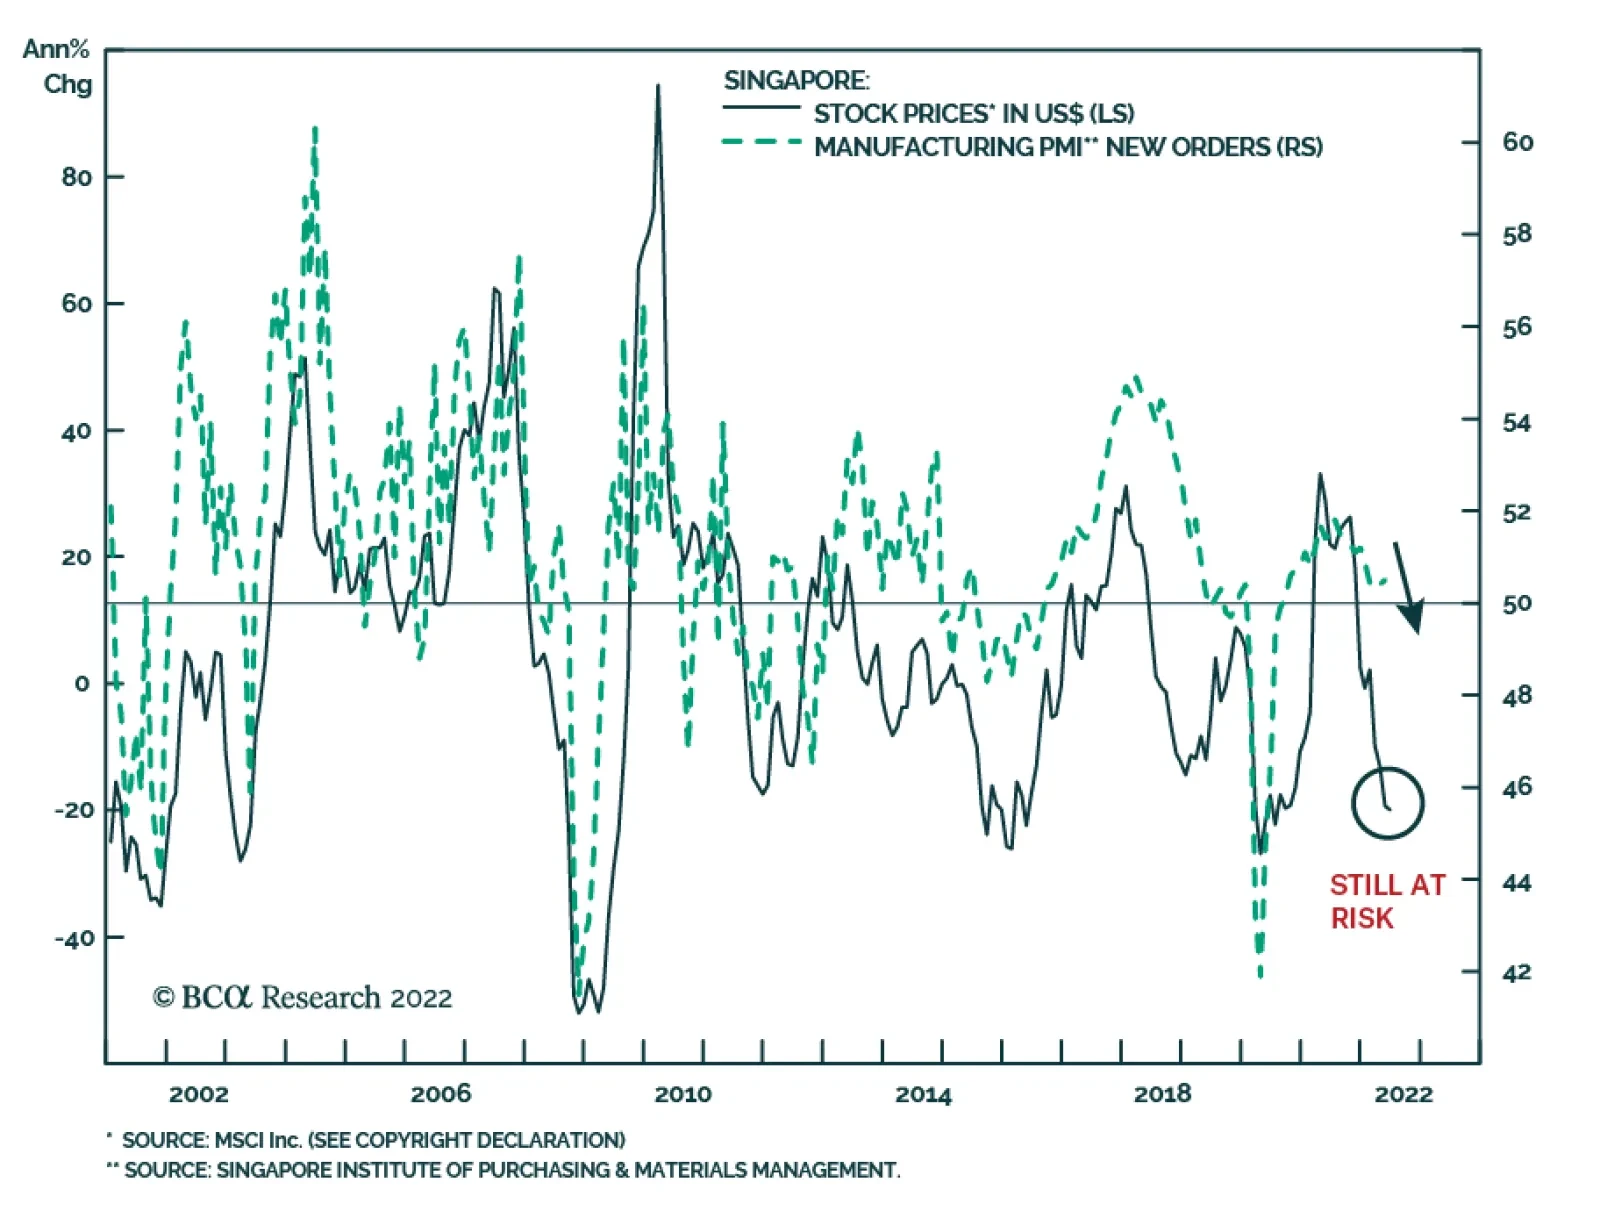
Contracting global trade and tightening liquidity will weigh on Singapore stocks in the months ahead. In a recent report, our Emerging Markets Strategy (EMS) team ascertained that global trade volumes will fall as developed countries’ demand for goods…
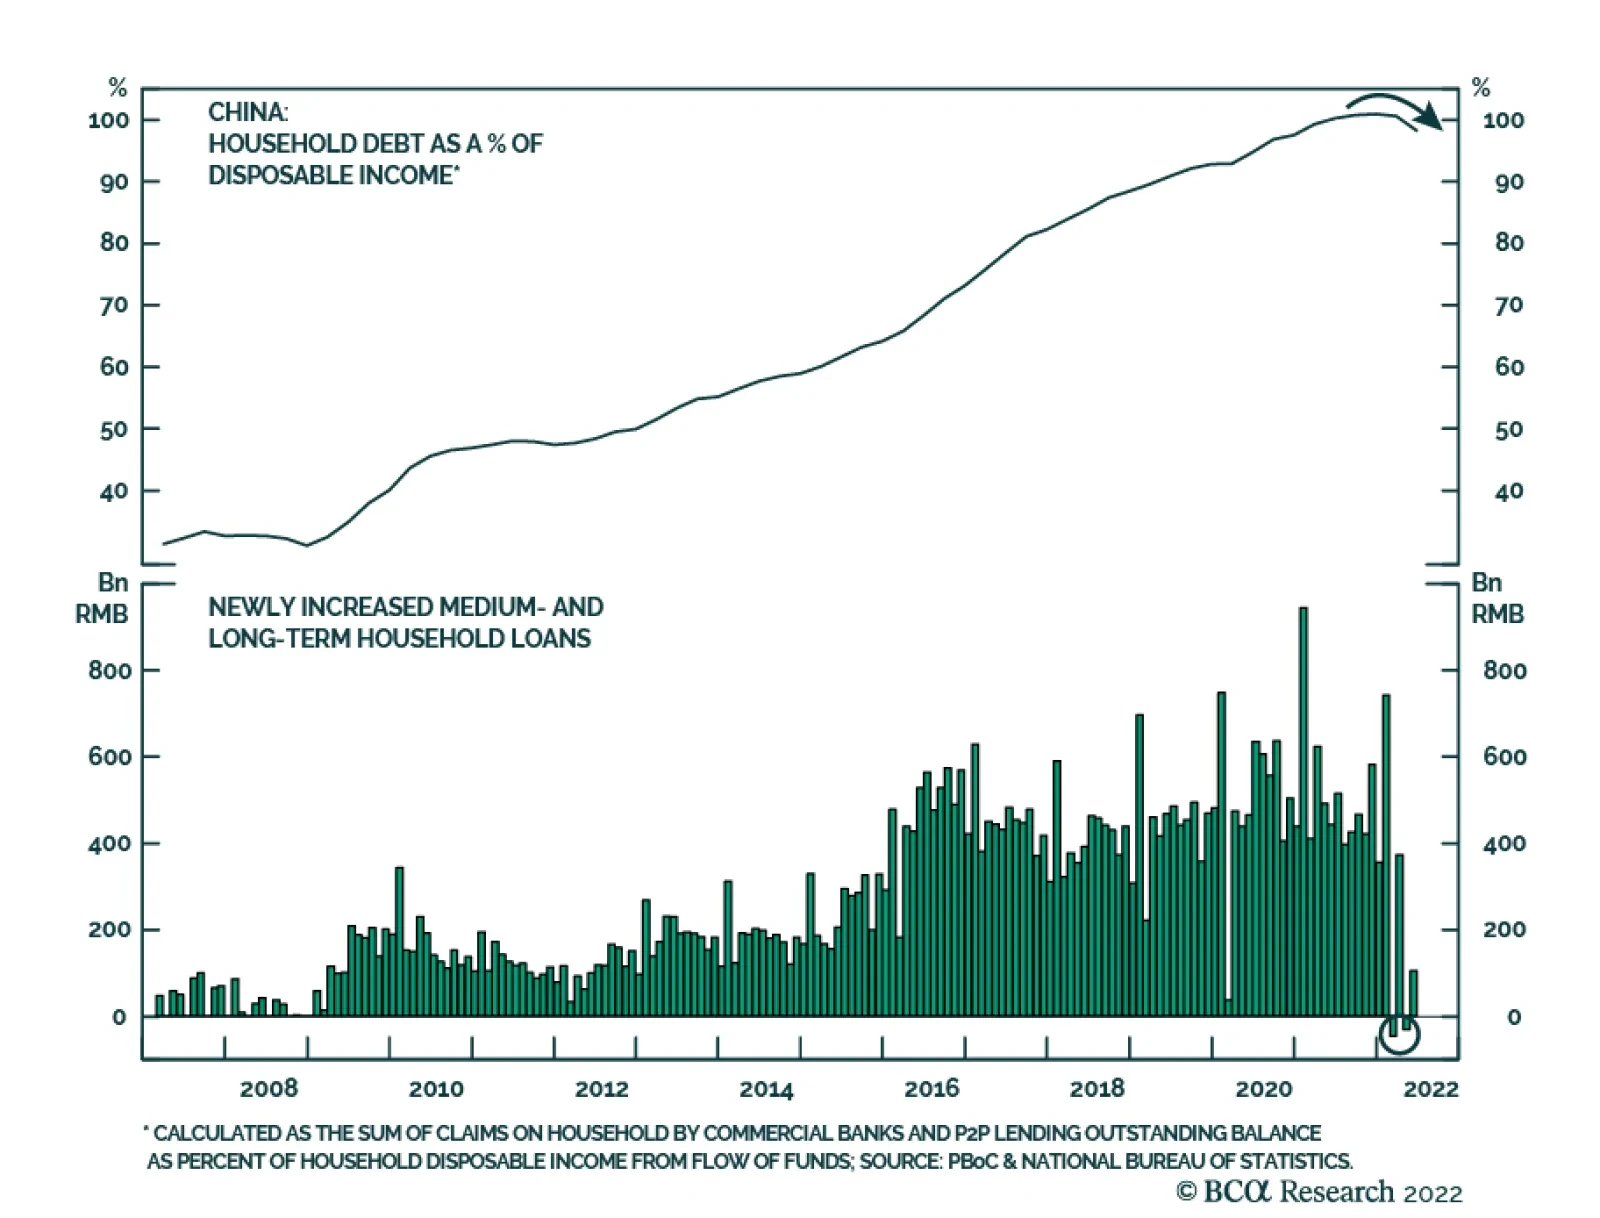
According to BCA Research’s China Investment Strategy service, a deleveraging cycle, coupled with a decline in total population, may lead to a structurally lower interest rate environment, which may be positive for Chinese equity valuations in the long run. …
Dear Client, In lieu of our weekly report next week, I will be hosting two webcasts with my colleague Arthur Budaghyan, Chief Emerging Market Strategist: Time To Buy EM/China? June 23, 2022 9:00 AM EDT (2:00 PM BST, 3:00 PM CEST) and June 24, 2022 9:00 AM HKT (11:00 AM AEST). We will discuss the implications of the global macro environment on EM economies and assets, and whether it is time to buy EM/Chinese equities. I look forward to answering any questions you might have. Kind regards, Jing Sima China Strategist Executive Summary Chinese Households Leverage Ratio Fell The Most Since The GFC
Chinese Households Leverage Ratio Fell The Most Since The GFC
Chinese Households Leverage Ratio Fell The Most Since The GFC
China’s households may be entering a deleveraging mode. The level of newly increased household medium- to long-term loans declined in two out of the first five months of this year. The household leverage ratio has also been falling. The deleveraging is driven by both cyclical and structural forces. Depressed economic growth, home prices as well as jobs and incomes, have all curbed borrowing. Structurally, China’s demographic shift and a decline in the working-age population will lead to a steady decrease in the demand for housing and mortgages. The experience in Japan and the US suggests that when households start deleveraging, the trend will likely progress into a decade-long cycle. The household deleveraging cycle may lead to a structural downshift in real estate investment, consumption of durable goods and money supply in China. As an offset, interest rates in China will shift down. A low interest rate environment may be positive for China’s financial asset valuations. Bottom Line: Both cyclical and structural forces are prompting Chinese households to reduce debt. A prolonged deleveraging cycle will lead to a slump in the demand for housing and consumer durable goods. However, a deleveraging cycle, coupled with a decline in total population, may lead to a structurally lower interest rate environment, which may be positive for Chinese equity valuations in the long run. Feature China’s newly increased consumer medium- to long-term (ML) loans turned negative in February and April this year, the first negative readings since data collection started in 2007. The reading indicates that households are paying off more ML loans than borrowing (Chart 1). Chart 1Chinese Household New ML Loans Dropped Below Zero Twice This Year
Chinese Household New ML Loans Dropped Below Zero Twice This Year
Chinese Household New ML Loans Dropped Below Zero Twice This Year
In the near term, a slowing economy and uncertainties surrounding job and income prospects, coupled with stagnating housing prices, will curb households’ propensity to take on debt. In the longer term, China’s working-age population peaked in 2015 and its total population is set to decline beginning in 2025. This unfavorable demographic trend will drive down the demand for housing and ML loans. Japan's experience shows that when the working-age population falls along with the household leverage ratio, the growth in real estate investment, consumption of consumer durable goods and money supply M2 will structurally shift to a lower range. Although a weakening demographic profile and deleveraging households are negative factors for economic growth, interest rates in China will likely move down structurally. Lower borrowing costs will make corporate debt-servicing cheaper and increase corporate profitability, thus providing tailwinds to Chinese stocks and government bonds in the long run. An Inflection Point In Chinese Households’ Leverage? Chart 2Chinese Households Leverage Ratio Fell The Most Since The GFC
Chinese Households Leverage Ratio Fell The Most Since The GFC
Chinese Households Leverage Ratio Fell The Most Since The GFC
Several signs suggest that Chinese household debt, after more than a decade of rapid expansion, may have reached an inflection point. Newly increased household ML loans, which are mostly mortgage debt, turned negative this year. Although household ML loans were slightly positive in May, the number was one of the weakest in the past 15 years. China’s household leverage ratio (measured by household debt versus disposable income) rolled over, the first such plunge since the 2008/09 Global Financial Crisis (Chart 2). Chinese households’ reluctance to take on debt reflects current dire economic conditions, which have been damaged by the pandemic and collapse in the housing market. Furthermore, structural forces, such as the nation’s unfavorable demographic shifts, will likely drive the ongoing cyclical deleveraging into a sustained secular trend. Related Report Emerging Markets StrategyA Whiff Of Stagflation? The pandemic and frequent city lockdowns in the past two years in China have significantly reduced households’ income growth, which has increased debt repayment burdens on families. Even though the central bank and more than 100 cities in China recently slashed mortgage rates, the average cost of mortgage loans remains higher than income growth per capita. In other words, the current mortgage rates in China are not low enough to reverse the downward trend in households’ ML loans (Chart 3). The investment appeal of real estate has also diminished. Prior to 2018, home prices often appreciated faster than the prevailing mortgage rates. Since late 2019, however, the rate of housing price appreciation in China’s 70 medium and large cities has been falling below the average interest rate on mortgage loans (Chart 4). Home price appreciation has stalled since the second half of last year, whereas mortgage rates are currently about 5.5%. As such, housing’s carry has become negative, discouraging investment purchases of residential properties. Chart 3Mortgage Rates Have Dropped But Still Higher Than Income Growth
Mortgage Rates Have Dropped But Still Higher Than Income Growth
Mortgage Rates Have Dropped But Still Higher Than Income Growth
Chart 4Returns On Leveraged Property Investment Have Diminished
Returns On Leveraged Property Investment Have Diminished
Returns On Leveraged Property Investment Have Diminished
In order for consumer ML loans to pick up strongly in the next 6 to 12 months, either the household income growth must significantly improve and/or mortgage rates will have to drop well below home price appreciation. Recent surveys suggest that both will probably not happen in the near term (Chart 5). Chart 5Chinese Households' Income And Investment Outlooks Are Dim
Chinese Households' Income And Investment Outlooks Are Dim
Chinese Households' Income And Investment Outlooks Are Dim
Chart 6Demand For Housing Will Dwindle Along With Smaller Labor Force
Demand For Housing Will Dwindle Along With Smaller Labor Force
Demand For Housing Will Dwindle Along With Smaller Labor Force
In a previous report we indicated that China’s falling birthrate and working-age population will lead to less demand for housing from a structural point of view. Home sales have fluctuated in a downward trend in the past five years along with a peak in the working-age population in 2015 (Chart 6). Moreover, the sharp deterioration in China’s birthrate will reduce the demand for housing even more significantly in the next 15-20 years. This unfavorable demographic trend will exert powerful downward pressures on the country’s household credit demand. Bottom Line: While the ongoing economic slowdown and housing market slump are curbing ML loans, China’s household loan demand may be entering a structural downturn due to the country’s demographic headwinds. The Economic Impact Of Household Deleveraging The experience in both Japan and the US suggests that when households begin to reduce their debt, the trend may spiral into a secular cycle that lasts up to a decade (Chart 7). A prolonged deleveraging cycle can push the growth in residential real estate investment, consumption of durable goods and money supply to much lower levels. In Japan’s case, the household debt-to-income ratio rolled over in the late 1990s when the country’s working-age population peaked and began a nose-dive in the early 2000s. The country’s growth in residential investment fell along with households’ debt reduction, from a 13% average annual rate (nominal) in the 1980s to about 3% in the 2000s (Chart 8). Chart 7Deleveraging Can Spiral Into A Decade##br## Long Cycle
Deleveraging Can Spiral Into A Decade Long Cycle
Deleveraging Can Spiral Into A Decade Long Cycle
Chart 8Japan's Real Estate Investment Growth Slowed Along With Falling Household Leverage...
Japan's Real Estate Investment Growth Slowed Along With Falling Household Leverage...
Japan's Real Estate Investment Growth Slowed Along With Falling Household Leverage...
Consumption growth, particularly in consumer durable goods, also dropped from more than 10% in the 1980s to around 0-2% in the late 1990s. It subsequently fell into a prolonged contraction in the 2000s when the household leverage ratio declined (Chart 9). Real estate credit is a major source for China’s money origination. Therefore, a lack of household loan demand will depress the country’s overall credit and money growth. Japan’s money supply grew by less than 4% in the 2000s in nominal terms, compared with a nearly 10% increase in the years prior to the household deleveraging cycle (Chart 10). Chart 9...So Did Demand For Consumer Durable Goods
...So Did Demand For Consumer Durable Goods
...So Did Demand For Consumer Durable Goods
Chart 10Money Supply Growth Also Slowed
Money Supply Growth Also Slowed
Money Supply Growth Also Slowed
Bottom Line: Without an imminent and significant improvement in the economy, household deleveraging can progress into a secular trend. A prolonged household deleveraging cycle will drive down the growth in residential property investment, consumption and money supply. Investment Conclusions The combination of declining household debt and total population will weigh on the demand for housing, consumption and investment growth, generating deflationary headwinds for China’s economy. Thus, China’s interest rate regime will likely follow Japan’s example and downshift structurally (Chart 11). A lower interest rate environment will at margin be positive for China’s financial asset valuations in the long run. Related Report China Investment StrategyExpect A Much Weaker Economy In Q2 Weaker prices on capital will make corporate debt-servicing cheaper and increase corporate profitability. China will likely maintain a very accommodative fiscal policy in the next decade to offset less demand from households and to help implement industrial policies aimed at achieving self-sufficiency in technology and energy. Furthermore, Chinese households may bump up their savings while reducing debt. As returns on residential property investment diminish and yields on risk-free assets shift lower, Chinese households may be increasingly willing to invest in financial assets. This trend could provide tailwinds to Chinese equities in the long term (Chart 12). Chart 11Interest Rates In China Will Likely ##br##Structurally Downshift
Interest Rates In China Will Likely Structurally Downshift
Interest Rates In China Will Likely Structurally Downshift
Chart 12Chinese Households May Shift Their Investment Preference From Properties To Financial Assets
Chinese Households May Shift Their Investment Preference From Properties To Financial Assets
Chinese Households May Shift Their Investment Preference From Properties To Financial Assets
Jing Sima China Strategist jings@bcaresearch.com Strategic Themes Cyclical Recommendations
The MSCI Emerging Markets equity index is up nearly 7% in USD terms over the past month. Does this latest bounce mark the beginning of a sustainable improvement in the performance of EM risk assets? China’s money and credit cycles drive Chinese imports and…
Executive Summary Autocracy Hurts Productivity
Autocracy Hurts Productivity
Autocracy Hurts Productivity
Over the next six-to-18 months, the Xi Jinping administration will “let 100 flowers bloom” – i.e., relax a range of government policies to secure China’s economic recovery from the pandemic. The first signs of this policy are already apparent via monetary and fiscal easing and looser regulation of Big Tech. However, investors should treat any risk-on rally in Chinese stocks with skepticism over the long run. Political risk and policy uncertainty will remain high until after Xi consolidates power this fall. Xi is highly likely to remain in office but uncertainty over other personnel – and future national policy – will be substantial. Next year China’s policy trajectory will become clearer. But global investors should avoid mistaking temporary improvements for a change of Xi’s strategy or China’s grand strategy. Beijing is driven by instability and insecurity to challenge the US-led world order. The result will be continued economic divorce and potentially military conflicts in the coming decade. Russia’s reversion to autocracy led to falling productivity and poor equity returns. China is also reverting to autocratic government as a solution to its domestic challenges. Western investors should limit long-term exposure to China and prefer markets that benefit from China’s recovery, such as in Southeast Asia and Latin America.
Image
Bottom Line: The geopolitical risk premium in Chinese equities will stay high in 2022, fall in 2023, but then rise again as global investors learn that China in the Xi Jinping era is fundamentally unstable and insecure. Feature Chart 1Market Cheers China's Hints At Policy Easing
Market Cheers China's Hints At Policy Easing
Market Cheers China's Hints At Policy Easing
In 1957, after nearly a decade at the helm of the People’s Republic of China, Chairman Mao Zedong initiated the “Hundred Flowers Campaign.” The campaign allowed a degree of political freedom to try to encourage new ideas and debate among China’s intellectuals. The country’s innovative forces had suffered from decades of foreign invasion, civil war, and repression. Within three years, Mao reversed course, reimposed ideological discipline, and punished those who had criticized the party. It turned out that the new communist regime could not maintain political control while allowing liberalization in the social and economic spheres.1 This episode is useful to bear in mind in 2022 as General Secretary Xi Jinping restores autocratic government in China. In the coming year, Xi will ease a range of policies to promote economic growth and innovation. Already his administration is relaxing some regulatory pressure on Big Tech. Global financial markets are cheering this apparent policy improvement (Chart 1). In effect, Xi is preparing to let 100 flowers bloom. However, China’s economic trajectory remains gloomy over the long run – not least because the US and China lack a strategic basis for re-engagement. Chinese Leaders Fear Foreign Encroachments Mao’s predicament was not only one of ideology and historical circumstance. It was also one of China’s geopolitics. Chinese governments have always struggled to establish domestic control, extend that control over far-flung buffer territories, and impose limits on foreign encroachments. Mao reversed his brief attempt at liberalization because he could not feel secure in his person or his regime. In 1959, the Chinese economy remained backward. The state faced challenges in administration and in buffer spaces like Tibet and Taiwan. The American military loomed large, despite the stalemate and ceasefire on the Korean peninsula in 1952. Russia was turning against Stalinism, while Hungary was revolting against the Soviet Union. Mao feared that the free exchange of ideas would do more to undermine national unity than it would to promote industrialization and technological progress. The 100 flowers that bloomed – intellectuals criticizing government policy – revealed themselves to be insufficiently loyal. They could be culled, strengthening the regime. However, what followed was a failed economic program and nationwide famine. Fast forward to today, when circumstances have changed but the Chinese state faces the same geopolitical insecurities. Xi Jinping, like all Chinese rulers, is struggling to maintain domestic stability and territorial integrity while regulating foreign influence. Although the People’s Republic is not as vulnerable as it was in Mao’s time, it is increasingly vulnerable – namely, to a historic downshift in potential economic growth and a rise in international tensions (Chart 2). The Xi administration has repeatedly shown that it views the US alliance system, US-led global monetary and financial system, and western liberal ideology as threats that need to be counteracted. Chart 2China: Less Stable, Less Secure
China: Less Stable, Less Secure
China: Less Stable, Less Secure
In addition, Russia’s difficulties invading Ukraine suggest that China faces an enormous challenge in attempting to carve out its own sphere of influence without shattering its economic stability. Hence Beijing needs to slow the pace of confrontation with the West while pursuing the same strategic aims. Xi Stays, But Policy Uncertainty Still High In 2022 2022 is a critical political juncture for China. Xi was supposed to step down and hand the baton to a successor chosen by his predecessor Hu Jintao. Instead he has spent the past decade arranging to remain in power until at least 2032. He took a big stride toward this goal at the nineteenth national party congress in 2017, when he assumed the title of “core leader” of the Communist Party and removed term limits from its constitution. This year’s Omicron outbreak and abrupt economic slowdown have raised speculation about whether Xi’s position is secure. Some of this speculation is wild – but China is far less stable than it appears. Structurally, inequality is high, social mobility is low, and growth is slowing, forcing the new middle class to compromise its aspirations. Cyclically, unemployment is rising and the Misery Index is higher than it appears if one focuses on youth employment and fuel inflation (Chart 3). The risk of sociopolitical upheaval is underrated among global investors. Chart 3AStructurally China Is Vulnerable To Social Unrest
Will China Let 100 Flowers Bloom? Only Briefly.
Will China Let 100 Flowers Bloom? Only Briefly.
Chart 3BCyclically China Is Vulnerable To Social Unrest
Cyclically China Is Vulnerable To Social Unrest
Cyclically China Is Vulnerable To Social Unrest
Yet even assuming that social unrest and political dissent flare up, Xi is highly likely to clinch another five-to-ten years in power. Consider the following points: The top leaders control personnel decisions. The national party congress is often called an “election,” but that is a misnomer. The Communist Party’s top posts will be ratified, not elected. The Politburo and Politburo Standing Committee select the members of the Central Committee; the national party congress convenes to ratify these new members. The Central Committee then ratifies the line-up of the new Politburo and Politburo Standing Committee, which is orchestrated by Xi along with the existing Politburo Standing Committee (Diagram 1). Xi is the most important figure in deciding the new leadership. Diagram 1Mechanics Of The Chinese Communist Party’s National Congress
Will China Let 100 Flowers Bloom? Only Briefly.
Will China Let 100 Flowers Bloom? Only Briefly.
There is no history of surprise votes. The party congress ratifies approximately 90% of the candidates put forward. Outcomes closely conform to predictions of external analysts, meaning that the leadership selection is not a spontaneous, grassroots process but rather a mechanical, elite-driven process with minimal influence from low-level party members, not to mention the population at large.2 The party and state control the levers of power: The Communist Party has control over the military, state bureaucracy, and “commanding heights” of the economy. This includes domestic security forces, energy, communications, transportation, and the financial system. Whoever controls the Communist Party and central government exerts heavy influence over provincial governments and non-government institutions. The state bureaucracy is not in a position to oppose the party leadership. Xi has conducted a decade-long political purge (“anti-corruption campaign”). Upon coming to power in 2012, Xi initiated a neo-Maoist campaign to re-centralize power in his own person, in the Communist Party, and in the central government. He has purged foreign influence along with rivals in the party, state, military, business, civil society, and Big Tech. He personally controls the military, the police, the paramilitary forces, the intelligence and security agencies, and the top Communist Party organs. There may be opposition but it is not organized or capable. Chart 4China: Big Tech Gets Relief ... For Now
China: Big Tech Gets Relief ... For Now
China: Big Tech Gets Relief ... For Now
There are no serious alternatives to Xi’s leadership. Xi is widely recognized within China as the “core” of the fifth generation of Chinese leaders. The other leaders and their factions have been repressed. Xi imprisoned his top rivals, Bo Xilai and Zhou Yongkang, a decade ago. He has since neutralized their followers and the factions of previous leaders Hu Jintao and Jiang Zemin. Premier Li Keqiang has never exercised any influence and will retire at the end of this year. None of the ousted figures have reemerged to challenge Xi, but potential rivals have been imprisoned or disciplined, as have prominent figures that pose no direct political threat, such as tech entrepreneur Jack Ma (Chart 4). Additional high-level sackings are likely before the party congress. China’s reversion to autocracy grew from Communist Party elites, not Xi alone. China’s slowing potential GDP growth and changing economic model raise an existential threat to the Communist Party over the long run. The party recognized its potential loss of legitimacy back in 2012, the year Xi was slated to take the helm. The solution was to concentrate power in the center, promoting Maoist nostalgia and strongman rule. In essence, the party needed a new Mao; Xi was all too willing to play the part. Hence Xi’s current position does not rest on his personal maneuvers alone. The party has invested heavily in Xi and will continue to do so. Characteristics of the political elite underpin the autocratic shift. Statistics on the evolving character traits of Politburo members show the trend toward leaders that are more rural, more bureaucratic, and more ideologically orthodox, i.e. more nationalist and communist (Chart 5). This trend underpins the party’s behavior and Xi’s personal rule. Chart 5China: From Technocracy To Autocracy
Will China Let 100 Flowers Bloom? Only Briefly.
Will China Let 100 Flowers Bloom? Only Briefly.
Chart 6China: De-Industrialization Undermines Stability
China: De-Industrialization Undermines Stability
China: De-Industrialization Undermines Stability
Xi has guarded his left flank. By cornering the hard left of the political spectrum Xi has positioned himself as the champion of poor people, workers, farmers, soldiers, and common folk. This is the political base of the Communist Party, as opposed to the rich coastal elites and westernizing capitalists, who stand to suffer from Xi’s policies. Ultimately de-industrialization – e.g. the sharp decline in manufacturing and construction sectors (Chart 6) – poses a major challenge to this narrative. But social unrest will be repressed and will not overturn Xi or the regime anytime soon. Xi still retains political capital. After centuries of instability, Chinese households are averse to upheaval, civil war, and chaos. They support the current regime because it has stabilized China and made it prosperous. Of course, relative to the Hu Jintao era, Xi’s policies have produced slower growth and productivity and a tarnished international image (Chart 7). But they have not yet led to massive instability that would alienate the people in general. If Chinese citizens look abroad, they see that Xi has already outlasted US Presidents Obama and Trump, is likely to outlast Biden, and that US politics are in turmoil. The same goes for Europe, Japan, and Russia – Xi’s leadership does not suffer by comparison. Chart 7China’s Declining International Image
Will China Let 100 Flowers Bloom? Only Briefly.
Will China Let 100 Flowers Bloom? Only Briefly.
External actors are neither willing nor able to topple Xi. Any outside attempt to interfere with China’s leadership or political system would be unwarranted and would provoke an aggressive response. The US is internally divided and has not developed a consistent China policy. This year the Biden administration has its hands full with midterm elections, Russia, and Iran, where it must also accept the current leadership as a fact of life. It has no ability to prevent Xi’s power consolidation, though it will impose punitive economic measures. Japan and other US allies have an interest in undermining Xi’s administration, but they follow the US’s lead in foreign policy. They also lack influence over the political rotation within the Communist Party. The Europeans will keep their distance but will not try to antagonize China given their more pressing conflict with Russia. Russia needs China more than ever and will lend material support in the form of cheaper and more secure natural resources. North Korean and Iranian nuclear provocations will help Xi stay under the radar. There is no reason to expect a new leader to take over in China. The Xi administration’s strategy, revealed over the past ten years, will remain intact for another five-to-ten years at least. The real question at the party congress is whether Xi will be forced to name a successor or compromise with the opposing faction on the personnel of the Politburo and Politburo Standing Committee. But even that remains to be seen – and either way he will remain the paramount leader. Bottom Line: Xi Jinping has the political capability to cement another five-to-ten years in power. Opposing factions have been weakened over the past decade by Xi’s domestic political purge and clash with the United States. China is ripe for social unrest and political dissent but these will be repressed as China goes further down the path of autocracy. Foreign powers have little influence over the process. Policy Uncertainty Falls In 2023 … Only To Rise Again What will Xi Jinping do once he consolidates power? Xi’s administration has weighed heavily on China’s economy, foreign relations, and financial markets. The situation has worsened dramatically this year as the economy struggles with “A Trifecta Of Economic Woes” – namely a rampant pandemic, waning demand for exports, and a faltering housing market (Chart 8). In response the administration is now easing a range of policies to stabilize expectations and try to meet the 5.5% annual growth target. The money impulse, and potentially the credit impulse, is turning less negative, heralding an eventual upturn in industrial activity and import volumes in 2023. These measures will give a boost to Chinese and global growth, although stimulus measures are losing effectiveness over time (Chart 9). Chart 8China's Trifecta Of Economic Woes
China's Trifecta Of Economic Woes
China's Trifecta Of Economic Woes
Chart 9More Stimulus, But Less Effectiveness
More Stimulus, But Less Effectiveness
More Stimulus, But Less Effectiveness
This pro-growth policy pivot will continue through the year and into next year. After all, if Xi is going to stay in power, he does not want to bequeath himself a financial crisis or recession at the start of his third term. Still, investors should treat any rally in Chinese equity markets with skepticism. First, political risk and uncertainty will remain elevated until Xi completes his power grab, as China is highly susceptible to surprises and negative political incidents this year (Chart 10). For example, if social unrest emerges and is repressed, then the West will impose sanctions. If China increases its support of Russia, Iran, or North Korea, then the US will impose sanctions. Chart 10China: Policy Uncertainty And Geopolitical Risk To Stay High In 2022, Might Improve In 2023
China: Policy Uncertainty And Geopolitical Risk To Stay High In 2022, Might Improve In 2023
China: Policy Uncertainty And Geopolitical Risk To Stay High In 2022, Might Improve In 2023
Chart 11China Needs To Court Europe
China Needs To Court Europe
China Needs To Court Europe
The regime will be extremely vigilant and overreact to any threats this year, real or perceived. Political objectives will remain paramount, above the economy and financial markets, and that means new economic policy initiatives will not be reliable. Investors cannot be confident about the country’s policy direction until the leadership rotation is complete and new policy guidance is revealed, particularly in December 2022 and March 2023. Second, after consolidating power, investors should interpret Xi’s policy shift as “letting 100 flowers bloom,” i.e., a temporary relaxation that aims to reboot the economy but does not change the country’s long-term policy trajectory. Economic reopening is inevitable after the pandemic response is downgraded – which is a political determination. Xi will also be forced to reduce foreign tensions for the sake of the economy, particularly by courting Europe, which is three times larger than Russia as a market (Chart 11). However, China’s declining labor force and high debt levels prevent its periodic credit stimulus from generating as much economic output as in the past. And the administration will not ultimately pursue liberal structural reforms and a more open economy. That is the path toward foreign encroachment – and regime insecurity. The US’s sanctions on Russia have shown the consequences of deep dependency on the West. China will continue diversifying away from the US. And, as we will see, the US cannot provide credible promises that it will reduce tensions. US-China: Re-Engagement Will Fail The Biden administration is focused on fighting inflation ahead of the midterm elections. But its confrontation with Russia – and likely failure to freeze Iran’s nuclear program – increases rather than decreases oil supply constraints. Hence some administration officials and outside observers argue that the administration should pursue a strategic re-engagement with China.3 Theoretically a US-China détente would buy both countries time to deal with their domestic politics by providing some international stability. Improved US-China relations could also isolate Russia and hasten a resolution to the war in Ukraine, potentially reducing commodity price pressures. In essence, a US-China détente would reprise President Richard Nixon’s outreach to China in 1972, benefiting both countries at the expense of Russia.4 This kind of Kissinger 2.0 maneuver could happen but there are good reasons to think it will not, or if it does that it will fall apart in one or two years. In 1972, China had nowhere near the capacity to deny the US access to the Asia Pacific region, expel US influence from neighboring countries, reconquer Taiwan, or project power elsewhere. Today, China is increasingly gaining these abilities. In fact it is the only power in the world capable of rivaling the US in both economic and military terms over the long run (Chart 12). Secretary of State Antony Blinken recently outlined the Biden administration’s China policy and declared that China poses “the most serious long-term challenge” to the US despite Russian aggression.5 Chart 12US-China Competition Sows Distrust, Drives Economic Divorce
Will China Let 100 Flowers Bloom? Only Briefly.
Will China Let 100 Flowers Bloom? Only Briefly.
While another decade of US engagement with China would benefit the US economy, it would be far more beneficial to China. Crucially, it would be beneficial in a strategic sense, not just an economic one. It could provide just the room for maneuver that China needs – at this critical juncture in its development – to achieve technological and productivity breakthroughs and escape the middle-income trap. Another ten-year reprieve from direct American competition would set China up to challenge the US on the global stage. That would be far too high of a strategic price for America to pay for a ceasefire in Ukraine. Ukraine has limited strategic value for the US and it does not steer US grand strategy, which aims to prevent regional empires from taking shape. In fact Washington is deliberately escalating and prolonging the war in Ukraine to drain Russia’s resources. Ending the war would do Russia a strategic favor, while re-engaging with China would do China a strategic favor. So why would the defense and intelligence community advise the Biden administration to pursue Kissinger 2.0? Chart 13US Unlikely To Revoke Trump Tariffs
US Unlikely To Revoke Trump Tariffs
US Unlikely To Revoke Trump Tariffs
Biden could still pursue some degree of détente with China, namely by repealing President Trump’s trade tariffs, in order to relieve price pressures ahead of the midterm election. Yet even here the case is deeply flawed. Trump’s tariffs on China did not trigger the current inflationary bout. That was the combined Trump-Biden fiscal stimulus and Covid-era supply constraints. US import prices are rising faster from the rest of the world than they are from China (Chart 13). Tariff relief would not change China’s Zero Covid policy, which is the current driver of price spikes from China. And while lifting tariffs on China would not reduce inflation enough to attract voters, it would cost Biden some political credit among voters in swing states like Pennsylvania, and across the US, where China’s image has plummeted in the wake of Covid-19 (Chart 14). Chart 14US Political Consensus Remains Hawkish On China
Will China Let 100 Flowers Bloom? Only Briefly.
Will China Let 100 Flowers Bloom? Only Briefly.
If Biden did pursue détente, would China be able to reciprocate and offer trade concessions? Xi has the authority to do so but he is unlikely to make major trade concessions prior to the party congress. Economic self-sufficiency and resistance to American pressure have become pillars of his support. Promises will not ease inflation for US voters in November and Xi has no incentive to make binding concessions because the next US administration could intensify the trade war regardless. Bottom Line: The US has no long-term interest, and a limited short-term interest, in easing pressure on China’s economy. Continued US pressure, combined with China’s internal difficulties, will reinforce Xi Jinping’s shift toward nationalism and hawkish foreign policy. Hence there is little basis for a substantial US-China re-engagement that improves the global macroeconomic environment over the coming years. Investment Takeaways Chart 15Autocracy Hurts Productivity
Autocracy Hurts Productivity
Autocracy Hurts Productivity
Xi Jinping will clinch another five-to-ten years in power this fall. To stabilize the economy, he will “let 100 flowers bloom” and ease monetary, fiscal, regulatory, and social policy at home. He will also court the West, especially Europe, for the sake of economic growth. However, he will not go so far as to compromise his ultimate aims: self-sufficiency at home and a sphere of influence abroad. The result will be a relapse into conflict with the West within a year or two. Ultimately a closed Chinese economy in conflict with the West will result in lower productivity, a weaker currency, a high geopolitical risk premium, and low equity returns – just as it did for Russia (Chart 15). Any short-term improvement in China’s low equity multiples will ultimately be capped. Over the long run, western investors should hedge against Chinese geopolitical risk by preferring markets that benefit from China’s periodic stimulus yet do not suffer from the break-up of the US-China and EU-Russia economic relationships, such as key markets in Latin America and Southeast Asia (Charts 16 & 17). Chart 16China Stimulus Creates Opportunity For … Latin America
China Stimulus Creates Opportunity For ... Latin America
China Stimulus Creates Opportunity For ... Latin America
Chart 17China Stimulus Creates Opportunity For … Southeast Asia
China Stimulus Creates Opportunity For ... Southeast Asia
China Stimulus Creates Opportunity For ... Southeast Asia
Matt Gertken Chief Geopolitical Strategist mattg@bcaresearch.com Footnotes 1 Modern scholarship has shown that Mao intended to entrap the opposition through the 100 Flowers Campaign. For a harrowing account of this episode, see Jung Chang and Jon Halliday, Mao: The Unknown Story (New York: Anchor Books, 2006), pp. 409-17. 2 “At least 8% of CPC Central Committee nominees voted off,” Xinhua, October 24, 2017, english.www.gov.cn. 3 Christopher Condon, “Yellen Says Biden Team Is Looking To ‘Reconfigure’ China Tariffs,” June 8, 2022, www.bloomberg.com. 4 Niall Ferguson, “Dust Off That Dirty Word Détente And Engage With China,” Bloomberg, June 5, 2022, www.bloomberg.com. 5 See Antony J Blinken, Secretary of State, “The Administration’s Approach to the People’s Republic of China,” George Washington University, Washington D.C., May 26, 2022, state.gov. Additionally, see President Joe Biden’s third assertion of US willingness to defend Taiwan against China, in a joint press conference with Japan’s Prime Minister Kishida Fumio, “Remarks by President Biden and Prime Minister Kishida Fumio of Japan in Joint Press Conference,” Akasaka Palace, Tokyo, Japan, May 23, 2022, whitehouse.gov.
Chinese credit data for May surprised to the upside. New total social financing rebounded to RMB 2.79 trillion from 0.91 trillion in April. Similarly, loans extended by banks nearly tripled to 1.89 trillion. However, these latest credit figures do not…
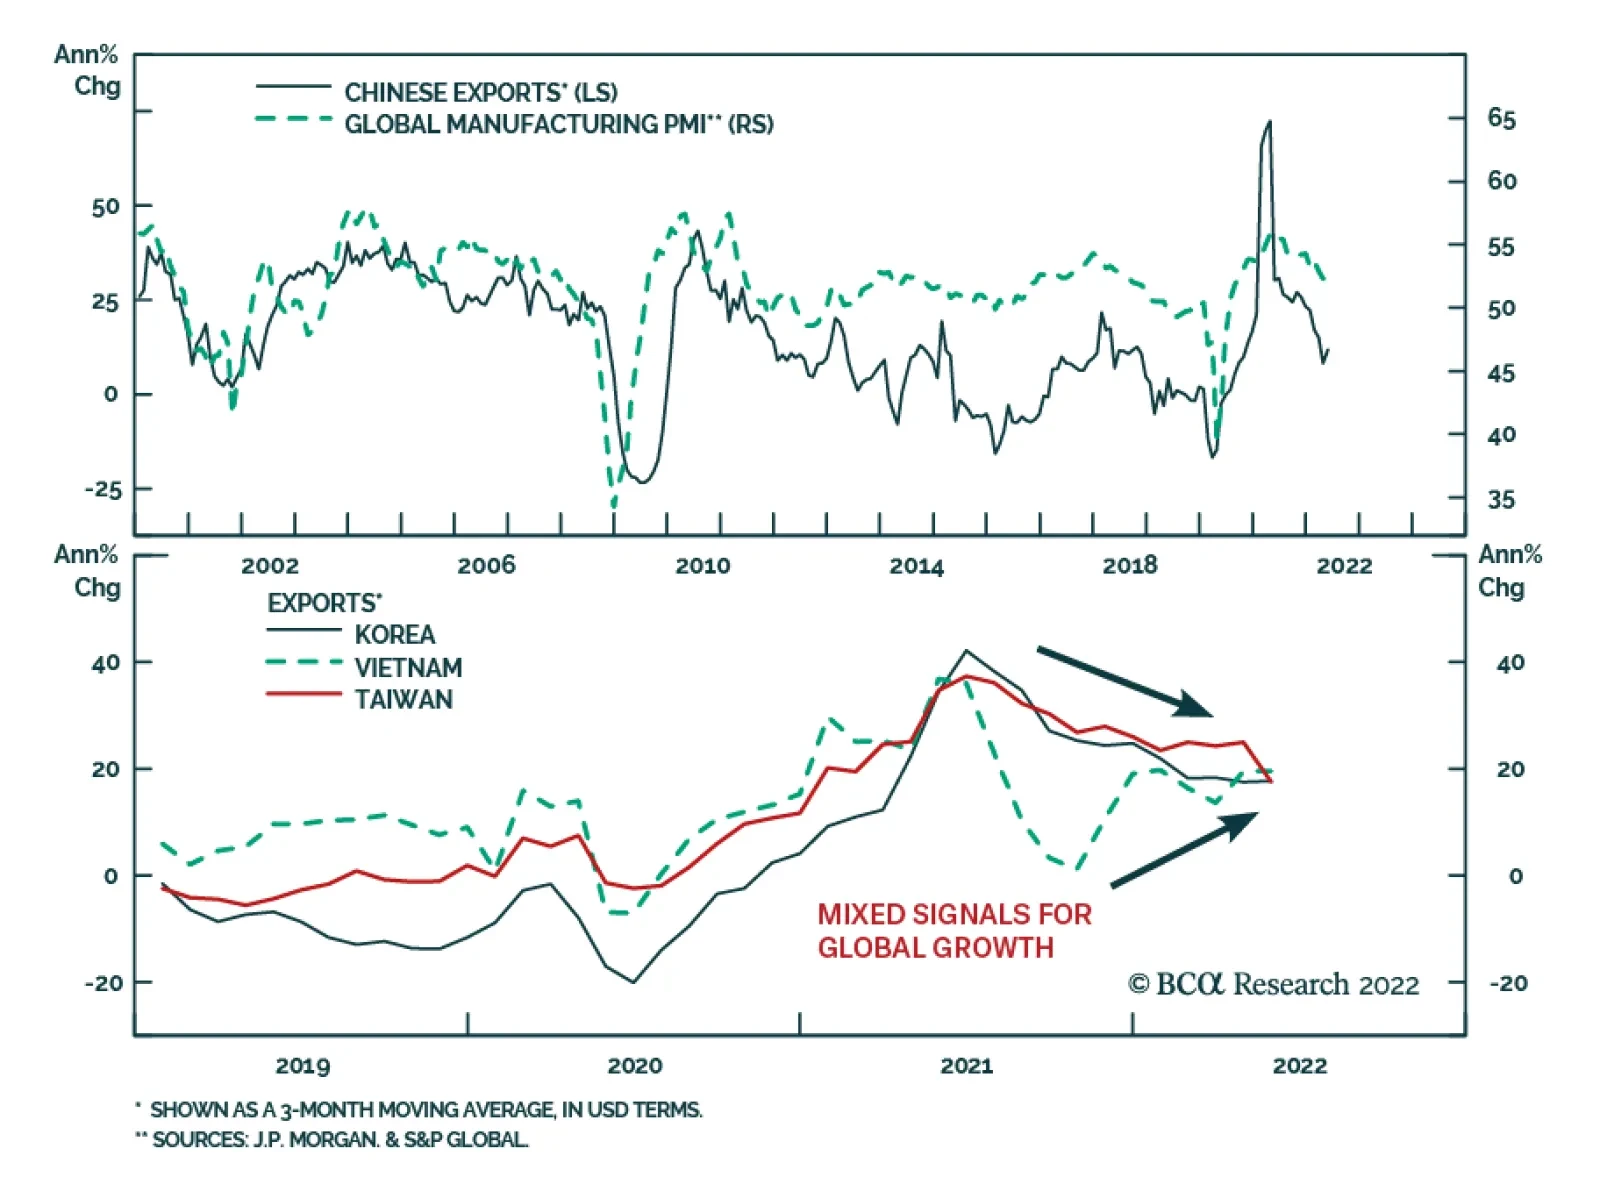
Chinese exports rebounded in May, surging by 16.9% y/y in dollar terms following 3.9% in the previous month. Imports also firmed 4.1% year-on-year after being flat in April. Both export and import growth surpassed market expectations of 8.0% and 2.8%…