Emerging Markets

Executive Summary Natural Gas Markets Eerily Quiet
Natgas Markets: The Eye Of The Storm
Natgas Markets: The Eye Of The Storm
An eerie calm in European natural gas markets belies the state of war in Ukraine that already is producing a cutoff of Russian natgas supplies in retaliation for the EU’s oil embargo. Such cutoffs will accelerate, and send natgas prices in Europe and Asia sharply higher if they occur sooner – as we expect – rather than later. The US will continue to send most of its LNG exports to Europe. These exports are expected to average 12 Bcf/d this year, up 22% from last year’s level. Planners in Europe and Asia will want to secure as much natgas supply as possible by the end of October to refill storage for the November-March withdrawal season, which is beginning to look like another La Niña winter. The US Climate Prediction Center makes the odds of such an event, which is associated with colder-than-normal winters in the Northern Hemisphere, just over 60%. Bottom Line: European governments are preparing their citizens for natgas rationing, in the event of a cutoff of Russian gas. This will occur sooner rather than later. In its wake, EU GDP will fall, and inflation will rise as knock-on effects constrict base metals, fertilizer and food supplies. At tonight’s close, we will be getting long 1Q23 TTF futures on the ICE, expecting prices to again exceed €225/MWh. Feature Related Report Commodity & Energy StrategyHigher Gasoline, Diesel Prices Ahead Russia is at war with Ukraine. NATO military support for Ukraine – with the EU at the forefront – is being maintained at a high level, and Ukrainian forces are vigorously defending their homeland.1 The EU embargoed Russian oil imports to sharply reduce funding for Russia’s war machine. Russia will be compelled to follow through on its threat to cut off pipeline gas shipments to Europe, following the embargo.2 It is highly doubtful Russia will countenance the timetable envisioned in the EU embargo, which calls for a phase-out of oil imports by yearend that removes close to 3mm b/d, or 90% of Russia’s sales into its largest market (Chart 1). Equally doubtful is the notion the EU will countenance funding Russia’s war on Ukraine over the course of such a phase-out. Our colleague Matt Gertken, who runs BCA’s Geopolitical Strategy, demonstrated that while such a phase-out schedule may be optimal for both sides – i.e., it prolongs revenue flows to Russia and gas flows to the EU – it almost surely is not an equilibrium.3 An equilibrium in this prisoners’ dilemma obtains when both sides act immediately to end their vulnerability to the other unilaterally upsetting the optimal state – i.e., endure short-term pain for long-term gain (Diagram 1). For this reason, we believe Russia’s cutoff of natgas shipments to the EU will occur sooner rather than later, to inflict maximum pain on the EU going into the coming winter season. The EU knows this, and is preparing its citizens for rationing of natgas. Chart 1EU’s Russian Oil Embargo Cuts Sales By 90% By Year-end
Natgas Markets: The Eye Of The Storm
Natgas Markets: The Eye Of The Storm
Diagram 1The EU, Russia Prisoners’ Dilemma
Natgas Markets: The Eye Of The Storm
Natgas Markets: The Eye Of The Storm
Russian Natgas Cutoff To The EU Underway Russia already has begun reducing natural gas supplies to the EU (Chart 2). Russian gas flows to Finland, Poland, Bulgaria, Netherlands, and Denmark were embargoed after these states refused to pay for gas in rubles (Chart 3). Russia reduced gas shipments to Germany – albeit marginally – after Shell refused to pay for natgas supplied to Germany in rubles. While this only disrupted 1.3% of total natgas consumption in Germany, it showed Russia will quickly act against what it views as “unfriendly” customers.4 Ukraine was forced to shut a gas transit point through which 8% of total Russian gas flows reach Europe, after Russian occupying forces were found to be siphoning gas, according to Gas Transmission System Operator of Ukraine (GTSOU). As a result, gas flows from Russia have taken a further hit and have not recovered (Chart 4). EU member states whose supply of Russian gas has been disrupted will need to search for alternatives. Orsted, an energy company supplying natgas to Denmark, stated it will source gas from the EU market. Given supply constraints in Europe, an increase in the number of bids on the single EU market will raise the Dutch Title Transfer Facility (TTF), all else equal. Chart 2Russia Starts Cutting Gas Flows
Russia Starts Cutting Gas Flows
Russia Starts Cutting Gas Flows
Chart 3Russian Gas Flows To EU Falling Overall...
Russian Gas Flows To EU Falling Overall...
Russian Gas Flows To EU Falling Overall...
Chart 4...Particularly Via Ukraine
...Particularly Via Ukraine
...Particularly Via Ukraine
Higher TTF prices will direct gas flows from the US to Europe, reducing gas available for domestic consumption. LNG gas exports to Europe have maintained their upward trend since 2016 and were up by 87% (674 BCF) in 1Q22 vs the same period in 2019 (Chart 5). Chart 5US LNG Exports To Europe Surge
Natgas Markets: The Eye Of The Storm
Natgas Markets: The Eye Of The Storm
Simultaneously, the US witnessed its largest inventory withdrawal this winter in the last four years (Chart 6). Warmer-than-normal temperatures and drought conditions in the US also are increasing domestic demand, as electricity companies are forced to substitute hydroelectric power with natgas-fired generation. Increased exports and weather phenomena have combined to push the Henry Hub contract above $9.50/MMBtu this week, the highest level since 2008. Chart 6US Natgas Inventories Slowly Filling
Natgas Markets: The Eye Of The Storm
Natgas Markets: The Eye Of The Storm
US LNG Exports To Europe Surge Higher European prices for US natgas have disincentivized shipments to Asia, where prices – measured by the Japan Korea Marker (JKM) – have been trading below the TTF so far this year on average (Chart 7). This has allowed European gas inventories to refill at a rapid pace. As of 4 June, the EU’s working gas inventories were ~49% full and are above last year’s level for this time of the year (Chart 8). Chart 7Natural Gas Markets Eerily Quiet
Natgas Markets: The Eye Of The Storm
Natgas Markets: The Eye Of The Storm
Chart 8European Gas Storage Refill Off To A Good Start
Natgas Markets: The Eye Of The Storm
Natgas Markets: The Eye Of The Storm
Shanghai’s reopening will propel Chinese economic activity and demand for natgas, making an already tight global natural gas market tighter. However, the risk of rolling lockdowns in China will keep Asia’s LNG demand in check.5 LNG vessel charter rates have increased sharply since the Russia-Ukraine war began, largely on the back of European demand (Chart 9). We expect this to be a regular feature of the international gas market going forward, as more LNG export capacity is added in the US – it will rise to 12.6 Bcf/d next year, e.g. – and global demand remains strong. Chart 9Surge in LNG Charter Rates
Surge in LNG Charter Rates
Surge in LNG Charter Rates
Europe Is Critically Short LNG Infrastructure Most of the EU’s existing 158 Bcm of annual regasification capacity is located around the Iberian Peninsula (Chart 10), which is not well-connected to the rest of Europe. As a result, to substitute Russian piped gas for LNG imports, investments for import terminals and regasification capacity will be required. In its REPowerEU program the European Commission expects to move closer to complete independence from Russian fossil fuels by importing an additional 50 Bcm of LNG per year, reducing demand, and ramping up renewable energy. Germany is aiming for independence from Russian gas flows by planning a shoreside LNG terminal and ordering four Floating Storage and Regasification Units (FSRUs). The FSRUs, which are expected to come online between year-end and the start of next year will have a combined capacity under 24 Bcm per year. Chart 10Europe Needs More Re-Gasification Capacity
Natgas Markets: The Eye Of The Storm
Natgas Markets: The Eye Of The Storm
These plans, however, are not aligned with the nation’s pathway to go carbon neutral by 2045. An environmental activist group has filed a lawsuit to halt the construction of the LNG terminal. The group also is opposed to Germany’s draft LNG acceleration bill, which will allow imports until two years before 2045.6 This reflects two problems all EU nations will face as they transition to LNG from pipeline Russian gas imports. Firstly, member states will need to invest billions of euros in new LNG capacity, and given current politics, likely will have to decide to scrap or repurpose this infrastructure in during the transition to green energy. Opposing this possibility is the high likelihood that EU states will need to enter long-term LNG contracts to ensure supply security and shield themselves from volatile natgas prices. For the immediate future, the EU likely will kick this can down the road for as long as possible. Investment Implications Back in March, Germany and Austria began preparing their citizens for natgas rationing.7 Now the IEA is warning all of Europe the likelihood of such action is increasing rapidly.8 State and local planners throughout Europe will spend the next five months or so lining up as much LNG and pipeline gas as possible going into the coming winter season. While the inventory-injection in Europe is off to a good start, planners most likely hope to exceed their minimum target for filling 80% of storage in time for the November-March withdrawal season. In addition to the risk of a Russian cutoff of supplies, planners have to account for a higher likelihood of a colder-than-normal winter, given the odds of another La Niña winter, which is associated with colder-than-normal winters in the Northern Hemisphere. The US Climate Prediction Center makes the odds of such an event – the third such event in as many years – just over 60%. If European states are forced to implement rationing of natgas, knock-on effects resulting from prioritizing human needs over industrial concerns will, once again, restrict base metals, fertilizer and food supplies. We remain long energy, metals and grains exposure via the S&P GSCI and COMT ETF as the natural-gas drama in Europe plays out. In addition, we remain long the XOP, XME, PICK, and CRAK ETFs to maintain our equity exposure to industrial commodities. At tonight’s close, we will be getting tactically long 1Q22 futures on the ICE, expecting prices to again exceed €225/MWh. This will complement our existing tactical commodity exposures in 4Q22 TTF futures. Robert P. Ryan Chief Commodity & Energy Strategist rryan@bcaresearch.com Ashwin Shyam Research Analyst Commodity & Energy Strategy ashwin.shyam@bcaresearch.com Paula Struk Research Associate Commodity & Energy Strategy paula.struk@bcaresearch.com Commodities Round-Up Energy: Bullish US refined product demand rose just under 4% for the week ended 3 June 2022, led by a surge in jet-fuel demand of 26.5% yoy – finishing at 1.6mm b/d vs. 1.26mm b/d the year earlier, according to the US EIA. This provides further evidence consumer pent-up demand for travel is being released, after the long shut-downs in travel caused by COVID-19 beginning in 1Q20. The surge in jet-fuel demand was enough to offset yoy declines in gasoline and distillates such as diesel fuel and heating oil of 0.9% and 2.8%, respectively. Gasoline inventories were down 800k barrels yoy, which put them 10% below their five-year average level at the end of the reporting week. Distillate inventories rose 2.6mm barrels, but this still left them 23% below their five-year average. Crude oil inventories in the US including those in the Strategic Petroleum Reserve (SPR), which is being drawn down to provide charging stock to refiners, drew 7.3mm barrels, and stood at 519mm barrels. Versus year-ago levels, crude inventories including the SPR are down 17%. Base Metals: Bullish Copper production in Chile fell 9.8% yoy in April as state-owned copper giant Codelco’s monthly supply fell 6.1% yoy to 116,000 tons. In Peru, protests against mines by displaced communities have seen suspensions in copper mine production, including that of MMG-owned Las Bambas. Although the International Copper Study Group (ICSG) expects a physical surplus for refined copper markets next year, falling production in Chile and civil unrest in Peru continue to plague the rebuilding of stocks (Chart 11). Globally, a risk matrix we reproduced in a report last year showed that approximately 570 million Metric Tons of copper faced a significant ESG risk.9 This increases the risk of new copper projects being stymied by activist groups, and further curtailing future copper production. Precious Metals: Bullish According to data from World Gold Council, gold ETFs faced net outflows in May as the USD and interest rates strengthened, following the Fed rate hikes (Chart 12). In his speech, Fed Governor Christopher Waller explained that by increasing interest rates, the Fed aims to match labor demand to supply and reduce wage growth, which in turn will lower inflation.10 This, however, does not deal with high inflation via the mechanism of elevated food and fuel prices, which will remain high as long as supply disruptions continue in these markets. Chart 11
LME Copper Stocks Going Down
LME Copper Stocks Going Down
Chart 12
Natgas Markets: The Eye Of The Storm
Natgas Markets: The Eye Of The Storm
Footnotes 1 Please see The Institute For The Study Of War for daily updates of the Russia-Ukraine war. 2 Please see Higher Gasoline, Diesel Prices Ahead, which we published last week, for further discussion of the EU’s embargo of Russian oil imports. The EU embargo initially will be on Russian seaborne oil imports, which will tighten global crude oil and refined-product markets further. Pipeline imports are due to phase out by year-end. Cumulatively, this will translate to a 90% decrease in Russian crude and product exports to the EU, representing ~ 3mm b/d of lost sales. Our report is available at ces.bcaresearch.com. 3 Please see Energy Cutoff Continues (GeoRisk Update), published by BCA Research’s Geopolitical Strategy on June 1, 2022. It is available at gps.bcaresearch.com. 4 According to a recent report from Gemeinshcafts Diagnose institution prepared on behalf of Germany’s Federal Ministry of Economics and Climate Protection, if Russia embargos oil and gas to Germany immediately the German economy will fall into a sharp recession. The cumulative loss to macroeconomic output in 2022 and 2023 will amount to 220 billion euros, or more than 6.5% of annual economic output. 5 For more on the risk of rolling lockdowns in China, please see Not The Time To Be A Contrarian, published by BCA’s Emerging Markets Strategy on May 19, 2022. 6 Please see Germany’s Cabinet Moves to Head Off Lawsuits Against LNG Terminals, published by The Maritime Executive on May 11, 2022 7 Please see Germany Closer To Rationing Natgas, which we published on March 31, 2022. 8 Please see Europe at risk of winter energy rationing, energy watchdog warns, published by ft.com on June 8, 2022. 9 Please see Renewables ESG Risk Grows With Demand, which we published on April 29, 2022 10 For the speech, please see Responding to High Inflation with Some Thoughts on a Soft Landing. Investment Views and Themes Recommendations Strategic Recommendations Tactical Trades Trades Closed in 2022
Executive Summary The Efficient Market Hypothesis (EMH) is flawed. This Holy Grail of financial economics assumes that investors are a homogenous bunch with identical investment horizons, when the reality is that investors have a wide spectrum of time horizons. The alternative but less well-known Fractal Market Hypothesis (FMH) recognizes that investors with different time horizons interpret the same facts and information differently. The key conclusion of the FMH is that when the different investment horizons are all active in the market, the price reflects all available information, meaning that the market is efficient, liquid, and stable. But when the different investment horizons start to converge and coalesce, the market becomes inefficient, illiquid, and vulnerable to a trend reversal. Using the FMH over the past six months, 5 structured recommendations were closed in profit: Short ILS/GBP, Short Coffee versus Cocoa, Short World Basic Resources versus Market, Long EUR/CHF, and Short Semiconductors versus Tech. Against this, 3 structured recommendations were closed in loss: Short Nickel versus Silver, Long Polish Bonds versus US Bonds, and Short World Semiconductors versus Biotech. Within the 10 open trades, 3 are in healthy profit, 4 are flat, and 3 are in loss. The Efficient Market Hypothesis Does Not Describe The Truth; The Fractal Market Hypothesis Does
Fractal Trading Update - June 2022
Fractal Trading Update - June 2022
Bottom Line: As few investors are aware of the Fractal Market Hypothesis, it gives a competitive advantage to those that use it to identify potential trend reversals. Feature For nations and societies, disagreement and conflict are unhealthy. But for financial markets, the opposite is true – it is the lack of disagreement and conflict that is unhealthy. This is because the market needs disagreement to generate liquidity, the ability to trade quickly and in large volume without destabilizing the market price. If I want to buy a share, then somebody must sell me that share. It follows that I and the seller must disagree about the attractiveness of the share at the current price. Likewise, if I and like-minded individuals want to buy ten million shares, it follows that lots of market participants must disagree with us. If lots of market participants do not disagree with us, there will be insufficient liquidity to complete the transaction without a price change. And if too many people are engaged in groupthink, the price change could be extreme. Markets Become Inefficient When There Is Not Enough Disagreement How can there be major disagreement about the attractiveness of an investment when we all have access to the same facts and information? According to the Efficient Market Hypothesis (EMH) there cannot be, because asset prices always reflect all available information.1 Unfortunately, the Efficient Market Hypothesis is flawed. This Holy Grail of financial economics assumes that investors are a homogenous bunch with identical investment horizons, when the reality is that investors have a wide spectrum of time horizons – ranging from the milliseconds of momentum-driven high-frequency trading (HFT) to the decades of a value-driven pension fund. The market is efficient only when a wide spectrum of investment horizons is setting the price, signified by the market having a rich fractal structure. The alternative but less well-known Fractal Market Hypothesis (FMH) recognizes the reality of different time horizons. Crucially, the FMH acknowledges that investors with different time horizons interpret the same facts and information differently. In other words, they disagree (Box I-1). Box 1-1The Efficient Market Hypothesis Does Not Describe The Truth; The Fractal Market Hypothesis Does
Fractal Trading Update - June 2022
Fractal Trading Update - June 2022
For example, the momentum-based high frequency trader might interpret a sharp one-day sell-off as a sell signal, but the value-based pension fund might interpret the same information as a buying opportunity. This disagreement will create liquidity without requiring a big price adjustment. Thereby it also fosters market stability. The key conclusion of the Fractal Market Hypothesis is that when the different investment horizons are all active in the market, the price does reflect all available information, meaning that the market is efficient, liquid, and stable. But when the different investment horizons start to converge and coalesce, the market becomes inefficient, illiquid, and vulnerable to a trend reversal. Buy and sell orders will no longer match without a price change, possibly extreme. Can we measure the loss of efficiency in a specific investment, and thereby anticipate a potential trend reversal? The answer is yes, by monitoring its fractal dimension, using the expression in the Appendix. Although many readers may find the concept of a fractal dimension intimidating, the idea is simple and intuitive. It just measures the complexity – or information content – in an object or structure. Thereby, when an investment’s fractal dimension reaches its lower limit, it warns that the information content of longer-term investors is missing from the price. When the longer-term investors do ultimately re-enter the price setting process, the question is: will they endorse the recent trend because of some major change in the fundamentals – such as the start of the Russia/Ukraine war? Or will they reject it, as an unjustified deviation from a fundamental anchor. In most cases, it is the latter: a rejection and a trend reversal. As few investors are aware of the Fractal Market Hypothesis, it gives a competitive advantage to those that use it to identify potential trend reversals. Fractal Trading Update Using the Fractal Market Hypothesis over the past six months, 5 structured recommendations were closed in profit: Short ILS/GBP, Short Coffee versus Cocoa, Short World Basic Resources versus Market, Long EUR/CHF, and Short Semiconductors versus Tech. A fragile fractal structure warns of a crowded trade. One structured recommendation was closed flat: Short Personal Goods versus Consumer Services. Against this, 3 structured recommendations were closed in loss: Short Nickel versus Silver, Long Polish Bonds versus US Bonds, and Short World Semiconductors versus Biotech. Within the 10 open trades, 3 are in healthy profit, 4 are flat, and 3 are in loss. As for the unstructured recommendations, for which we do not define profit targets or expiry dates, we are pleased to report that out of 31 recommendations, only 2 failed to experience a countertrend reversal. Wins 1) November 18th: Short ILS/GBP Achieved its profit target of 4.2 percent. 2) November 25th: Short Coffee versus Cocoa (Chart I-1) Achieved almost half of its 30 percent profit target at expiry. Chart I-1Fractal Analysis Correctly Predicted A Reversal In Coffee Versus Cocoa
Fractal Analysis Correctly Predicted A Reversal In Coffee Versus Cocoa
Fractal Analysis Correctly Predicted A Reversal In Coffee Versus Cocoa
3) January 20th: Short World Semiconductors versus Tech (Chart I-2) Achieved its profit target of 6 percent. Chart I-2Fractal Analysis Correctly Predicted A Reversal In World Semiconductors Versus Technology
Fractal Analysis Correctly Predicted A Reversal In World Semiconductors Versus Technology
Fractal Analysis Correctly Predicted A Reversal In World Semiconductors Versus Technology
4) March 10th: Long EUR/CHF Achieved its profit target of 3.6 percent. 5) April 14th: Short World Basic Resources versus Market (Chart I-3) Achieved its profit target of 11.5 percent. Chart I-3Fractal Analysis Correctly Predicted A Reversal In World Basic Resources Versus Market
Fractal Analysis Correctly Predicted A Reversal In World Basic Resources Versus Market
Fractal Analysis Correctly Predicted A Reversal In World Basic Resources Versus Market
In addition, Short World Personal Goods versus Consumer Services which was opened on December 9th reached a high-water mark of 10.5 percent but expired flat. Losses 1) December 2nd: Short World Semiconductors versus Biotech Hit its stop loss of 9.5 percent. 2) January 13th: Long Poland versus US: 10-Year Government Bonds Reached a high-water mark of 3.7 percent, but then reversed to hit its stop loss of 8 percent. In the current geopolitical crisis, Poland has been a casualty due to its lengthy border with Ukraine. 3) February 3rd: Short Nickel versus Silver (Chart I-4) Hit its stop loss at 20 percent following an explosive short-squeeze rally in the Nickel price. Chart I-4Nickel's Short-Squeeze Rally Forced A Price Trend Prolongation
Nickel's Short-Squeeze Rally Forced A Price Trend Prolongation
Nickel's Short-Squeeze Rally Forced A Price Trend Prolongation
Open Trades 1) January 27th: Long MSCI Korea versus All-Country World (Chart I-5) Open, in profit, having reached a high-water mark of 6 percent (versus an 8 percent target). Chart I-5Fractal Analysis Correctly Predicted A Rebound In Korea Versus All-Country World
Fractal Analysis Correctly Predicted A Rebound In Korea Versus All-Country World
Fractal Analysis Correctly Predicted A Rebound In Korea Versus All-Country World
2) February 24th: Long US Biotech versus US Tech Open, in profit, having reached a high-water mark of 10.5 (versus a 17.5 percent target). 3) March 3rd: Short World Banks versus Consumer Services Reached a high-water mark of 7.3 percent (versus a 12 percent target), but then reversed and is in loss. 4) March 24th: Long 5-Year T-bond Open, in modest loss. 5) April 7th: Short World Non-Life Insurance versus Homebuilders (Chart I-6) Open, in profit having reached a high-water mark of 12.4 percent (versus a 14 percent target). Chart I-6Fractal Analysis Correctly Predicted A Reversal In World Non-Life Insurance Versus Homebuilders
Fractal Analysis Correctly Predicted A Reversal In World Non-Life Insurance Versus Homebuilders
Fractal Analysis Correctly Predicted A Reversal In World Non-Life Insurance Versus Homebuilders
6) April 7th: Long JPY/CHF Reached a high-water mark of 3.4 percent versus a 4 percent target, but then reversed into modest loss. This suggests that the trade needed a narrower profit target. 7) April 28th: Short High Dividend ETF versus US 10-Year T-bond Open, in modest loss, having reached a high-water mark of 2.9 percent (versus a 6 percent target). 8) May 19th: Short FTSE 100 versus STOXX Europe 600 Open, and flat. 9) June 2nd: Long JPY/USD (Chart I-7) Open, and flat. Chart I-7The Sell-Off In JPY/USD Has Reached A Potential Turning Point
The Sell-Off In JPY/USD Has Reached A Potential Turning Point
The Sell-Off In JPY/USD Has Reached A Potential Turning Point
10) June 2nd: Short Australia Basic Resources versus World Market (Chart I-8) Open, and flat. Chart I-8The Australian Basic Resources Sector Is Vulnerable To Reversal
The Australian Basic Resources Sector Is Vulnerable To Reversal
The Australian Basic Resources Sector Is Vulnerable To Reversal
Our full watchlist of 29 investments that are at, or approaching turning points, is available on our website: cpt.bcaresearch.com Appendix: Calculating The Fractal Dimension Of A Financial Market
Fractal Trading Update - June 2022
Fractal Trading Update - June 2022
Chart 1AUD/KRW Is Vulnerable To Reversal
AUD/KRW Is Vulnerable To Reversal
AUD/KRW Is Vulnerable To Reversal
Chart 2Canada Versus Japan Is Reversing
Canada Versus Japan Is Reversing
Canada Versus Japan Is Reversing
Chart 3Canada's TSX-60's Outperformance Might Be Over
Canada's TSX-60's Outperformance Might Be Over
Canada's TSX-60's Outperformance Might Be Over
Chart 4US Healthcare Providers Vs. Software At Risk of Reversal
US Healthcare Providers Vs. Software At Risk of Reversal
US Healthcare Providers Vs. Software At Risk of Reversal
Chart 5BRL/NZD At A Resistance Point
BRL/NZD At A Resistance Point
BRL/NZD At A Resistance Point
Chart 6Homebuilders Versus Healthcare Services Has Turned
Homebuilders Versus Healthcare Services Has Turned
Homebuilders Versus Healthcare Services Has Turned
Chart 7CNY/USD Has Reversed
CNY/USD Has Reversed
CNY/USD Has Reversed
Chart 8CAD/SEK Is Vulnerable To Reversal
CAD/SEK Reversal Has Started
CAD/SEK Reversal Has Started
Chart 9Financials Versus Industrials To Reverse
Financials Versus Industrials To Reverse
Financials Versus Industrials To Reverse
Chart 10The Outperformance Of Resources Versus Biotech Has Started To Reverse
The Outperformance Of Resources Versus Biotech Has Started To Reverse
The Outperformance Of Resources Versus Biotech Has Started To Reverse
Chart 11The Outperformance Of Resources Versus Healthcare Is Vulnerable To Reversal
The Outperformance Of Resources Versus Healthcare Is Vulnerable To Reversal
The Outperformance Of Resources Versus Healthcare Is Vulnerable To Reversal
Chart 12FTSE100 Outperformance Vs. Euro Stoxx 50 Is Reversing
FTSE100 Outperformance Vs. Euro Stoxx 50 Is Reversing
FTSE100 Outperformance Vs. Euro Stoxx 50 Is Reversing
Chart 13Netherlands Underperformance Vs. Switzerland Is Ending
Netherlands Underperformance Vs. Switzerland Has Been Exhausted
Netherlands Underperformance Vs. Switzerland Has Been Exhausted
Chart 14The Sell-Off In The 30-Year T-Bond Is Approaching Fractal Fragility
The Sell-Off In The 30-Year T-Bond Is Approaching Fractal Fragility
The Sell-Off In The 30-Year T-Bond Is Approaching Fractal Fragility
Chart 15The Sell-Off In The NASDAQ Is Approaching Fractal Fragility
The Sell-Off In The NASDAQ Is Approaching Fractal Fragility
The Sell-Off In The NASDAQ Is Approaching Fractal Fragility
Chart 16Food And Beverage Outperformance Exhausted
Food And Beverage Outperformance Has Been Exhausted
Food And Beverage Outperformance Has Been Exhausted
Chart 17The Strong Trend In The 18-Month-Out US Interest Rate Future Is Fragile
The Strong Trend In The 18-Month-Out US Interest Rate Future Is Fragile
The Strong Trend In The 18-Month-Out US Interest Rate Future Is Fragile
Chart 18The Strong Trend In The 3 Year T-Bond Is Fragile
The Strong Trend In The 3 Year T-Bond Is Fragile
The Strong Trend In The 3 Year T-Bond Is Fragile
Chart 19A Potential Switching Point From Tobacco Into Cannabis
A Potential Switching Point From Tobacco Into Cannabis
A Potential Switching Point From Tobacco Into Cannabis
Chart 20Biotech Is A Major Buy
Biotech Is A Major Buy
Biotech Is A Major Buy
Chart 21Norway's Outperformance Could End
Norway's Outperformance Could End
Norway's Outperformance Could End
Chart 22Cotton Versus Platinum Is Reversing
Cotton Versus Platinum Is Reversing
Cotton Versus Platinum Is Reversing
Chart 23Switzerland's Outperformance Vs. Germany Has Ended
Switzerland's Outperformance Vs. Germany Has Started To End
Switzerland's Outperformance Vs. Germany Has Started To End
Chart 24The Rally In USD/EUR Has Ended
The Rally In USD/EUR Has Ended
The Rally In USD/EUR Has Ended
Chart 25The Outperformance Of MSCI Hong Kong Versus China Is Vulnerable To Reversal
The Outperformance Of MSCI Hong Kong Versus China Is Vulnerable To Reversal
The Outperformance Of MSCI Hong Kong Versus China Is Vulnerable To Reversal
Chart 26A Potential New Entry Point Into Petcare
A Potential New Entry Point Into Petcare
A Potential New Entry Point Into Petcare
Chart 27Czech Outperformance Near Exhaustion
Czech Outperformance Near Exhaustion
Czech Outperformance Near Exhaustion
Chart 28US REITS Are Oversold Versus Utilities
US REITS Are Oversold Versus Utilities
US REITS Are Oversold Versus Utilities
Chart 29GBP/USD At A Turning Point
GBP/USD At A Turning Point
GBP/USD At A Turning Point
Dhaval Joshi Chief Strategist dhaval@bcaresearch.com Hadi Elzein Research Associate hadi.elzein@bcaresearch.com Footnotes 1 Strictly speaking, the EMH assumes there is some disagreement, but that this disagreement is random and follows a standard Gaussian (bell-curve) distribution. Therefore, the EMH assumes that a share price just follows a random walk until new (unpredictable) fundamental information arrives. Fractal Trades
Fractal Trading Update - June 2022
Fractal Trading Update - June 2022
6-Month Recommendations Structural Recommendations Closed Fractal Trades Indicators To Watch - Bond Yields Chart II-1Indicators To Watch - Bond Yields - Euro Area
Indicators To Watch - Bond Yields - Euro Area
Indicators To Watch - Bond Yields - Euro Area
Chart II-2Indicators To Watch - Bond Yields - Europe Ex Euro Area
Indicators To Watch - Bond Yields - Europe Ex Euro Area
Indicators To Watch - Bond Yields - Europe Ex Euro Area
Chart II-3Indicators To Watch - Bond Yields - Asia
Indicators To Watch - Bond Yields - Asia
Indicators To Watch - Bond Yields - Asia
Chart II-4Indicators To Watch - Bond Yields - Other Developed
Indicators To Watch - Bond Yields - Other Developed
Indicators To Watch - Bond Yields - Other Developed
Indicators To Watch - Interest Rate Expectations Chart II-5Indicators To Watch - Interest Rate Expectations
Indicators To Watch - Interest Rate Expectations
Indicators To Watch - Interest Rate Expectations
Chart II-6Indicators To Watch - Interest Rate Expectations
Indicators To Watch - Interest Rate Expectations
Indicators To Watch - Interest Rate Expectations
Chart II-7Indicators To Watch - Interest Rate Expectations
Indicators To Watch - Interest Rate Expectations
Indicators To Watch - Interest Rate Expectations
Chart II-8Indicators To Watch - Interest Rate Expectations
Indicators To Watch - Interest Rate Expectations
Indicators To Watch - Interest Rate Expectations
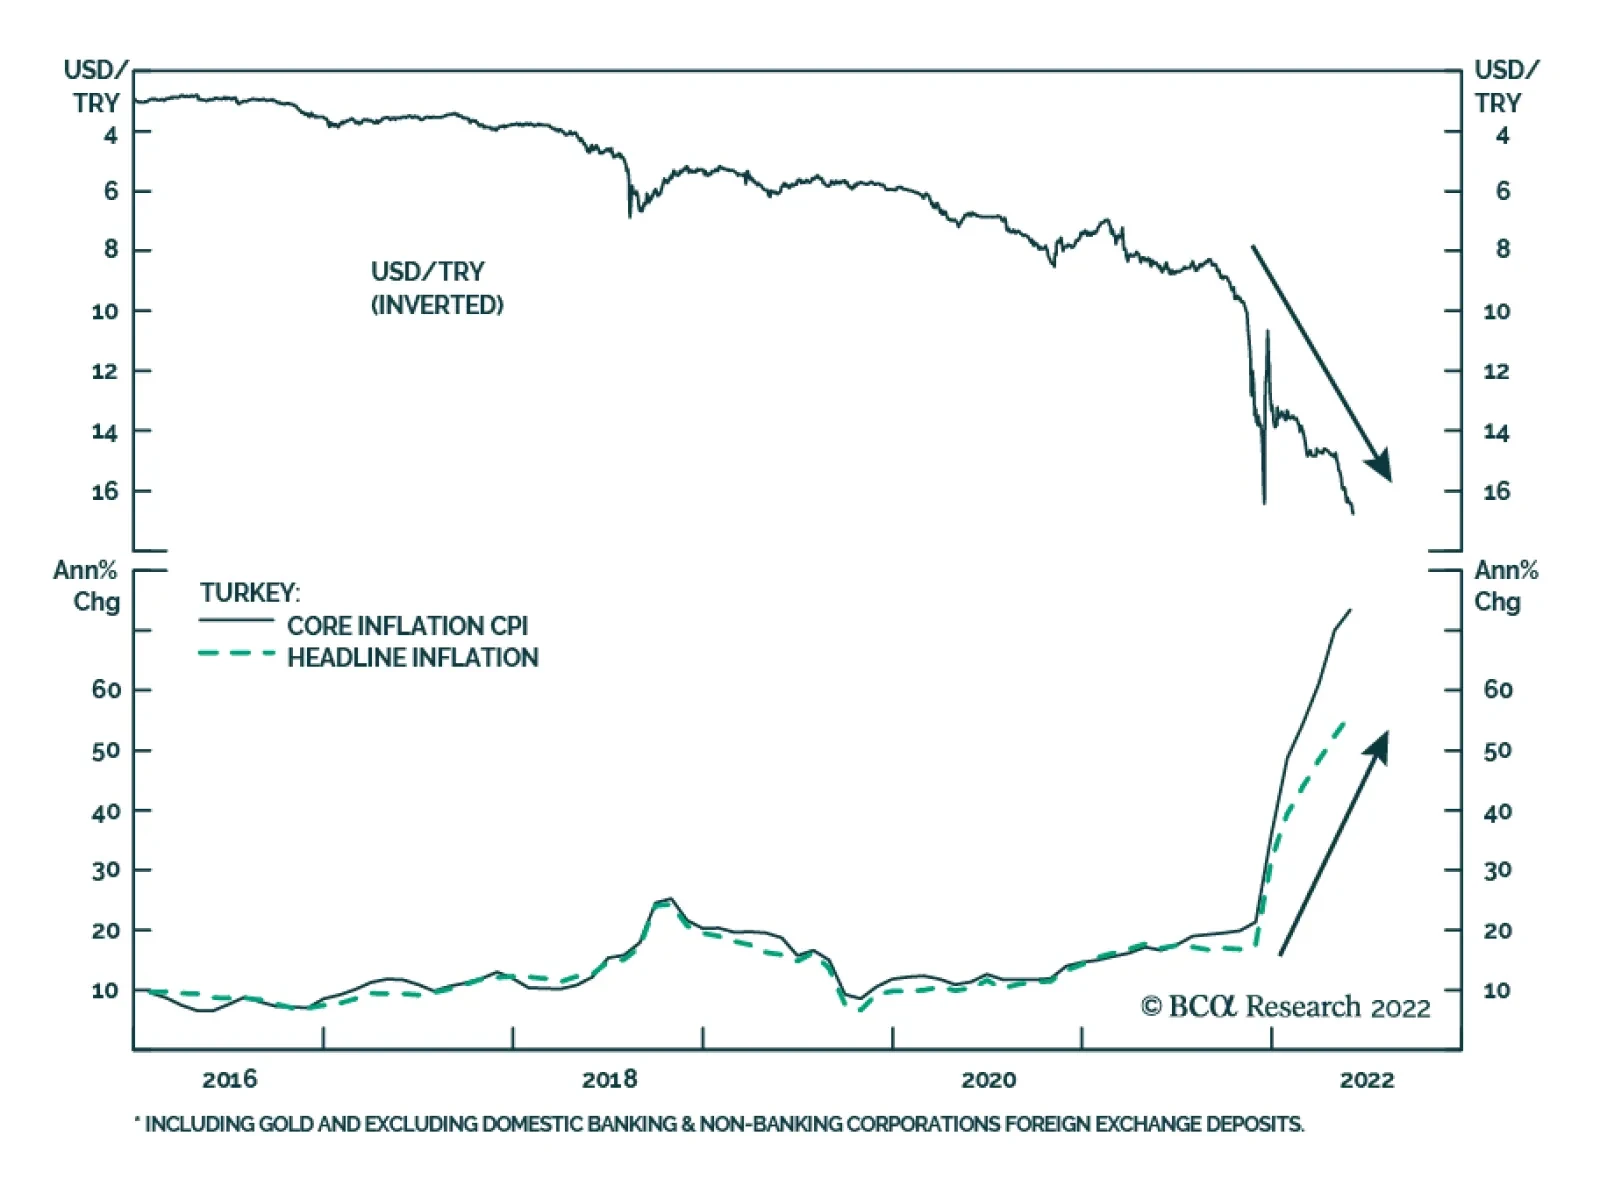
After a brief period of stability earlier this year, the Turkish lira has resumed its downtrend. The culprit behind this weakness is dovish monetary policy amid extreme inflationary pressures. Headline CPI inflation accelerated to 73.5% y/y in May, while the…
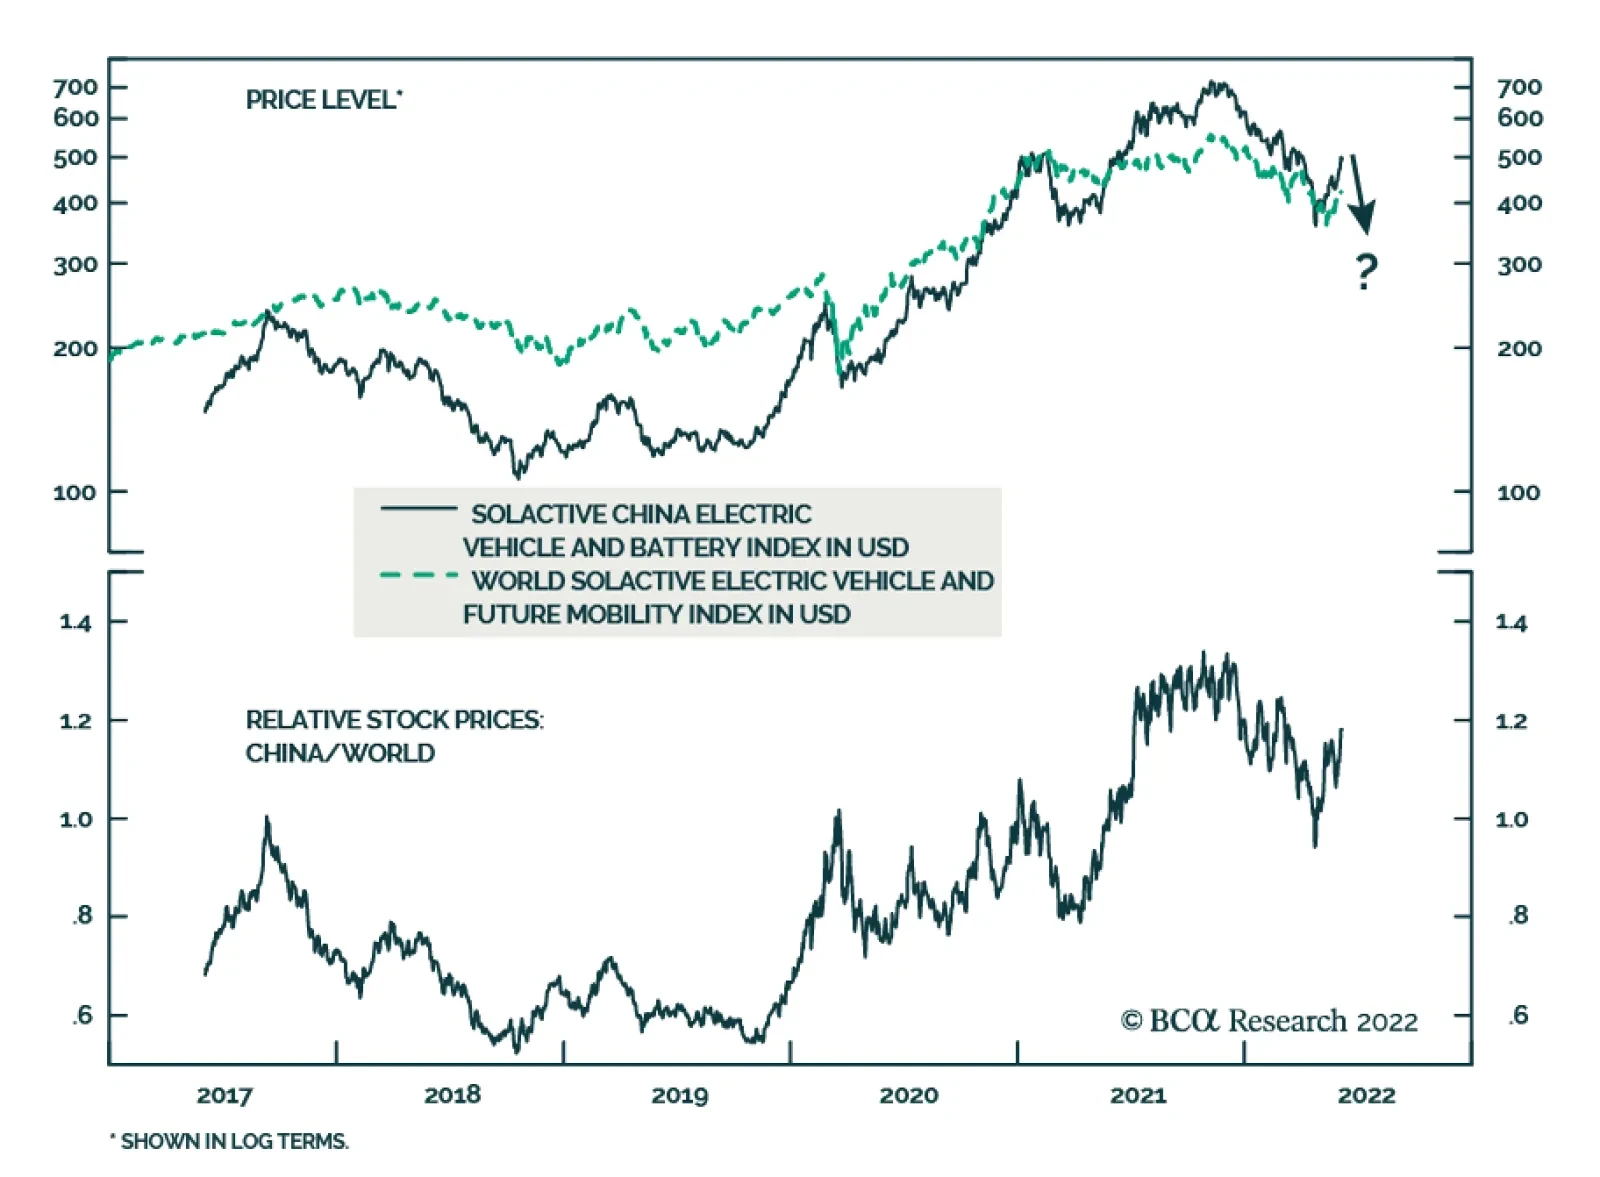
According to BCA Research’s China Investment Strategy service, China’s investment focus is shifting from traditional infrastructure to new economy infrastructure. They expect new infrastructure investment in tech and green energy to rise at the expense of…
Executive Summary Chinese Infrastructure Investment Growth: A Slowdown Ahead
Chinese Infrastructure Investment Growth: A Slowdown Ahead
Chinese Infrastructure Investment Growth: A Slowdown Ahead
Despite the authorities’ push, China’s infrastructure1 investment nominal growth2 will likely slow from the current rate of 8% to 1-3% in 2022H2, on a year-over-year basis. Funding shortages will limit local governments’ capability to invest in traditional infrastructure fixed-asset investment (FAI), which will likely grow by only 1-2% in 2022H2. We expect China’s cheap green loans to support a 10-15% growth in tech infrastructure spending in the second half of this year. However, the scale of China’s tech infrastructure investment is too small in absolute terms to offset the weakness in traditional infrastructure spending. Tech infrastructure plays will likely outperform traditional infrastructure plays in the long term as China continues its efforts to peak carbon emissions before 2030 and reach carbon neutrality before 2060. As new infrastructure investment will accelerate in the coming years, we are positive on the sectors of NEV and NEV charging poles. Given the still-high valuation of the sector and mounting downward pressure that the Chinese economy is currently facing, we look to buy these sectors at a better price entry point. Bottom Line: China’s infrastructure investment growth will likely slow from the current 8% rate to 1-3% in 2022H2 due to funding constraints and a shrinking pool of profitable infrastructure projects. Feature Infrastructure investment growth in China accelerated to 8% (nominal) in the first four months of this year (Chart 1, top panel). The authorities demanded that local governments execute infrastructure projects sooner and faster to offset the strong headwinds to the economy from COVID restrictions and continued property downturn. Nonetheless, China’s infrastructure investment growth will likely slow from the current annual rate (YoY) of 8% to 1-3% in 2022H2 due to funding constraints and a lack of financially feasible projects, bringing the whole year’s growth to slightly below 4%. Although a 4% YoY growth in infrastructure investment this year would be an improvement from the 0.4% YoY contraction in 2021, it is far below the 12% average rate of infrastructure spending growth over the past decade (Chart 1). Moreover, we estimate that traditional infrastructure investment, which accounts for 95% of China’s total infrastructure spending, will only grow by 1-2% in 2022H2 (Chart 2, top panel). Chart 1Chinese Infrastructure Investment: Moderate Growth In 2022H2
Chinese Infrastructure Investment: Moderate Growth In 2022H2
Chinese Infrastructure Investment: Moderate Growth In 2022H2
Chart 2Investment Growth In 2022H2: Deceleration In Traditional Infrastructure While Acceleration In Tech Infrastructure
Investment Growth In 2022H2: Deceleration In Traditional Infrastructure While Acceleration In Tech Infrastructure
Investment Growth In 2022H2: Deceleration In Traditional Infrastructure While Acceleration In Tech Infrastructure
For the tech infrastructure, we are more positive as building cutting-edge tech infrastructure– including 5G networks, data centers, artificial intelligence (AI) and Internet of Things (IoT) – has become a top development priority for China. With supportive policies and cheap green loans, we expect a 10-15% YoY growth in Chinese tech infrastructure in 2022H2 (Chart 2, bottom panel). However, the scale of China’s tech infrastructure investment is too small in absolute terms to offset the weakness in traditional infrastructure spending. After all, tech infrastructure currently only accounts for about 5% of the total Chinese nominal infrastructure FAI (Chart 3). Chart 3Breaking Down Chinese Infrastructure Investment
China's Infrastructure Push: How Much Upside?
China's Infrastructure Push: How Much Upside?
Tech infrastructure plays will likely outperform their traditional infrastructure counterparts in the long term as China continues its efforts to peak carbon emissions before 2030 and reach carbon neutrality before 2060. As new infrastructure investment will accelerate in the coming years, we are positive on the sectors of NEV and NEV charging poles. Yet, considering China’s economy is still facing downward pressure and the sector’s valuations are still high, we look to buy these sectors at a better price entry point. Funding Constraints The recent strong rebound in Chinese infrastructure investment was mainly driven by a massive frontload of local government special purpose bond (SPB) sales, as well as funding from last year’s SPB proceeds – both funding resources will not sustain into the second half of this year. According to the data from the Ministry of Finance, in the first five months of 2022, special bond issuance has already reached 2.03 trillion RMB, significantly higher than the 1.2 trillion RMB issued during the same period last year. In addition, there has been an estimated 1.2 trillion unused SPB proceeds from 2021 that have been carried over to 2022 to fund infrastructure spending. However, such a boost in local government funding of infrastructure investment is unsustainable. We expect Chinese infrastructure investment growth to fall back to the 1-3% range in 2022H2 due to limited financial availability and a shrinking pool of infrastructure projects. Chart 4 shows the breakdown of the major funding sources of Chinese infrastructure investment. Most of them are likely to face considerable constraints over the next six months. Chart 4Major Funding Sources Of Chinese Infrastructure Investment
China's Infrastructure Push: How Much Upside?
China's Infrastructure Push: How Much Upside?
(1) Less Revenues Chinese local governments face tremendous shortfalls of cash, which will impede their ability to meet their nearly 30% contribution to overall infrastructure funding: Land sales by local governments contribute nearly 90% of government-managed funds (GMF3). The latter's revenues, excluding proceeds from SPB issuance, account for 16% of overall infrastructure funding. The deep contraction in home sales has depressed real estate developers’ land purchases, which has considerably reduced local government revenues (Chart 5). This will curb the ability of local governments to finance their infrastructure projects through GMFs. Although we expect a moderate rebound in property sales over the next six months from very depressed levels in recent months, the improvement in local government land sales will likely be very limited as real estate developers are still overleveraged and under severe funding constraints. In addition to the slump in land sales, tax cuts for corporates and low-income households are also eroding local government revenues, and COVID-related expenses add to spending needs. Shrinking corporate profits will also pose downward risks to the tax revenues of local governments (Chart 6). Chart 5Government-Managed Funds: Headwinds From Falling Land Sales
Government-Managed Funds: Headwinds From Falling Land Sales
Government-Managed Funds: Headwinds From Falling Land Sales
Chart 6Declining Government Tax##br## Revenues
Declining Government Tax Revenues
Declining Government Tax Revenues
The general budget of local governments,4 which contributes to about 14% of overall infrastructure financing, is extremely tight this year. In the first four months of the year, revenues of local governments fell by about 18% from the same period last year, while their expenditures increased by 5%. As a result, the general government’s fiscal deficit will likely exceed both the 2.8% target set for this year and the 3.2% fiscal deficit of last year (Chart 7). Chart 7Government General Budget: Large Deficit
Government General Budget: Large Deficit
Government General Budget: Large Deficit
(2) Less SPB Available In H2 Chart 8Local Government Special Bond Issuance Will Decrease In 2022H2
Local Government Special Bond Issuance Will Decrease In 2022H2
Local Government Special Bond Issuance Will Decrease In 2022H2
Local government SPB issuance, which is used exclusively to fund infrastructure projects, has been another major source of financing for domestic infrastructure projects since 2016 (Chart 8). As local governments frontloaded 56% of their 2022 SPB quota in the first five months of this year, they will have less fiscal support from SPBs in 2022H2. As net local government SPB issuance made up about 16% of overall infrastructure FAI on average in the past three years, there is quite a financing gap to be filled in 2022H2. (3) Contracting Domestic Loan Demand Domestic loans contribute to about 20% of overall infrastructure financing, with 14% from regular non-household medium-long-term (MLT) lending, and another 6% from domestic green loans. Infrastructure projects are generally long-term investments in nature and hence often require MTL loans. Presently, the impulse of non-household MLT lending is contracting (Chart 9). While not all MLT loans are used for infrastructure, sluggish MLT lending also reflects corporates’ reluctance to borrow for and invest in infrastructure projects. Strong economic headwinds due to COVID-induced lockdowns and the slumping property market, mounting local government debt, and low returns on infrastructure projects will continue to curb corporates’ demand for bank loans to fund infrastructure projects, particularly from the private sector. The “green loans”,5 which are used for but not limited to new energy infrastructure projects, will continue to grow strongly in 2022H2. In 2021, the increase in green loans for infrastructure was 1.64 trillion RMB, or a 62% increase from the previous year. In 2022, we expect new green loans could rise 50%-80% to 2.5-3 trillion RMB, with an increase of 0.6-1.1 trillion RMB in new green loans in the second half of the year. While green loans will help support the overall infrastructure investment, given their small size (green loans accounted for about 8% of China’s total infrastructure investment in 2021), they will unlikely fully offset the shortfall from other financing sources this year (Chart 10). Chart 9Sluggish Medium/Long-Term Bank##br## Lending
Sluggish Medium/Long-Term Bank Lending
Sluggish Medium/Long-Term Bank Lending
Chart 10Green Loans: Strong Growth In 2022H2 But Still Small Amount Relative To Overall Infrastructure Investment
Green Loans: Strong Growth In 2022H2 But Still Small Amount Relative To Overall Infrastructure Investment
Green Loans: Strong Growth In 2022H2 But Still Small Amount Relative To Overall Infrastructure Investment
In the long run, though, to reach peak carbon emissions by 2030 and carbon neutrality by 2060, China will continue to lean heavily on its banking system to accelerate green projects and infrastructure investment. (4) Public-Private Partnerships (PPP) Since 2014, PPPs have become an important financing model for Chinese local governments to fund infrastructure investments. However, to control rising local government leverage, the central government has tightened regulations on PPP projects since early 2018. Heightened scrutiny has resulted in a sharp deceleration in both PPP investment and overall infrastructure investment growth. Consequently, PPP contributions to total infrastructure FAI have been consistently declining, from over 30% in 2017 to about 4% currently (Chart 11). So far this year, the amount of signed and implemented PPP investments has been falling. While the private sector’s propensity to invest has been extremely weak, a shrinking pool of profitable infrastructure projects could be another contributing factor. The number of projects – which are in the preparation stage in the national total project entries – has been falling from its peak of 2,550 in June 2017 to only 465 in March 2022 (Chart 12). Chart 11Public-Private Partnerships Funding: Limited Growth In 2022H2
Public-Private Partnerships Funding: Limited Growth In 2022H2
Public-Private Partnerships Funding: Limited Growth In 2022H2
Chart 12A Shrinking Pool Of Public-Private Partnership##br## Projects
A Shrinking Pool Of Public-Private Partnership Projects
A Shrinking Pool Of Public-Private Partnership Projects
(5) Other Funding Sources Local government financing vehicles (LGFV) and shadow bank borrowing were major financing sources prior to 2018. However, following the 2017/2018 financial de-risking and anticorruption campaign, local governments have scaled back their shadow bank activities significantly. Shadow banking remains in deep contraction (Chart 13). We expect only a modest pick-up in LGFV leveraging during the rest of the year, given that both the anticorruption campaign and a reshuffling of local government officials are ongoing. Chart 13Shadow Banking Will Remain In Deep Contraction
Shadow Banking Will Remain In Deep Contraction
Shadow Banking Will Remain In Deep Contraction
In addition, policy banks could sell special sovereign bonds to help fund domestic infrastructure projects. For example, in a recent State Council meeting, Premier Li Keqiang requested policy banks to provide 800 billion RMB ($120 billion) in funding for infrastructure projects. An 800-billion-RMB additional funding, if fully invested, would only add about 0.4% growth to this year’s infrastructure spending. Bottom line: Due to funding constraints and a shrinking pool of profitable infrastructure projects, China’s infrastructure investment growth rate will likely slow from the current 8% pace to 1-3% in 2022H2. Infrastructure Investment Focus: Shifting From Traditional To New Chart 14China Is Shifting Its Focus Away From Traditional Infrastructure Development…
China Is Shifting Its Focus Away From Traditional Infrastructure Development...
China Is Shifting Its Focus Away From Traditional Infrastructure Development...
The pace of new infrastructure (including but not limited to tech infrastructure) is set to accelerate both cyclically (in the next 6 to 12 months) and structurally (in the next 3 to 5 years), while traditional infrastructure investment growth will slow. However, over a cyclical time horizon, infrastructure investment in new economy sectors is too small to offset the weakness in spending in traditional sectors. Decelerating Investment In Traditional Infrastructure In 2022H2 And Beyond Chart 14 shows the real growth rate of railways, highways and airports has all dropped to below 3% last year. Correspondingly, investment in transport infrastructure only grew 1.4% in 2020 and 1.6% in 2021, a distinctly slower pace from 3.9% in 2018 and 3.4% in 2019. Similar growth deceleration has also occurred in the Water Conservancy, Environment & Utility Management sector. Investment growth in nominal terms this sector fell from 3.3% in 2018 and 2.9% in 2019 to 0.2% in 2020 and saw a 1.2% contraction in 2021. Most Chinese cities with large populations and/or high population density have already upgraded their sewer system in recent years and, therefore, localities have only been maintaining rather than upgrading these systems. The Water Conservancy, Environment & Utility Management sector and the Transport, Storage and Postal Service sector together account for the lion’s share (78%) of total infrastructure investment. A growth deceleration in these two sectors will likely lead to slower growth in overall infrastructure investment, compared with the first four months of this year, when both sectors grew by 7.2% and 7.4%, respectively, in nominal terms. Accelerating Investment In New Infrastructure In 2022H2 And Beyond Chart 15...To New Infrastructure Development
...To New Infrastructure Development
...To New Infrastructure Development
Investment in new economy sectors–such as Electricity, Gas & Water Production and Supply, which currently accounts for about 18% of overall infrastructure investment–will remain strong in 2022H2. Investment in the subsector of ultra-high-voltage electricity transmission (UHV electricity transmission) and smart grid, as well as new electricity infrastructure, such as wind and solar power, will also continue to accelerate. The construction of 5G base stations will grow strongly in the coming years but may see a moderation in growth this year. Network operators such as China Mobile, China Unicom and China Telecom plan to build about 600,000 5G base stations, slightly lower than last year’s 650,000. The construction of new electric vehicle (NEV) charging poles accelerated because of a significant increase in NEV sales (Chart 15). Elevated oil prices and technology improvement in NEV performance have boosted NEV sales in China. As such, investment growth in NEV charging infrastructure is set to rise in the coming years. Bottom line: China’s investment focus is shifting from traditional infrastructure to new economy infrastructure. As such, we expect new infrastructure investment in tech and green energy to rise at the expense of traditional infrastructure (Chart 16). Chart 16"Green Investment" Is Rising, “Dirty Thermal” Investment Is Falling
China's Infrastructure Push: How Much Upside?
China's Infrastructure Push: How Much Upside?
Investment Implications The infrastructure sector accounts for about 10-15% of China’s total steel consumption and about 30-40% of cement consumption (Chart 17). Chart 17A Slowdown In Chinese Infrastructure Spending Will Weigh On Steel And Cement Prices
A Slowdown In Chinese Infrastructure Spending Will Weigh On Steel And Cement Prices
A Slowdown In Chinese Infrastructure Spending Will Weigh On Steel And Cement Prices
We expect China’s infrastructure investment, particularly in traditional sectors like highway construction, to slow in the second half of the year. As such, steel prices are at risk of falling further. Moreover, sluggish construction activity in property markets will be a drag on steel prices (Chart 18). Slower growth in traditional infrastructure investment in the next six months, as well as structurally will pose downward pressures on the performance of both global and Chinese onshore machinery stocks (Chart 19). Chart 18Dismal Property Markets Will Be A Drag On##br## Steel Prices
Dismal Property Markets Will Be A Drag On Steel Prices
Dismal Property Markets Will Be A Drag On Steel Prices
Chart 19Slower Growth In Traditional Infrastructure Investment Will Weigh On Global/Chinese Machinery Stocks
Slower Growth In Traditional Infrastructure Investment Will Weigh On Global/Chinese Machinery Stocks
Slower Growth In Traditional Infrastructure Investment Will Weigh On Global/Chinese Machinery Stocks
Chart 20Look To Buy NEV Stocks
Look To Buy NEV Stocks
Look To Buy NEV Stocks
We are positive on China’s NEV sector’s structural outlook and stock performance, based on an acceleration in new economy infrastructure investment in the coming years. However, the near-term outlook on the sector’s stock performance is neutral at best. The sector’s valuations are high, considering China’s economy is still facing downward pressure due to a faltering property market, sluggish household income growth and consumption, falling export demand, as well as heightened risks of further COVID-induced lockdowns. NEV stocks will likely have more shakeouts in the coming six months before any sustainable uptrend. Hence, we look to buy these sectors at a better price entry point (Chart 20). Ellen JingYuan He Associate Vice President ellenj@bcaresearch.com Footnotes 1 Including both traditional infrastructure and tech infrastructure. For the purposes of this report, the composition of “infrastructure” includes “traditional infrastructure” and “tech infrastructure.” The “traditional infrastructure” comprises three categories – (1) Transport, Storage and Postal Service; (2) Water Conservancy, Environment & Utility Management; and (3) Electricity, Gas & Water Production and Supply. 2 Please note that all growth rates in this report are nominal growth rates. 3 According to the country’s Budget Law, the GMF budget refers to the budget for revenues and expenditures for the funds raised for specific developmental objectives. In brief, GMFs constitute de-facto off-balance-sheet government revenues and spending. 4 The general budget of local governments covers local governments’ day-to-day operation as well as local infrastructure development (mainly in four categories: Environment Protection, Urban & Rural Community Affairs, and Affairs of Agriculture, Forest & Irrigation and Transportation). In contrast, the government-managed funds (GMF) excluding proceeds from SPB issuance finances the big ang national-level important infrastructure projects. 5 Last November, the People’s Bank of China (PBoC) launched a carbon emission reduction facility (CERF) to offer low interest loans to financial institutions that help firms cut carbon emissions. The targeted green lending program will provide 60% of loan principals made by financial institutions for carbon emission cuts at a one-year lending rate of 1.75%. The funding will be available retroactively after the loans are made, and can be rolled over twice. Strategic Themes Cyclical Recommendations
Highlights Chart 1Wage Growth Is Cooling
Wage Growth Is Cooling
Wage Growth Is Cooling
In a speech last week, Fed Governor Christopher Waller presented the theoretical underpinnings for how the Fed plans to achieve a soft landing for the US economy.1 The Fed’s hope is that tighter monetary policy will slow demand enough to reduce the number of job openings – of which there are currently almost two for every unemployed person – without leading to a significant increase in layoffs and the unemployment rate. A reduction in the ratio of job openings to unemployed will lead to softer wage growth and lower inflation. The May employment report – released last Friday – provides some evidence that the Fed’s plan may be working. In May, an increase in labor force participation led to strong employment gains and kept the unemployment rate flat. We also saw continued evidence of a deceleration in average hourly earnings (Chart 1). Fifty basis point rate hikes are all but assured at the June and July FOMC meetings, but softer wage growth and falling inflation make it more likely that the Fed will downshift to a pace of 25 bps per meeting starting in September. Feature Table 1 Recommended Portfolio Specification Table 2Fixed Income Sector Performance
The Case For A Soft Landing
The Case For A Soft Landing
Investment Grade: Underweight Chart 2Investment Grade Market Overview
Investment Grade Market Overview
Investment Grade Market Overview
Investment grade corporate bonds outperformed the duration-equivalent Treasury index by 79 basis points in May, bringing year-to-date excess returns up to -215 bps. The average index option-adjusted spread tightened 5 bps on the month and it currently sits at 131 bps. Similarly, our quality-adjusted 12-month breakeven spread downshifted to its 45th percentile since 1995 (Chart 2). A recent report made the case for why investors should underweight investment grade corporate bonds on a 6-12 month horizon.2 The main rationale for this recommendation is that the slope of the Treasury curve is very flat, signaling that we are in the mid-to-late stages of the credit cycle. Corporate bond performance tends to be weak during such periods unless spreads start from very high levels. Despite our underweight 6-12 month investment stance, we see a high likelihood that spreads will narrow during the next few months as inflation falls and the Fed tightens by no more than what is already priced in the curve. That said, the persistent removal of monetary accommodation and flatness of the yield curve will limit how much spreads can compress. Last week’s report dug deeper into the corporate bond space and concluded that investment grade-rated Energy bonds offer exceptional value on a 6-12 month horizon.3 That report also concluded that long maturity investment grade corporates are attractively priced relative to short maturity bonds. Table 3A Corporate Sector Relative Valuation And Recommended Allocation* Table 3BCorporate Sector Risk Vs. Reward*
The Case For A Soft Landing
The Case For A Soft Landing
High-Yield: Neutral Chart 3High-Yield Market Overview
High-Yield Market Overview
High-Yield Market Overview
High-Yield underperformed the duration-equivalent Treasury index by 35 basis points in May, dragging year-to-date excess returns down to -316 bps. More specifically, high-yield sold off dramatically early in the month – the junk index lagged Treasuries by 368 bps between May 1 and May 20 – but then staged a rally near the end of May, outperforming Treasuries by 333 bps between May 20 and May 31. The 12-month spread-implied default rate – the default rate that is priced into the junk index assuming a 40% recovery rate on defaulted debt and an excess spread of 100 bps – moved higher in May. It currently sits at 5.1% (Chart 3). Last week’s report reiterated our view that investors should favor high-yield over investment grade within an overall underweight allocation to spread product versus Treasuries.4 Our main rationale for this view is that there are historical precedents for high-yield bonds outperforming investment grade during periods when the yield curve is very flat but when corporate balance sheet health is strong. The 2006-07 period is a prime example. With that in mind, our outlook for corporate profit and debt growth is consistent with a default rate of 2.7% to 3.7% during the next 12 months, well below the 5.1% that is currently priced in the index. MBS: Underweight Chart 4MBS Market Overview
MBS Market Overview
MBS Market Overview
Mortgage-Backed Securities outperformed the duration-equivalent Treasury index by 70 basis points in May, bringing year-to-date excess returns up to -109 bps. We discussed the outlook for Agency MBS in a recent report.5 We noted that MBS’s poor performance in 2021 and early-2022 was driven by duration extension. Fewer homeowners refinanced their loans as mortgage rates rose, and the MBS index’s average duration increased (Chart 4). But now, the index’s duration extension is at its end. The average convexity of the MBS index is close to zero (panel 3), meaning that duration is now insensitive to changes in rates. This is because hardly any homeowners have the incentive to refinance at current mortgage rates (panel 4). The implication is that excess MBS returns will be stronger going forward. That said, we still don’t see enough value in MBS spreads to increase our recommended allocation. The average index spread for conventional 30-year Agency MBS remains close to its lowest level since 2000 (bottom panel). At the coupon level, we observe that low-coupon MBS have much higher duration than high-coupon MBS and that convexity is close to zero for the entire coupon stack. This makes the relative coupon trade a direct play on bond yields. Given that we see some potential for yields to fall somewhat during the next six months, we recommend favoring low-coupon MBS (1.5%-2.5%) within an overall underweight allocation to the sector.ext 12 months, well below the 5.1% that is currently priced in the index. Emerging Market Bonds (USD): Underweight Chart 5Emerging Markets Overview
Emerging Markets Overview
Emerging Markets Overview
Emerging Market (EM) bonds outperformed the duration-equivalent Treasury index by 29 basis points in May, bringing year-to-date excess returns up to -565 bps. EM sovereigns outperformed the Treasury benchmark by 125 bps on the month, bringing year-to-date excess returns up to -664 bps. The EM Corporate & Quasi-Sovereign Index underperformed by 28 bps, dragging year-to-date excess returns down to -501 bps. The EM Sovereign Index underperformed the duration-equivalent US corporate bond index by 27 bps in May. The yield differential between EM sovereigns and duration-matched US corporates remains negative (Chart 5). As such, we continue to recommend a maximum underweight allocation to EM sovereigns. The EM Corporate & Quasi-Sovereign Index underperformed duration-matched US corporates by 109 bps in May, but it continues to offer a significant yield advantage (panel 4). As such, we maintain our neutral allocation (3 out of 5) to the sector. Despite modest weakness in the trade-weighted US dollar in May, EM currencies continue to struggle (bottom panel). If the Fed tightens no more quickly than what is already priced in the curve for the next six months – as we expect – it could limit the upward pressure on the US dollar and benefit EM spreads in the near term. Municipal Bonds: Overweight Chart 6Municipal Market Overview
Municipal Market Overview
Municipal Market Overview
Municipal bonds outperformed the duration-equivalent Treasury index by 61 basis points in May, bringing year-to-date excess returns up to -78 bps (before adjusting for the tax advantage). We view the municipal bond sector as better placed than most to cope with the recent bout of spread product volatility. As we noted in a recent report, state & local government revenue growth has been strong and yet governments have also been slow to hire.6 The result is that net state & local government savings are incredibly high (Chart 6) and it will take some time to deplete those coffers even as economic growth slows and federal fiscal thrust turns to drag. On the valuation front, munis have cheapened up relative to both Treasuries and corporates during the past few months. The 10-year Aaa Muni/Treasury yield ratio is currently 83%, up significantly from its 2021 trough of 55%. The yield ratio between 12-17 year munis and duration-matched corporate bonds is also up significantly off its lows (panel 2). We reiterate our overweight allocation to municipal bonds within US fixed income portfolios, and we continue to have a strong preference for long-maturity munis. The yield ratio between 17-year+ General Obligation Municipal bonds and duration-matched corporates is 85%. The same measure for 17-year+ Revenue bonds stands at 92%, just below parity even without considering municipal debt’s tax advantage. Treasury Curve: Buy 5-Year Bullet Versus 2/10 Barbell Chart 7Treasury Yield Curve Overview
Treasury Yield Curve Overview
Treasury Yield Curve Overview
The Treasury curve bull-steepened in May. The 2-year/10-year Treasury slope steepened 13 bps on the month and the 5-year/30-year slope steepened 22 bps. The 2/10 and 5/30 slopes now stand at 30 bps and 16 bps, respectively. In a recent Special Report we noted the unusually large divergence between flat slopes at the long end of the curve and steep slopes at the front end.7 For example, the 5-year/10-year Treasury slope is currently 1 bp while the 3-month/5-year slope is 178 bps. The divergence is happening because the market has moved quicky to price-in a rapid near-term pace of rate hikes. However, so far, the Fed has only delivered 75 bps of tightening and this is holding down the very front-end of the curve. The oddly shaped curve presents us with an excellent trading opportunity. Specifically, we recommend buying the 5-year Treasury note versus a duration-matched barbell consisting of the 2-year and 10-year notes. This trade looks attractive on our model (Chart 7) and will profit if the rate hike cycle moves more slowly than what is currently priced but lasts longer. We also continue to recommend a position long the 20-year bullet versus a duration-matched 10/30 barbell as an attractive carry trade. TIPS: Underweight Chart 8TIPS Market Overview
TIPS Market Overview
TIPS Market Overview
TIPS underperformed the duration-equivalent nominal Treasury index by 144 basis points in May, dragging year-to-date excess returns down to +237 bps. The 10-year TIPS breakeven inflation rate fell 25 bps last month, but it remains above the Fed’s 2.3% - 2.5% comfort zone (Chart 8). Our TIPS Breakeven Valuation Indicator shows that TIPS remain “expensive”, but not as expensive as they were a month ago (panel 2). While TIPS have become less expensive during the past month, we think TIPS breakeven inflation rates will continue to fall during the next few months as inflation moves lower. This will be particularly true at the front-end of the curve where breakevens remain disconnected from the Fed’s target (panel 4) and where breakevens exhibit a stronger correlation with the incoming inflation data. To take advantage of falling inflation between now and the end of the year, investors should position for a steeper TIPS breakeven curve (bottom panel) and/or a flatter real (TIPS) curve. We also recommend that investors hold outright short positions in 2-year TIPS. ABS: Overweight Chart 9ABS Market Overview
ABS Market Overview
ABS Market Overview
Asset-Backed Securities underperformed the duration-equivalent Treasury index by 26 basis points in May, dragging year-to-date excess returns down to -63 bps. Aaa-rated ABS underperformed by 26 bps on the month, dragging year-to-date excess returns down to -59 bps. Non-Aaa ABS underperformed by 22 bps on the month, dragging year-to-date excess returns down to -88 bps. During the past two years, substantial federal government support for household incomes caused US households to build up an extremely large buffer of excess savings. Nowhere is this more evident than in the steep drop in the amount of outstanding credit card debt that was witnessed in 2020 and 2021 (Chart 9). In 2022, consumers have started to re-lever. The personal savings rate was just 4.4% in April, the lowest print since September 2008, and the amount of outstanding credit card debt has almost recovered its pre-COVID level. But while household balance sheets are starting to deteriorate, they remain exceptionally strong in level terms. In other words, it will be some time before we see enough deterioration to cause a meaningful uptick in consumer credit delinquencies. Investors should remain overweight consumer ABS and should take advantage of the high quality of household balance sheets by moving down the quality spectrum, favoring non-Aaa rated securities over Aaa-rated ones. Non-Agency CMBS: Overweight Chart 10CMBS Market Overview
CMBS Market Overview
CMBS Market Overview
Non-Agency Commercial Mortgage-Backed Securities underperformed the duration-equivalent Treasury index by 105 basis points in May, dragging year-to-date excess returns down to -189 bps. Aaa Non-Agency CMBS underperformed Treasuries by 84 bps on the month, dragging year-to-date excess returns down to -152 bps. Non-Aaa Non-Agency CMBS underperformed by 165 bps on the month, dragging year-to-date excess returns down to -290 bps. CMBS spreads remain wide compared to other similarly risky spread products. However, after several quarters of easing, commercial real estate lending standards shifted closer to ‘net tightening’ territory in Q1 (Chart 10). This trend will bear monitoring in the coming quarters. Agency CMBS: Overweight Agency CMBS outperformed the duration-equivalent Treasury index by 19 basis points in May, bringing year-to-date excess returns up to -23 bps. The average index option-adjusted spread tightened 2 bps on the month. It currently sits at 49 bps, not that far from its average pre-COVID level (bottom panel). Agency CMBS spreads also continue to look attractive compared to other similarly risky spread products. Stay overweight. Appendix A: The Golden Rule Of Bond Investing We follow a two-step process to formulate recommendations for bond portfolio duration. First, we determine the change in the federal funds rate that is priced into the yield curve for the next 12 months. Second, we decide – based on our assessments of the economy and Fed policy – whether the change in the fed funds rate will exceed or fall short of what is priced into the curve. Most of the time, a correct answer to this question leads to the appropriate duration call. We call this framework the Golden Rule Of Bond Investing, and we demonstrated its effectiveness in the US Bond Strategy Special Report, “The Golden Rule Of Bond Investing”, dated July 24, 2018. Chart 11 illustrates the Golden Rule’s track record by showing that the Bloomberg Barclays Treasury Master Index tends to outperform cash when rate hikes fall short of 12-month expectations, and vice-versa. At present, the market is priced for 251 basis points of rate hikes during the next 12 months. Chart 11The Golden Rule's Track Record
The Golden Rule's Track Record
The Golden Rule's Track Record
We can also use our Golden Rule framework to make 12-month total return and excess return forecasts for the Bloomberg Barclays Treasury index under different scenarios for the fed funds rate. Excess returns are relative to the Bloomberg Barclays Cash index. To forecast total returns we first calculate the 12-month fed funds rate surprise in each scenario by comparing the assumed change in the fed funds rate to the current value of our 12-month discounter. This rate hike surprise is then mapped to an expected change in the Treasury index yield using a regression based on the historical relationship between those two variables. Finally, we apply the expected change in index yield to the current characteristics (yield, duration and convexity) of the Treasury index to estimate total returns on a 12-month horizon. The below tables present those results, along with excess returns for a front-loaded and a back-loaded rate hike scenario. Excess returns are calculated by subtracting assumed cash returns in each scenario from our total return projections.
The Case For A Soft Landing
The Case For A Soft Landing
Appendix B: Butterfly Strategy Valuations The following tables present the current read-outs from our butterfly spread models. We use these models to identify opportunities to take duration-neutral positions across the Treasury curve. The following two Special Reports explain the models in more detail: US Bond Strategy Special Report, “Bullets, Barbells And Butterflies”, dated July 25, 2017, available at usbs.bcaresearch.com US Bond Strategy Special Report, “More Bullets, Barbells And Butterflies”, dated May 15, 2018, available at usbs.bcaresearch.com Table 4 shows the raw residuals from each model. A positive value indicates that the bullet is cheap relative to the duration-matched barbell. A negative value indicates that the barbell is cheap relative to the bullet. Table 4Butterfly Strategy Valuation: Raw Residuals In Basis Points (As Of May 31, 2022)
The Case For A Soft Landing
The Case For A Soft Landing
Table 5 scales the raw residuals in Table 4 by their historical means and standard deviations. This facilitates comparison between the different butterfly spreads. Table 5Butterfly Strategy Valuation: Standardized Residuals (As Of May 31, 2022)
The Case For A Soft Landing
The Case For A Soft Landing
Table 6 flips the models on their heads. It shows the change in the slope between the two barbell maturities that must be realized during the next six months to make returns between the bullet and barbell equal. For example, a reading of -51 bps in the 5 over 2/10 cell means that we would expect the 5-year to outperform the 2/10 if the 2/10 slope flattens by less than 51 bps during the next six months. Otherwise, we would expect the 2/10 barbell to outperform the 5-year bullet. Table 6Discounted Slope Change During Next 6 Months (BPs)
The Case For A Soft Landing
The Case For A Soft Landing
Appendix C: Excess Return Bond Map The Excess Return Bond Map is used to assess the relative risk/reward trade-off between different sectors of the US bond market. It is a purely computational exercise and does not impose any macroeconomic view. The Map’s vertical axis shows 12-month expected excess returns. These are proxied by each sector’s option-adjusted spread. Sectors plotting further toward the top of the Map have higher expected returns and vice-versa. Our novel risk measure called the “Risk Of Losing 100 bps” is shown on the Map’s horizontal axis. To calculate it, we first compute the spread widening required on a 12-month horizon for each sector to lose 100 bps or more relative to a duration-matched position in Treasury securities. Then, we divide that amount of spread widening by each sector’s historical spread volatility. The end result is the number of standard deviations of 12-month spread widening required for each sector to lose 100 bps or more versus a position in Treasuries. Lower risk sectors plot further to the right of the Map, and higher risk sectors plot further to the left. Chart 12Excess Return Bond Map (As Of May 31, 2022)
The Case For A Soft Landing
The Case For A Soft Landing
Ryan Swift US Bond Strategist rswift@bcaresearch.com Footnotes 1 https://www.federalreserve.gov/newsevents/speech/waller20220530a.htm 2 Please see US Bond Strategy / Global Fixed Income Strategy Special Report, “Turning Defensive On US Corporate Bonds”, dated April 12, 2022. 3 Please see US Bond Strategy / Global Fixed Income Strategy Special Report, “Looking For Opportunities In US & European Corporates After The Recent Selloff”, dated May 31, 2022. 4 Please see US Bond Strategy / Global Fixed Income Strategy Special Report, “Looking For Opportunities In US & European Corporates After The Recent Selloff”, dated May 31, 2022. 5 Please see US Bond Strategy Weekly Report, “The Bond Market Implications Of A 5% Mortgage Rate”, dated April 26, 2022. 6 Please see US Bond Strategy Weekly Report, “Echoes Of 2018”, dated May 24, 2022. 7 Please see US Bond Strategy / US Investment Strategy / US Equity Strategy Special Report, “The Yield Curve As An Indicator”, dated March 29, 2022. Recommended Portfolio Specification Other Recommendations Treasury Index Returns Spread Product Returns
Investor sentiment towards Chinese equities appears to be improving. The CSI 300 Index, which tracks the performance of the largest stocks traded on the Shanghai and Shenzhen bourses, is up 9% in USD terms from its May 9 low. The improving performance of…
Listen to a short summary of this report. Executive Summary Chinese Stocks Are Relatively Cheap
Chinese Stocks Are Relatively Cheap
Chinese Stocks Are Relatively Cheap
The Chinese economy faces a trifecta of economic woes: 1) The threat of renewed Covid lockdowns; 2) Cooling export demand; 3) A floundering housing market. Trying to reflate the Chinese housing bubble would only damage the long-term prospects of China’s economy. A much better option would be to adopt measures that boost disposable income. Not only would this help offset the drag from slowing export growth and a negative housing wealth effect, but it would also take some of the sting out of China’s zero-Covid policy. With the Twentieth Party Congress slated for later this year, the political incentive to shower the economy with cash will only intensify. Chinese equities are trading at only 10-times forward earnings and about 1-times sales. A significant upward rating for equity valuations is likely if the government adopts broad-based income-support measures. Go long the iShares MSCI China ETF ($MCHI) as a tactical trade. Bottom Line: China faces a number of economic woes, but these are fully discounted by the market. What has not been discounted is a broad-based stimulus program focused on income-support measures. Dear Client, I will be visiting clients in Saudi Arabia, Bahrain, and Abu Dhabi next week. No doubt, the outlook for oil prices will feature heavily in my discussions. I will brief you on any insights I learn in my report on June 17. In the meantime, I am pleased to announce that Matt Gertken, BCA’s Chief Geopolitical Strategist, will be the guest author of next week’s Global Investment Strategy report. Best regards, Peter Berezin Chief Global Strategist Triple Threat The Chinese economy faces a trifecta of economic woes: 1) The threat of renewed Covid lockdowns; 2) Cooling export demand; 3) A floundering housing market. Let us discuss each problem in turn. Problem #1: China’s Zero-Covid Policy in the Age of Omicron Chart 1China’s Lockdown Index Remains Elevated
China: A Trifecta Of Economic Woes
China: A Trifecta Of Economic Woes
China was able to successfully suppress the virus in the first two years of the pandemic. However, the emergence of the Omicron strain is challenging the government’s commitment to its zero-Covid policy. The BA.2 subvariant of Omicron is 50% more contagious than the original Omicron strain and about 4-times more contagious than the Delta strain. While 89% of China’s population has been fully vaccinated, the number drops off to 82% for those above the age of 60. And those who are vaccinated have been inoculated with vaccines that appear to be largely ineffective against Omicron. Keeping a virus as contagious as measles at bay in a population with little natural or artificial immunity is exceedingly difficult. While the authorities are starting to relax restrictions in Shanghai, China’s Effective Lockdown Index remains at elevated levels (Chart 1). A number of domestically designed mRNA vaccines are in phase 3 trials. However, it is not clear how effective they will be. Shanghai-based Fosun Pharma has inked a deal to distribute 100 million doses of Pfizer’s vaccine, but so far neither it nor Moderna’s vaccine have been approved for use. Our working assumption is that China will authorize the distribution of western-made mRNA vaccines later this year if its own offerings prove ineffectual. The Chinese government has already signed a deal to manufacture a generic version of Pfizer’s Paxlovid, which has been shown to cut the risk of hospitalization by 90% if taken within five days of the onset of symptoms. In the meantime, the authorities will continue to play whack-a-mole with Covid. Investors should expect more lockdowns during the remainder of the year. Problem #2: Weaker Export Growth China’s export growth slowed sharply in April, with manufacturing production contracting at the fastest rate since data collection began. Activity appears to have rebounded somewhat in May, but the new export orders components of both the official and private-sector manufacturing PMIs still remain below 50 (Chart 2). Part of the export slowdown is attributable to lockdown restrictions. However, weaker external demand is also a culprit, as evidenced by the fact that Korean export growth — a bellwether for global trade — has decelerated (Chart 3). Chart 2China’s Export Growth Has Rolled Over
China's Export Growth Has Rolled Over
China's Export Growth Has Rolled Over
Chart 3Softer Export Growth Is Not A China-Specific Phenomenon
Softer Export Growth Is Not A China-Specific Phenomenon
Softer Export Growth Is Not A China-Specific Phenomenon
Spending in developed economies is shifting from manufactured goods to services. Retail inventories in the US are now well above their pre-pandemic trend, suggesting that the demand for Chinese-made goods will remain subdued over the coming months (Chart 4). The surge in commodity prices is only adding to Chinese manufacturer woes. Input prices rose 10% faster than manufacturing output prices over the past 12 months. This is squeezing profit margins (Chart 5). Chart 4Well-Stocked Shelves In The US Bode Poorly For Chinese Export Demand
Well-Stocked Shelves In The US Bode Poorly For Chinese Export Demand
Well-Stocked Shelves In The US Bode Poorly For Chinese Export Demand
Chart 5Surging Input Costs Are Weighing On The Profits Of Chinese Commodity Users
Surging Input Costs Are Weighing On The Profits Of Chinese Commodity Users
Surging Input Costs Are Weighing On The Profits Of Chinese Commodity Users
A modest depreciation in the currency would help the Chinese export sector. However, after weakening from 6.37 in April to 6.79 in mid-May, USD/CNY has moved back to 6.66 on the back of the recent selloff in the US dollar. Chart 6The RMB Tends To Weaken When EUR/USD Is Rising
The RMB Tends To Weaken When EUR/USD Is Rising
The RMB Tends To Weaken When EUR/USD Is Rising
We expect the dollar to weaken further over the next 12 months as the Fed tempers its hawkish rhetoric in response to falling inflation. Chart 6 shows that the trade-weighted RMB typically strengthens when EUR/USD is rising. Chester Ntonifor, BCA’s Chief Currency Strategist, expects EUR/USD to reach 1.16 by the end of the year. Problem #3: Flagging Property Market Chinese housing sales, starts, and completions all contracted in April (Chart 7). New home prices dipped 0.2% on a month-over-month basis, and are up just 0.7% from a year earlier, the smallest gain since 2015. The percentage of households planning to buy a home is near record lows (Chart 8). Chart 7The Chinese Property Market Has Been Cooling
The Chinese Property Market Has Been Cooling
The Chinese Property Market Has Been Cooling
Chart 8Intentions To Buy A House Have Declined
Intentions To Buy A House Have Declined
Intentions To Buy A House Have Declined
China’s property developers are in dire straits. Corporate bonds for the sector are, on average, trading at 48 cents on the dollar (Chart 9). Goldman Sachs estimates that the default rate for property developers will reach 32% in 2022, up from their earlier estimate of 19%. The government is trying to prop up housing demand. The PBoC lowered the 5-year loan prime rate by 15 bps on May 20th, the largest such cut since 2019. The authorities have dropped the floor mortgage rate to a 14-year low of 4.25%. They have also taken steps to make it easier for property developers to issue domestic bonds. BCA’s China strategists believe these measures will foster a modest rebound in the property market in the second half of this year. However, they do not anticipate a robust recovery – of the sort experienced following the initial wave of the pandemic – due to the government’s continued adherence to the “three red lines” policy.1 China is building too many homes. While residential investment as a share GDP has been trending lower, it is still very high in relation to other countries. China’s working-age population is now shrinking, which suggests that housing demand will contract over the coming years (Chart 10). Chart 9Chinese Property Developer Bonds Are Trading At Distressed Levels
Chinese Property Developer Bonds Are Trading At Distressed Levels
Chinese Property Developer Bonds Are Trading At Distressed Levels
Chart 10Shrinking Working-Age Population Implies Less Demand For Housing
Shrinking Working-Age Population Implies Less Demand For Housing
Shrinking Working-Age Population Implies Less Demand For Housing
Chinese real estate prices are amongst the highest anywhere. The five biggest cities in the world with the lowest rental yields are all in China (Chart 11). The entire Chinese housing stock is worth nearly $100 trillion, making it the largest asset class in the world. As such, a decline in Chinese home prices would generate a sizable negative wealth effect. Chart 11Chinese Real Estate Is Expensive
China: A Trifecta Of Economic Woes
China: A Trifecta Of Economic Woes
A Silver Bullet? Trying to reflate the Chinese housing bubble would only damage the long-term prospects of China’s economy. Luckily, one does not need to fill a leaky bucket through the same hole the water escaped. As long as there is enough demand throughout the economy, workers who lose their jobs in declining sectors will eventually find new jobs in other sectors. China needs to reorient its economy away from its historic reliance on investment and exports towards consumption. The easiest way to do that is to adopt measures that boost disposable income, which has slowed of late (Chart 12). Not only would this help offset the drag from slowing export growth and a negative housing wealth effect, but it would also take some of the sting out of China’s zero-Covid policy. The authorities have not talked much about pursuing large-scale income-support measures of the kind adopted by many developed economies during the pandemic. As a result, market participants have largely dismissed this possibility. Yet, with the Twentieth Party Congress slated for later this year, the political incentive to shower the economy with cash will only intensify. Chinese equities are trading at only 10-times forward earnings and about 1-times sales (Chart 13). A significant upward rating for equity valuations is likely if the government adopts broad-based income-support measures. As we saw in the US and elsewhere, stimulus cash has a habit of flowing into the stock market; and with real estate in the doldrums, equities may become the asset class of choice for many Chinese investors. With that in mind, we are going long the iShares MSCI China ETF ($MCHI) as a tactical trade. Chart 12Disposable Income Growth Has Been Trending Lower
Disposable Income Growth Has Been Trending Lower
Disposable Income Growth Has Been Trending Lower
Chart 13Chinese Stocks Are Relatively Cheap
Chinese Stocks Are Relatively Cheap
Chinese Stocks Are Relatively Cheap
At a global level, a floundering Chinese property market would have been a cause for grave concern in the past, as it would have represented a major deflationary shock. Times have changed, however. The problem now is too much inflation, rather than too little. To the extent that reduced Chinese investment injects more savings into the global economy and knocks down commodity prices, this would be welcomed by most investors. China’s economy may be heading for a “beautiful slowdown.” Peter Berezin Chief Global Strategist peterb@bcaresearch.com Follow me on LinkedIn Twitter Footnotes 1 The People’s Bank of China and the housing ministry issued a deleveraging framework for property developers in August 2020, consisting of a 70% ceiling on liabilities-to-assets, a net debt-to-equity ratio capped at 100%, and a limit on short-term borrowing that cannot exceed cash reserves. Developers breaching these “red lines” run the risk of being cut off from access to new loans from banks, while those who respect them can only increase their interest-bearing borrowing by 15% at most. View Matrix
China: A Trifecta Of Economic Woes
China: A Trifecta Of Economic Woes
Special Trade Recommendations Current MacroQuant Model Scores
China: A Trifecta Of Economic Woes
China: A Trifecta Of Economic Woes
Executive Summary Crude Oil Prices Will Remain High
Crude Oil Prices Will Remain High
Crude Oil Prices Will Remain High
The EU embargo on Russian seaborne oil imports will tighten global crude oil and refined-product markets further. Pipeline imports are due to phase out by year-end. This will translate to a 90% decrease in Russian crude and product exports to the EU, representing ~ 3mm b/d of lost sales. Russian crude oil production will fall to 7-8mm b/d by year-end 2023, unless the state pre-emptively cuts output before that. This would push crude oil above $140/bbl. We expect Russia to reduce natural gas exports to the EU in the wake of the oil embargo. Refined-product markets will remain tight, given refining capacity losses, tight crude oil markets and still-strong gasoline and diesel demand. OPEC 2.0 is expected to maintain its policy to nominally increase oil supply by 432k b/d at its meeting this week. Actual oil output returned to the market by the coalition is ~ 1.5mm – 1.7mm b/d below nominal levels. Bottom Line: Oil markets will continue to tighten in the wake of the EU’s embargo on Russian imports this week. Refined-product markets will remain well bid, with prices of gasoline, jet and diesel fuel close to or above record levels. We remain long oil producers and refiners via the XOP and CRAK ETFs, along with the S&P GSCI and COMT ETF, to retain exposure to higher commodity prices and backwardation. Feature Global refined-product markets are tight and getting tighter. Related Report Commodity & Energy StrategyOil, Natgas Prices Set To Surge As the Northern Hemisphere driving season gets underway, gasoline and diesel prices in the US are at record levels – up 56.55% and 70.17% respectively yoy. So are jet-fuel prices, which are up 107.97% yoy in the US. Prices are similarly robust ex-US and trading at or close to record levels. During the COVID-19 pandemic, the US permanently lost ~ 5% of total refining capacity. Currently, three of the largest refineries in the US are working on replenishing less than half of that loss by end-2023, which will take total US refining capacity to under 18.5mm b/d. US gasoline stocks are low for this time of the year. Markets expect higher demand this driving season, which unofficially ends in early September with the Labor Day weekend in the US. The US went into the Memorial Day Weekend – the start of the summer driving season – with record high motor gas prices (Chart 1). Gasoline stocks normally build in the off-season winter months. However, this year inventories are depleted (Chart 2) because of relatively high distillate “crack spreads” – gross refining margins – which incentivized refiners to produce more diesel, jet and marine fuels.1 This meant gasoline output was sacrificed in the process, which left markets tight going into the summer driving season.2 Chart 1High Gas Prices Bring In US Driving Season
High Gas Prices Bring In US Driving Season
High Gas Prices Bring In US Driving Season
US distillate crack spreads are at record highs, after stocks hit a 14-year low last month (Chart 3). Reduced oil refinery capacity will constrict future supply, keeping prices elevated, which will feed into inflation. Demand destruction will be required to balance markets and bring prices lower. Chart 2Depleted Stocks Due To Low Gasoline Margins
Higher Gasoline, Diesel Prices Ahead
Higher Gasoline, Diesel Prices Ahead
Chart 3Low Distillate Stocks Produce Record Cracks
Higher Gasoline, Diesel Prices Ahead
Higher Gasoline, Diesel Prices Ahead
Tight Supply-Demand Fundamentals, High Prices US refined-product prices have been strengthening since 2021 due to high crude oil prices, rising demand and lower refinery capacity and utilization rates. This keeps the level of demand for refined products consistently above the level of supply, which forces refiners to pull down inventories or increase imports to cover the supply-demand gaps. Higher refined-product prices ensue as inventories fell. As a result, crack spreads were pushed higher to encourage higher output, which remains problematic because of supply-side pressure in global crude-oil markets (Chart 4). Crude oil prices account for 60% of gasoline and 49% of diesel costs, respectively.3 Last year OPEC 2.0’s production-management strategy kept the level of crude oil supply below demand, but this year additional forces are constraining output. Supply disruptions following Russia’s invasion of Ukraine, lower OPEC 2.0 production, and non-OPEC capital discipline, particularly from US shale-oil producers, have combined to constrain crude-oil production. We expect continued production restraint by core OPEC 2.0 (Saudi Arabia and the UAE); lower output from the rest of the coalition; falling Russian supply due to sanctions and an EU embargo on Russian oil imports; and continued capital discipline by shale producers. These factors will offset weaker global oil demand resulting from slower GDP growth in the EU and China. Chart 4Supply Will Barely Rise Despite High Margins
Higher Gasoline, Diesel Prices Ahead
Higher Gasoline, Diesel Prices Ahead
Volatile supply-demand dynamics will keep crude oil prices elevated this year and next (Chart 5).4 The EU’s embargo on Russian oil, in particular, will raise oil-price volatility, and leave prices upwardly biased. Lastly, we do not expect the US and Iran to renew the Joint Comprehensive Plan of Action (JCPOA), which would allow ~ 1mm b/d of Iranian exports to return to the market. Chart 5Crude Oil Prices Will Remain High
Crude Oil Prices Will Remain High
Crude Oil Prices Will Remain High
Tighter Product Markets Will Persist Refined-product stocks in the US and the rest of the world were low prior to Russia’s invasion of Ukraine, owing to strong demand growth and weak crude-oil supply growth last year, along with lower global refining capacity. US refinery utilization rates last year and earlier this year fell as refiners undertook heavier-than-usual maintenance, which was deferred during the pandemic (Chart 6). Refiners also closed ~ 1mm b/d in 2020 during the COVID-19 pandemic, which resulted in ~ 5% of US refining capacity being shut-in at the start of 2021.5 Global refining capacity has fallen by more than 2mm b/d since the COVID-19 pandemic.6 As midterm elections approach, the Biden administration has been urging refiners to restart idle capacity to little or no avail, and has threatened to re-introduce export restrictions on crude oil in an attempt to hold down gasoline and diesel prices. Chart 6US Refiners Were Shut-In For Maintenance
Higher Gasoline, Diesel Prices Ahead
Higher Gasoline, Diesel Prices Ahead
Gasoline markets are going into their first summer without COVID-19 restrictions since 2020. While US data for the first 3 months of 2022 suggest Americans’ gasoline consumption was more price-inelastic than in the past (Chart 7), a series of record-breaking gasoline prices recently may have been enough to start curbing US gasoline demand (Chart 8). All the same, US consumers appear to be willing to pay up for holiday breaks and get-aways, which will keep pressure on inventories during the summer driving season. Chart 7US Gasoline Demand Price Inelastic In Q1…
Higher Gasoline, Diesel Prices Ahead
Higher Gasoline, Diesel Prices Ahead
Chart 8…But Record Breaking Prices May Change That
Higher Gasoline, Diesel Prices Ahead
Higher Gasoline, Diesel Prices Ahead
Jet, Diesel Remain Tight, Especially In Europe The approval of an embargo on Russian oil imports into the EU earlier this week means member states on the continent that rely heavily on Russian distillate exports will remain exposed to higher refined-product prices (Chart 9).7 This will keep European diesel prices and crack spreads elevated this year and next (Chart 10). Chart 9EU Dependent On Russia For Diesel
Higher Gasoline, Diesel Prices Ahead
Higher Gasoline, Diesel Prices Ahead
Chart 10Europe Refining Margins Will Remain Elevated
Higher Gasoline, Diesel Prices Ahead
Higher Gasoline, Diesel Prices Ahead
Shipping markets also will continue to feel the pressure of higher prices, particularly for marine diesel fuel. Russia’s invasion of Ukraine forced insurance rates higher, which propelled shipping-rates higher in Europe and Russia (Chart 11). The EU is now slapping sanctions on insurers. In addition, the Ukraine war forced a re-routing of ships and port congestion, which led to massive supply-chain disruptions due to closures and blockades.8 High refined-product prices partly is the result of European refineries either permanently shutting in production or switching to renewable energy production when faced with low Covid-19-induced demand in 2020. In the first half of 2021, as product demand started to rise, the parabolic increase in prices of natgas – used as a fuel by refiners – was an additional headwind to refining margins. Chart 11Cost Of Shipping Crude, Products Surges
Higher Gasoline, Diesel Prices Ahead
Higher Gasoline, Diesel Prices Ahead
As of last December, more than 800 kb/d – or 5% of the continent’s refining capacity – was permanently taken offline during the pandemic.9 As a result, OECD Europe’s refining capacity for 2022 will be 11.4 mmb/d, ~ 0.8 mmb/d below pre-pandemic levels.10 Europe will need to look elsewhere for distillates. Attempting to substitute refined products in such tight energy markets will not be cheap. Sourcing imports from other states will tighten exporters’ domestic refined product markets and dislocate distillate supply to their traditional importers, which will tighten those states’ domestic markets as well. This could lead to something similar to what we are currently witnessing in LNG markets between Europe and Asia. The US, despite having its own tight refined products market, likely will step up as an alternate supplier to fill the Russian distillate supply void for states reliant on Russian diesel, jet and marine fuels. This can be seen in the 32-month high in Gulf Coast diesel exports from the US, which are the result of stronger imports by Europe and LatAm.11 Investment Implications The EU embargo on Russian oil imports will tighten global refined-product markets. If Russia retaliates by pre-emptively cutting crude oil production by 20-30%, prices would significantly exceed our forecast of $113/bbl this year and $122/bbl next year – reaching or surpassing $140/bbl. Refined-product markets will remain well bid, with prices of gasoline, jet and diesel fuel close to or above record levels. We remain long oil producers and refiners via the XOP and CRAK ETFs, along with the S&P GSCI and COMT ETF, to retain exposure to higher commodity prices and backwardation. Ashwin Shyam Research Analyst Commodity & Energy Strategy ashwin.shyam@bcaresearch.com Paula Struk Research Associate Commodity & Energy Strategy paula.struk@bcaresearch.com Robert P. Ryan Chief Commodity & Energy Strategist rryan@bcaresearch.com Commodities Round-Up Energy: Bullish We continue to expect Russia to cut off natural gas exports to the EU in retaliation for the embargo on EU oil imports from Russia agreed this week. The timing of this cut-off is uncertain, however. As our colleague Matt Gertken notes in this week’s Geopolitical Strategy, Russia and the EU both would benefit if exports were maintained as long as possible and phased down slowly. This would provide Russia with revenues to wage war in Ukraine, while allowing Europe to avoid recession as it phases out Russian gas. This is not an equilibrium, however, as it leaves both sides exposed to a sudden reversal of the tacit understanding. In equilibrium – i.e., the strategies that guarantee the EU and Russia lose the least – both states reduce their energy trade immediately. Russia needs to show strength in the face of the EU’s embargo, and Europe needs to cut the revenues fueling Russia’s war in Ukraine, which also will deter similar aggression against member states in the future. As soon as the EU weans itself off Russian natgas, Russia’s leverage disappears. If Europe does not diversify immediately, Russia can punish it severely by cutting off energy before it is prepared. (Chart 12). In the meantime, the EU is moving heaven and earth to fill its natgas storage as quickly as possible (Chart 13). According to the GIE AGSI, the percent-full level was 46.68% as of May 30, 2022. Precious Metals: Bullish Gold prices pared losses last Wednesday after the Federal Open Market Committee’s (FOMC) minutes of the May meeting indicated the Fed will not raise rates by more than the half percentage points markets had priced in for June and July. Recent weakness in gold prices despite heightened geopolitical uncertainty can be attributed to the Fed’s tightening cycle. Rate hikes will increase real interest rates, the opportunity cost of holding non-yielding bullion and strengthen the USD, which competes directly with gold for safe-haven demand, and will also raise the price of gold in local currencies. Base Metals: Bullish Chile’s National Institute of Statistics reported the country’s Mining Production Index fell 10.6% year-over-year (y-o-y) in April, dragging the country’s overall Industrial Production Index lower by 3.6% y-o-y. The drop in mining was due to a 9.8% fall in copper production y-o-y. The contraction in mined copper output this month follows y-o-y contractions of 15%, 7% and 7.2% in January, February and March respectively this year. Chart 12
Higher Gasoline, Diesel Prices Ahead
Higher Gasoline, Diesel Prices Ahead
Chart 13
Higher Gasoline, Diesel Prices Ahead
Higher Gasoline, Diesel Prices Ahead
Footnotes 1 The “crack spread” (or “cracks”) is an industry term for gross margins. It derives its name from the literal cracking of the bonds holding the hydrocarbon molecules of crude oil together under intense heat and pressure, and reforming them into refined products like gasoline and diesel fuel and other liquids and gases. The crack spread is the difference between the price of a refined product and crude oil in USD/bbl. 2 In this report, we focus on diesel fuel and gasoline. Low stocks, high prices and high crack spreads are a feature of jet-fuel markets as well. 3 Please see the US EIA’s May 2022 Gasoline and Fuel Update. 4 Please see Oil, Natgas Prices Set To Surge published on May 19, 2022 for our latest balances and price forecasts. 5 Please see the U.S. EIA’s 30 June, 2021 edition of This Week In Petroleum. 6 Please see White House Eyes Restarting Idle Refineries, published by ttnews.com on May 26, 2022. 7 Please see Breakingviews: Oil embargo will hurt Putin more than EU, published by reuters.com on May 31, 2022. 8 For more on this, please refer to High Food Prices Drive EM Inflation, which we published on May 12, 2022. 9 Please see Viewpoint: European refiners cautious on cusp of 2022, published by Argus Media on December 30, 2021. 10 Please see the IEA’s January 2022 Oil Market Report. 11 Please see to PADD 3 diesel exports reach 32 month high as the competition for the non-Russian molecule begins, published by Vortexa on May 4, 2022. Investment Views and Themes Strategic Recommendations Tactical Trades Trades Closed in 2022
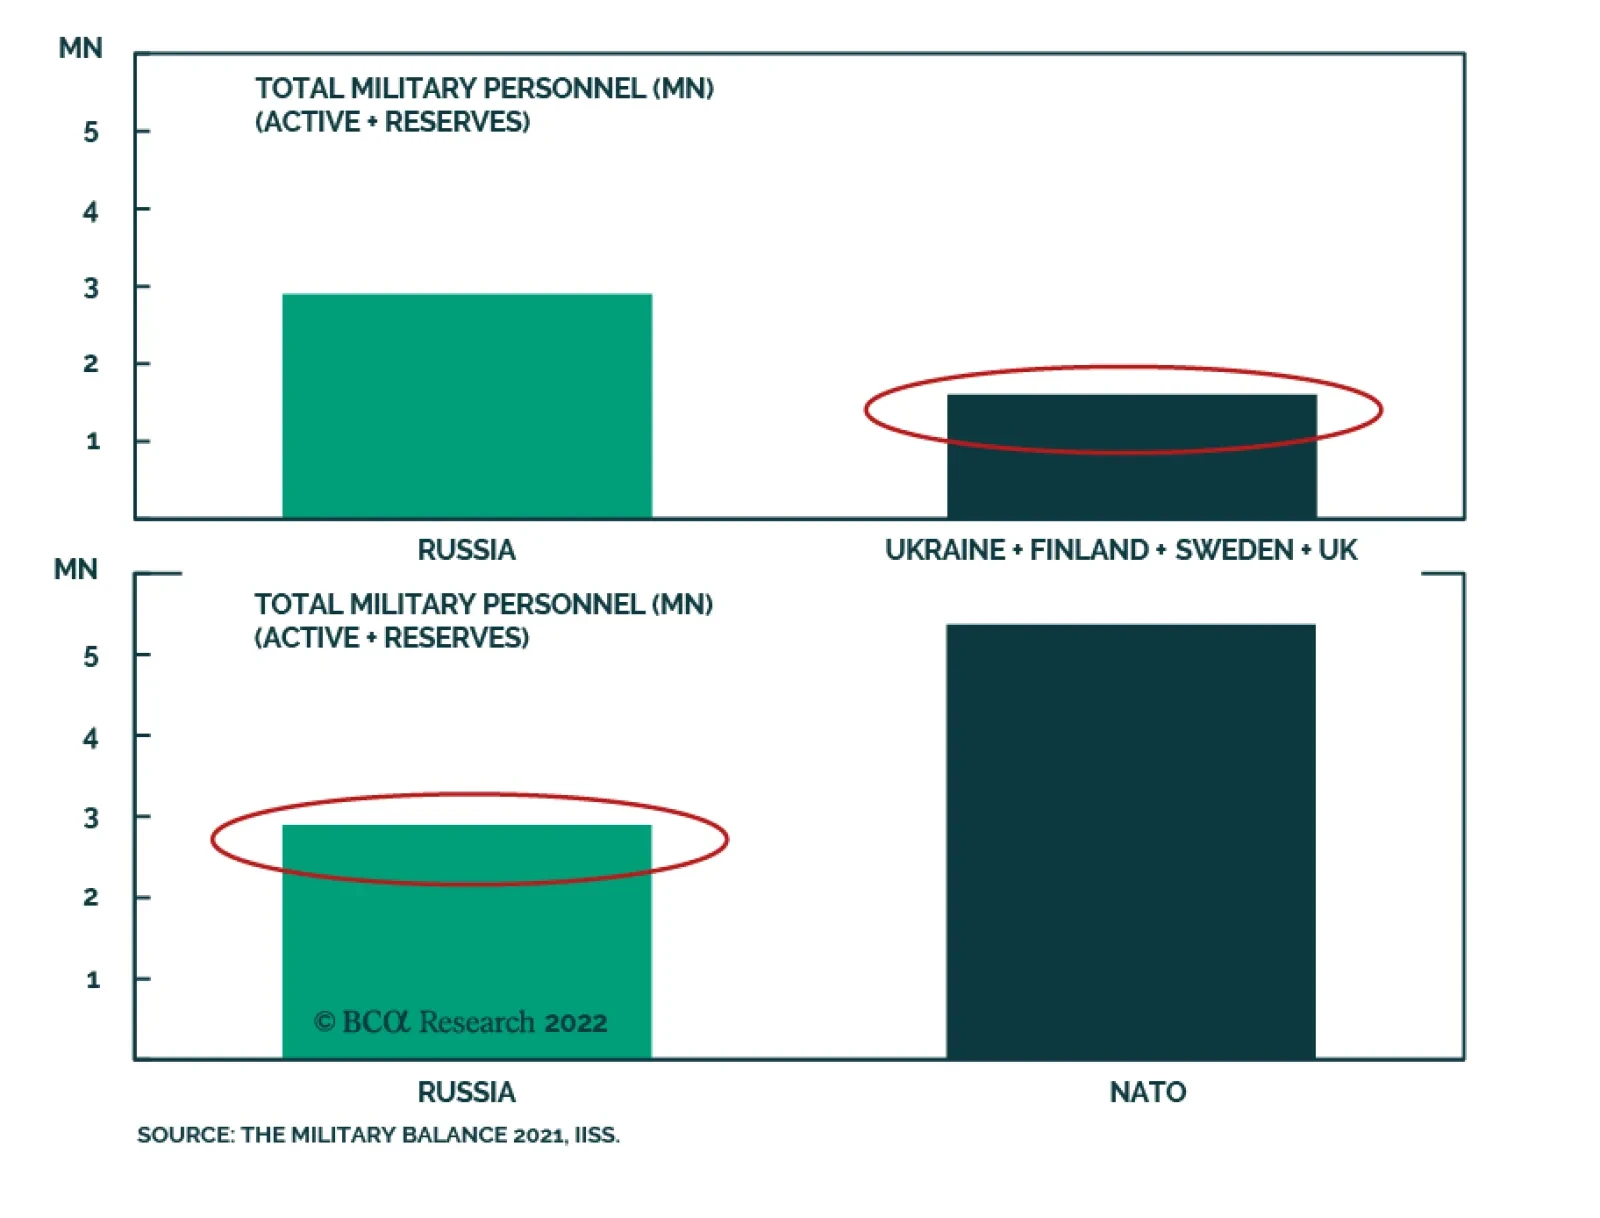
According to BCA Research’s Geopolitical Strategy service, even assuming that the war does not spread beyond Ukraine – likely but not certain – global financial markets face at least one more period of military escalation with Russia. Russian retaliation…