Emerging Markets

Executive Summary What Will Be The Implications Of China’s Common Prosperity Policies?
What Will Be The Implications Of China's Common Prosperity Policies?
What Will Be The Implications Of China's Common Prosperity Policies?
On the one hand, Chinese stocks are oversold, equity valuations are attractive and investor sentiment is downbeat. This means that a lot of bad news has already been priced into Chinese share prices, which is positive from a contrarian perspective. On the other hand, the government remains committed to its dynamic zero-COVID policy and will resort to lockdowns whenever there is an outbreak. The Omicron variants have extremely high transmission rates, which means that the probability of new lockdowns is non trivial. Hence, the biggest risk to Chinese share prices is renewed outbreaks and lockdowns – developments which are impossible to forecast. That is why, in our opinion, Chinese stocks are facing fat tails risks. Infrastructure spending will recover modestly in H2 2022. The property sector rebound will be very muted. Chinese exports will contract. The structural outlook is unfriendly for shareholders of platform companies. The known unknowns are: Will the dynamic zero-COVID policy be successful in containing the virus? Will “animal spirits” among consumers and businesses be revived? Will western investors come back to Chinese stocks? The RMB is facing near-term risks as its interest rate differential versus the US dollar dips deeper into negative territory. Bottom Line: For absolute return investors, one way to play such a bifurcated market outlook is to buy out-of-money call options and out-of-money put options simultaneously while maintaining a core / benchmark allocation in Chinese stocks. We maintain our long A-shares / short investable Chinese stocks strategy. Feature As strict lockdowns in key cities are lifted, the Chinese economy is bound for a snap back. Consumer spending will improve, and the government’s infrastructure push will revive capital spending modestly. What does this mean for Chinese stocks? Numerous crosscurrents make the current outlook for Chinese stocks hard to navigate. This report elaborates on variables that we can forecast and those we cannot. Odds of a material rally are not insignificant, but the probability of another relapse is not trivial either. That is why Chinese stocks presently have fat tails. For absolute return investors, one way to play such a bifurcated market outlook is to buy out-of-money call options and out-of-money put options simultaneously while maintaining a core/ benchmark allocation in Chinese stocks. The rationale for maintaining a neutral position is that Chinese share prices could also be range-bound in the coming months. In other words, positives could offset negatives, and the fat tails outcomes might not transpire. In regard to relative performance and regional allocation, we continue to recommend that emerging market portfolios overweight Chinese A-shares and maintain a neutral stance on investable stocks. Meanwhile, global equity portfolios should remain neutral on A-shares while underweighting investable ones. This positioning is consistent with our overall EM allocation – we continue to recommend underweighting EM within a global equity portfolio. What We Know Equity Valuations And Investor Sentiment Are Depressed To begin with, there are a number of indicators that point to low equity valuations and depressed investor sentiment towards Chinese stocks: Analysts’ net EPS revisions for both Chinese A-shares and investable stocks have plunged deep into negative territory (Chart 1). Chinese net EPS revisions are also low relative to EM and global stocks (Chart 2). Chart 1Sentiment On Chinese Stocks Is Downbeat
Sentiment On Chinese Stocks Is Downbeat
Sentiment On Chinese Stocks Is Downbeat
Chart 2Net EPS Revisions: China vs. EM And China vs. Global Stocks
Net EPS Revisions: China vs. EM And China vs. Global Stocks
Net EPS Revisions: China vs. EM And China vs. Global Stocks
The average of the NBS manufacturing PMI new orders and backlog of orders suggests that A-shares EPS will shrink considerably (Chart 3). A-share valuations have become attractive. Our composite valuation indicator points to below average valuations (Chart 4, top panel). This indicator is based on three variables: (1) median multiples; (2) 20% trimmed-mean multiples; and (3) equal-weighted multiples. The latter uses equal weights rather than market cap weights for sub-sectors in the calculation. Chart 3China: Corporate Profits Are Contracting
China: Corporate Profits Are Contracting
China: Corporate Profits Are Contracting
Chart 4Chinese A-Shares Are Attractive
Chinese A-Shares Are Attractive
Chinese A-Shares Are Attractive
In turn, each component is constructed using the averages of the trailing P/E, forward P/E, price-to-cash earnings, price-to-book value (PBV) and price-to-dividend ratios. The 20%-trimmed mean excludes the top 10% and the bottom 10% of sub-sectors, i.e., it removes outliers. Our cyclically adjusted P/E ratio for A-shares currently stands at close to one standard deviation below its mean (Chart 4, bottom panel). The trailing and forward P/E ratios for the equal-weighted A-share index are 18 and 12, respectively. As to the investable universe, any valuation measure for the index is not useful because banks and SOEs continue to be “cheap” for a reason. In turn, internet stocks are fallen angels and their past valuations are not a good roadmap for the future. We discuss the structural outlook for their profitability below. Chart 5Chinese Investable Stocks Have Reached Technical Support Lines
Chinese Investable Stocks Have Reached Technical Support Lines
Chinese Investable Stocks Have Reached Technical Support Lines
Finally, Chinese equities have become oversold. Investable non-TMT share prices are back to their lows of the past 12 years while TMT/growth stocks are at their long-term moving average (Chart 5). In sum, a lot of bad news has already been priced into Chinese share prices, which is positive from a contrarian perspective. Dynamic Zero-COVID Policy We have a very high conviction level that the government will remain committed to its dynamic zero-COVID policy for now. COVID cases in Shanghai and Beijing have declined following the lockdowns. This will only embolden authorities to pursue their dynamic zero-COVID policy and resort to lockdowns whenever outbreaks occur. Consistent with the dynamic zero-COVID policy, the government will inject more stimulus into the economy to offset the negative impact of past and potential future lockdowns. With inflation very subdued, the central government will not shy away from stimulating demand. In fact, the PBoC is allegedly resorting to “window guidance”, i.e., instructing banks to increase their loan origination. However, we do not have a high conviction view on: (1) whether lockdowns could prevent the virus from spreading and (2) whether stimulus will lift household and business confidence and their willingness to consume and invest. See more on this below. Infrastructure Investment Will Recover Modestly So far, the data does not suggest that a recovery in infrastructure investment is underway. Chart 6 illustrates that the number of investment projects approved by National Development and Reform Commission and the length of newly installed electricity transmission lines are not yet rising (Chart 6). Also, steel bar and cement prices are falling despite low output of these materials (Chart 7). This signifies very weak demand. Chart 6Few Signs of Recovery In Infrastructure Investment
Few Signs of Recovery In Infrastructure Investment
Few Signs of Recovery In Infrastructure Investment
Chart 7Falling Prices of Raw Materials = Weak Demand
Falling Prices of Raw Materials = Weak Demand
Falling Prices of Raw Materials = Weak Demand
Furthermore, land sales make up 40% of local government revenue and the value of land sales is down substantially from a year ago. Lower land sales weighing on local government finances and their ability to spend. Nevertheless, odds are that the central government will force local governments to boost infrastructure investment modestly by providing more funding and increasing their special bond issuance quota. For example, Beijing ordered state-owned policy banks to set up an 800 billion yuan ($120 billion) line of credit for infrastructure projects. Chart 8A Snapback in Home Sales Is Possible
A Snapback in Home Sales Is Possible
A Snapback in Home Sales Is Possible
That said, a revival in traditional infrastructure investment will be more muted than it has been in past cycles. Beijing has been very clear in recent years that local governments should not pursue inefficient debt-fueled infrastructure spending, to the point that local officials have been warned that they will be held responsible for debt-financed spending during their lifetime, i.e., even after they retire from their positions. This risk – and the lack of funding due to the shortfall in land sales – will structurally limit local governments’ capacity and drive to invest in traditional infrastructure. The Property Sector Rebound Will Be Muted Residential property sales will likely tick up after having crashed by 30% in the past 12 months (Chart 8). Yet, this will be a mean-reversion rebound rather a full-fledged cyclical recovery. Even though authorities have been easing restrictions for property buyers, any rebound in home sales and construction activity will be modest for the following reasons: The economic slump of the past 12 months and recent lockdowns have weighed on household incomes, which will hinder demand. Housing remains unaffordable for many households who live in poor conditions. Meanwhile, many affluent households already own multiple properties. A lack of confidence in the outlook for house prices will reduce high-income household’s willingness to invest in new properties. Even though restrictions have eased, property developers – which have experienced a major crackdown, are still overleveraged, and face uncertain housing demand – will be reluctant to increase their debt and start new projects. Rather, the lack of funding for property developers points to a major drop in completions in the near term (Chart 9). As we argued in the report titled China: Is The Property Carry Trade Over?, the real estate market is experiencing a structural breakdown, rather than a cyclical one. The performance of property developers stocks supports this hypothesis (Chart 10, top panel). As such, any recovery will be tame and fragile. Chart 9Shrinking Property Developer Funding = Less Housing Completion
Shrinking Property Developer Funding = Less Housing Completion
Shrinking Property Developer Funding = Less Housing Completion
Chart 10Structural Breakdowns in Stocks And Bonds Of Property Developers
Structural Breakdowns in Stocks And Bonds Of Property Developers
Structural Breakdowns in Stocks And Bonds Of Property Developers
In addition, the prices of property developers offshore bonds remain in a clear downtrend (Chart 10, bottom panel). Exports Are Set To Contract Chinese exports will contract in H2 2022 due to reduced spending on goods in the US and Europe as well as in the developing world. Specifically, in the US and euro area, consumption of goods ex-autos boomed during the pandemic and will revert to their means as households spend more on services and less on goods (Chart 11). Declining real household disposable income will also reinforce this trend (Chart 12). Chart 11US and Euro Area ex-Auto Goods Consumption Will Shrink
US and Euro Area ex-Auto Goods Consumption Will Shrink
US and Euro Area ex-Auto Goods Consumption Will Shrink
Chart 12US And Euro Area Household Real Disposable Income Is Contracting
US and Euro Area Household Real Disposable Income Is Contracting
US and Euro Area Household Real Disposable Income Is Contracting
In fact, US retail inventory of goods ex-autos has already surged (Chart 13). As retailers cut back on their new orders, Chinese exports will contract materially. Chart 13US Retail Goods ex-Auto Inventories Have Swelled
US Retail Goods ex-Auto Inventories Have Swelled
US Retail Goods ex-Auto Inventories Have Swelled
In addition, domestic demand in developing economies will also disappoint. EM household spending on consumer goods will underwhelm as more of their income is spent on food and energy. Also, high and rising local interest rates will curb credit origination in mainstream emerging economies. Consequently, their capital spending, employment and income growth will remain subdued. In China, exports as a share of GDP has increased to 19% from 17.5% in 2019. Hence, a contraction in exports will be painful for the overall economy. The Structural Outlook Is Unfriendly For Shareholders Of Platform Companies The government has toned down its rhetoric and its actions related to platform/internet companies. However, we view this development as a tactical rather than a structural change. The key economic policymaker Liu He made market friendly statements towards platform companies on March 16 and May 17 when their share prices were plunging. We believe that the aim of his comments was solely to calm the market and restore investor confidence. We maintain that the structural outlook for shareholders of platform companies remains negative for the following reasons: Higher uncertainty about their business model = higher equity risk premium = lower equity multiples. The government will be regulating their profitability like those of monopolies and oligopolies, which justifies lower multiples. These companies will be performing social duties – i.e. redistributing profits from shareholders to the Chinese people. Beijing’s involvement in their management and the prioritization of national and geopolitical objectives over shareholder interests. Risks of delisting from US stock exchanges are significant. Common prosperity policies pose a risk to the broader corporate sector. These policies will redistribute national income from corporates to households. Chart 14 illustrates that the share of employee compensation has been rising and the share of corporate profits in national income has been falling since 2011-12. These trends will be reinforced by common prosperity policies in the coming years. This is an negative development for shareholders of Chinese companies. Chart 14What Will Be The Implications Of China's Common Prosperity Policies?
What Will Be The Implications Of China's Common Prosperity Policies?
What Will Be The Implications Of China's Common Prosperity Policies?
The Known Unknowns Will The Dynamic Zero-COVID Policy Be Successful? The biggest risk to Chinese share prices is renewed virus outbreaks and lockdowns. It is impossible to forecast these risks. That is why, in our opinion, Chinese stocks are facing fat tail risks. On the one hand, Omicron variants have extremely high transmission rates, making the virus very hard to contain. On the other hand, the government has shown that its dynamic zero-COVID policy has for now succeeded in containing the virus in both Shanghai and Beijing. It is certain, however, that the Chinese economy will incur considerable costs to prevent Omicron from spreading. In addition to the financial costs of ongoing widespread testing, there are also logistical impediments and inefficiencies that these testing and verification policies introduce, even in the absence of lockdowns. Will “Animal Spirits” Among Consumers And Businesses Revive? Another major unknown is whether confidence among consumers and businesses will recover so that they resume spending. If private sector sentiment remains weak, then stimulus measures will have a low multiplier. In other words, the ongoing stimulus will likely fail to boost economic activity. Our proxies for marginal propensity to spend by households and enterprises have been very depressed (Chart 15). Other sentiment/confidence surveys convey the same message. Further, credit demand is non-existent. Banks have lately been buying corporate acceptance bills to fulfill their loan quota (Chart 16). Chart 15Chinese Households And Enterprises Are Reluctant To Spend More
Chinese Households And Enterprises Are Reluctant To Spend More
Chinese Households And Enterprises Are Reluctant To Spend More
Chart 16China: Banks Bought Refinancing Bills in April To Make Their Loan Quota
China: Banks Bought Refinancing Bills in April To Make Their Loan Quota
China: Banks Bought Refinancing Bills in April To Make Their Loan Quota
Critically, the property market has always been a key determinant of overall consumer and business sentiment. Since 2008, there has been no recovery in the Chinese economy without a recovery of property sales, prices and construction (Chart 17). We are doubtful that property sales and construction will stage a strong recovery in the next six to nine months. Thus, our bias is that the multiplier effect of Chinese stimulus will underwhelm in the coming months. Will Western Investors Come Back To Chinese Stocks? Geopolitical tensions between the US and China and the events around the US-Russia clash reduce the likelihood that western investors will come back to Chinese markets, even as growth prospects improve. Chart 18 demonstrates that foreign investors have only marginally reduced their holdings of Chinese onshore stocks (A-shares) and bonds. These data encompass not only western investors, but also investors from other emerging Asian countries. Chart 17China: Housing Cycle = Business Cycle
China: Housing Cycle = Business Cycle
China: Housing Cycle = Business Cycle
Chart 18Foreigners Sold A Small Portion Of Their Onshore Equity and Bond Holdings
Foreigners Sold A Small Portion Of Their Onshore Equity and Bond Holdings
Foreigners Sold A Small Portion Of Their Onshore Equity and Bond Holdings
The risk is that western investors will use any rebound in Chinese shares to reduce their exposure. This will weigh on investable stocks and preclude any significant and durable rally. A Word On The Exchange Rate The RMB will remain volatile in the coming months and will likely depreciate further against the US dollar: Shrinking exports will weigh on foreign exchange availability from exporters. With Asian currencies depreciating against the US, Beijing will be willing to tolerate moderate and gradual yuan depreciation against the greenback to maintain its export competitiveness. The one-year interest rate differential between China and the US has recently turned negative which has probably triggered a shift of deposits from RMB into the USD (Chart 19). In Hong Kong, deposits have recently begun shifting from yuan to HKD, i.e., USD (Chart 20). This development has coincided with the China-US, and hence, China-HK, interest rate differential turning negative. Chart 19China-US: The Interest Rate Differential Has Turned Negative
China-US: The Interest Rate Differential Has Turned Negative
China-US: The Interest Rate Differential Has Turned Negative
Chart 20A Shift From RMB To HKD or USD Deposits
A Shift From RMB To HKD or USD Deposits
A Shift From RMB To HKD or USD Deposits
Finally, there will be more foreign capital outflows if either (1) COVID outbreaks and, hence, lockdowns persist, or (2) US-China tensions escalate. As Chart 18 above illustrates, foreign portfolio capital outflows have so far been modest. Bottom Line: The near-term outlook for the US dollar remains positive as the Fed maintains its hawkish stance. Consistently, the RMB will struggle in the near term but its multi-year outlook is positive. Investment Recommendations The outlook for Chinese stocks is characterized by fat tails. Odds of a material rally are not insignificant but also the probability of another relapse is not trivial either. For absolute return investors, one way to play such a bifurcated market outlook is to buy out-of-money call options and out-of-money put options simultaneously while maintaining a core / benchmark allocation in Chinese stocks. In regard to relative performance /regional allocation, we continue to recommend that emerging market portfolios overweight Chinese A-shares and maintain a neutral stance towards investable stocks. Meanwhile, global equity portfolios should remain neutral on A-shares while underweighting investable ones. This positioning is in-line with our overall EM allocation – we continue to recommend underweighting EM within a global equity portfolio. Consistently, we maintain our long A-shares / short investable Chinese stocks strategy. Onshore government bond yields will continue sliding as the main problem in China is deflation and weak growth, not inflation. The RMB is facing near term risks as its interest rate differential versus the US dollar dips deeper into negative territory. Arthur Budaghyan Chief Emerging Markets Strategist arthurb@bcaresearch.com
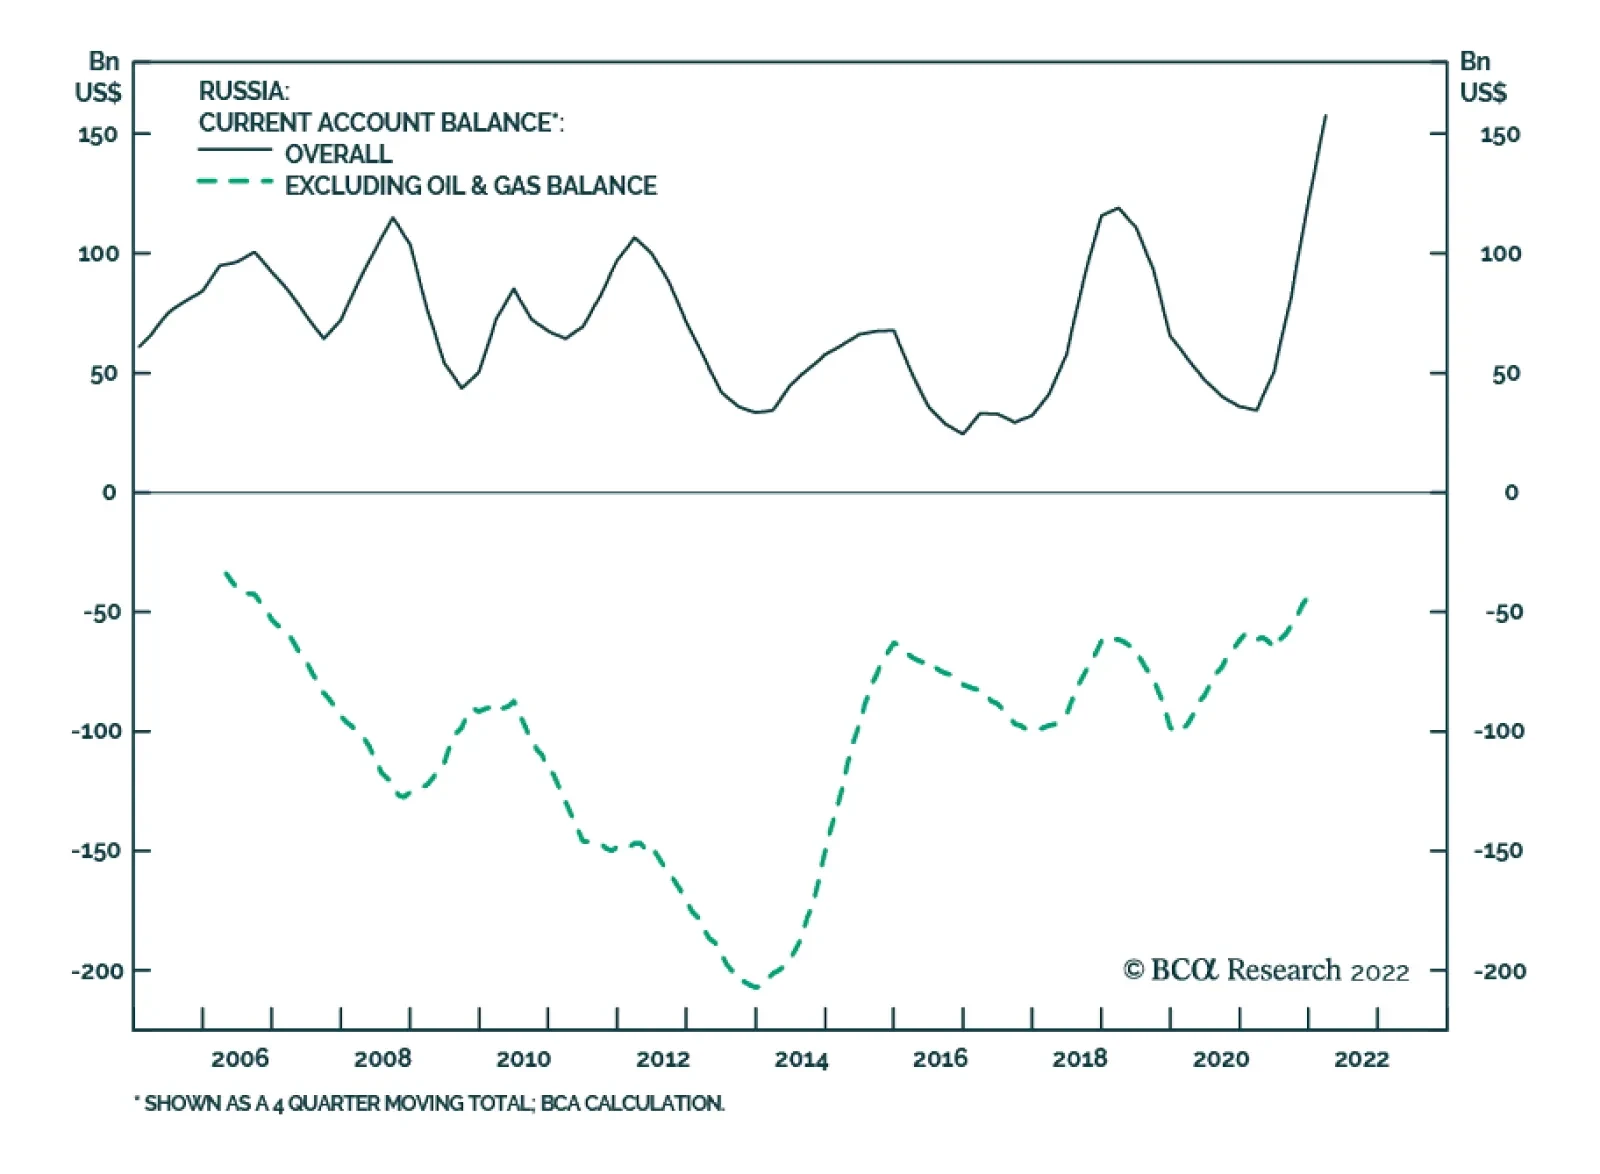
The Russian ruble has been the strongest currency in the world versus the US dollar since early March, following the invasion of Ukraine. Yet, the ruble’s performance is not a sign of economic strength. Rather, the reason for the currency’s appreciation is…
Executive Summary EU Embargoes Russian Oil
Energy Cutoff Continues (GeoRisk Update)
Energy Cutoff Continues (GeoRisk Update)
The EU imposed an embargo on 90% of Russian oil imports, which will provoke retaliation. Russia will squeeze Europe’s economy ahead of critical negotiations over the coming 6-12 months. Russian gains on the battlefield in Ukraine point to a ceasefire later, but not yet – and Russia will need to retaliate against NATO enlargement. The Middle East and North Africa face instability and oil disruptions due to US-Iran tensions and Russian interference. China’s autocratic shift is occurring amid an economic slowdown and pandemic. Social unrest and internal tensions will flare. China will export uncertainty and stagflation. Inflation is causing disparate effects in South Asia – instability in Pakistan and Sri Lanka, and fiscal populism in India. Asset Initiation Date Return Long Brazilian Financials / Indian Equities (Closed) Feb 10/22 22.5% Bottom Line: Markets still face three geopolitical hurdles: Russian retaliation; Middle Eastern instability; Chinese uncertainty. Feature Global equities bounced back 6.1% from their trough on May 12 as investors cheered hints of weakening inflation and questioned the bearish consensus. BCA’s Global Investment Strategy correctly called the equity bounce. However, as BCA’s Geopolitical Strategy service, we see several sources of additional bad news. Throughout the Ukraine conflict we have highlighted two fundamental factors to ascertain regarding the ongoing macroeconomic impact: Will the war cut off the Russia-EU energy trade? Will the war broaden beyond Ukraine? Chart 1Russian-Exposed Assets Will Suffer More
Russian-Exposed Assets Will Suffer More
Russian-Exposed Assets Will Suffer More
In this report we update our views on these two critical questions. The takeaway is that the geopolitical outlook is still flashing red. The US dollar will remain strong and currencies exposed to Russia and geopolitical risk will remain weak (Chart 1). In addition, China’s politics will continue to produce uncertainty and negative surprises this year. Taken together, investors should remain defensive for now but be ready to turn positive when the market clears the hurdles we identify. The fate of the business cycle hangs in the balance. Energy Ties Eroding … Russia Will Retaliate Over Oil Embargo Chart 2AEU Embargoes Russian Oil
Energy Cutoff Continues (GeoRisk Update)
Energy Cutoff Continues (GeoRisk Update)
Europe is diversifying from Russian oil and natural gas. The European Union adopted a partial oil embargo on Russia that will cut oil imports by 90% by the end of 2022. It also removed Sberbank from the SWIFT banking communications network and slapped sanctions on companies that insure shipments of Russian crude. The sanctions will cut off all of Europe’s seaborne oil imports from Russia as well as major pipeline imports, except the Southern Druzhba pipeline. The EU made an exception for landlocked eastern European countries heavily dependent on Russian pipeline imports – namely Hungary, Slovakia, the Czech Republic, and Bulgaria (Chart 2A). Focus on the big picture. Germany changed its national policy to reduce Russian energy dependency for the sake of national security. From Chancellors Willy Brandt to Angela Merkel, Germany pursued energy cooperation and economic engagement as a means of lowering the risk of war with Russia. Ostpolitik worked in the Cold War, so when Russia seized Crimea in 2014, Merkel built the Nord Stream 2 pipeline. But Merkel’s policy failed to persuade Russia that economic cooperation is better than military confrontation – rather it emboldened President Putin, who viewed Europe as divided and corruptible. Chart 2BRussia Squeezes EU’s Natural Gas
Energy Cutoff Continues (GeoRisk Update)
Energy Cutoff Continues (GeoRisk Update)
Russia’s regime is insecure and feels threatened by the US and NATO. Russia believed that if it invaded Ukraine, the Europeans would maintain energy relations for the sake of preserving overall strategic stability. Instead Germany and other European states began to view Russia as irrational and aggressive and hence a threat to their long-term security. They imposed a coal ban, now an oil ban the end of this year, and a natural gas ban by the end of 2027, all formalized under the recently announced RePowerEU program. Russia retaliated by declaring it would reduce natural gas exports to the Netherlands and probably Denmark, after having already cut off Finland, Poland, and Bulgaria (Chart 2B). As a pretext Russia points to its arbitrary March demand that states pay for gas in rubles rather than in currencies written in contracts. This ruble payment scheme is being enforced on a country-by-country basis against those Russia deems “unfriendly,” i.e. those that join NATO, adopt new sanctions, provide massive assistance to Ukraine, or are otherwise adverse. Chart 3Russia Actively Cutting Gas Flows
Russia Actively Cutting Gas Flows
Russia Actively Cutting Gas Flows
Russia and Ukraine are already reducing natural gas exports through the Ukraine and Turkstream pipelines while the Yamal pipeline has been empty since May – and it is only a matter of time before flows begin to fall in the Nord Stream 1 pipeline to Germany (Chart 3). German government and industry are preparing to ration natural gas (to prioritize household needs) and revive 15 coal plants if necessary. Europe is attempting to rebuild stockpiles for the coming winter, when Russian willingness and capability to squeeze natural gas flows will reach a peak. The big picture is demonstrated by game theory in Diagram 1. The optimal situation for both Russia and the EU is to maintain energy exports for as long as possible, so that Russia has revenues to wage its war and Europe avoids a recession while transitioning away from Russian supplies (bottom right quadrant, each side receives four points). The problem is that this solution is not an equilibrium because either side can suffer a sudden shock if the other side betrays the tacit agreement and stops buying or selling (bottom left and top right quadrants). Diagram 1EU-Russia Standoff: What Does Game Theory Say?
Energy Cutoff Continues (GeoRisk Update)
Energy Cutoff Continues (GeoRisk Update)
The equilibrium – the decision sets in which both Russia and the EU are guaranteed to lose the least – is a situation in which both states reduce energy trade immediately. Europe needs to cut off the revenues that fuel the Russian war machine while Russia needs to punish and deter Europe now while it still has massive energy leverage (top left quadrant, circled). Once Europe diversifies away, Russia loses its leverage. If Europe does not diversify immediately, Russia can punish it severely by cutting off energy before it is prepared. Russian energy weaponization is especially useful ahead of any ceasefire talks in Ukraine. Russia aims for Ukrainian military neutrality and a permanently weakened Ukrainian state. To that end it is seizing territory for the Luhansk and Donetsk People’s Republics, seizing the southern coastline and strategic buffer around Crimea, and controlling the mouth of the Dnieper river so that Ukraine is forever hobbled (Map 1). Once it achieves these aims it will want to settle a ceasefire that legitimizes its conquests. But Ukraine will wish to continue the fight. Map 1Russian Invasion Of Ukraine, 2022
Energy Cutoff Continues (GeoRisk Update)
Energy Cutoff Continues (GeoRisk Update)
Russia will need leverage over Europe to convince the EU to lean on Ukraine to agree to a ceasefire. Something similar occurred in 2014-15 when Russia collaborated with Germany and France to foist the Minsk Protocols onto Ukraine. If Russia keeps energy flowing to EU, the EU not only gets a smooth energy transition away from Russia but also gets to keep assisting Ukraine’s military effort. Whereas if Russia imposes pain on the EU ahead of ceasefire talks, the EU has greater interest in settling a ceasefire. Finally, given Russia’s difficulties on the battlefield, its loss of European patronage, and potential NATO enlargement on its borders, Moscow is highly likely to open a “new front” in its conflict with the West. Josef Stalin, for example, encouraged Kim Il Sung to invade South Korea in 1950. Today Russia’s options lie in the Middle East and North Africa – the regions where Europe turns for energy alternatives. Not only Libya and Algeria – which are both inherently fertile ground for Russia to sow instability – but also Iran and the broader Middle East, where a tenuous geopolitical balance is already eroding due to a lack of strategic understanding between the US and Iran. Russia’s capabilities are limited but it likely retains enough influence to ignite existing powder kegs in these areas. Bottom Line: Investors still face a few hurdles from the Ukraine war. First, the EU’s expanding energy embargo and Russian retaliation. Second, instability in the Middle East and North Africa. Hence energy price pressures will remain elevated in the short term and kill more demand, thus pushing the EU and the rest of the world toward stagflation or even recession. War Contained To Ukraine So Far … But Russia To Retaliate Over NATO Enlargement At present Russia is waging a full-scale assault on eastern and southern Ukraine, where about half of Donetsk awaits a decision (Map 2). If Russia emerges victorious over Donetsk in the summer or fall then it can declare victory and start negotiating a ceasefire. This timeline assumes that its economic circumstances are sufficiently straitened to prevent a campaign to the Moldovan border.1 Map 2Russia May Declare Victory If It Conquers The Rest Of Donetsk
Energy Cutoff Continues (GeoRisk Update)
Energy Cutoff Continues (GeoRisk Update)
There are still ways for the Ukraine war to spill over into neighboring areas. For example, the Black Sea is effectively a Russian lake at the moment, which prevents Ukrainian grain from reaching global markets where food prices are soaring. Eventually the western maritime powers will need to attempt to restore freedom of navigation. However, Russia is imposing a blockade on Ukraine, has more at stake there than other powers, and can take greater risks. The US and its allies will continue to provide Ukraine with targeting information against Russian ships but this assistance could eventually provoke a larger naval conflict. Separately, the US has agreed to provide Ukraine with the M142 High Mobility Artillery Rocket System (HIMARS), which could lead to attacks on Russian territory that would prompt a ferocious Russian reaction. Even assuming that the Ukraine war remains contained, Russia’s strategic conflict with the US and the West will remain unresolved and Moscow will be eager to save face. Russian retaliation will occur not only on account of European energy diversification but also on account of NATO enlargement. Finland and Sweden are attempting to join NATO and as such the West is directly repudiating the Putin regime’s chief strategic demand for 22 years. Finland shares an 830 mile border with Russia, adding insult to injury. The result will be another round of larger military tensions that go beyond Ukraine and prolong this year’s geopolitical risk and uncertainty. Russia’s initial response to Finland’s and Sweden’s joint application to NATO was to dismiss the threat they pose while drawing a new red line. Rather than forbidding NATO enlargement, Russia now demands that no NATO forces be deployed to these two states. This demand, which Putin and other officials expressed, may or may not amount to a genuine Russian policy change. Russia’s initial responses should be taken with a grain of salt because Turkey is temporarily blocking Finland’s and Sweden’s applications, so Russia has no need to respond to NATO enlargement yet. But the true test will come when and if the West satisfies Turkey’s grievances and Turkey moves to admit the new members. If enlargement becomes inevitable, Russia will respond. Russia will feel that its national security is fundamentally jeopardized by Sweden overturning two centuries of neutrality and Finland reversing the policy of “Finlandization” that went so far in preventing conflict during the Cold War. Chart 4Military Balances Stacking Up Against Russia
Energy Cutoff Continues (GeoRisk Update)
Energy Cutoff Continues (GeoRisk Update)
Russia’s military options are limited. Russia has little ability to expand the war and fight on multiple fronts judging by the army’s recent performance in Ukraine and the Red Army’s performance in the Winter War of 1939. This point can be illustrated by taking the military balance of Russia and its most immediate adversaries, which add up to about half of Russian military strength even apart from NATO (Chart 4). Russian armed forces already demonstrated some pragmatism in April by withdrawing from Kyiv and focusing on more achievable war aims. Unless President Putin turns utterly reckless and the Russian state fails to restrain him, Russia will opt for defensive measures and strategic deterrence rather than a military offensive in the Baltics. Hence Russia’s military response will come in the form of threats rather than outright belligerence. However, these threats will probably include military and nuclear actions that will raise alarm bells across Europe and the United States. President Dmitri Medvedev has already warned of the permanent deployment of nuclear missiles in the Kaliningrad exclave.2 This statement points to only the most symbolic option of a range of options that will increase deterrence and elevate the fear of war. Otherwise Russia’s retaliation will consist of squeezing global energy supply, as discussed above, including by opening a new front in the Middle East and North Africa. Instability should be expected as a way of constraining Europe and distracting America. Higher energy prices may or may not convince the EU to negotiate better terms with Russia but they will sow divisions within and among the allies. Ultimately Russia is highly unlikely to sacrifice its credibility by failing to retaliate for the combination of energy embargo and NATO enlargement on its borders. Since its military options are becoming constrained (at least its rational ones), its economic and asymmetrical options will grow in importance. The result will be additional energy supply constraints. Bottom Line: Even assuming that the war does not spread beyond Ukraine – likely but not certain – global financial markets face at least one more period of military escalation with Russia. This will likely include significant energy cutoffs and saber-rattling – even nuclear threats – over NATO enlargement. China’s Political Situation Has Not Normalized China continues to suffer from a historic confluence of internal and external political risk that will cause negative surprises for investors. Temporary improvements in government policy or investor sentiment – centered on a relaxation of “Zero Covid” lockdowns in major cities and a more dovish regulatory tone against the tech giants – will likely be frustrated, at least until after a more dovish government stance can be confirmed in the wake of the twentieth national party congress in October or November this year. At that event, Chinese President Xi Jinping is likely to clinch another ten years in power and complete the transformation of China’s governance from single-party rule to single-person rule. This reversion to autocracy will generate additional market-negative developments this year. It has already embedded a permanently higher risk premium in Chinese financial assets because it increases the odds of policy mistakes, international aggression, and ultimately succession crisis. The most successful Asian states chose to democratize and expand free markets and capitalism when they reached a similar point of economic development and faced the associated sociopolitical challenges. But China is choosing the opposite path for the sake of national security. Investors have seen the decay of Russia’s economy under Putin’s autocracy and would be remiss not to upgrade the odds of similarly negative outcomes in China over the long run as a result of Xi’s autocracy, despite the many differences between the two countries. China’s situation is more difficult than that of the democratic Asian states because of its reviving strategic rivalry with the United States. US Secretary of State Antony Blinken recently unveiled President Biden’s comprehensive China policy. He affirmed that the administration views China as the US’s top strategic competitor over the long run, despite the heightened confrontation with Russia.3 The Biden administration has not eased the Trump administration’s tariffs or punitive measures on China. It is unlikely to do so during a midterm election year when protectionist dynamics prevail – especially given that the Xi administration will be in the process of reestablishing autocracy, and possibly repressing social unrest, at the very moment Americans go to the polls. Re-engagement with China is also prohibited because China is strengthening its strategic bonds with Russia. President Biden has repeatedly implied that the US would defend Taiwan in any conflict with China. These statements are presented as gaffes or mistakes but they are in fact in keeping with historical US military actions threatening counter-attack during the three historic Taiwan Strait crises. The White House quickly walks back these comments to reassure China that the US does not support Taiwanese independence or intend to trigger a war with China. The result is that the US is using Biden’s gaffe-prone personality to reemphasize the hard edge (rather than the soft edge) of the US’s policy of “strategic ambiguity” on Taiwan. US policy is still ambiguous but ambiguity includes the possibility that a president might order military action to defend Taiwan. US attempts to increase deterrence and avoid a Ukraine scenario are threatening for China, which will view the US as altering the status quo and penalizing China for Russia’s actions. Beijing resumed overflights of Taiwan’s air defense identification zone in the wake of Biden’s remarks as well as the decision of the US to send Senator Tammy Duckworth to Taiwan to discuss deeper economic and defense ties. Consider the positioning of US aircraft carrier strike groups as an indicator of the high level of strategic tensions. On January 18, 2022, as Russia amassed military forces on the Ukrainian border – and the US and NATO rejected its strategic demands – the US had only one publicly acknowledged aircraft carrier in the Mediterranean (the USS Harry Truman) whereas it had at least five US carriers in East Asia. On February 24, the day of Russia’s invasion of Ukraine, the US had at least four of these carriers in Asia. Even today the US has at least four carriers in the Pacific compared to at least two in Europe – one of which, notably, is in the Baltics to deter Russia from attacking Finland and Sweden (Map 3). The US is warning China not to take advantage of the Ukraine war by staging a surprise attack on Taiwan. Map 3Amid Ukraine War, US Deters China From Attacking Taiwan
Energy Cutoff Continues (GeoRisk Update)
Energy Cutoff Continues (GeoRisk Update)
Of course, strategic tensions are perennial, whereas what investors are most concerned about is whether China can secure its economic recovery. The latest data are still disappointing. Credit growth continues to falter as the private sector struggles with a deteriorating demographic and macroeconomic outlook (Chart 5). The credit impulse has entered positive territory, when local government bonds are included, reflecting government stimulus efforts. But it is still negative when excluding local governments. And even the positive measure is unimpressive, having ticked back down in April (Chart 6). Chart 5Credit Growth Falters Amid Economic Transition
Credit Growth Falters Amid Economic Transition
Credit Growth Falters Amid Economic Transition
Chart 6Silver Lining: Credit Impulse Less Negative
Silver Lining: Credit Impulse Less Negative
Silver Lining: Credit Impulse Less Negative
Bottom Line: Further monetary and fiscal easing will come in China, a source of good news for global investors next year if coupled with a broader policy shift in favor of business, but the effects will be mixed this year due to Covid policy and domestic politics. Taken together with a European energy crunch and Middle Eastern oil supply disruptions, China’s stimulus is not a catalyst for a sustainable global equity market rally this year. South Asia: Inflation Hammers Sri Lanka And Pakistan Since 2020 we have argued that the global pandemic would result in a new wave of supply pressures and global social unrest. High inflation is blazing a trail of destruction in emerging markets, notably in South Asia, where per capita incomes are low and political institutions often fragile. Chart 7South Asia: Surging Inflation
Energy Cutoff Continues (GeoRisk Update)
Energy Cutoff Continues (GeoRisk Update)
Sri Lanka has been worst affected (Chart 7). Inflation surged to an eye-watering 34% in April and is expected to rise further. Surging inflation has affected Sri Lanka disproportionately because its macroeconomic and political fundamentals were weak to begin with. The tourism-dependent Sri Lankan economy suffered a body blow from terrorist attacks in 2019 and the pandemic in 2020-21. Then 2022 saw a power struggle between Sri Lanka’s President Gotabaya Rajapaksa and members of the national assembly including Prime Minister (PM) Mahinda Rajapaksa. The crisis hit a crescendo when the country defaulted on external debt obligations last month. These events weigh on Sri Lanka’s ability to transition from a long civil war (1983-2009) to a path of sustained economic development. While the political crisis has seemingly stabilized following the appointment of new Prime Minister Ranil Wickremesinghe, we remain bearish on a strategic time horizon. This is mainly because the new PM is unlikely to bring about structural solutions for Sri Lanka’s broken economy. Moreover, Sri Lanka holds more than $50 billion of foreign debt, or 62% of GDP. Another country that has been dealing with political instability alongside high inflation in South Asia is Pakistan, where inflation hit a three-year high in April (see Chart 7 above). The latest twist in Pakistan’s never-ending cycle of political uncertainty comes from the ousted Prime Minister Imran Khan. The former PM, who commands an unusual popular support group due to his fame as a cricketer prior to entering politics, is demanding fresh elections and otherwise threatening to hold mass protests. Pakistan’s new coalition government and Prime Minister Shehbaz Sharif, who came to power amid parliamentary intrigues, are refusing elections and ultimatums. From a structural perspective Pakistan is characterized by a weak economy and an unusually influential military. Now it faces high inflation and rising food prices – indeed it is one of the countries that is most dangerously exposed to the Russia-Ukraine war as it depends on these two for over 70% of its grain imports. Bottom Line: MSCI Sri Lanka has underperformed the MSCI EM index by 58.3% this year to date. Pakistan has underperformed the same index by 41.6% over the same period. Against this backdrop, we remain strategic sellers of both bourses. Instability in these countries is also one of the factors behind our strategic assessment of India as a country with a growing domestic policy consensus. South Asia: India’s Fiscal Populism And Geopolitics Inflation is less rampant in India, although still troublesome. Consumer prices nearly jumped to an 8-year high in April (see Chart 7). With a loaded state election calendar due over the next 12-18 months, the jump in inflation naturally triggered a series of mitigating policy responses. Ban On Wheat Exports: India produces 14% of the world’s wheat and 11% of grains, and exports 5% and 7%, respectively. India’s exports could make a large profit in the context of global shortages. But Prime Minister Narendra Modi is entering into the political end of the business cycle, with key state elections due that will have an impact on the ruling party’s political standing two years before the next federal election. He fears political vulnerability if exports continue amid price pressures at home. The emphasis on food security is typical but also bespeaks a lack of commitment to economic reform. Chart 8India's Real Interest Rates Fall
India's Real Interest Rates Fall
India's Real Interest Rates Fall
Surprise Rate Hikes: The Reserve Bank of India (RBI) increased the policy repo rate by 40 basis points at an unscheduled meeting on May 4, thereby implementing its first rate hike since August 2018. With real rates in India lower than those in China or Brazil (Chart 8), the RBI will be forced to expedite its planned rate hikes through 2022. Tax Cuts On Fuel: India’s central government also announced steep cuts in excise duty on fuel. This is another populist measure that reduces political pressures but fails to encourage the private sector to adjust. These measures will help rein in inflation but the rate hikes will weigh on economic growth while the tax cuts will add to India’s fiscal deficit. Indeed, India is resorting to fiscal populism with key state elections looming. Geopolitical risk is less of a concern for India – indeed the Ukraine war has strengthened its bargaining position. In the short run, India benefits from the ability to buy arms and especially cheap oil from Russia while the EU imposes an embargo. But over the long run its economy and security can be strengthened by greater interest from the US and its allies, recently highlighted by the fourth meeting of the Quadrilateral Security Dialogue (Quad) and the launch of the US’s Indo-Pacific Economic Framework (IPEF). These initiatives are modest but they highlight the US’s need to replace China with India and ASEAN over time, a trend that no US administration can reverse now because of the emerging Russo-Chinese strategic alliance. At the same time, the Quad underscores India’s maritime interests and hence the security benefits India can gain from aligning its economy and navy with the other democracies. Bottom Line: Fiscal populism in the context of high commodity prices is negative for Indian equities. However, our views on Russia, the Middle East, and China all point to a sharper short-term spike in commodity prices that ultimately drives the world economy deeper into stagflation or recession. Therefore we are booking a 22.5% profit on our tactical decision to go long Brazilian financials relative to Indian equities. Matt Gertken Chief Geopolitical Strategist mattg@bcaresearch.com Ritika Mankar, CFA Editor/Strategist ritika.mankar@bcaresearch.com Chart 9Russia: GeoRisk Indicator
Russia: GeoRisk Indicator
Russia: GeoRisk Indicator
Chart 10Other Measures Of Russian Geopolitical Risk
Other Measures Of Russian Geopolitical Risk
Other Measures Of Russian Geopolitical Risk
Chart 11China: GeoRisk Indicator
China: GeoRisk Indicator
China: GeoRisk Indicator
Chart 12United Kingdom: GeoRisk Indicator
United Kingdom: GeoRisk Indicator
United Kingdom: GeoRisk Indicator
Chart 13Germany: GeoRisk Indicator
Germany: GeoRisk Indicator
Germany: GeoRisk Indicator
Chart 14France: GeoRisk Indicator
France: GeoRisk Indicator
France: GeoRisk Indicator
Chart 15Italy: GeoRisk Indicator
Italy: GeoRisk Indicator
Italy: GeoRisk Indicator
Chart 16Canada: GeoRisk Indicator
Canada: GeoRisk Indicator
Canada: GeoRisk Indicator
Chart 17Spain: GeoRisk Indicator
Spain: GeoRisk Indicator
Spain: GeoRisk Indicator
Chart 18Australia: GeoRisk Indicator
Australia: GeoRisk Indicator
Australia: GeoRisk Indicator
Chart 19Taiwan: GeoRisk Indicator
Taiwan: GeoRisk Indicator
Taiwan: GeoRisk Indicator
Chart 20Korea: GeoRisk Indicator
Korea: GeoRisk Indicator
Korea: GeoRisk Indicator
Chart 21Turkey: GeoRisk Indicator
Turkey: GeoRisk Indicator
Turkey: GeoRisk Indicator
Chart 22South Africa: GeoRisk Indicator
South Africa: GeoRisk Indicator
South Africa: GeoRisk Indicator
Chart 23Brazil: GeoRisk Indicator
Brazil: GeoRisk Indicator
Brazil: GeoRisk Indicator
Footnotes 1 Recent diplomatic flaps between core European leaders and Ukrainian President Volodymyr Zelensky reflect Ukraine’s fear that Europe will negotiate a “separate peace” with Russia, i.e. accept Russian territorial conquests in exchange for economic relief. 2 Dmitri Medvedev explicitly states ‘there can be no more talk of any nuclear-free status for the Baltic - the balance must be restored’ in warning Finland and Sweden joining NATO. Medvedev is suggesting that nuclear weapons will be placed in this area where Russia has its Kaliningrad exclave sandwiched between Poland and Lithuania. Guy Faulconbridge, ‘Russia warns of nuclear, hypersonic deployment if Sweden and Finland join NATO’, April 14, 2022, Reuters. 3 See Antony J Blinken, Secretary of State, ‘The Administration’s Approach to the People’s Republic of China’, The George Washington University, Washington D.C., May 26, 2022, state.gov. Additionally, see President Joe Biden’s remarks on China and getting involved military to defend Taiwan in a joint press conference with Japan’s Prime Minister Kishida Fumio. ‘Remarks by President Biden and Prime Minister Kishida Fumio of Japan in Joint Press Conference’, Akasaka Palace, Tokyo, Japan, May 23, 2022, whitehouse.gov. Strategic Themes Open Tactical Positions (0-6 Months) Open Cyclical Recommendations (6-18 Months) Regional Geopolitical Risk Matrix Section III: Geopolitical Calendar
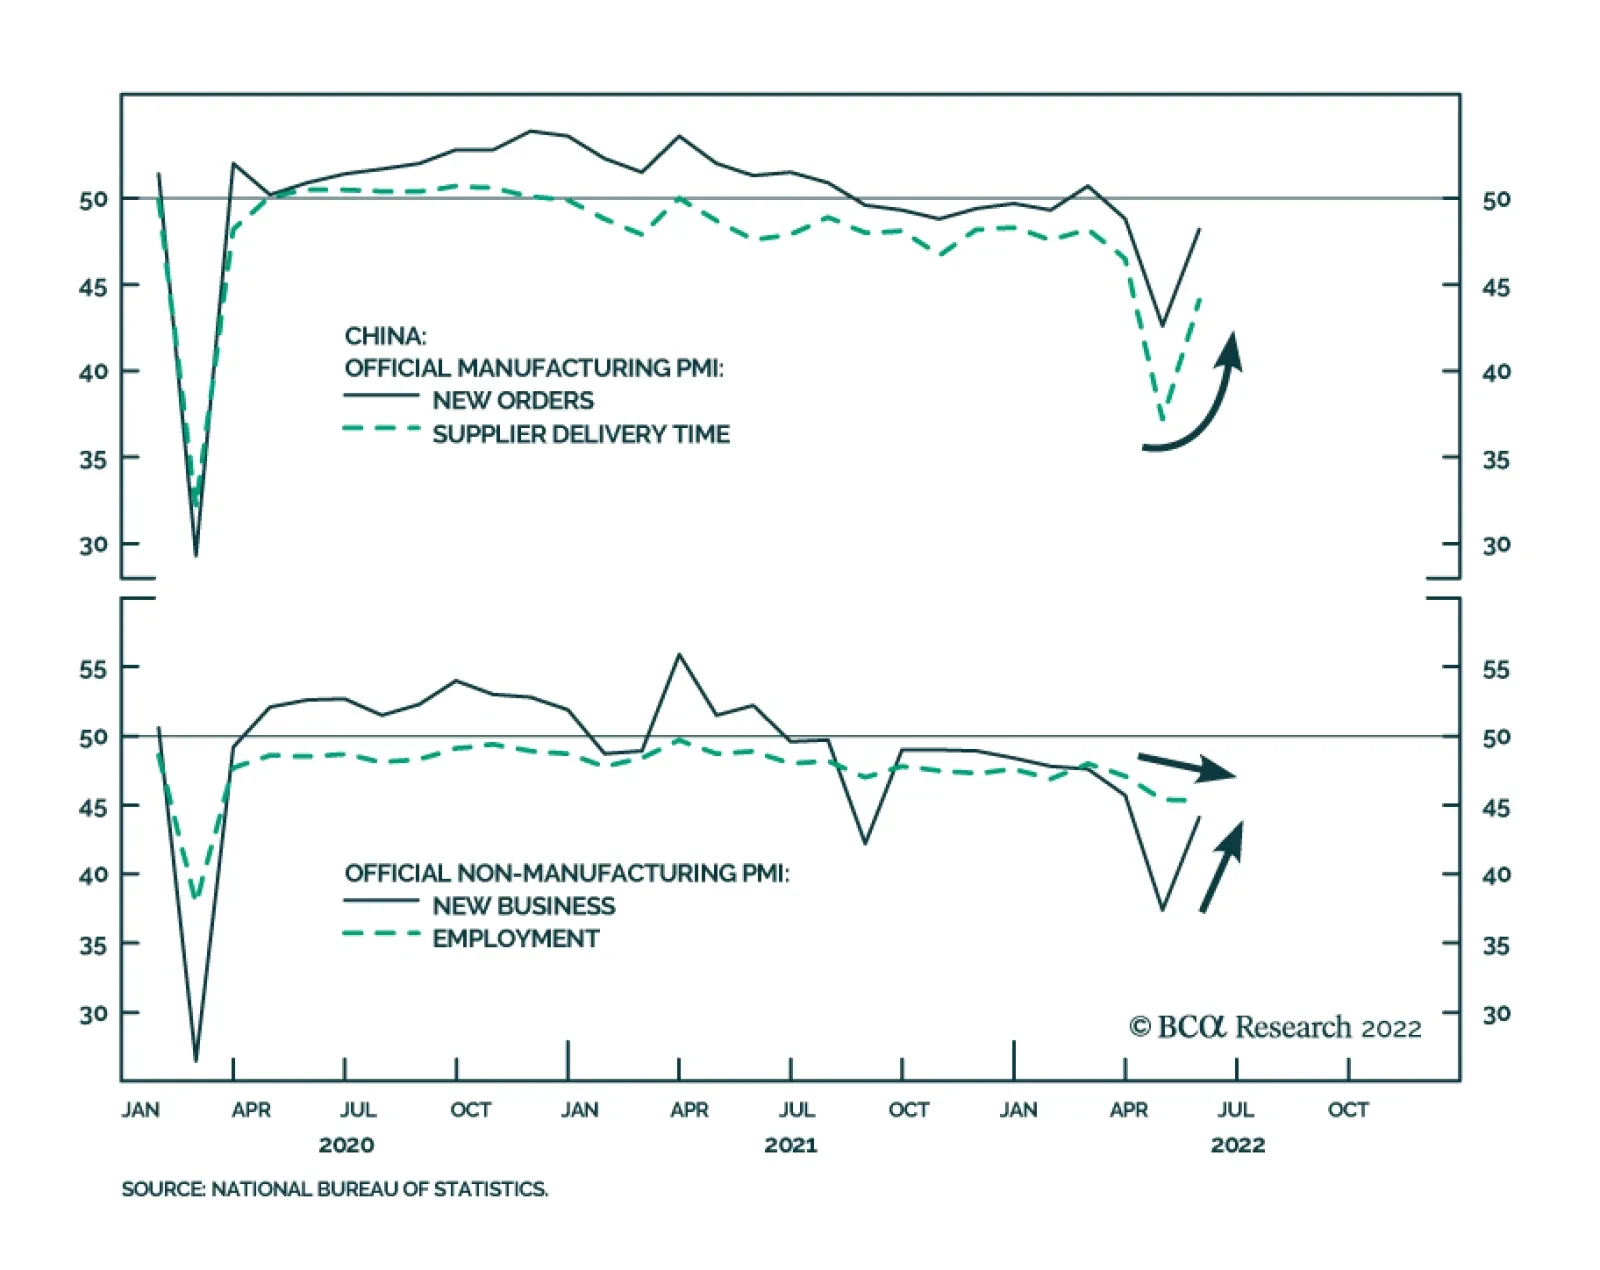
Chinese PMIs from the National Bureau of Statistics surprised to the upside on Tuesday. The services PMI rose from 41.9 to 47.8 in May, exceeding expectations of 45.5. Similarly, the manufacturing PMI increased from 47.4 to 49.6 in May, ahead of the 49.0…
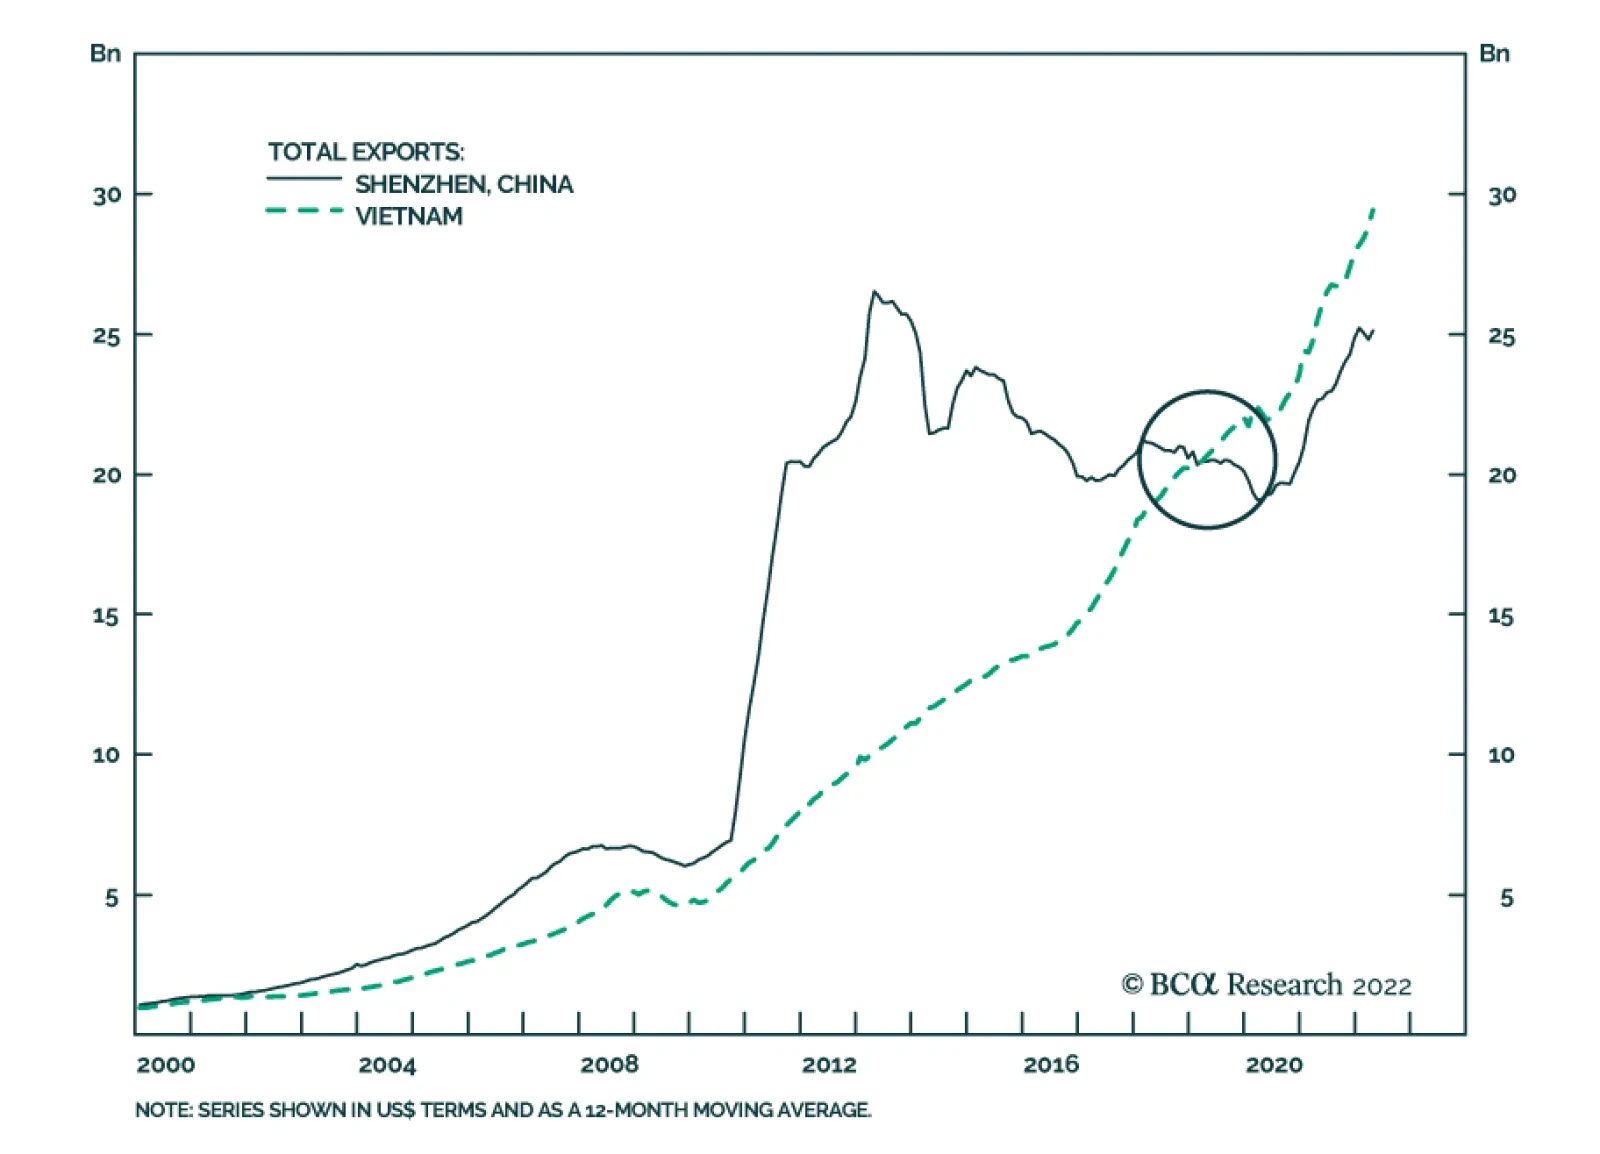
Recent data releases from Vietnam have been relatively resilient. The 22.6% y/y increase in May retail sales indicates that domestic demand is robust. And although export growth decelerated to 16.4% y/y from April’s 25% y/y, it is ultimately expanding at an…
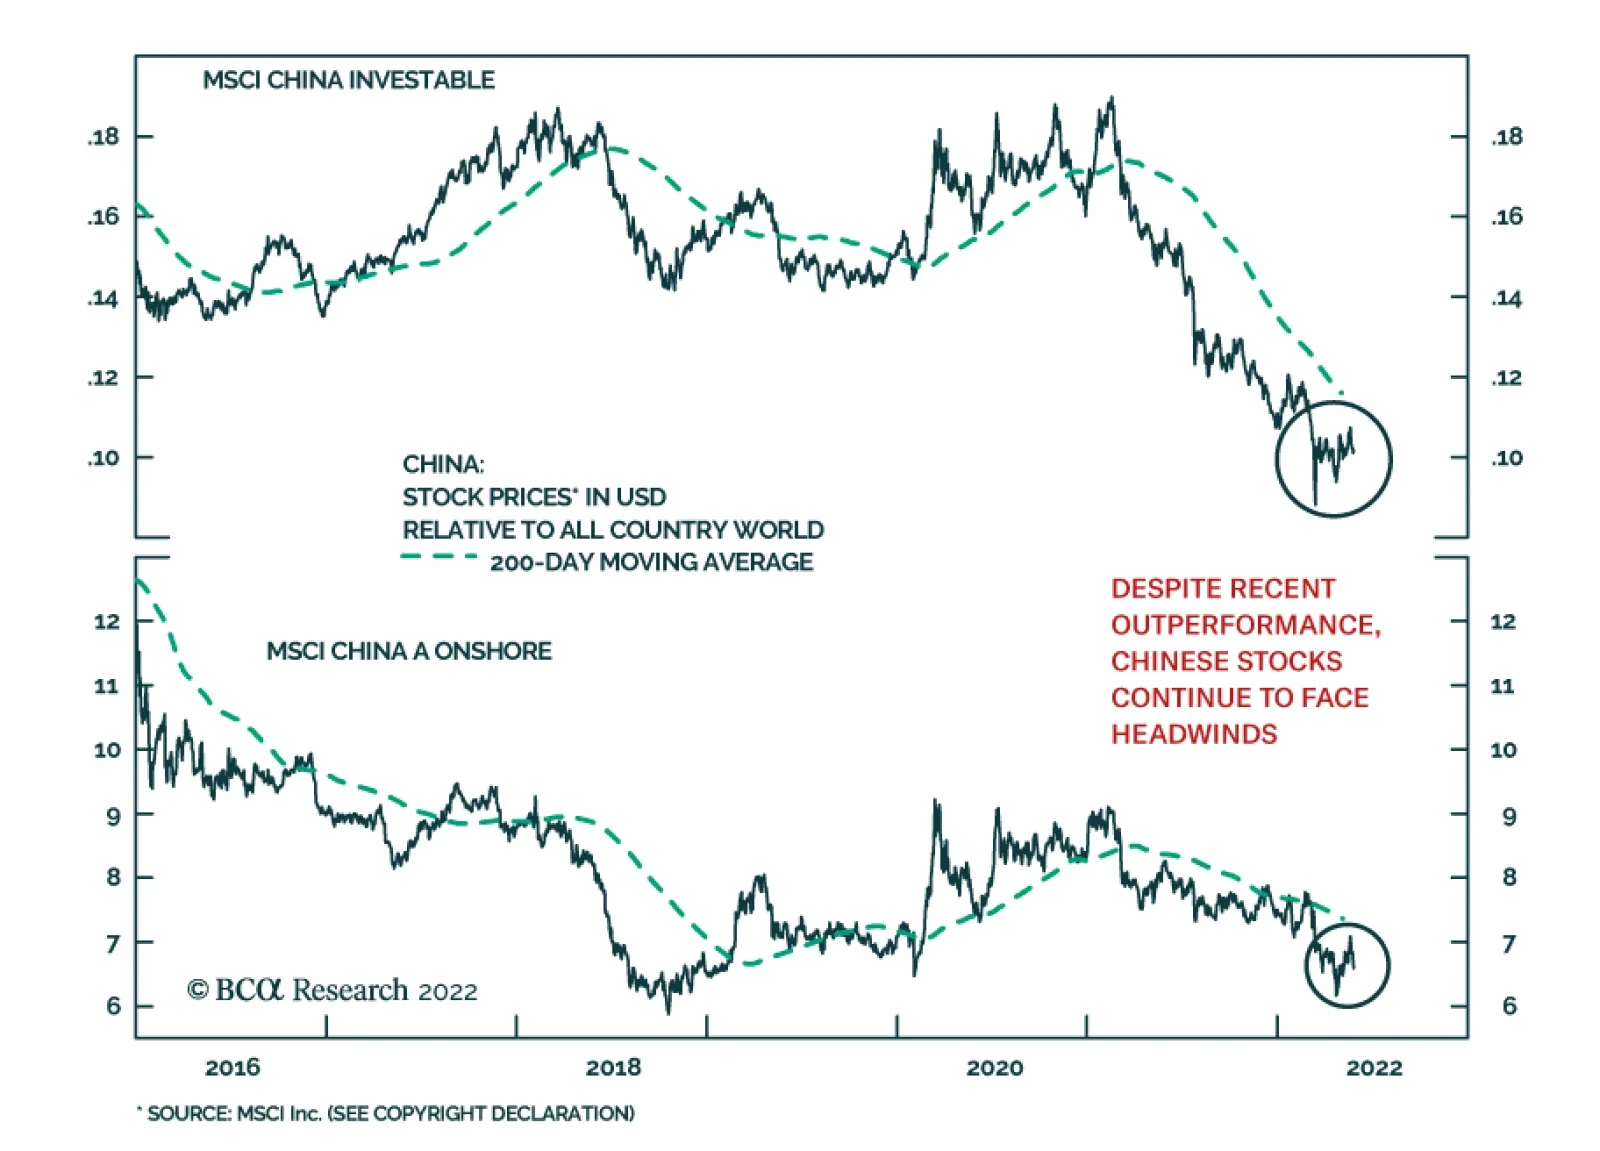
After having faced strong selling pressures since the beginning of the year, Chinese stocks have stabilized in recent weeks. Investor sentiment towards Chinese stocks appears to be improving amid positive policy developments. Authorities have rolled out…
Listen to a short summary of this report. Executive Summary US Financial Conditions Have Tightened Significantly This Year
US Financial Conditions Have Tightened Significantly This Year
US Financial Conditions Have Tightened Significantly This Year
US financial conditions have tightened by enough that the Fed no longer needs to talk up interest rate expectations. If inflation decelerates faster than anticipated over the coming months, as we expect will be the case, the Fed’s messaging will soften further. Bond yields in the US and abroad are likely to fall over the next 6-to-12 months, even if they do rise over a longer-term horizon. Stay overweight stocks, favoring non-US equities over their US peers. We are closing our short 10-year Gilts trade, initiated at a yield of 0.85%, for a gain of 7.5%. We are also opening a new trade going long Canadian short-term interest rate futures versus their US counterparts. Investors expect Canadian rates to exceed US rates in 2024, which seems unlikely to us given that the Canadian housing market is much more sensitive to higher rates than the US market. Bottom Line: After having tightened significantly over the past seven months, financial conditions should loosen modestly during the remainder of the year. This should benefit risk assets. Fed Focused on Financial Conditions Chart 1Tighter Financial Conditions Will Hurt Growth
Tighter Financial Conditions Will Hurt Growth
Tighter Financial Conditions Will Hurt Growth
Like many central banks, the Fed sees financial conditions as a key driver of the real economy. While there are many financial conditions indices (FCIs), most include bond yields, credit spreads, equity prices, and the exchange rate as inputs. Higher bond yields, wider credit spreads, lower equity prices, and a strong currency all lead to tighter financial conditions and a weaker economy, and vice versa. Goldman’s US FCI is especially popular among market participants. It is calibrated so that 100 bps in tightening corresponds, all things equal, to a 100 basis-point decline in US real GDP growth over the subsequent four quarters. The Goldman FCI has tightened by 212 bps since the start of the year and by 225 points from its loosest level in November 2021. If the historic relationship between the FCI and the economy holds, the tightening in financial conditions would be enough to push US growth to a below-trend pace by the second quarter of 2023. In fact, the tightening in the Goldman FCI over the past 12 months already suggests that the manufacturing ISM will fall below 50 (Chart 1). Along the same lines, the Chicago Fed’s Adjusted National FCI, which measures financial conditions relative to current economic conditions, has moved slightly into restrictive territory. Aside from a brief period at the outset of the pandemic, the index has been consistently in expansionary territory since early 2013 (Chart 2). Chart 2The Chicago Fed Financial Conditions Index Has Moved Into Slightly Restrictive Territory
Are Financial Conditions Tight Enough?
Are Financial Conditions Tight Enough?
Other data are consistent with the message from the FCIs. Most notably, growth estimates for the US and for other major economies have come down over the past few months (Chart 3). Economic surprise indices have also fallen, especially in the US. Chart 3AGrowth Forecasts Have Softened As Economic Data Have Surprised To The Downside (I)
Growth Forecasts Have Softened As Economic Data Have Surprised To The Downside (I)
Growth Forecasts Have Softened As Economic Data Have Surprised To The Downside (I)
Chart 3BGrowth Forecasts Have Softened As Economic Data Have Surprised To The Downside (II)
Growth Forecasts Have Softened As Economic Data Have Surprised To The Downside (II)
Growth Forecasts Have Softened As Economic Data Have Surprised To The Downside (II)
Mission Accomplished? Chart 4The Fed Expects To Lift Rates Above Its Estimate Of Neutral
The Fed Expects To Lift Rates Above Its Estimate Of Neutral
The Fed Expects To Lift Rates Above Its Estimate Of Neutral
Given the recent tightening in financial conditions and weaker growth expectations, the Fed is likely to soften its tone. Already this week, Atlanta Fed President Raphael Bostic suggested that the Fed could pause raising rates in September in order to assess the impact of the Fed’s tightening campaign. The Fed minutes also conveyed a sense of flexibility and data-dependence about the timing and magnitude of future hikes once rates reach 2%. It’s worth stressing that the Fed expects rates to rise in 2023 to about 40 bps above its estimate of the terminal rate (Chart 4). Jawboning rate expectations higher would potentially undermine the Fed’s goal of achieving a soft landing for the economy. Inflation Will Dictate How Much Easing Lies Ahead There is a big difference between not wanting financial conditions to tighten further and wanting them to loosen. The Fed would only want to see an easing in financial conditions if inflation were to fall faster than expected. Chart 5 shows how the year-over-year change in the core PCE deflator would evolve over the remainder of the year depending on different assumptions about the month-over-month change in the deflator. The Fed would be able to reach its expectation of year-over-year core PCE inflation of 4.1% for end-2022 if the month-over-month change averages 0.33%. Monthly core PCE inflation averaged 0.3% in February and March and is expected to clock in at around the same level for April once the data is released tomorrow. Chart 5AUS Inflation Will Fall By More Than The Fed Expects If The Monthly Change In Core PCE Is Less Than 0.3% (I)
US Inflation Will Fall By More Than The Fed Expects If The Monthly Change In Core PCE Is Less Than 0.3% (I)
US Inflation Will Fall By More Than The Fed Expects If The Monthly Change In Core PCE Is Less Than 0.3% (I)
Chart 5BUS Inflation Will Fall By More Than The Fed Expects If The Monthly Change In Core PCE Is Less Than 0.3% (II)
US Inflation Will Fall By More Than The Fed Expects If The Monthly Change In Core PCE Is Less Than 0.3% (II)
US Inflation Will Fall By More Than The Fed Expects If The Monthly Change In Core PCE Is Less Than 0.3% (II)
Regardless of tomorrow’s data print, as we discussed last week, we expect the monthly inflation rate to average less than 0.3 in the back half of the year. If that happens, inflation will surprise to the downside relative to the Fed’s expectations. Consistent with the observation above, market-based inflation expectations have already declined. The 5-year TIPS inflation breakeven has fallen from 3.64% in March to 2.98% at present. The widely watched 5-year/5-year forward breakeven rate is back down to 2.29%, at the bottom of the Fed’s comfort zone of 2.3%-to-2.5% (Chart 6).1 The Citi US Inflation Surprise Index has also rolled over (Chart 7). Chart 6Market-Based Inflation Expectations Have Come Down Of Late
Market-Based Inflation Expectations Have Come Down Of Late
Market-Based Inflation Expectations Have Come Down Of Late
Chart 7The US Inflation Surprise Index Has Rolled Over
The US Inflation Surprise Index Has Rolled Over
The US Inflation Surprise Index Has Rolled Over
Financial Conditions Abroad Financial conditions indices in the other major developed economies have tightened somewhat less than in the US because equities represent a smaller share of household net worth abroad and also because most currencies have weakened against the US dollar (Chart 8). Nevertheless, with growth momentum having already deteriorated sharply, central banks are signaling a more balanced approach towards policy normalization. Chart 8Financial Conditions Have Tightened More In The US Than Elsewhere This Year
Are Financial Conditions Tight Enough?
Are Financial Conditions Tight Enough?
ECB: Wait and See? In a blog post published on Monday, Christine Lagarde observed that inflation expectations have risen from pre-pandemic levels, implying that real policy rates are currently lower than they were two years ago. In her mind, this warrants ending net purchases under the Asset Purchase Programme early in the third quarter. It also warrants raising the deposit rate by 25 bps at both the July and September meetings, bringing it back to zero from -0.5% at present. Beyond then, Lagarde was circumspect about what should be done, stressing the need for “gradualism, optionality and flexibility.” She noted that “The euro area is clearly not facing a typical situation of excess aggregate demand or economic overheating … Both consumption and investment remain below their pre-crisis levels, and even further below their pre-crisis trends.” She then added: “The outlook is now being clouded by the negative supply shocks hitting the economy … households’ expectations of their future financial situation dropped to their second-lowest level on record in March and remained close to that level in April.” The market expects the ECB to raise rates by 170 bps over the next 12 months, bringing the deposit rate to 1.2% by mid-2023 (Chart 9). BCA’s Global Fixed Income team, led by Rob Robis, foresees only 50 bps of tightening over the next 12 months. Chart 9Markets Expect Rates To Rise The Most In The Anglo-Saxon World
Are Financial Conditions Tight Enough?
Are Financial Conditions Tight Enough?
The UK, Canada, and Australia: Frothy Housing Markets Will Limit Rate Hikes The Bank of England (BoE) hiked rates by 90 bps over the past 12 months. The UK OIS curve is priced for another 140 bps of rate hikes over the next year. According to the BoE’s forecasting models, this would raise the unemployment rate by two percentage points while lowering inflation to below 2% within the next two-to-three years. In our opinion, that is more tightening than the BoE would like to see. BCA’s strategists expect the BoE to deliver only another 75 bps of hikes over the next year. Chart 10Buildup In Leverage And Frothy Housing Markets Pose A Challenge To Monetary Policy In Some Developed Market Countries
Buildup In Leverage And Frothy Housing Markets Pose A Challenge To Monetary Policy In Some Developed Market Countries
Buildup In Leverage And Frothy Housing Markets Pose A Challenge To Monetary Policy In Some Developed Market Countries
The Canadian economy has been quite strong, with the unemployment rate falling to 5.2% in April, the lowest since 1974. The Canadian OIS curve is discounting 195 bps of interest rate hikes over the next 12 months, substantially more than the 150 bps of tightening our fixed income team foresees. By mid-2024, investors expect Canadian policy rates to be about 25 bps above US rates. This seems unreasonable to us, and as of this week, we are expressing this view by going long the June 2024 3-month Canadian Bankers’ Acceptance (BAX) futures contract (BAM4) versus the corresponding 3-month US SOFR futures contract (SFRM4). A more liquid option is to simply go long the 10-year Canadian government bond versus the 10-year US Treasury note. At present, Canadian 10-year government bonds are yielding 5 bps more than their US counterparts. Unlike in the US, where household debt has fallen over the past 14 years, debt in Canada has risen, fueled by a massive housing boom (Chart 10). High indebtedness and the prevalence of variable rate/short-term fixed-rate mortgages will limit the ability of the BoC to raise rates. The Australian OIS curve is currently discounting 262 bps of rate hikes over the next year which, if realized, would take the cash rate to 3.3% – a level last seen in 2013 when the neutral rate in Australia was much higher by the RBA’s own reckoning. BCA’s fixed income strategists expect only 150 bps of tightening over the next 12 months. Japan: Yield Curve Control Will Continue Chart 11Japan: Long-Term Inflation Expectations Are Far Lower Than In The Rest Of The World
Japan: Long-Term Inflation Expectations Are Far Lower Than In The Rest Of The World
Japan: Long-Term Inflation Expectations Are Far Lower Than In The Rest Of The World
The Bank of Japan expects inflation excluding fresh food prices to remain at about 2% in the second half of 2022, but then to slow to 1.1% in the fiscal year starting April 2023. The Japan OIS curve is discounting almost no tightening over the next 12 months. Long-term inflation expectations are far lower in Japan than in any other major economy, which makes ultra-low rates a necessity for the foreseeable future (Chart 11). China: Outright Easing Chart 12Covid Restrictions Have Eased Only Modestly In China
Are Financial Conditions Tight Enough?
Are Financial Conditions Tight Enough?
China faces a trifecta of problems: A weakening housing market; slowing external demand for manufactured goods; and the ongoing threat of Covid-related lockdowns. Despite a steep drop in the number of new Covid cases over the past month, China’s lockdown index has only eased modestly, as the authorities continue to fret about the next outbreak (Chart 12). The leadership in Beijing has responded with policy easing. The PBoC lowered the 5-year loan prime rate by 15 bps last week, the largest such cut since 2019. This followed a cut in the floor rate for first-home mortgages that was announced on May 15. BCA’s China strategists believe these measures will arrest the deep contraction in the property market but will not spark a full-blown recovery due to the ongoing commitment of the government to the “three red lines” policy.2 In normal times, a Chinese real estate slump would be a cause of grave concern for global investors. These are not normal times, however. Public enemy number one these days is inflation. A weaker Chinese property market would curb commodity demand, thus helping to cool inflation. That would be a welcome development for global investors. Investment Conclusions Global financial conditions have tightened to the point that betting on ever-higher rates, at least for the next 12 months, no longer makes sense. If global inflation decelerates faster than anticipated during the remainder of the year, as we expect will be the case, central banks will dial back the hawkish rhetoric. We took partial profits on our short 10-year Treasury trade earlier this month (initiated at a yield of 1.45%). As of this week, consistent with the earlier decision of BCA’s fixed income strategists to upgrade UK Gilts, we are closing our short 10-year Gilt position (initiated at a yield of 0.85%) for a gain of 7.5%. The coming Goldilocks environment of falling inflation and supply-side led growth will buttress equities. We expect global stocks to rise 15%-to-20% over the next 12 months, with non-US markets outperforming the US. Looking further out, the fate of Goldilocks will rest on where the neutral rate of interest resides. If the neutral rate in the US turns out to be substantially lower than 2.5%, then any growth recovery will falter as the lagged effects of restrictive monetary policy work their way through the economy. Conversely, if the neutral rate turns out to be substantially higher than 2.5%, then inflation will reaccelerate as the economy overheats. Given the choice, we would wager on the latter outcome. Thus, while we expect global bond yields to decline over a 12-month horizon, we foresee them rising over a 2-to-5-year time frame. Similarly, while stocks will strengthen over the next 12 months, they are likely to encounter another bout of turbulence starting late next year or in 2024 as central banks initiate a second round of rate hikes. Peter Berezin Chief Global Strategist peterb@bcaresearch.com Follow me on LinkedIn Twitter Footnotes 1 The Federal Reserve targets an average inflation rate of 2% for the Personal Consumption Expenditures (PCE) index. The TIPS breakeven is based on the CPI index. Due to compositional differences between the two indices, CPI inflation has historically averaged 30-to-50 basis points higher than PCE inflation. This is why the Fed effectively targets a CPI inflation rate of 2.3%-to-2.5%. 2 The People’s Bank of China and the housing ministry issued a deleveraging framework for property developers in August 2020, consisting of a 70% ceiling on liabilities-to-assets, a net debt-to-equity ratio capped at 100%, and a limit on short-term borrowing that cannot exceed cash reserves. Developers breaching these “red lines” run the risk of being cut off from access to new loans from banks, while those who respect them can only increase their interest-bearing borrowing by 15% at most. Global Investment Strategy View Matrix
Are Financial Conditions Tight Enough?
Are Financial Conditions Tight Enough?
Special Trade Recommendations Current MacroQuant Model Scores
Are Financial Conditions Tight Enough?
Are Financial Conditions Tight Enough?
Executive Summary KRW vs JPY: A Play On Global Slowdown And Lower US Bond Yields
KRW vs JPY: A Play On Global Slowdown And Lower US Bond Yields
KRW vs JPY: A Play On Global Slowdown And Lower US Bond Yields
Global financial markets appear to be moving away from inflation worries to pricing in a major growth slump. Global growth is downshifting, and financial markets have not yet priced this in. Given that the US dollar is a countercyclical currency, it will remain firm despite lower US growth and interest rate expectations. Emerging Asian currencies will drop further. A new currency trade: Go long the JPY versus the KRW. The global macro outlook, currency valuations and technicals suggest that this trade offers a good risk-reward profile. Recommendation INITIATION DATE RETURN Short KRW / Long JPY 2022-05-26 Bottom Line: Global equity and credit investors should stay defensive. EM share prices and credit markets (USD bonds) are not yet out of the woods. US bond yields will likely roll over and bonds will outperform stocks in the near-term. Global financial markets appear to be moving away from worries about inflation to pricing in a major growth slump. The recent simultaneous drop in US Treasury yields and US share prices indicate that the market theme is shifting from inflation to a growth scare. Chart 1A Sign of Peak In Bond Yields
A Sign of Peak In Bond Yields
A Sign of Peak In Bond Yields
Interestingly, high-yielding currencies such as AUD, NZD, and CAD have recently started underperforming low-yielding JPY and CFH (Chart 1, top panel). The former are a play on global growth while the latter are vulnerable to rising US interest rates. Thus, the financial markets’ theme seems to be moving from inflation to weaker growth. The facts that this currency ratio correlates with 10-year US Treasury yields and has rolled over at its previous peaks signal that investors’ global growth concerns will likely intensify (Chart 1, top and bottom panels). As such, this currency ratio and US bond yields will continue drifting lower. Overall, the next phase of the selloff in global risk assets will likely be characterized by heightened growth worries. This phase will also mark the final chapter of this bear market. A pertinent question for investors is whether global risk assets have already priced in a global growth slump. Is A Global Slowdown Priced In? Our hunch is that the unfolding global economic slowdown is not yet fully priced in global financial markets. Chart 2Global Export Volumes Are Set To Shrink
Global Export Volumes Are Set To Shrink
Global Export Volumes Are Set To Shrink
In the near term, global share prices will continue to falter and odds are rising that US bond yields are putting in a major top. In short, global stocks will underperform US bonds, and the USD dollar will remain firm: First, global trade volumes are heading into contraction (Chart 2). Global export volumes are set to contract as US and European demand for goods ex-autos shrinks following the pandemic binge. Meanwhile, China’s recovery has been delayed to Q3. We discussed the reasons why we expect global exports will contract in H2 2022 in our April 21 report. Declining global trade volumes will support the greenback in the near term because the broad trade-weighted US dollar does well when global growth is weakening. Besides, US dollar liquidity is rapidly decelerating, which is also positive for the broad-trade weighted US dollar (the latter is shown inverted in Chart 3). Second, US rail carload is contracting, pointing to weakening growth in America (Chart 4). Chart 3No Sign Of Reversal In Trade-Weighted USD
No Sign Of Reversal In Trade-Weighted USD
No Sign Of Reversal In Trade-Weighted USD
Chart 4US Growth Is Downshifting
US Growth Is Downshifting
US Growth Is Downshifting
Related Report Emerging Markets StrategyA Whiff Of Stagflation? This does not mean that a US recession is imminent. Yet, as we discussed in past reports US corporate profits can contract modestly even if GDP slows but does not contract. Third, US EPS expectations have not yet been downgraded and 12-month forward EPS growth expectations are at about 10% (Chart 5). Similarly, although our forward-looking indicator for EM EPS points to a contraction 12-month forward EPS growth expectations are still at 10% (Chart 6). Chart 5US EPS Expectations Have Not Yet Been Downgraded
US EPS Expectations Have Not Yet Been Downgraded
US EPS Expectations Have Not Yet Been Downgraded
Chart 6EM EPS Are Set To Contract
EM EPS Are Set To Contract
EM EPS Are Set To Contract
We expect slower top line growth and shrinking profit margins to cause US and EM corporate profits to contract by about 5% and 10-15%, respectively, in the next 12 months. In brief, neither US nor EM stocks have priced in negative profit growth. Fourth, Chart 7 illustrates that slowing global broad money growth is typically associated with a compression in the P/E ratio of global equities. As of now, there are no sign of reversal in global broad money growth and equity multiples. Chart 7Will Global Equity Multiple Compression Continue?
Will Global Equity Multiple Compression Continue?
Will Global Equity Multiple Compression Continue?
Chart 8US Stocks Are Set To Underperform US Treasurys In Near Term
US Stocks Are Set To Underperform US Treasurys In Near Term
US Stocks Are Set To Underperform US Treasurys In Near Term
Finally, sentiment towards US stocks is very elevated relative to sentiment towards US Treasurys (Chart 8, top panel). Yet, the composite momentum indicator for the US stock-to-bond ratio is breaking below the zero line (Chart 8, bottom panel). This breakdown warns of a period of equity underperformance versus US Treasurys, which would be consistent with pricing in a material economic slowdown. As US growth slows, will the Fed back off from its hawkish rhetoric? Yes, it will tone down its hawkishness at a certain point – but it will not do so immediately. The basis is that even though core US inflation will roll over, it will remain well above 4% versus the Fed’s 2% target. Importantly, wages are a lagging variable, and they will surprise to the upside in the near-term amid tight labor market conditions. This will lead the Fed to err on the hawkish side to manage upside risks to inflation and inflation expectations. All in all, the Fed is not about to do a policy U-turn in the near term. Therefore, we maintain our view that the Fed and stock markets remain on a collision course. Bottom Line: Global growth is downshifting, and financial markets have not yet priced this in. As a result, US bond yields will likely roll over and bonds will outperform stocks in the near term. The US dollar as a countercyclical currency will remain firm despite lower US growth and interest rate expectations. Emerging Asian Currencies Will Depreciate Further Asian export volumes will contract in H2 2022. This is negative for emerging Asian currencies. Chart 9Emerging Asian Currencies And Global Manufacturing Cycle
Emerging Asian Currencies And Global Manufacturing Cycle
Emerging Asian Currencies And Global Manufacturing Cycle
Emerging Asian exchange rates correlate with global trade and global manufacturing cycles, and these currencies will depreciate as global consumer goods demand shrinks (Chart 9). We use an equally-weighted average of KRW, TWD, SGD, THB, PHP and MYR versus the USD to measure the performance of emerging Asian currencies. We exclude the CNY and JPY as they exhibit different dynamics. Chinese imports of various goods and commodities were already contracting in March, prior to the broadening of mainland lockdowns (Chart 10). Weak demand from China will weight on other Asian economies. The CNY is likely to weaken a bit more versus the US dollar due to the challenges facing the Chinese economy. This will reinforce further depreciation in emerging Asian currencies. Relative share prices of global cyclicals versus defensives also point to more downside in emerging Asian currencies (Chart 11). Chart 10Chinese Imports Were Contracting Prior Lockdowns
Chinese Imports Were Contracting Prior Lockdowns
Chinese Imports Were Contracting Prior Lockdowns
Chart 11Emerging Asian Currencies Correlate With Global Cyclicals-Defensives Equity Ratio
Emerging Asian Currencies Correlate With Global Cyclicals-Defensives Equity Ratio
Emerging Asian Currencies Correlate With Global Cyclicals-Defensives Equity Ratio
Bottom Line: An impending contraction in Asian export shipments is negative for emerging Asian currencies. A New Trade: Long Japanese Yen / Short Korean Won One way to play the global trade contraction and peak in US interest rate expectations themes is to go long the JPY / short the KRW: The Korean won typically depreciates versus the Japanese yen when (1) the global manufacturing cycle enters a downtrend and (2) US bond yields decline (Chart 12). These two macro forces are about to transpire and will help the JPY to outperform the KRW. Chart 12KRW vs JPY: A Play On Global Slowdown And Lower US Bond Yields
KRW vs JPY: A Play On Global Slowdown And Lower US Bond Yields
KRW vs JPY: A Play On Global Slowdown And Lower US Bond Yields
Chart 13Trade-Weighted Yen Is At Its Historic Lows
Trade-Weighted Yen Is At Its Historic Lows
Trade-Weighted Yen Is At Its Historic Lows
The Japanese yen has already depreciated significantly versus both the USD and the Korean won. In fact, the trade-weighted yen is close to its historic lows (Chart 13). In addition, investors are very short the yen (Chart 14). The overhang of short positions could cause a violent reversal in the JPY/USD exchange rate. The Japanese yen is extremely cheap according to the real effective exchange rate based on unit labor costs (Chart 15, top panel). By that same measure, the Korean won is not cheap (Chart 15, bottom panel). Chart 14Investors Are Very Short Yen
Investors Are Very Short Yen
Investors Are Very Short Yen
Chart 15The Yen Is Much Cheaper Than The Korean Won
The Yen Is Much Cheaper Than The Korean Won
The Yen Is Much Cheaper Than The Korean Won
Bottom Line: We recommend that investors go long the JPY versus the KRW. The global macro outlook, currency valuations and technicals suggest that this trade offers a good risk-reward profile. On February 2, 2022, we booked profits on our short KRW/long USD position, which we initiated on March 25, 2021. Investment Recommendations Global equity and credit investors should stay defensive. EM share prices and credit markets (USD bonds) are not yet out of the woods. US bond yields are likely peaking. Favor bonds over stocks within both global and EM balanced portfolios. Although the US dollar’s bull market is advanced, a final upleg is likely. Stay short the following EM currencies versus the US dollar: ZAR, PLN, HUF, COP, PEN, PHP and IDR. Consistently, emerging Asian currencies have more downside. A major buying opportunity in EM local currency bonds will emerge once the US dollar begins its descent. Arthur Budaghyan Chief Emerging Markets Strategist arthurb@bcaresearch.com Strategic Themes (18 Months And Beyond) Equities Cyclical Recommendations (6-18 Months) Cyclical Recommendations (6-18 Months)
Executive Summary EU Surprises Carbon Market With Increased CO2 Emission Allowance Supply
EU Surprises Carbon Market With Increased CO2 Emission Allowance Supply
EU Surprises Carbon Market With Increased CO2 Emission Allowance Supply
The EU's failed foreign policy – premised on ever-deeper engagement with the Soviet Union and, after it collapsed, Russia – will drive its hot mess of an energy policy for years. In the short term, the EU's REPowerEU scheme proposed last week to fund the decoupling from Russia will lift its green-house gas (GHG) emissions, if the sale of €20 billion of EU Emission Trading System (ETS) allowances goes forward. Markets traded lower over the week, to make room for the higher ETS pollution-permit supply. This could increase the volume of allowances sales needed to reach the €20 billion target. Another €10 billion investment in natgas pipelines also will be funded. Longer-term, the acceleration of the EU's renewable-power build-out via so-called Projects of Common Interest (PCI) will get an €800 billion boost, with another round of funding to be proposed for early next year. EU funding will lift base metals and steel prices – raising the cost of the renewables build-out – and keep fossil-fuels well bid. Bottom Line: The REPowerEU scheme will increase volatility in the EU's ETS market, and add significant new demand to base metals and fossil-fuel markets. The propensity of EU policymakers to interfere in its ETS market makes it unattractive. We remain long the S&P GSCI index, and the COMT, XOP, XME and PICK ETFs expecting higher base metals, oil and gas prices. Tactically, we are getting long 4Q22 Brent calls struck at $120/bbl, anticipating an EU embargo of Russian oil imports. Feature Over the past three decades, foreign policy for the EU largely was set by Germany, the organization's most powerful economy. Successive generations of German politicians championed the idea that the West could bring the former Soviet Union – and later Russia – into the modern world of global trade through Ostpolitik, which had, at its core, a belief in the power of trade to effect political and economic change.1 This change-through-trade policy survived the Cold War, the collapse of the Soviet Union and rise of Russia from its ashes. It also survived Russia's first invasion of Ukraine in 2014. Indeed, following that invasion, Russia marked the completion of its Nord Stream 2 (NS2) natural gas pipeline – running parallel to NS1 – in September of last year. If NS2 were up and running now, it would have increased Russian gas flows into the EU and its revenue flows.2 As our Geopolitical Strategists noted, Germany even got the Biden administration to agree in summer 2021 to set aside any sanctions so that Germany could operate NS2 with Russia. Related Report Commodity & Energy StrategyDie Cast By EU: Inflation, Recession Risks Rise Yet Russia did not share the German commitment to economic engagement within a US-led liberal international order. Russia's second invasion of Ukraine in February was a bridge too far, and catalyzed the EU's response, again led by Germany, to de-couple from Russia in the energy sector. The EU's reversal of a failed foreign policy, which produced its dependence on Russian energy, leaves it with a hot mess of an energy policy that is evolving rapidly. In its wake, volatility in the EU carbon-trading market has ensued, along with the promise of an accelerated doubling-down on renewable-energy generation. Higher Emissions, Lower Emissions Prices Last week, the EU proposed its REPowerEU scheme, which is meant to enable the decoupling of the EU from Russian energy dependence by funding hundreds-of-billions-of-euros in new energy investments over coming years.3 Chart 1EU Surprises Carbon Market With Increased CO2 Emission Allowance Supply
EU Surprises Carbon Market With Increased CO2 Emission Allowance Supply
EU Surprises Carbon Market With Increased CO2 Emission Allowance Supply
In a history heavily laden with paradox, this new scheme will lift the EU's green-house gas (GHG) emissions – including CO2 – if the sale of €20 billion of EU Emission Trading System (ETS) allowances goes forward.4 So, in the breach, the EU is willing to significantly relax its environmental goals – the E in ESG – to begin undoing its failed foreign policy. Markets already are making room for this increased ETS pollution-permit supply, which, as allowances prices weaken, will require additional supplies to reach the €20 billion target (Chart 1). This will lead to higher coal and fossil fuel usage during Germany's hot-mess de-coupling with Russia. In addition to raising funds by selling pollution permits, the EU will invest another €10 billion in natgas pipelines. This will help counter the likely loss of Russian gas when it embargoes Russian oil imports, but will take time (a few years) to actually put in the ground.5 The additional pipe would address one of the EU's weakest energy links: the lack of pipeline capacity to transport liquified natural gas (LNG) inland once it arrives in Europe. Europe pushed hard to re-load natgas inventories ahead of the coming winter season, and appears to have made progress in this regard (Chart 2). Europe was a strong bid for LNG in the first four months of this year, according to Refinitiv reporting.6 LNG imports were up 58% over the first four months of this year, totaling 45.3mm MT. This kept European natgas prices elevated vs. Asia (Chart 3). Chart 2Europe Re-Loads Storage
One Hot Mess: EU Energy Policy
One Hot Mess: EU Energy Policy
Chart 3Europe Outbids Asia For LNG
One Hot Mess: EU Energy Policy
One Hot Mess: EU Energy Policy
The back-and-forth between the Asian and European markets will continue for the rest of this year, particularly going into the Northern Hemisphere's summer, when demand for natgas in Asia, in particular, will remain strong. REPowerEU Will Boost Base Metals Demand Longer term, the EU's REPowerEU proposal, if approved, will accelerate the EU's renewable-power build-out via so-called Projects of Common Interest (PCI). The proposal contains €800 billion to support new renewable-energy proposals, with another round of funding proposed for early next year. The doubling down by the EU on renewables will lift base metals and steel prices as soon as the REPowerEU program starts funding investments in renewable technology and short-term projects like pipeline buildouts (maybe sooner as hedges are placed). Given the tightness already apparent in the base metals markets, this will raise the price of critical materials – copper, aluminum, steel – and will, in the process, keep fossil-fuels well bid: large capital projects do not get done without a lot of diesel and gasoline being consumed.7 The EU is not alone in its desire to accelerate renewables investment: The US is funding a similar build-out, as is China, which will be accelerating its infrastructure and renewables investments. The constraint on all of these programs to build out renewables is low capex in base metals (Chart 4), and oil and gas (Chart 5). This has kept the level of supply from quickly responding to increased demand, which keeps these markets in sharp backwardations. Market tightness in metals and energy will be compounded by stronger bids from the three largest economic centers in the world – the EU, US and China.Chart 4Weak Capex Holds Base Metals Supply Growth Down …
One Hot Mess: EU Energy Policy
One Hot Mess: EU Energy Policy
Investment Implications Chart 5… And Oil + Gas Supply Growth
One Hot Mess: EU Energy Policy
One Hot Mess: EU Energy Policy
The EU's REPowerEU scheme is not a done deal, but we give it high odds of being adopted. It will increase volatility in the EU's ETS market, and add significant new demand to base metals and fossil-fuel markets. In terms of where to take risk, now that this proposal has been floated, we would avoid getting long carbon permits traded on the EU's ETS carbon market, given the propensity of policymakers to meddle excessively, which, in and of itself, is a risk that is difficult – if not impossible – to forecast. However, we do continue to favor being long the S&P GSCI index, and the COMT, XOP, XME and PICK ETFs expecting higher base metals, oil and gas prices. On a tactical basis, we are getting long 4Q22 Brent calls struck at $120/bbl at tonight's close, anticipating an EU embargo of Russian oil imports. Robert P. Ryan Chief Commodity & Energy Strategist rryan@bcaresearch.com Ashwin Shyam Research Analyst Commodity & Energy Strategy ashwin.shyam@bcaresearch.com Paula Struk Research Associate Commodity & Energy Strategy paula.struk@bcaresearch.com Commodities Round-Up Energy: Bullish US officials involved in negotiations to restore the Iran nuclear deal appear to be signaling US interests could be served by agreeing such a deal.8 Allowing Iran back into the market as a bona fide oil exporter would return ~ 1mm b/d or more to global crude markets by year-end. This would partly reverse the higher prices we expect in the wake of an EU to embargo Russian oil imports this week. Presently, oil markets are rallying as the necessity for Russia to shut in oil production post-embargo is discounted (Chart 6).9 That said, a deal to allow Iran back into export markets would dampen the move we expect in the wake of an EU embargo. The market will remain tight after a US-Iran deal, but this might be attractive to the Biden administration as mid-terms approach, and to the EU, as it also would reduce the funds available for Russia to wage war on Ukraine. On a tactical basis, we are getting long 4Q22 Brent calls struck at $120/bbl at tonight's close, anticipating the EU embargo. We will close this position out if the US and Iran reinstate the Joint Comprehensive Plan of Action (JCPOA), which would allow Iran to resume oil exports. Precious Metals: Bullish The World Platinum Investment Council (WPIC) projects a 2022 surplus of 627 koz, slightly lower than the previous forecast of 657k oz for this period. This year, strong automotive demand is expected to be offset by reductions in jewellery and industrial demand. Car manufacturers’ switch from Russian palladium to platinum – as they self-sanction – will bullish for platinum. Russia accounts for ~40% of global palladium mined output. The organization predicts lower mine supply caused primarily by supply-chain bottlenecks and COVID-19 restrictions. Nornickel, one of the world’s largest platinum miners is expected to reduce mined output on the back of supply-chain disruptions due to Russian sanctions. Base Metals: Bullish Iron ore prices rose on the wider than anticipated cut in China’s benchmark interest rate for mortgages on May 20th (Chart 7). The upcoming easing of lockdowns in Shanghai will further boost iron ore prices, as markets expect Chinese economic activity to pick up. However, if China sticks to its zero-COVID policy, lockdowns will continue to occur in different cities and regions. BCA’s Emerging Markets Strategy expects these ‘rolling lockdowns’ to last at least until the end of this year. This will affect manufacturing and steel production, primary iron ore demand drivers. Iron ore’s reliance on China’s economic health means price of the industrial metal will not meaningfully rise this year, barring a supply shortfall. Chart 6
Brent Prices Going Up
Brent Prices Going Up
Chart 7
BENCHMARK IRON ORE 62% FE, CFR CHINA (TSI) GOING DOWN
BENCHMARK IRON ORE 62% FE, CFR CHINA (TSI) GOING DOWN
Footnotes 1 Please see The Former Chancellor Who Became Putin’s Man in Germany, published by the New York Times 23 April 2022. This is an excellent precis of the history of German-Russian trade vis-à-vis the career of former German chancellor Gerhard Schröder, who held the office from 1998 – 2005. The deep energy relationship with Russia began in the late 1960s under the chancellorship of Willy Brandt. As much as 55% of Germany's gas needs were supplied by Russia prior to its invasion of Ukraine 24 February 2022. Now its Russian gas imports are closer to 20%; Germany and the EU are scrambling to eliminate any and all energy trade with Russia, beginning with reducing gas imports by two-thirds this year, and likely embargoing all oil imports by year-end. 2 Russia completes Nord Stream 2 construction, gas flows yet to start, published by reuters.com 10 September 2021. 3 Please see REPowerEU: A plan to rapidly reduce dependence on Russian fossil fuels and fast forward the green transition* published by the European Commission 18 May 2022. Energy accounted for 62% of the EU's Russian imports in 2021, just under €100 billion worth of gas (40%), oil (27%) and coal (46%), according to the European Commission's tally in In focus: Reducing the EU’s dependence on imported fossil fuels published 20 April 2022. In 2011, energy accounted for 77% of the EU's imports from Russia. 4 Please see Felix K. Chang's report Legacy of Ostpolitik: Germany's Russia Policy and Energy Security published by the Foreign Policy Research Institute in May 2014. This includes a summary of the paradoxical nature of Germany's Ostpolitik policy following Russia's first invasion of Ukraine. 5 Please see German economy minister expects EU embargo on Russian oil 'within days' -ZDF, published by reuters.com 23 May 2022. 6 Please see LNG momentum swinging back to Asia as Europe demand eases: Russell published by reuters.com on 24 May 2022. 7 Please see Tight Commodity Markets: Persistently High Inflation, which we published 24 March 2022. It is available at ces.bcaresearch.com. 8 Please see Analysis: Subtle shift in U.S. rhetoric suggests new Iran approach published by reuters.com 24 May 2022, and German economy minister expects EU embargo on Russian oil 'within days' -ZDF, published by reuters.com 23 May 2022. 9 Please see Oil, Natgas Prices Set To Surge, which we published last week. Investment Views and Themes Recommendations Strategic Recommendations Trades Closed in 2022 Summary of Closed Trades
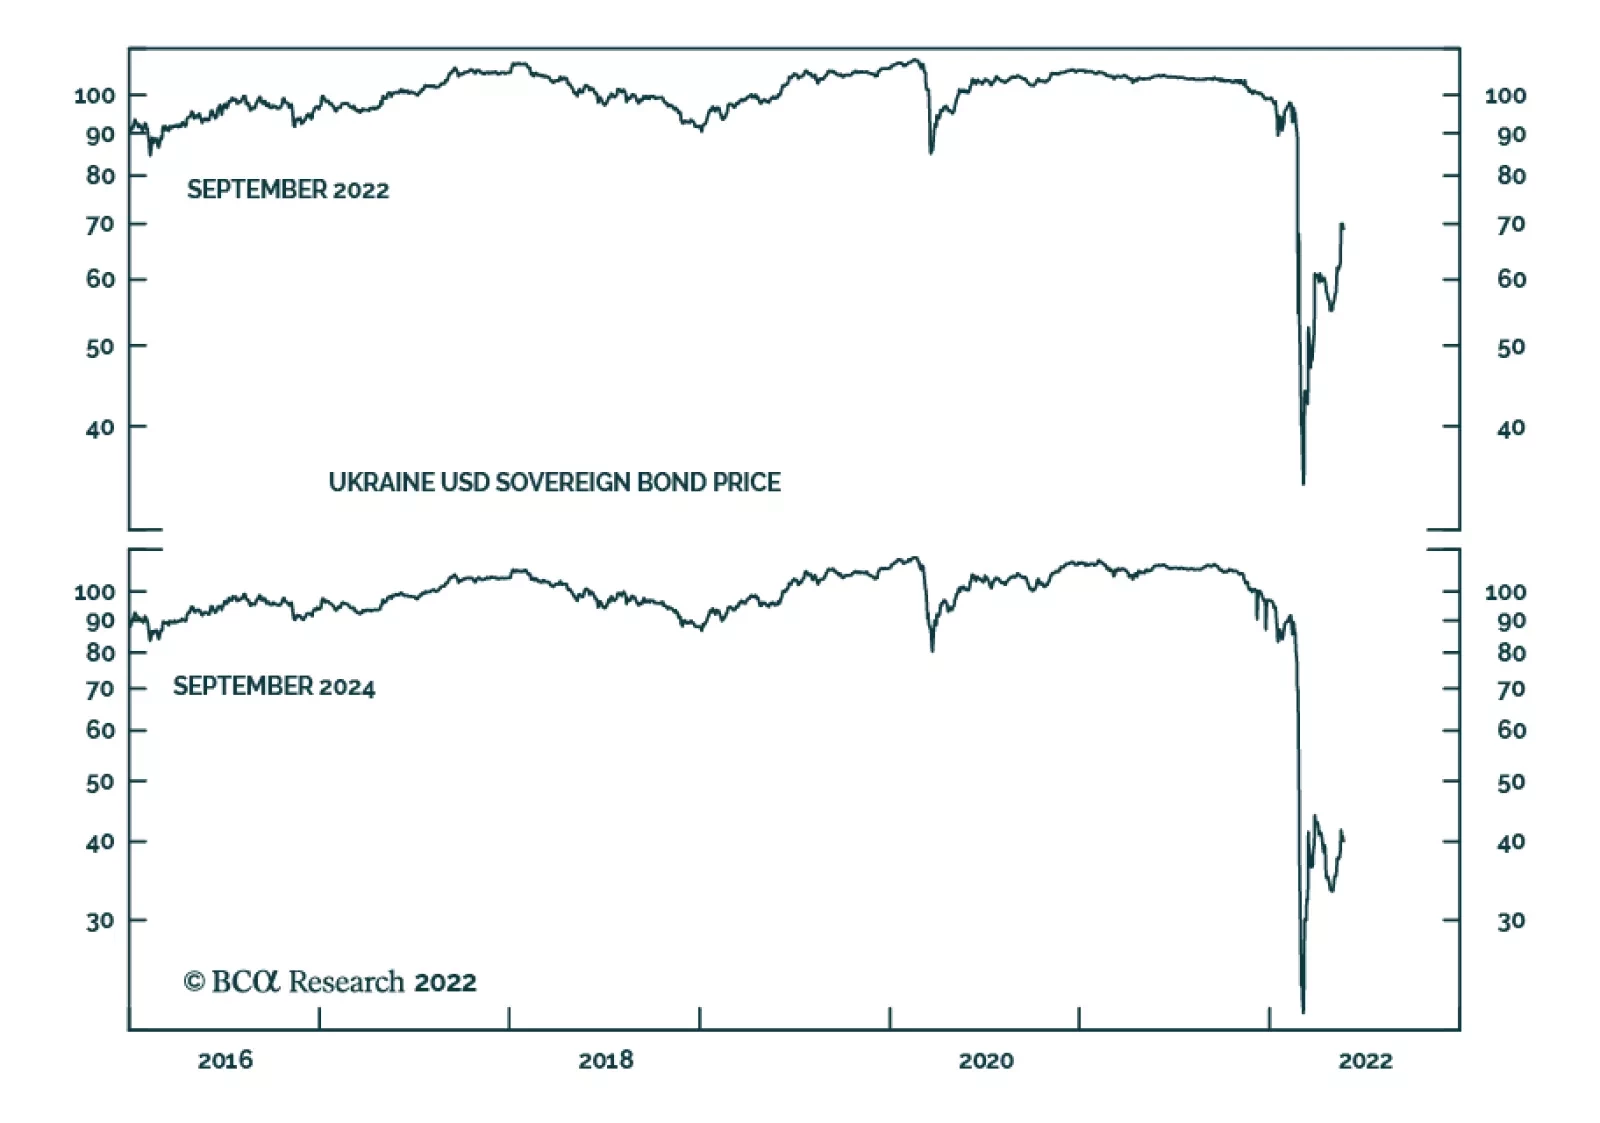
Although Ukranian US dollar sovereign bonds have rebounded since the beginning of the war, their risk-reward tradeoff is not yet attractive. First, the war is likely to be prolonged. US and NATO military and economic assistance to Ukraine helps the latter…