Emerging Markets
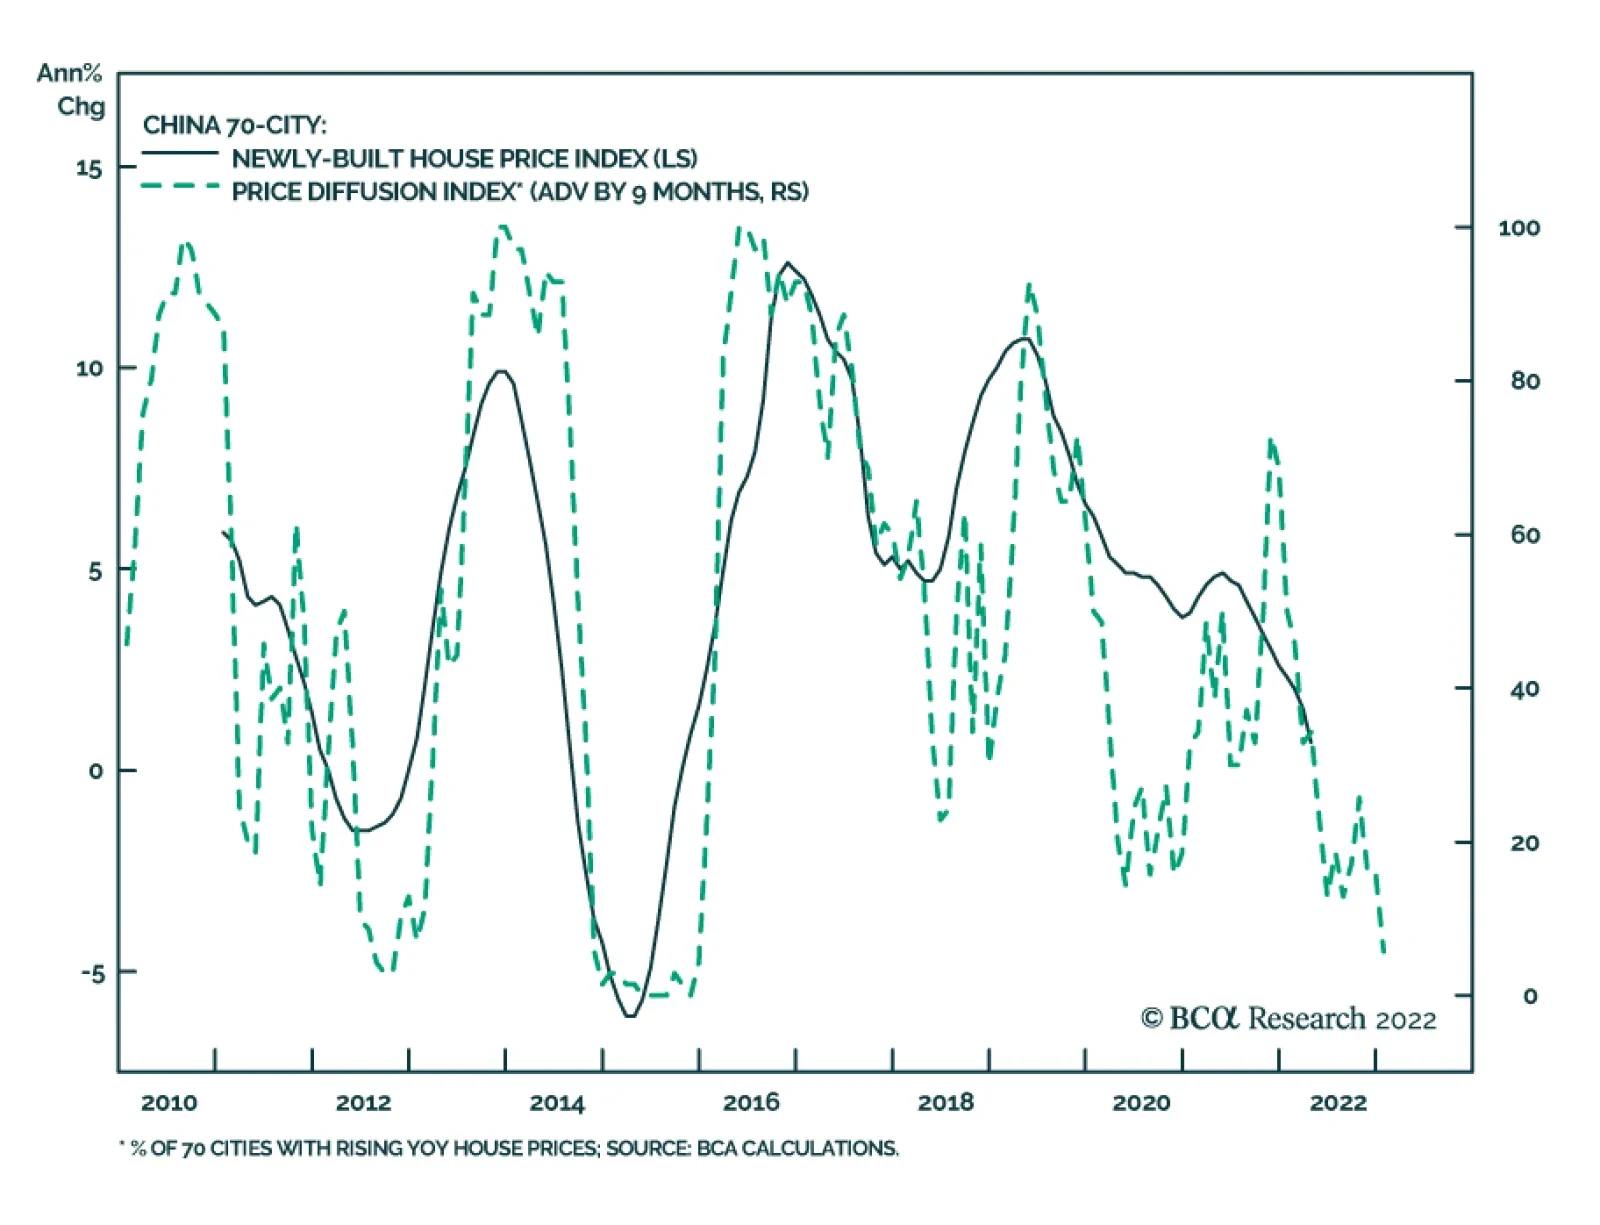
Prices of newly built homes in 70 Chinese cities declined by 0.3% m/m in April, marking the eighth consecutive monthly decline. Home prices in both second- and third-tier cities declined last month, while the pace of increase in first-tier cities moderated to…
BCA Research’s China Investment Strategy service concludes that China’s food price inflation is not immune to the higher prices of global agricultural products. China is well stocked with food reserves and does not rely on imports for most of its…

Executive Summary Increase In Chinese Ag Prices Has Been Much More Muted Than Globally
Increase In Chinese Ag Prices Has Been Much More Muted Than Globally
Increase In Chinese Ag Prices Has Been Much More Muted Than Globally
China’s food price inflation accelerated in April. The rising cost of global agricultural goods and domestic COVID-related disruptions in the supply-chain contributed to a sharp bump in food prices last month. China is not overly reliant on food imports. The country is also well stocked with grain reserves and should weather ongoing global food supply shortages, particularly wheat, better than most emerging economies. However, China will still be impacted by escalating prices of global agricultural products and energy. Some imported goods (e.g. soybeans and related products) that China relies on, coupled with higher energy costs and a bottoming in China’s pork prices, will continue to push up food prices and headline inflation. Higher reading in headline inflation will not change the direction of the PBoC’s monetary policy. However, more expensive food will dampen Chinese households’ spending power on non-food consumer goods, especially as income growth slows. The food and beverage sector in China’s onshore stocks will benefit from higher food costs. We are initiating a new trade: long domestic consumer staples/broad A-share market. CYCLICAL RECOMMENDATIONS (6 - 18 MONTHS) INITIATION DATE RETURN SINCE INCEPTION (%) COMMENT LONG DOMESTIC CONSUMER STAPLES/BROAD A-SHARE MARKET 05/18/2022 Bottom Line: Despite China’s solid self-sufficiency in food supplies, its food price inflation is not immune from the mounting prices of global agricultural products. Is China’s Food Price Inflation Transitory? The food component of China’s consumer price index (CPI) increased by 0.9% in April compared with the previous month, a sharp reversal from a 1.2% month-over-month decline in March. Higher food and energy prices pushed headline CPI to 2.1% in April, the fastest year-on-year growth since August 2020. China is not overly reliant on food imports and has abundant grain reserves. The country is in a better position to weather ongoing global supply shortages in grain compared with other emerging economies, such as the Middle East and North Africa. Moreover, agricultural product prices in China have been structurally higher than those traded in the global commodity market. Large margins in China’s bulk agricultural pricing provide a cushion from escalating global food prices. Nonetheless, China remains at risk for higher food prices this year. Elevated oil prices and the war in Ukraine will further lift the price of fertilizers, adding to input costs for agricultural products. A strong USD will add to the price of USD-denominated commodity imports, particularly soybeans. In addition, China’s domestic pork price may have reached its hog cycle bottom and will pick up in the second half of this year. Food Prices Are Driving Up Inflation China’s headline CPI accelerated to 2.1% in April, on a year-on-year basis, from 1.5% in the previous month. Even though pork prices plunged by 33% in April from a year ago, food prices grew by 1.9% and have been boosted by a jump in the cost of fresh food, such as vegetables (+24% year-on-year), fruit (+14%) and eggs (+12%). Prices in other food categories, such as grains and edible oil, also rose, albeit more modestly (Chart 1A and 1B). Chart 1ALarge Jump In Fresh Food Prices In April
Large Jump In Fresh Food Prices In April
Large Jump In Fresh Food Prices In April
Chart 1BOther Food Prices Also Picked Up, But More Modestly
Other Food Prices Also Picked Up, But More Modestly
Other Food Prices Also Picked Up, But More Modestly
China’s strict COVID-19 containment measures have had a broad-based impact on food supplies. Mobility restrictions, roadblocks and risk-averse truck drivers introduced significant challenges in food supplies and transportation. Lockdowns in some large urban areas also led to panic buying and stockpiling among consumers, pushing up demand. Chart 2Increase In Chinese Ag Prices Has Been Much More Muted Than Globally
Increase In Chinese Ag Prices Has Been Much More Muted Than Globally
Increase In Chinese Ag Prices Has Been Much More Muted Than Globally
Meanwhile, higher global food and energy prices have likely both directly and indirectly contributed to food price inflation in China. The UN Food and Agriculture Organization (FAO) Food Price Index in April this year leapt to its highest level since its inception in 1990; it is 30% higher than last year and nearly double from its trough in mid-2020. Although price increases in China’s domestic agricultural products have been more moderate, the country’s agricultural wholesale prices have jumped by 10% from a year ago (Chart 2). Bottom Line: Food accounts for about 20% of China’s CPI basket (Chart 3). Climbing food, along with energy, prices are driving up China’s headline inflation. Chart 3Food Accounts For 20% Of Chinese Household Budgets
Is China’s Food Price Inflation Transitory?
Is China’s Food Price Inflation Transitory?
China Is In A Good Position To Weather Global Food Supply Shocks … Chart 4Ex-China Food Inventories Haven’t Been Built
Is China’s Food Price Inflation Transitory?
Is China’s Food Price Inflation Transitory?
China is well stocked with food reserves and does not rely on imports for most of its agricultural supplies. Thus, the country should weather ongoing global shortages in the food supply better than most emerging economies (Chart 4). China’s food inventories are significantly higher than levels in the 2006-2008 and 2010-2012 global food price hikes (Chart 5). The nation’s inventories have been steadily building up in the past decade to avert potential food supply shortages. Corn and rice stocks are sufficient to cover consumption for nearly three quarters of a year and wheat stocks are at nearly a year’s worth of consumption. Chart 5China Has Been Building Up Inventories To Buffer Against Supply Shortfalls
Is China’s Food Price Inflation Transitory?
Is China’s Food Price Inflation Transitory?
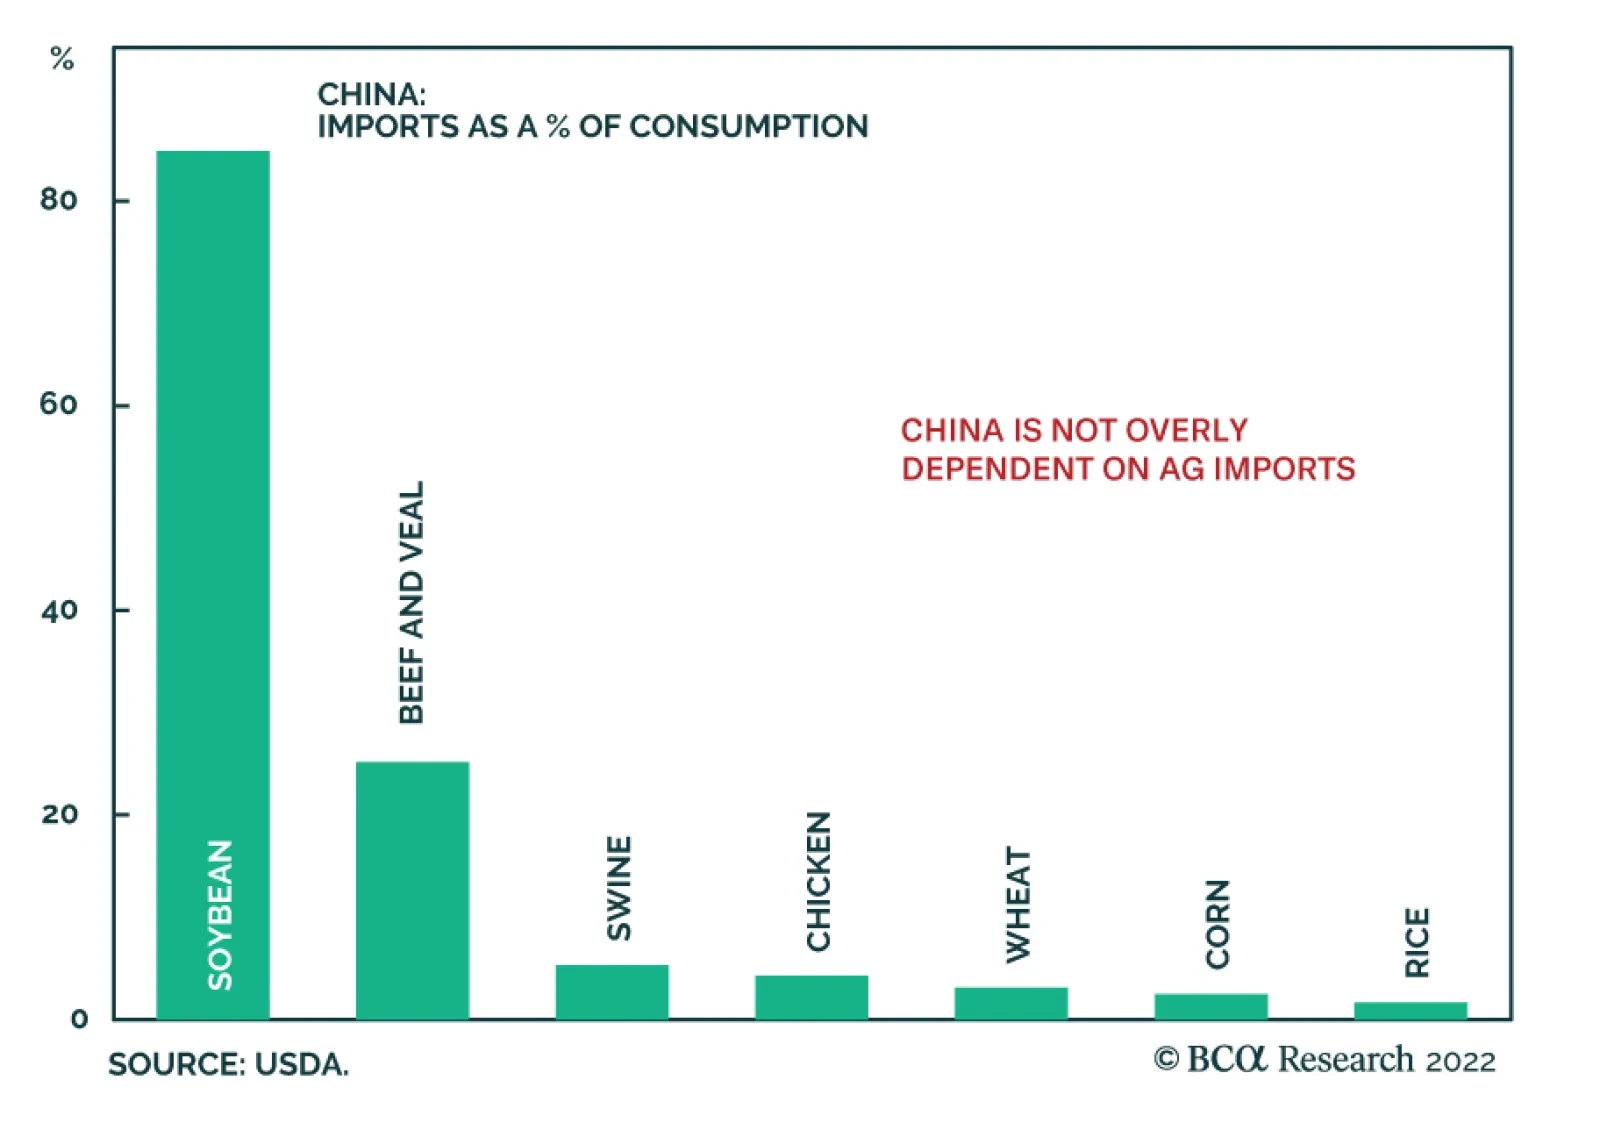
Chart 6China Is Not Overly Dependent On Ag Imports
Is China’s Food Price Inflation Transitory?
Is China’s Food Price Inflation Transitory?
Furthermore, with the exception of soybeans, China is not overly dependent on imports for agricultural supplies (Chart 6). The country is self-sufficient in supplying rice, wheat, and corn, three major staples in China’s grain consumption basket. Less than 5% of China’s total consumption of the three staple grains comes from imports. Bottom Line: China is well stocked with agriculture products and is not overly dependent on imports for its food supplies. … But Not Immune To Food Price Hikes Worldwide Chart 7Ag Products Are Traded At Higher Prices In China Than In The Global Market
Ag Products Are Traded At Higher Prices In China Than In The Global Market
Ag Products Are Traded At Higher Prices In China Than In The Global Market
Rising global agricultural and energy prices could still push up the country’s food price inflation. In USD terms, prices of China’s domestic agricultural products have been structurally higher than those traded on global commodity markets (Chart 7). The government heavily regulates and subsidizes its agricultural procurement prices as an encouragement to domestic farmers. When global food supply shocks sharply pushed up agricultural prices worldwide, China’s domestic agricultural prices, with their large buffer versus global food prices, rose more moderately. Nonetheless, China’s domestic food prices are not insulated from worldwide price hikes. China is facing higher inflation in food prices this year for the following reasons: Pork prices, which account for 13% of China’s CPI food basket, have likely bottomed. Although pork prices remain in a deep contraction year-over-year, they rebounded sharply in April on a month-on-month basis (Chart 8). The number of sows peaked in mid-2021 and has been declining for the past 10 consecutive months. Falling sow numbers have historically led to rising pork prices (Chart 9). Chart 8Pork Prices May Have Bottomed
Pork Prices May Have Bottomed
Pork Prices May Have Bottomed
Chart 9Pork Prices Will Likely Increase In 2H22
Is China’s Food Price Inflation Transitory?
Is China’s Food Price Inflation Transitory?
Nearly 90% of China’s soybean consumption relies on imports, making the country vulnerable to external price fluctuations. Soybean prices have jumped sharply this year. A stronger USD will also add to the price of USD-denominated commodity imports. About 80% of Chinese soybeans are crushed to produce meal to feed China’s massive pork industry, which means higher soybean prices will indirectly lead to rising pork prices by boosting input costs. Given that pig output is approaching its cyclical bottom, an increase in pig livestock would mean more demand for soybeans. Chart 10Edible Oil Prices Reached Their Highest In Decades
Edible Oil Prices Reached Their Highest In Decades
Edible Oil Prices Reached Their Highest In Decades
Growing prices in soybeans and corn will lift the cost of cooking oil, which represents about 8% of China’s food CPI basket (Chart 10). Ukraine supplies 30% of China’s corn imports, and Russia and Ukraine together account for nearly 20% of China’s soybean oil imports. China ramped up corn imports from Ukraine through March despite the war and snapped up large volumes of US corn in April after supplies from Ukraine were cut off. Nonetheless, prices of soybeans and corn will likely remain elevated with no end in sight to the Russia-Ukraine war and supply shortages globally. In addition, as global travel becomes more popular and oil prices remain elevated, the demand for corn-based ethanol, which is blended with gasoline, will also expand. Wheat prices will continue to experience upward pressure in the global market, mainly due to reduced production and exports from Ukraine and Russia (these countries account for 30% of world’s wheat exports). The World Bank forecasts that wheat will be 40% more expensive this year, reaching an all-time high in nominal terms.1 Although China is about 96% self-sufficient in wheat, the upsurge in global prices has boosted China’s domestic cost for wheat; it climbed by 15% in May from a year ago (Chart 11). Higher shipping and input costs, especially for fertilizers, will exacerbate the upside price pressures on agricultural goods. China is the world’s largest exporter of phosphate fertilizer, but its domestic fertilizer prices are heavily subsidized and much cheaper than exported ones (Chart 12). However, the domestic cost of fertilizer will likely follow the lead of rising global prices for fertilizers and agricultural products. Chart 11Chinese Wheat Prices Jumped Against The Backdrop Of Global Supply Shortages
Chinese Wheat Prices Jumped Against The Backdrop Of Global Supply Shortages
Chinese Wheat Prices Jumped Against The Backdrop Of Global Supply Shortages
Chart 12China's Domestic Fertilizer Prices Will Likely Trend Up
China's Domestic Fertilizer Prices Will Likely Trend Up
China's Domestic Fertilizer Prices Will Likely Trend Up
The relationship between agricultural prices and the dollar broke down early last year (Chart 13). Historically, a strong USD would weigh down agricultural prices by encouraging ex-US producers to raise exports and boost global supplies. However, the COVID pandemic and war in Ukraine have triggered a global surge in government controls on food exports. Such broad enforcement of protectionist measures will continue to exacerbate worldwide inflationary pressures on food. Chart 13The Inverse Relationship Between Global Ag Prices And The Dollar Has Broken Down
The Inverse Relationship Between Global Ag Prices And The Dollar Has Broken Down
The Inverse Relationship Between Global Ag Prices And The Dollar Has Broken Down
Bottom Line: China’s food prices face upward pressure. Strengthening global prices in a wide range of agricultural products, coupled with higher energy costs and a bottoming in China’s pork prices, will all contribute to higher food price inflation in the country. Investment Conclusions Chart 14Core CPI Remains Subdued
Core CPI Remains Subdued
Core CPI Remains Subdued
Food price inflation should not constrain the PBoC from further easing monetary policy. As mentioned in previous reports, China’s monetary policy framework has shifted away from headline CPI and has been anchored in core CPI, which has remained subdued (Chart 14). However, China’s accelerating food and energy prices, as household income growth is slowing, will lower households’ purchasing power and curb their demand for non-food consumer goods and services. While China’s overall consumption and economy will suffer from higher food price inflation, soaring food prices will help to widen the profit margins among food processing firms (Chart 15). Furthermore, food and beverage companies in China’s onshore equity market have one of the highest ROAs and the lowest financial leverages (Chart 16). We are initiating a new trade: long Chinese onshore consumer staples/short broad A-share market. Chart 15Long Chinese Onshore Consumer Staples...
Long Chinese Onshore Consumer Staples...
Long Chinese Onshore Consumer Staples...
Chart 16...As The Sector Will Benefit From Rising Food Prices
...As The Sector Will Benefit From Rising Food Prices
...As The Sector Will Benefit From Rising Food Prices
Jing Sima China Strategist jings@bcaresearch.com Footnotes 1 The World Bank’s Commodity Markets Outlook Report, April 2022. Strategic Themes Cyclical Recommendations
Inflationary pressures appear to be intensifying in the Indian economy. Wholesale prices soared by 15.08% in April – the fastest pace since September 1991. Similarly, at 7.79%, CPI inflation exceeds the 6% upper band of the Reserve Bank of India’s (RBI)…
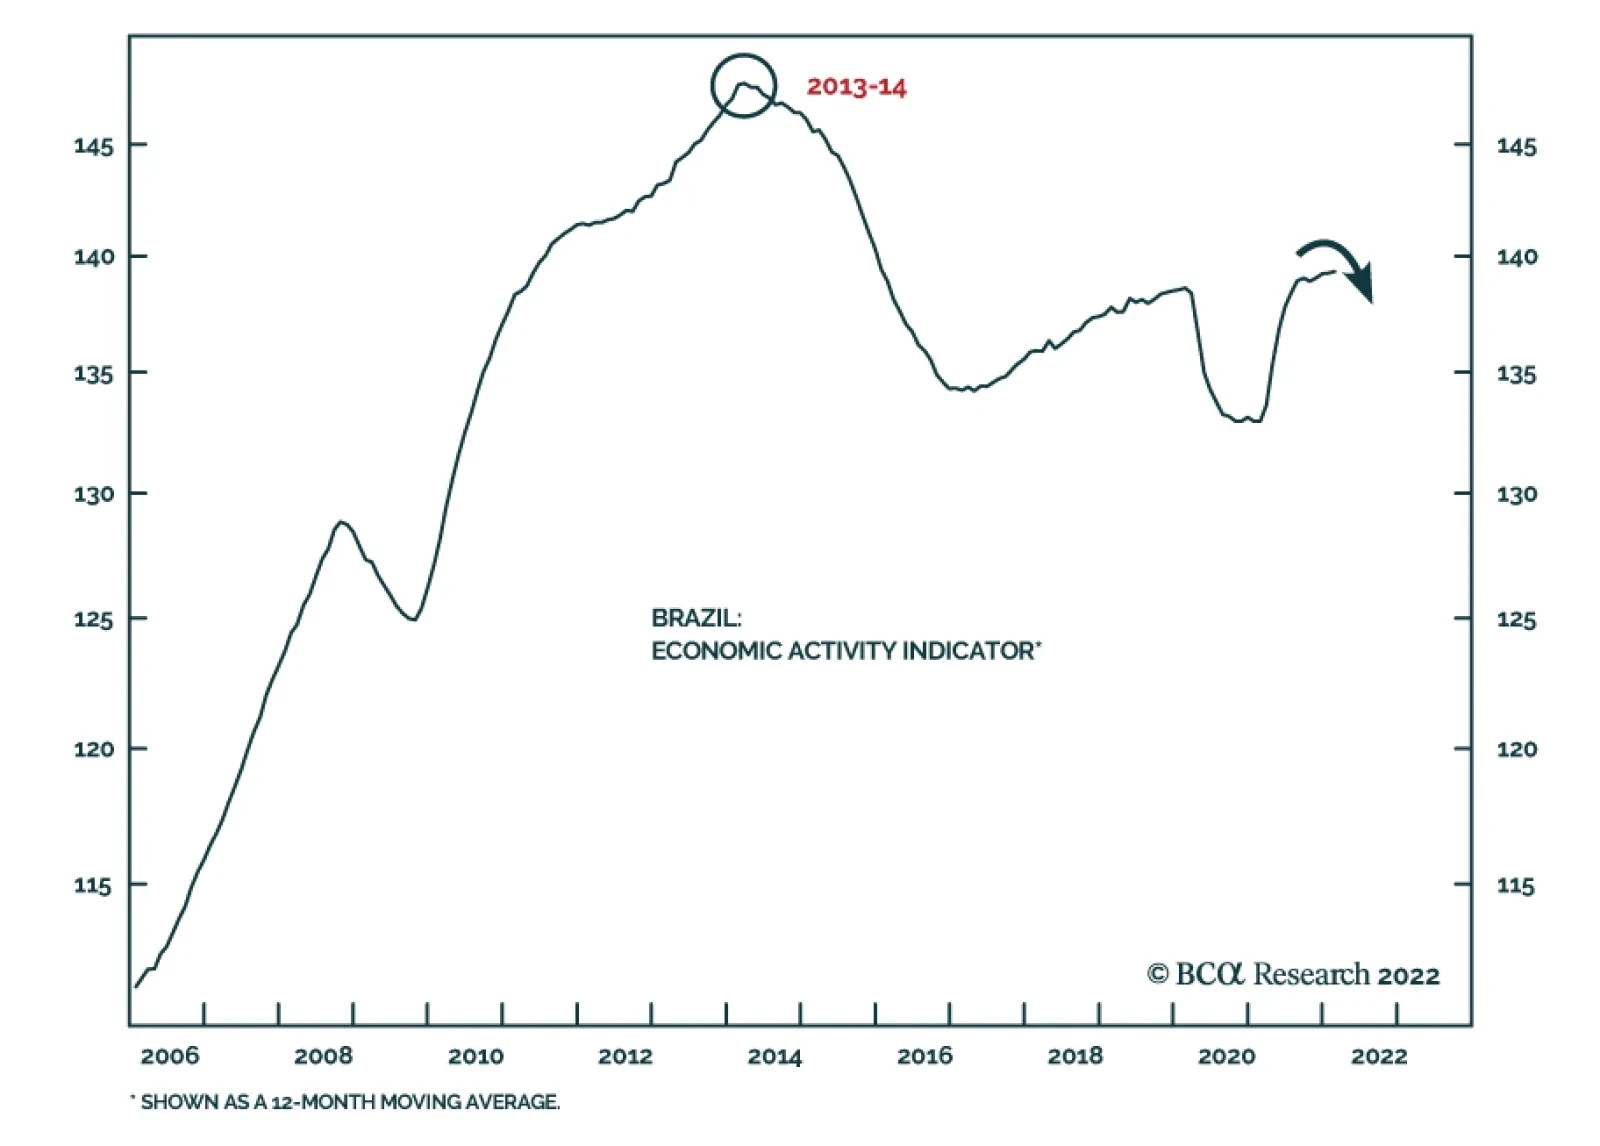
According to BCA Research’s Emerging Markets Strategy service, Brazil’s economy is heading into another recession in H2 this year. Inflation in Brazil continues to surprise to the upside: headline CPI is 12%, core CPI is 9% and trimmed-mean CPI is 9.5%.…
Dear Client, This week, the US Bond Strategy service is hosting its Quarterly Webcast (May 17 at 9:00 AM EDT, 14:00 PM BST, 15:00 PM CEST and May 18 at 9:00 HKT, 11:00 AEST). In addition, we are sending this Quarterly Chartpack that provides a recap of our key recommendations and some charts related to those recommendations and other areas of interest for US bond investors. Please tune in to the Webcast and browse the Chartpack at your leisure, and do let us know if you have any questions or other feedback. To view the Quarterly Chartpack PDF please click here. Best regards, Ryan Swift, US Bond Strategist
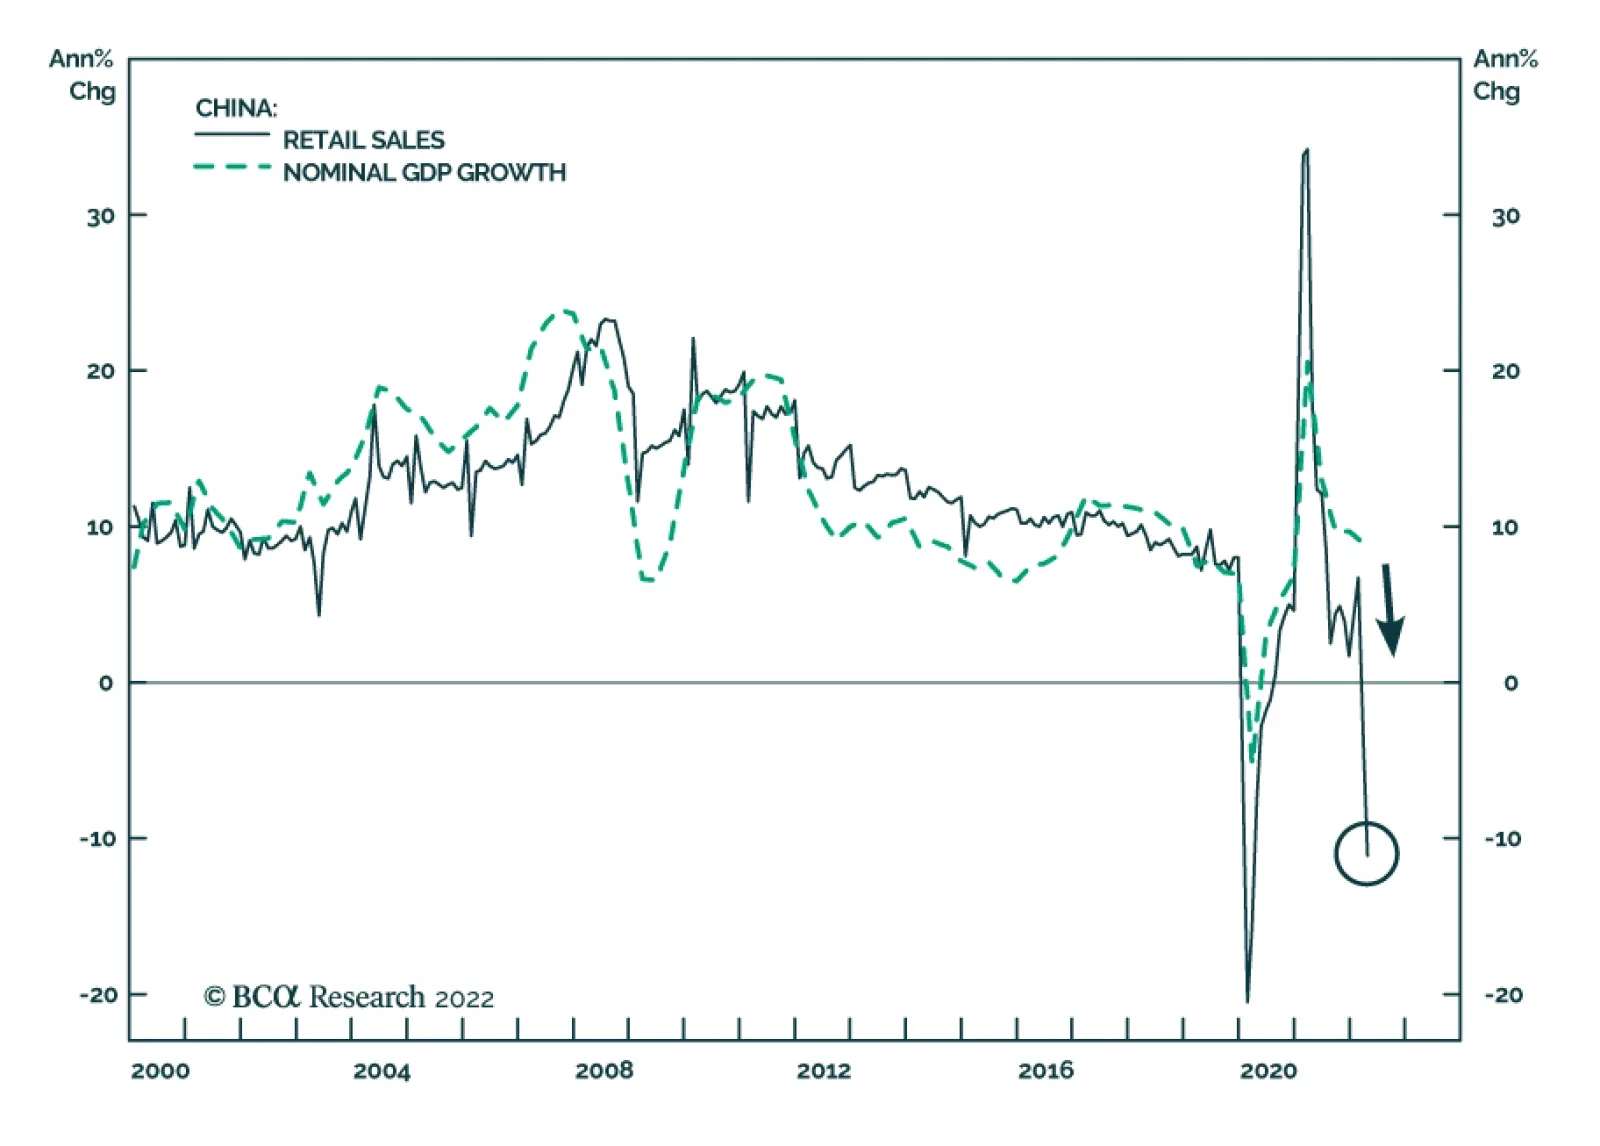
Chinese retail sales shrunk by a whopping 11.1% y/y in April, significantly below the anticipated 6.6% decline. Consumer staples (food, beverage, medicine and petroleum) are the only categories that did not experience a contraction in sales. Instead, their…
Executive Summary Favor ASEAN And The Philippines
Favor ASEAN And The Philippines
Favor ASEAN And The Philippines
Southeast Asia is suffering from fading macro and geopolitical tailwinds but there are still investment opportunities on a relative basis. The peace dividend, globalization dividend, and demographic dividend are all eroding and will continue to erode, though there are relative winners and losers. The Philippines and Thailand are most secure; the Philippines and Indonesia are least dependent on trade; and the Philippines and Vietnam have the highest potential GDP growth. Geopolitical risk premiums have risen for Russia, Eastern Europe, China, and will rise for the Middle East. This leaves ASEAN states as relatively attractive emerging markets. Trade Recommendation Inception Date Return LONG PHILIPPINES / EM EQUITIES 2022-05-12 LONG ASEAN / ACW EQUITIES 2022-05-12 Bottom Line: ASEAN’s geopolitical outlook is less ugly than many other emerging markets. Cyclically, go long ASEAN versus global equities and long Philippine equities versus EM. Feature Chart 1Hypo-Globalization A Headwind For Trading States
Hypo-Globalization A Headwind For Trading States
Hypo-Globalization A Headwind For Trading States
The Philippines elected its second “strongman” leader in a row on May 9, provoking the usual round of editorials about the death of liberalism. Investors know well by now that such political narratives do as much to occlude economic reality as to clarify it. Still, there is a fundamental need to understand the changing global political order since it will ultimately impact the investment landscape. If the global order stabilizes – e.g. US-Russia and US-China relations normalize – then trade and investment may recover from recent shocks. A new era of “Re-Globalization” could ensue. Asia Pacific would be a prime beneficiary as it is full of trading economies (Chart 1). Related Report Geopolitical StrategySecond Quarter Outlook 2022: When It Rains, It Pours By contrast, if Great Power Rivalry escalates further, then trade and investment will suffer, the current paradigm of Hypo-Globalization will continue, and East Asia’s frozen conflicts from 1945-52 will thaw and heat up. Asian states will have to shift focus from trade to security and their economies will suffer relative to previous expectations. How will Southeast Asia fare in this context? Will it fall victim to great power conflict, like Eastern Europe? Or will it keep a balance between the great powers and extract maximum benefits? Three Dividends Three dividends have underpinned Southeast Asia’s growth and prosperity in recent decades: 1. Peace Dividend – A relative lack of war and inter-state conflict. 2. Globalization Dividend – Advantageous maritime geography and access to major economies. 3. Demographic Dividend – Young demographics and strong potential GDP growth. All three of these dividends are eroding, so the macro and geopolitical investment case for ASEAN has weakened relative to twenty years ago. Nevertheless in a world where Russia, China, and the Gulf Arab markets face a higher and persistent geopolitical risk premium, ASEAN still offers attractive investment opportunities, particularly if the most geopolitically insecure countries are avoided. Peace Dividend Favors The Philippines And Thailand Since the end of the US and Chinese wars with Vietnam, military conflicts in Southeast Asia have been low intensity. Lack of inter-state conflict encouraged economic prosperity and security complacency. The five major Southeast Asian nations saw military spending decline since the 1990s and only Vietnam spends more than 2% of GDP (Chart 2). Chart 2Peace Brought Prosperity
Southeast Asia: Favor The Philippines
Southeast Asia: Favor The Philippines
Unfortunately that is about to change. China has large import dependencies, an insufficient tradition of sea power, and feels hemmed in by its geography and the US alliance system. Beijing’s solution is to build and modernize its navy and prepare for potential conflict with the US, particularly over Taiwan. The result is rising tension across East Asia, including in Southeast Asia and the South China Sea. The ASEAN states fear China will walk over them, China fears they will league with the US against China, and the US tries to get them to do exactly that. Hence ASEAN’s defense spending has not kept up with its geopolitical importance and will have to rise going forward. Consider the following: Vietnam risks conflict with China. Vietnam has the most capable and experienced naval force within ASEAN due to its sporadic conflicts with China. Its equipment is supplied mainly by Russia, pitting it squarely against China’s Soviet or Soviet-inspired equipment. But Russia-China ties are tightening, especially after Russia’s divorce with Europe. While Vietnam will not reject Russia, it is increasingly partnering with the United States. The pandemic added to the Vietnamese public’s distrust of China, which is ancient but has ramped up in recent years due to clashes in the South China Sea. While Vietnam officially maintains that it will never host the US military, it is tacitly bonding with the US as a hedge against China. Yet Vietnam does not have a mutual defense treaty with the US, so it is vulnerable to Chinese military aggression over time. Indonesia distances itself from China. Rising security tensions are also forcing Indonesia to change its strategy toward China. Indonesia lacks experience in naval warfare and is not a claimant in the territorial disputes in the South China Sea. It is reluctant to take sides due to its traditionally non-aligned diplomatic status, its military culture of prioritizing internal stability (which is hard to maintain across thousands of islands), and China’s investment in its economy. However, China is encroaching on Indonesia’s exclusive economic zone and Indonesia has signaled its displeasure through diplomatic snubs and high-profile infrastructure contracts. Indonesia is trying to bulk up its naval and air capabilities, including via arms purchases from the West. Malaysia distances itself from China. Malaysia and the Philippines have the weakest naval forces and both face pressure from China’s navy and coast guard due to maritime-territorial disputes. But while the Philippines gets help from the US and its allies and partners, Malaysia has no such allies. Traditionally it was non-aligned. Instead it utilizes economic statecraft, as it has often done against more powerful countries. It recently paused Chinese economic projects in the country to conduct reviews and chose Ericsson over Huawei to build the 5G network. Ongoing maritime and energy disputes will motivate defense spending. The Philippines preserves alliance with United States. Outgoing President Rodrigo Duterte tried but failed to strengthen ties with China and Russia. Beijing continued to swarm the Philippines’ economic zone with ships and threaten its control of neighboring rocks and reefs. Ultimately Duterte renewed his country’s Visiting Forces Agreement with the US in July 2021. The newly elected President “Bong Bong” Marcos is even less likely to try to pivot away from the US. Instead the Philippines will work with the US to try to deter China. Thailand preserves alliance with United States. Thailand is the most insulated from the South China Sea disputes and often acts as mediator between China and other ASEAN states. However, Thailand is also a formal US defense ally and assisted with logistics during the Korean and Vietnamese wars. While US military aid was suspended after the 2014 military coup, non-military aid from the US continued. The State Department certified Thailand’s return to democracy in 2019, relations were normalized, and the annual Cobra Gold exercise resumed in 2020. The US’s hasty normalization shows Thailand’s importance to its regional strategy. On their own, the ASEAN states cannot counter China – they are simply outgunned (Chart 3). Hence their grand strategy of balancing Chinese trade relations with American security relations. Chart 3Outgunned By China
Southeast Asia: Favor The Philippines
Southeast Asia: Favor The Philippines
Chart 4Opinion Shifts Against China
Southeast Asia: Favor The Philippines
Southeast Asia: Favor The Philippines
In recent decades, with the US divided and distracted, they sought to entice China through commercial deals, in hopes that it would reduce its encroachments on the high seas. This strategy failed, as China’s expansion of economic and military influence in the region is driven by China’s own imperatives. Beijing’s lack of transparency about Covid-19 also sowed distrust. As a result, public opinion became more critical of China and defensive of national sovereignty (Chart 4). Southeast Asia will continue trading with China but changing public opinion, the US-China clash, and tensions in the South China Sea will inject greater geopolitical risk into this once peaceful and prosperous region. Military weakness will also lead the ASEAN states to welcome the US, EU, Japan, and Australia into the region as economic and security hedges against China. This trend risks inflaming regional tensions in the short run – and China may not be deterred over the long run, since its encroachments in the region are driven by its own needs and insecurities. Decades of under-investment in defense will result in ASEAN rearmament, which will weigh on fiscal balances and potentially economic competitiveness. Investors should not take the past three decades of peace for granted. Bottom Line: Vietnam (like Taiwan) is in a geopolitical predicament where it could provoke China’s wrath and yet lacks an American security guarantee. The Philippines and Thailand benefit from American security guarantees. Indonesia and Malaysia benefit from distance from China. All of these states will attempt to balance US and China relations – but in the future that means devoting more resources to national security, which will weigh on fiscal budgets and take away funds from human capital development. Waning Globalization Dividend Favors Indonesia And The Philippines All the ASEAN states rely heavily on both the US and China for export markets. This reliance grew as trade recovered in the wake of the global pandemic (Chart 5). Now global trade is slowing down cyclically, while US-China power struggle will weigh on the structural globalization process, penalizing the most trade-dependent ASEAN states relative to their less trade-dependent neighbors. So far US-China economic divorce is redistributing US-China trade in a way that is positive for Southeast Asia. China is rerouting exports through Vietnam, for example, while the US is shifting supply chains to other Asian states (Chart 6). The US will accelerate down this path because it cannot afford substantively to reengage with China’s economy for fear of strengthening the Russo-Chinese bloc. Chart 5Trade Rebounded But Hypo-Globalization Will Force Domestic Reliance
Trade Rebounded But Hypo-Globalization Will Force Domestic Reliance
Trade Rebounded But Hypo-Globalization Will Force Domestic Reliance
Chart 6ASEAN’s Exports To US Surge Ahead Of China’s
ASEAN's Exports To US Surge Ahead Of China's
ASEAN's Exports To US Surge Ahead Of China's
Hence the US will become more reliant on Southeast Asian exporters. Whatever the US stops buying from China will have to be sourced from other countries, so countries that export a similar basket of goods will benefit from the switch. Comparing the types of goods that China and ASEAN export to the US, Thailand is the closest substitute for China, whereas Malaysia is the farthest (Chart 7). That is not to say that Malaysia will suffer from US-China divorce. It is already ahead of China in exporting high-tech goods to the US, which is the very reason its export profile is so different. In 2020, 58% of Malaysia’s exports to the US are high-tech versus 35% for China’s. At the same time, Southeast Asian exports to China may not grow as fast as expected – cyclically China’s economy may accelerate on the back of current stimulus efforts, but structurally China is pursuing self-sufficiency and import substitution via a range of industrial policies (“Made in China 2025,” “dual circulation,” etc). These policies aim to make Chinese industrials competitive with European, US, Japanese, and Korean industrials. But they will also make China more competitive with medium-tech and fledging high-tech exports from Southeast Asia. Thus while China will keep importing low value products and commodities, such as unrefined ores, from Southeast Asia, imports of high-tech products will be limited due to China’s preference for indigenous producers. US export controls will also interfere with ASEAN’s ability to export high-tech goods to China. (In order to retain their US trade, in the face of Chinese import substitution, ASEAN states will have to comply with US export controls at least partially.) Even the low-to-medium tech goods that China currently imports from Southeast Asia may not grow as fast in the coming years as they have in the past. The ten provinces in China with the lowest GDP per capita exported a total of $129 billion to the world in 2020, whereas China’s imports from the top five ASEAN states amounted to $154 billion USD in 2020 (Chart 8). If Beijing insists on creating a domestic market for its poor provinces’ exports, then Southeast Asian exports to China will suffer. China might do this not only for strategic sufficiency but also to avoid US and western sanctions, which could be imposed for labor, environmental, human rights, or strategic reasons. Chart 7The US Sees Thailand And Vietnam As Substitutes For China
Southeast Asia: Favor The Philippines
Southeast Asia: Favor The Philippines
Chart 8China Threatens ASEAN With Import Substitution
Southeast Asia: Favor The Philippines
Southeast Asia: Favor The Philippines
Chart 9Trade Rebound Increased Exposure To US, China
Trade Rebound Increased Exposure To US, China
Trade Rebound Increased Exposure To US, China
China, unlike the US during the 1990s and 2000s, cannot afford to open up its doors and become a ravenous consumer and importer of all Asia’s goods. This would be a way to buy influence in the region, as the US has done in Latin America. But China still has significant domestic development left to do. This development must be done for the sake of jobs and income – otherwise the Communist Party will face sociopolitical upheaval. Malaysia, Vietnam, and Thailand are the most vulnerable to China’s dual circulation strategy because of their sizeable exports to China, which stand at 12%, 15% and 7.6% of GDP respectively (Chart 9). Even though the Southeast Asian states have formed into a common market, and have joined major new trade blocs such as the CPTPP and RCEP, they will not see unfettered liberalization within these agreements – and they will not be drawn exclusively into China’s orbit. Instead they will face a China that wishes to expand export market share while substituting away from imports. The US and India, which are not part of these new trade blocs, will still increase their trade with ASEAN, as they will seek to substitute ASEAN for China, and ASEAN will be forced to substitute them for China. Thus globalization will weaken into regionalization and will not provide as positive of a force for Southeast Asia as it did over the 1980s-2000s. Going forward, the new paradigm of Hypo-Globalization will weigh on trade-dependent countries like Malaysia, Vietnam, and Thailand relative to their neighbors. Within this cohort, Malaysia and the Philippines will benefit from selling high-tech goods to the US, while Thailand and Vietnam will benefit from selling low- and mid-tech goods. China will remain a huge and critical market for ASEAN states but its autarkic policies will drive them to pursue other markets. Those with large and growing domestic markets, like Indonesia and the Philippines, will weather hypo-globalization better than their neighbors. Vietnam, Malaysia, and Thailand are all extremely dependent on foreign trade and hence vulnerable if international trade linkages weaken. Bottom Line: Global trade is likely to slow on a cyclical basis. Structurally, Hypo-Globalization is the new paradigm and will remove a tailwind that super-charged Southeast Asian development over the past several decades. Indonesia and the Philippines stand to suffer least and benefit most. Potential Growth Dividend Favors The Philippines And Vietnam Countries that can generate endogenous growth will perform the best under hypo-globalization. Indonesia, the Philippines, and Vietnam have the largest populations within ASEAN. But we must also take into account population growth, which contributes directly to potential GDP growth. A domestic market grows through population growth and/or income growth. For example, China benefitted from its growing population but now must switch to income generation as its population growth is stagnating. In Southeast Asia, the Philippines, Malaysia, and Indonesia have the highest population growth, while Thailand has the lowest. Thai population growth is even weak compared to China. The total fertility rate reinforces this trend – it is highest in Philippines but lowest in Thailand (Chart 10). A population that is too young or too old needs significant support that diverts resources away from the most productive age group. Philippines and Indonesia have the lowest median age, while Thailand has the highest. The youth of Indonesia and Philippines will come of age in the next decade, augmenting labor force and potential GDP growth. By contrast, Vietnam and especially Thailand, like China, will be weighed down by a shrinking labor force in the coming decade (Chart 11). Chart 10Fertility Rates Robust In ASEAN
Southeast Asia: Favor The Philippines
Southeast Asia: Favor The Philippines
Chart 11Falling Support Ratio Weighs On Thailand, Vietnam
Southeast Asia: Favor The Philippines
Southeast Asia: Favor The Philippines
Hence Indonesia and Philippines will prosper while Thailand, and to some extent Vietnam, lack the ability to diversify away from trade through domestic market growth. Malaysia sits in the middle: it is trade dependent and has the smallest population, but it has a young and growing population, and its labor force is still growing. Yet falling population growth is not a disaster if productivity and income growth are high. Productivity trends often contrast with population trends: Indonesia had the weakest productivity growth despite having a large, young, and growing population, while Vietnam had the strongest growth, despite a population slowdown. In fact Vietnam has the strongest productivity growth in Southeast Asia, at a 5-year, pre-pandemic average of 6.3%, followed by the Philippines (Chart 12A). By comparison China’s productivity growth averaged between 3%-6.6%, depending on the data source. Chart 12AProductivity And Potential GDP
Productivity And Potential GDP
Productivity And Potential GDP
Chart 12BProductivity And Potential GDP
Productivity And Potential GDP
Productivity And Potential GDP
Chart 13Capital Formation Favors Philippines
Capital Formation Favors Philippines
Capital Formation Favors Philippines
Productivity growth adds to labor force growth to form potential GDP. In 2019, Philippines had the highest potential GDP growth at 6.9%, followed by the Vietnam at 6.8%, Indonesia at 5.6%, Malaysia at 3.9% and Thailand at 2.3%. In comparison China’s potential GDP growth was 3.6%-5.9%, again depending on data. Thailand is undoubtedly the weakest from both a population and productivity standpoint, while the Philippines has strength in both (Chart 12B). Countries invest in their economies to increase productivity. In 2019, Vietnam recorded the highest growth in grossed fixed capital formation at around 10.6%, followed by Indonesia at 6.9%, Philippines at 6.3%, and Thailand at 2.2%. Gross fixed capital formation has rebounded from the contractions countries suffered during the pandemic lockdowns in 2020 (Chart 13). Bottom Line: The Philippines has strong potential GDP growth, but Indonesia is not far behind as it invests in its economy. Vietnam has the highest investment and productivity growth, but its demographic dividend is waning. Malaysia is slightly better than Thailand because it has a growing population, but it has stopped investing and it is as trade dependent as Thailand. Thailand is weak on all accounts: it is trade dependent, has a shrinking population, and has a low potential GDP growth. Investment Takeaways Bringing it all together, ASEAN is witnessing the erosion of key dividends (peace, globalization, and demographics). Yet it offers attractive investment opportunities on a relative basis, given the permanent step up in geopolitical risk premiums for other major emerging markets like Russia, eastern Europe, China, and (soon) the Gulf Arab states (Charts 14A & 14B). Indeed the long under-performance of ASEAN stocks as a bloc, relative to global stocks, has recently reversed. As investors recognize China’s historic confluence of internal and external risks, they increasingly turn to ASEAN despite its flaws. Chart 14AASEAN Will Continue To Outperform China
ASEAN Will Continue To Outperform China
ASEAN Will Continue To Outperform China
The US and China will use rewards and punishments to try to win over ASEAN states as strategic and economic partners. Those that have a US security guarantee, or are most distant from potential conflict, will see a lower geopolitical risk premium. Chart 14BASEAN Will Continue To Outperform China
ASEAN Will Continue To Outperform China
ASEAN Will Continue To Outperform China
Chart 15Favor The Philippines
Favor The Philippines
Favor The Philippines
The Philippines is the most attractive Southeast Asian market based on our criteria: it has an American security guarantee, domestic-oriented growth, and high productivity. Populism in the Philippines has come with productivity improvements and yet has not overthrown the US alliance. Philippine equities can outperform their emerging market peers (Chart 15). Indonesia is the second most attractive – it does not have direct territorial disputes with China, maintains defense ties with the West, is not excessively trade reliant, and keeps up decent productivity growth. It is vulnerable to nationalism and populism but its democracy is effective overall and the regime has maintained general political stability after near-dissolution in 1998. Thailand is geopolitically secure but lacking in potential growth. Vietnam has high potential growth but is geopolitically insecure over the long run. Investors should only pursue tactical investments in these markets. We maintain our long-term favorable view of Malaysia, although it is trade dependent and productivity has weakened. In future reports we will examine ASEAN markets in greater depth and with closer consideration of their domestic political risks. Jesse Anak Kuri Associate Editor Jesse.Kuri@bcaresearch.com Matt Gertken Chief Geopolitical Strategist mattg@bcaresearch.com Strategic Themes Open Tactical Positions (0-6 Months) Open Cyclical Recommendations (6-18 Months) Regional Geopolitical Risk Matrix
Executive Summary The surge in food prices following Russia's invasion of Ukraine will drive EM headline inflation higher, given more of individuals' incomes in these economies are spent on food. Economies in the MENA will remain at risk for higher food prices, given their reliance on wheat imports from Ukraine and Russia, which together comprise ~ 30% of global wheat exports. Wheat is the most widely traded grain in the world; its production is second only to that of corn. Higher shipping and input costs – especially for fertilizers – will exacerbate the upside price pressure on grains, particularly wheat. Tenuous social contracts raise the risk of social unrest in MENA reminiscent of the Arab Spring unrest of 2011, which was fueled by food scarcity, economic stagnation and popular anger at autocratic governments. A strong USD will continue to raise the local-currency cost of grains and food, which also will fuel EM inflation. The War Increased Food Prices…
High Food Prices Drive EM Inflation
High Food Prices Drive EM Inflation
Bottom Line: Wheat prices will remain volatile with a bias to the upside for as long as the Russia-Ukraine war persists. The uncertain evolution of this war means EM states will be more exposed to grain-price volatility and higher inflation. This could prove to be destabilizing to MENA states in particular. Separately, we update our recommendations below. Feature High food prices will drive EM headline inflation, owing to the fact a higher proportion of individuals’ incomes in these economies are spent on food. These pressures are particularly acute for wheat following Russia's invasion of Ukraine. Related Report Commodity & Energy StrategyCopper Demand Will Ignore Recession Wheat is the most widely traded grain in the world, according to the World Population Review (WPR).1 In terms of global production, it is second only to corn, totaling 760mm tons in 2020. In order, the top three wheat producers in the world are China, India, and Russia, which account for 41% of global output. The US is the fourth-largest producer. The WPR notes that if the EU were to be counted as a single country, its wheat production would be second only to China (Chart 1). Within emerging markets, the Middle East and North African (MENA) nations will be worst hit by rising wheat prices.2 This is because the bulk of their wheat imports are sourced from Russia and Ukraine, and shipped from Black Sea ports, which are literally caught in the crosshairs of the Russia-Ukraine war. Many of these states do not have sufficient grain reserves to tide themselves over this crisis, and will be forced to import food at elevated prices. A strong USD, which this past week hit a 19-year high, will add to the price of USD-denominated commodity imports, particularly wheat. Russia’s invasion of Ukraine will continue to exacerbate EM food scarcity and drive input costs – e.g., fertilizers – and shipping rates higher. This will keep food and wheat prices volatile with a strong bias to the upside (Chart 2). Chart 1Wheat Production Faces Concentration Risk
High Food Prices Drive EM Inflation
High Food Prices Drive EM Inflation
Chart 2The War Increased Food Prices…
High Food Prices Drive EM Inflation
High Food Prices Drive EM Inflation
In addition to the inflation risk from high food and energy prices, the tenuous social contracts in many states again raises the risk of social unrest in MENA, as occurred in the 2011 Arab Spring protests against food scarcity, economic stagnation and autocratic government.3 War Disruptions Will Continue Russia’s invasion of Ukraine jeopardized wheat supply from two countries which together constitute nearly 30% of total global wheat exports. The invasion will continue to keep wheat prices volatile and biased to the upside (Chart 3). The UN Food and Agriculture Organization (FAO) forecasts Ukraine’s 2021/22 wheat output will drop below its 5-year average, since at least 20% of total arable land cannot be used due to the war. While nearly 60% lower than this time last year, Ukrainian wheat exports in March were not completely shut down. However, they were re-routed around the direct routes from the Black Sea.4 In March, Ukraine managed to export 309k tons of wheat. Chart 3...Particularly Wheat
...Particularly Wheat
...Particularly Wheat
Ukraine will need to rely on these convoluted routes until port services are either restored or unblocked. Exports through more circuitous routes will delay distribution and increase transport costs. This, of course, also adds to the delivered cost of wheat that is being rerouted and slows the overall distribution of grains globally. Additionally, Ukrainian exports via other countries will be disrupted by those countries’ own trade slowdowns, since global bottlenecks affects all trade. Thus far, Russia has been able to maintain wheat exports. Russia continued to supply wheat to global markets in March and April. The USDA estimates that during the 2021/22 crop year, which ends in June, Russian wheat exports will total 33mm tons, which is just 2mm tons lower than the USDA's pre-crisis estimate.5 Because of high carryover stocks and record production, Russia's exports in the 2022/23 crop year are expected to be more than 40mm tons. Sourcing Alternative Wheat Supplies With a sizable portion of global wheat supply at risk – primarily from Ukraine – other exporting countries will need to increase output to fill this gap (Chart 4). This production, however, is not guaranteed, as it depends primarily on weather and fertilizer prices. New trade routes will also need to be created. This will tax existing export infrastructures as shipping dynamics are reconfigured. Particularly important will be how far the new-found sources of supply have to travel to deliver grain, shipping availability, and, of course, the incremental costs incurred to move supplies. As of 2021, the EU – the Black Sea states’ principle competitor in the wheat-export market – and 48% of total wheat exports to Middle East and African countries (Chart 5). The EU's ability to increase exports for the remainder of the 2021/22 crop year will depend on its production, since demand for exports will be guaranteed given the crisis in the Black Sea. Chart 4Other Exporters Will Need To Ramp Up
High Food Prices Drive EM Inflation
High Food Prices Drive EM Inflation
Chart 5MENA Is EU’s Primary Wheat Export Market
High Food Prices Drive EM Inflation
High Food Prices Drive EM Inflation
The European Commission expects the EU to export a record 40mm tons of wheat for the 2022/23 market year, 6mm tons higher than its expected 2021/22 exports. Based on past trade patterns, these excesses will go to the Middle East, Northern and Sub-Saharan Africa. Strong USD Favors LatAm Exports US wheat exports will not be competitive this year or next, given the strong USD and relatively high prices (Chart 6). Additionally, this year’s winter-wheat crop will be affected by current drought conditions in the key Hard Red Winter wheat growing regions of Western Kansas, Colorado, Oklahoma and Texas. Canada faces a similar issue to its North American neighbor. Compared to other major wheat exporting states, it exports wheat at the second highest price, after the US. Furthermore, in 2021/22 Canadian wheat output is expected to be the lowest in 14 years following a warm and dry summer. The USDA expects strong Argentinian and Brazilian wheat exports in 2021/22. Compared to exports from the EU, US, Australia and Canada, wheat from these two sources is cheaper and hence will attract price sensitive bids from the Middle East and Africa. Chart 6US Wheat Remains Non-Competitive
US Wheat Remains Non-Competitive
US Wheat Remains Non-Competitive
A strong USD will incentivize the LatAm giants’ wheat exports since their input costs are in local-currency terms and their revenues are in USD. While some countries have taken advantage of high wheat and food prices to increase exports, others have imposed restrictions or outright bans on exports, which will continue to drive prices higher. Kazakhstan, which constitutes nearly 5% of global wheat exports, now has a quota on such exports, which will affect Central Asian import markets. India was expected to constitute an uncharacteristically large share of wheat exports this year and next. However, the country is experiencing its hottest March in 122 years, which most likely will reduce its harvest this year and incentivize it to keep wheat stocks at home. The world’s second largest wheat producing and consuming nation expects a 6% drop in production this year.6 Fertilizer Costs Will Remain High … Countries’ abilities to increase production will depend on fertilizer availability and costs. The USDA cited high fertilizer prices as one of the causes for lower expected Australian wheat output in 2022/23. Prices of natural gas – the primary feedstock for fertilizers – took off like a rocket following Russia's invasion of Ukraine. High natgas prices feed directly into fertilizer costs (Chart 7). The EU's proposal to ban Russian oil imports could see Russia embargo natgas supply in retaliation, which would further spike natgas and fertilizer costs. This will have knock-on effects on all ags markets. Fertilizer export bans announced by Russia and China are another factor driving fertilizer prices higher (Chart 8). High fertilizer costs most likely will dissuade farmers from using fertilizers in volumes associated with more normal market conditions, and likely will cause them to wait on planting and treating acreage, which will lower crop quality or delay planting. Both scenarios will lead to higher crop prices (Chart 9). Chart 7High Natgas Prices Feeds Right Into Fertilizers
High Natgas Prices Feeds Right Into Fertilizers
High Natgas Prices Feeds Right Into Fertilizers
Chart 8Russia, China Are Big Fertilizer Exporters
High Food Prices Drive EM Inflation
High Food Prices Drive EM Inflation
Chart 9Nitrogen Fertilizer Prices Continue To Rise
Nitrogen Fertilizer Prices Continue To Rise
Nitrogen Fertilizer Prices Continue To Rise
…As Do Shipping Costs Redrawing trade routes – i.e., finding new supplies and new shippers to compensate for the loss of Ukrainian wheat exports – will be expensive. For example, US grain shipping costs soared to an 8-year high after countries, led by China, dramatically increased soybean imports from the US due to a drought in Brazil.7 In 2021, high shipping costs led directly to higher food prices (Chart 10).8 Shipping, like any other commodity, is a function of supply and demand for different types of vessels capable of carrying grain from one part of the world to another. On the supply-side, port closures in China and the Black Sea are increasing port congestion, and making ships available for moving grains scarce. The Ukraine war has stranded ships in the Black Sea and forced merchants to re-route their shipments. This increases sailing times, which has the effect of contributing to supply scarcity in shipping markets. Fewer available ships, coupled with high fuel prices are keeping freight rates elevated. A low orderbook of expected new-vessel additions to the global shipping fleet in 2022 and 2023, along with guidance for ships to reduce speeds to increase fuel efficiency, will exacerbate current ship supply scarcity.9 On the demand side, the major international economic organizations have reduced 2022 GDP estimates due to lower economic activity. Lower economic activity will translate into lower ship demand and hence reduce prices (Chart 11). Chart 10Shipping Prices Remain Elevated
Shipping Prices Remain Elevated
Shipping Prices Remain Elevated
Chart 11Shipping Demand Driven By Economic Activity
Shipping Demand Driven By Economic Activity
Shipping Demand Driven By Economic Activity
Shipping prices will drop meaningfully once port congestion clears. This will depend on the duration of COVID-19 in China and the evolution of the Russia-Ukraine war. A recession – the probability of which will increase if the EU bans Russian oil imports and Russia retaliates with its own natgas ban – acts as a downside risk to shipping costs. Investment Implications The gap in Black Sea wheat exports produced by the Russia-Ukraine war will require a ramp-up in other countries’ supply. Higher production is contingent on weather conditions and input costs. Changing weather patterns, due to climate change, will increase food insecurity, and make it more difficult to predict how ag markets – particularly grain trading – will handle this shock and other shocks down the road. We remain neutral agricultural commodities but will follow wheat and food market developments closely. Ashwin Shyam Research Analyst Commodity & Energy Strategy ashwin.shyam@bcaresearch.com Paula Struk Research Associate Commodity & Energy Strategy paula.struk@bcaresearch.com Robert P. Ryan Chief Commodity & Energy Strategist rryan@bcaresearch.com Commodity Round-Up Energy: Bullish Going into the Northern Hemisphere's summer driving season, US retail gasoline prices are trading at record levels -- $4.328/gal ($181.78/bbl) as of 9 May 2022, according to the US Energy Information Administration (Chart 12). Regular gasoline (RBOB specification traded on the NYMEX) for delivery in the NY Harbor settled at $144.27/bbl ($3.4349/gal) on Tuesday, giving refiners a rough wholesale margin (versus Brent crude oil) of $41.81/bbl. Retail diesel fuel prices also have been extremely well bid, posting record highs as well of $5.623/gal ($236.17/bbl) on 9 May 2022 (Chart 13). On the NYMEX, the ultra-low sulfur diesel fuel contract for July delivery settled at $3.6793/gal ($154.53/bbl). Jet fuel prices also are extremely well bid, as demand increases against a backdrop of lower refinery output pushed NY Harbor prices to $7.61/gal ($319.62/bbl) on 4 April 2022. NY Harbor jet-fuel prices have been much stronger than US Gulf prices and European prices seen in the Amsterdam-Rotterdam-Antwerp (ARA) markets, which were averaging ~ $3.60/gal, according to the EIA. This is accounted for by robust demand – evident since mid-2021, when it recovered pandemic-induced losses – and lower-than-normal output of jet by refiners. Assuming the US does not go into a profound recession, refined-product markets likely will remain tight during the summer-driving season and into the rest of this year, in our estimation. As is the case with the Exploration & Production companies, refiners also have been parsimonious with their capex, which translates into lower capacity to meet demand. Base Metals: Bullish Per the latest US CFTC data, we believe hedge funds and speculators investing in copper are dismissing bullish micro fundamentals and are focusing on bearish macroeconomic factors, such as the probability of an economic slow down increases. This would explain why funds’ short positions have exceeded long positions for the first time since end-May 2020. We have written about medium-to-long-term bullish micro fundamentals at length in previous reports.10 On micro fundamentals, the Chilean constitutional assembly passed articles expanding environmental protection from mining over the weekend. These will be added to the draft constitution to be voted on in September. The article expanding state control in Chilean mining activity did not pass and will be renegotiated before being sent back to the constitutional assembly for a second vote. Uncertain governance will affect mining investment in the state, as BHP recently highlighted. Chart 12
High Food Prices Drive EM Inflation
High Food Prices Drive EM Inflation
Chart 13
High Food Prices Drive EM Inflation
High Food Prices Drive EM Inflation
Footnotes 1 Please see Wheat Production by Country 2022, published by worldpopulationreview.com. 2 Awika (2011) notes, "… cereal grains are the single most important source of calories to a majority of the world population. Developing countries depend more on cereal grains for their nutritional needs than the developed world. Close to 60% of calories in developing countries are derived directly from cereals, with values exceeding 80% in the poorest countries." Please see Joseph M. Awika (2011), "Major Cereal Grains Production and Use around the World," published by the American Chemical Society. The three most important grains in this regard are rice, corn and wheat. 3 Please see Egypt's Arab Spring: The bleak reality 10 years after the uprising, published by dw.com on January 25, 2021. 4 Please see First Ukrainian corn cargo leaves Romanian Black Sea port, published by Reuters on April 29, 2022. 5 All USDA estimates mentioned in this report are taken from the USDA’s Grain and Feed Annual for each country. 6 Please refer to After five record crops, heat wave threatens India’s wheat output, export plans, published by Reuters on May 2, 2022. 7 Please refer to U.S. Grain Shipping Costs Soar With War and Drought Swinging Demand, published by Bloomberg on March 18, 2022. 8 For a more detailed discussion, please refer to Risk of Persistent Food-Price Inflation, which we published on November 11, 2021. 9 For estimates of orderbook vessels in 2022/23 please see Shipping market outlook 2022 Container vs Dry bulk, published by IHS Markit on November 30, 2021; slower speeds could reduce effective shipping capacity by 3-5%, according to S&P Global (see Shipping efficiency targets could prompt slower speeds and reduced capacity: market sources). 10 For the latest on this, please see Copper Demand Will Ignore Recession, which we published on April 14, 2022. Investment Views and Themes Recommendations Recommendations: We are re-establishing our positions in XME, PICK and XOP, which were stopped out APRIL 22, 2022 with gains of 42.42%, 9.77% and 20.91%, respectively, at tonight's close. We also will be adding the VanEck Oil Refiners ETF (CRAK) to our recommendations, given our bullish view of the global refining sector. Strategic Recommendations Trades Closed in 2022
Image
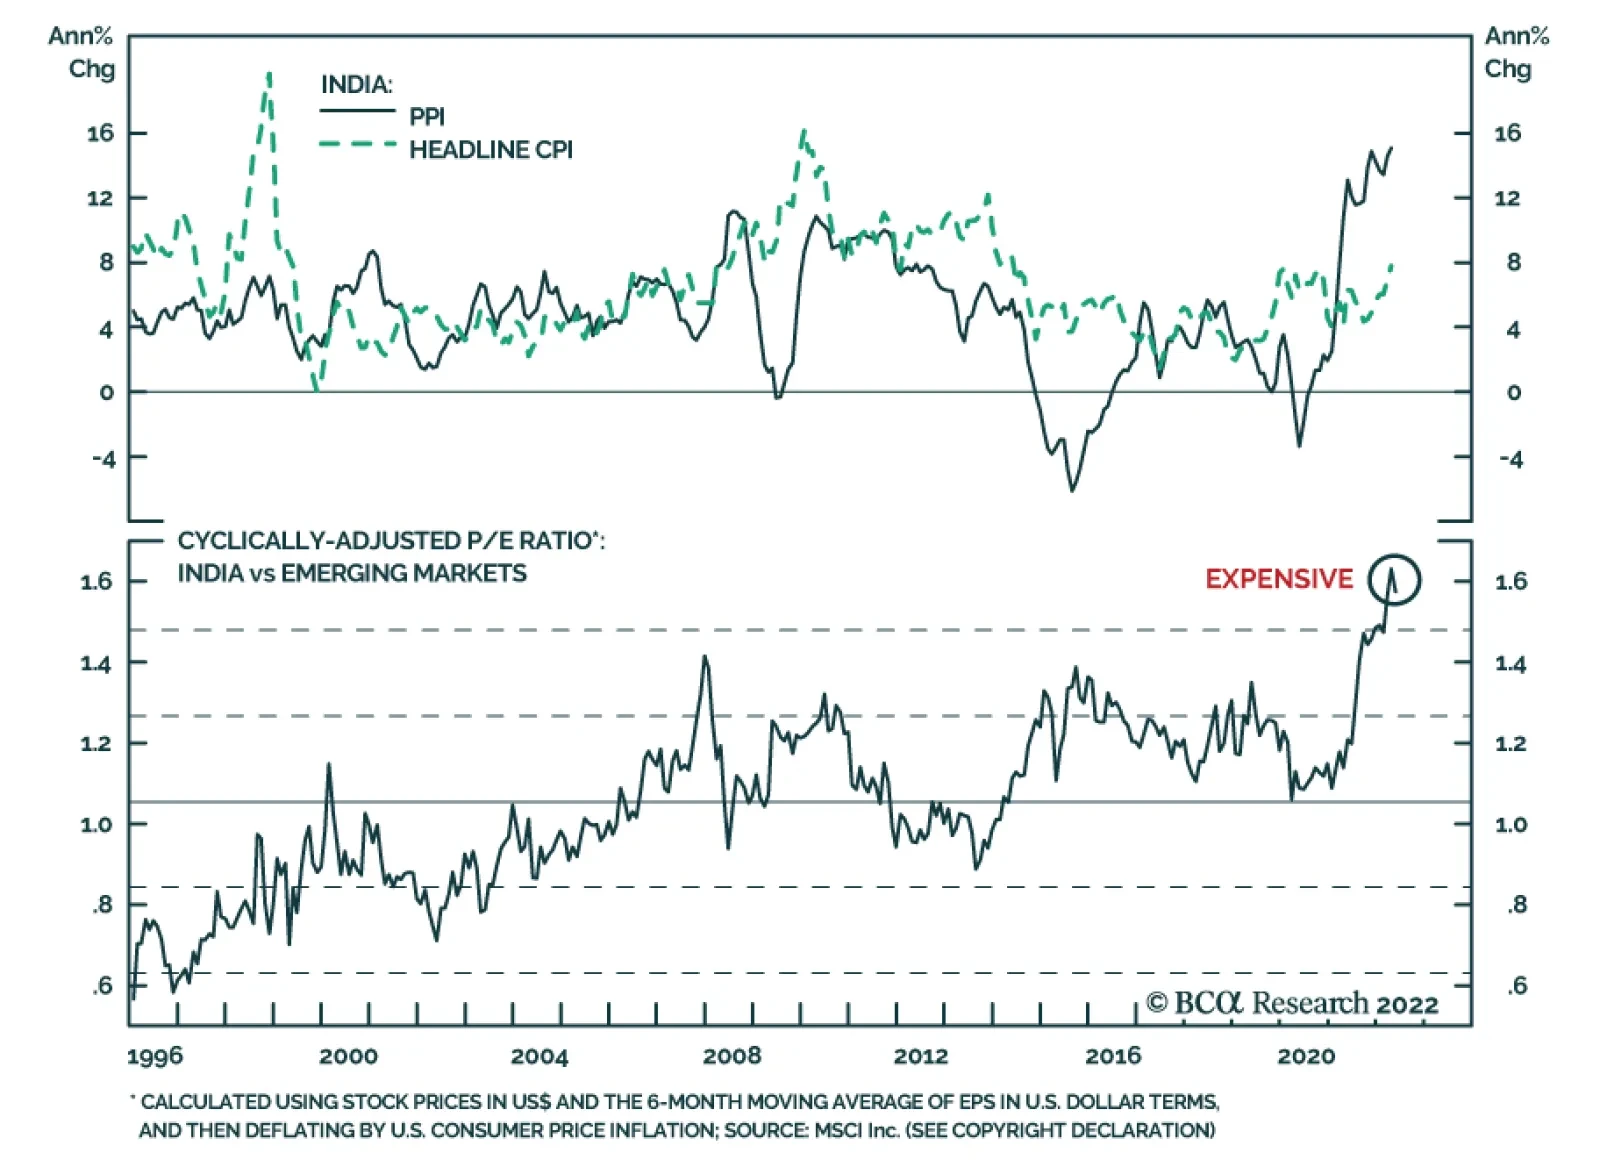
Executive Summary India’s annual consumer price inflation will rise a notch from current levels but is unlikely to surpass 8% in a sustained manner. Demand-driven price pressures are absent in the Indian economy. So are wage pressures. That leaves commodity prices as the sole source of inflation. Global industrial commodity prices dictate India’s producer price inflation, but not consumer price inflation. The latter is determined by domestic factors. Higher import costs on fertilizer and edible oils will push up India’s food inflation a bit, but food inflation is mainly affected by the ‘Minimum Support Price’ that the government pays to farmers for food procurement. The central bank is making a policy mistake by raising interest rates to suppress commodity price-driven inflation when domestic demand is quite weak. The Indian profit outlook has deteriorated meaningfully due to falling margins. Higher interest rates will add to the headwinds. This bourse is also very expensive relative to its EM peers. India: Consumer Price Inflation Is A Function Of Broad Money Supply
India: Consumer Price Inflation Is A Function Of Broad Money Supply
India: Consumer Price Inflation Is A Function Of Broad Money Supply
Bottom Line: Absolute return investors should avoid this bourse. Asset allocators should stay underweight India in EM and Emerging Asian equity portfolios. Bond investors should stay neutral India in EM and Emerging Asian domestic bond portfolios. Feature In much of the developed world, inflation has risen to 40-year highs. Inflation has surged in many developing countries as well. India has been one major exception in the latter group − where both headline and core consumer inflation have remained rangebound so far (Chart 1). The question is, if and for how long will India be able to buck the tide of higher global inflation? On a related note, what would be the likely effects of higher inflation on Indian markets? We believe headline and core CPI in India will rise from the current levels of around 6.5%; but will not go past 8% on a sustainable basis. This is much below the double digit levels the country often witnessed in the 1990s and 2000s. The main reason behind our optimism is that demand-driven price pressures are absent in the current cycle. The sole source of inflation is higher global commodity prices, which could be peaking on a rate of change basis. The commodity-led nature of inflation in India also makes monetary policy a less effective tool to control it in this cycle. In fact, considerable monetary tightening will be a policy error as it could nip the already weak domestic demand in the bud. We turned bearish on Indian stocks in March this year, and believe they have more downside in absolute terms. Their recent relative outperformance will also fizzle out sooner rather than later, as this was partially due to investors forsaking the Chinese market. This caused a sharp fall in the latter boosting other bourses’ relative performances (Chart 2). Chart 1India Has So far Been An Exception To The Global Trend Of Surging Inflation
India Has So far Been An Exception To The Global Trend Of Surging Inflation
India Has So far Been An Exception To The Global Trend Of Surging Inflation
Chart 2Indian Stocks Will Weaken More And Underperform EM
Indian Stocks Will Weaken More And Underperform EM
Indian Stocks Will Weaken More And Underperform EM
Investors would therefore do well to stay underweight Indian stocks in EM and Emerging Asian equity portfolios for now. Local currency bond investors should stay neutral India in the respective EM and Emerging Asian bond portfolios. Why Has Inflation Stayed Downbeat? Just like in other economies, labor productivity trends set the tone of India’s structural inflation backdrop. Up until the early 2000s, India’s average productivity gains used to be rather low: of the order of 3% annually. Thereafter, a surge in capital spending on infrastructure and other productive capacity propelled India’s average annual productivity growth rate to twice as high. This has helped improve India’s structural inflation backdrop considerably. That said, over a cyclical horizon, it is the ebbs and flows of broad money supply (M3) that determines India’s consumer inflation trajectory (Chart 3). Chart 3India: Consumer Price Inflation Is A Function Of Broad Money Supply
India: Consumer Price Inflation Is A Function Of Broad Money Supply
India: Consumer Price Inflation Is A Function Of Broad Money Supply
Chart 4Money Supply Will Stay Tame As Its Sources Are Rather Muted
Money Supply Will Stay Tame As Its Sources Are Rather Muted
Money Supply Will Stay Tame As Its Sources Are Rather Muted
Broad money supply in India has decelerated over the past year and a half. This is in sharp contrast to most developed economies and many emerging economies in Latin America and EMEA; and it is the main reason why inflation prints have diverged between those countries and India. In the foreseeable future, there is little indication that India’s broad money supply will accelerate by any meaningful measure. This is because the major sources of money creation – bank credit origination and the central bank and commercial banks’ purchases of non-bank securities − have all remained rather muted in the recent past. Bank credit has grown only at a 7% nominal annualized rate over the past three years. In real terms (deflated by headline CPI), they have barely risen. Commercial banks’ purchases of government bonds are growing at only 5%. The central bank’s monetization of government debt, the other source of money creation, has also decelerated since early 2020 (Chart 4). The decelerating broad money supply means the odds of a demand-driven surge in consumer price inflation is also quite low. What About Commodity-Led Inflation? Elevated commodity prices have pushed up India’s consumer price inflation by a notch. Yet, given that much of the rally in global industrial commodities is probably already behind us, it’s effect on future inflation in India will likely be limited: Global industrial commodity prices drive India’s producer price inflation1 (PPI). But the correlation with India’s consumer price inflation is only tenuous (Chart 5). Moreover, given that India’s PPI tracks global commodity prices with a few months lag, this is also set to decelerate in the coming months. Consistently, the pass-through effect from high global crude prices to local gasoline and diesel prices in India has also rolled over on a rate of change basis (Chart 6, top panel). Chart 5Global Commodity Prices Dictate India's Producer Prices, But Not Consumer Prices
Global Commodity Prices Dictate India's Producer Prices, But Not Consumer Prices
Global Commodity Prices Dictate India's Producer Prices, But Not Consumer Prices
Chart 6Domestic Fuel Price Inflation Is Much Lower Than Crude Price Would Suggest
Domestic Fuel Price Inflation Is Much Lower Than Crude Price Would Suggest
Domestic Fuel Price Inflation Is Much Lower Than Crude Price Would Suggest
Notably, Indian authorities did not reduce local gasoline and diesel prices back in 2020-21 when global crude prices had slumped. Hence, the incremental rise in local fuel prices in the past several months has not been as steep as they might have been (Chart 6, bottom panel). As a result, energy-related inflation prints in India are not as high as crude oil prices would suggest. In fact, CPI for Fuel & Light and Transport & Communication2 have both decelerated from 12%+ YoY rate to 8% and are slowing further. That means the pass-through from higher fuel prices to the rest of the economy going forward will also be receding. Fertilizer (mostly potash) and edible oil3 are the two other major commodities that India imports. The import bill of these two items has almost doubled in dollar as well as in rupee terms in the past year due to surging prices globally. Together, they now account for 5% of India’s total imports. Higher import costs of these items will lead to slightly higher food prices in future. That said, India’s food inflation moves more with the “Minimum Support Price” (MSP). This is the price that the government pays to farmers for procuring various food grains every year (Chart 7, top panel). Since the government is by far the single largest purchaser, the price it pays sets the floor in the market. In recent years, authorities did not hike procurement prices by much. Unless authorities announce a much higher MSP for the current year, both food and headline CPI will likely stay under control. Finally, India is largely self-reliant when it comes to food. The buffer stock of the country’s food grains, currently at 74 million tons, far exceeds the estimated requirements (Chart 8). Short of any logistics debacle therefore, it’s hard to imagine that food prices could soar sustainably. Chart 7The Government's Support Prices Have A strong Bearing On Food Inflation And Rural Wages
The Government's Support Prices Have A strong Bearing On Food Inflation And Rural Wages
The Government's Support Prices Have A strong Bearing On Food Inflation And Rural Wages
Chart 8India's Buffer Stock Of Food Grains Is Quite Robust
India's Buffer Stock Of Food Grains Is Quite Robust
India's Buffer Stock Of Food Grains Is Quite Robust
All that said, food inflation is the main risk on India’s inflation horizon. The reason for that is rising food prices often unmoor household inflation expectations, and eventually lead to higher realized inflation. Chart 9 shows that higher food prices in India do leak into non-food prices, albeit to a limited extent. As such, marginally higher food prices owing to higher import costs of fertilizer and edible oils will see India’s core inflation also rise a bit. Chart 9Higher Food Inflation Leaks Into Core Inflation, But Only So Much
Higher Food Inflation Leaks Into Core Inflation, But Only So Much
Higher Food Inflation Leaks Into Core Inflation, But Only So Much
How High Can Core CPI Rise? As discussed, India’s core inflation will likely remain mostly under control. A crucial reason for that is wage pressures are absent in India. This is in stark contrast to the US, where high wage pressures are threatening to morph into a wage-inflation spiral. In rural India, both farm and non-farm nominal wages have been growing at an average sub-5% rate since 2016, which is below CPI inflation. One reason rural wages have stayed low is that authorities have not raised the MSP much in recent years. A lower MSP not only reins in food prices, but it also keeps a tab on wages (Chart 7, bottom panel). As such, unless the government decides to raise the MSP meaningfully this year, it will be difficult for rural wages to rise materially. On the urban side, the RBI survey on expectations for industrial salary and remunerations also depicts a similarly subdued outlook (Chart 10). Going forward, as tens of millions of young people continue to join the workforce every year, the broader wage picture in India is unlikely to change much. Subdued wage pressures will help keep a tab on the general inflationary pressures in the economy. On its own, India’s core CPI (i.e., CPI ex-food and ex-fuel) is largely a function of domestic money and credit trends. Global crude oil prices also matter to some extent. However, as discussed above, few of these variables are accelerating sharply. That means odds are low that core CPI will rise much more from the current levels. Indeed, our in-house model for core CPI, based on the variables just mentioned, points to a rather benign outlook (Chart 11). Chart 10Wage Pressures Are Absent, Entailing Core Inflation Will Stay Under Control
Wage Pressures Are Absent, Entailing Core Inflation Will Stay Under Control
Wage Pressures Are Absent, Entailing Core Inflation Will Stay Under Control
Chart 11India's Inflation Outlook Is Sanguine
India's Inflation Outlook Is Sanguine
India's Inflation Outlook Is Sanguine
Does Inflation Hurt Indian Stocks? The primary drivers of Indian stocks are economic growth and corporate profits. Stock prices do not usually get hurt as long as CPI stays in low and mid-single digits. However, once CPI breaches the 8% mark sustainably, stocks typically sell off (Chart 12). Chart 12Indian Stocks Face Major Headwinds When CPI Breaches The 8% Mark
Indian Stocks Face Major Headwinds When CPI Breaches The 8% Mark
Indian Stocks Face Major Headwinds When CPI Breaches The 8% Mark
Chart 13Indian Stocks Have A Positive Correlation With PPI, As Both Benefit From Global Growth
Indian Stocks Have A Positive Correlation With PPI, As Both Benefit From Global Growth
Indian Stocks Have A Positive Correlation With PPI, As Both Benefit From Global Growth
The reason is that when inflation is sustainably high, meaningful monetary tightening ensues. Higher interest rates make it costlier to borrow for either consumption or investment purposes, and therefore depresses demand in the economy. That leads to a squeeze in profit margins, which in turn weighs on equity multiples and thus equity prices. Interestingly, unlike CPI, which has no stable correlation with Indian stock prices, PPI has a robust positive correlation with stocks. The link is via corporate earnings. Indian PPI tracks the ebbs and flows in global commodity prices, and therefore global growth. Strong global growth boosts all corporate earnings, including that of India. Accelerating PPI is therefore a harbinger of higher Indian earnings and stock prices. Going forward, however, a decelerating PPI is pointing to lower stock prices in India (Chart 13). Is RBI Making A Policy Mistake? India’s central bank seems to be committing a policy mistake by raising interest rates to suppress commodity price-driven inflation when domestic demand is already very weak. This is negative for the economy and share prices. Chart 14Household Consumption Is Quite Weak; Domestic Production Is Far Below Trend
Household Consumption Is Quite Weak; Domestic Production Is Far Below Trend
Household Consumption Is Quite Weak; Domestic Production Is Far Below Trend
The Reserve Bank of India surprised the market last week by raising policy rates by 40 basis points to 4.4%. They also raised commercial banks’ cash reserve ratio by 50 basis points to 4.5% in order to tighten banking sector liquidity. Monetary tightening, as a policy tool, works by stifling domestic demand. It makes borrowing for the purpose of investments and consumption more costly. It is, however, rather ineffective in resolving inflation caused by higher food and fuel prices – as is the case in India presently. Notably, high commodity inflation itself forces consumers to spend a lower amount on other core items – leading to weaker demand for the latter. Further monetary tightening would exacerbate that weakness. As explained before, Indian consumer prices are driven mostly by domestic factors, such as money supply and productivity (Chart 3, above), rather than global commodity prices. This distinction is important given that the central bank’s mandate is to manage CPI, not PPI. As such, monetary policy should ideally be based on mostly domestic dynamics. India’s domestic demand is extremely soft compared to the US where inflation has skyrocketed. Given the massive negative output gap that opened up in the Indian economy during the pandemic-related lockdowns, it will take a while before this economy sees genuine, sustained overheating. In view of this softness, any meaningful hike in interest rates (say another 100 basis points) could have a material negative impact on the recovery, and by extension, on stock prices: Household consumption is quite weak − as is evident in local car and 2-wheeler sales (Chart 14, top panel). One reason for that is the subdued wage growth mentioned above. Pandemic-era fiscal stimulus, at less than 2% of GDP, has not been nearly enough to compensate for lost household income during the lockdowns. Consistent with lackluster household demand, manufacturing and other industrial productions are also languishing at far below the pre-pandemic trend (Chart 14, bottom panel). Robust capex is what spearheaded India’s post-pandemic recovery. But, now with decelerating corporate profits, capital investments have begun to slow. Higher costs of borrowing will further discourage capex plans. If so, lower investments will do more than shave off GDP growth in the coming quarters. If continued, this could be a major risk for India’s sustainable growth story, and its ill-effects may linger. Chart 15Higher Interest Rates Are A Headwind For Stock Prices
Higher Interest Rates Are A Headwind For Stock Prices
Higher Interest Rates Are A Headwind For Stock Prices
All in all, given the nature of inflation in India in the current cycle, it will be a mistake to raise policy rates by any meaningful measure. Both consumption and investments will be hurt. Stock prices, which clearly benefit from lower interest rates, will be facing higher rates, and will therefore sell off (Chart 15). As such, it will be difficult for the RBI to continue to tighten monetary policy without causing a significant bear market in Indian stocks. Investment Conclusions Equities: The Indian profit outlook has deteriorated meaningfully as a result of falling margins and an impending growth slowdown. This bourse is also very expensive relative to its EM peers. Higher interest rates will add to the headwinds. Absolute return investors should avoid this market. Asset allocators should stay underweight in EM and Emerging Asian equity portfolios. Currency And Bonds: The Indian rupee could depreciate marginally along with a likely sell-off in Indian stocks. Given that higher interest rates will likely be detrimental to a growth recovery, it will discourage capital inflows, and will therefore be negative for the rupee. As the rupee could be weaker, and bond yields could rise marginally with tighter banking sector liquidity, investors should stay neutral on India in EM and Emerging Asian bond portfolios. Rajeeb Pramanik Senior EM Strategist rajeeb.pramanik@bcaresearch.com Footnotes 1 Also called ‘wholesale prices.’ 2 CPI for Fuel & Light has a 6.8% weight in the CPI basket. Transportation & Communication has 8.6% weight. 3 Edible oil has a weight of 3.6% in India’s CPI basket.