Emerging Markets
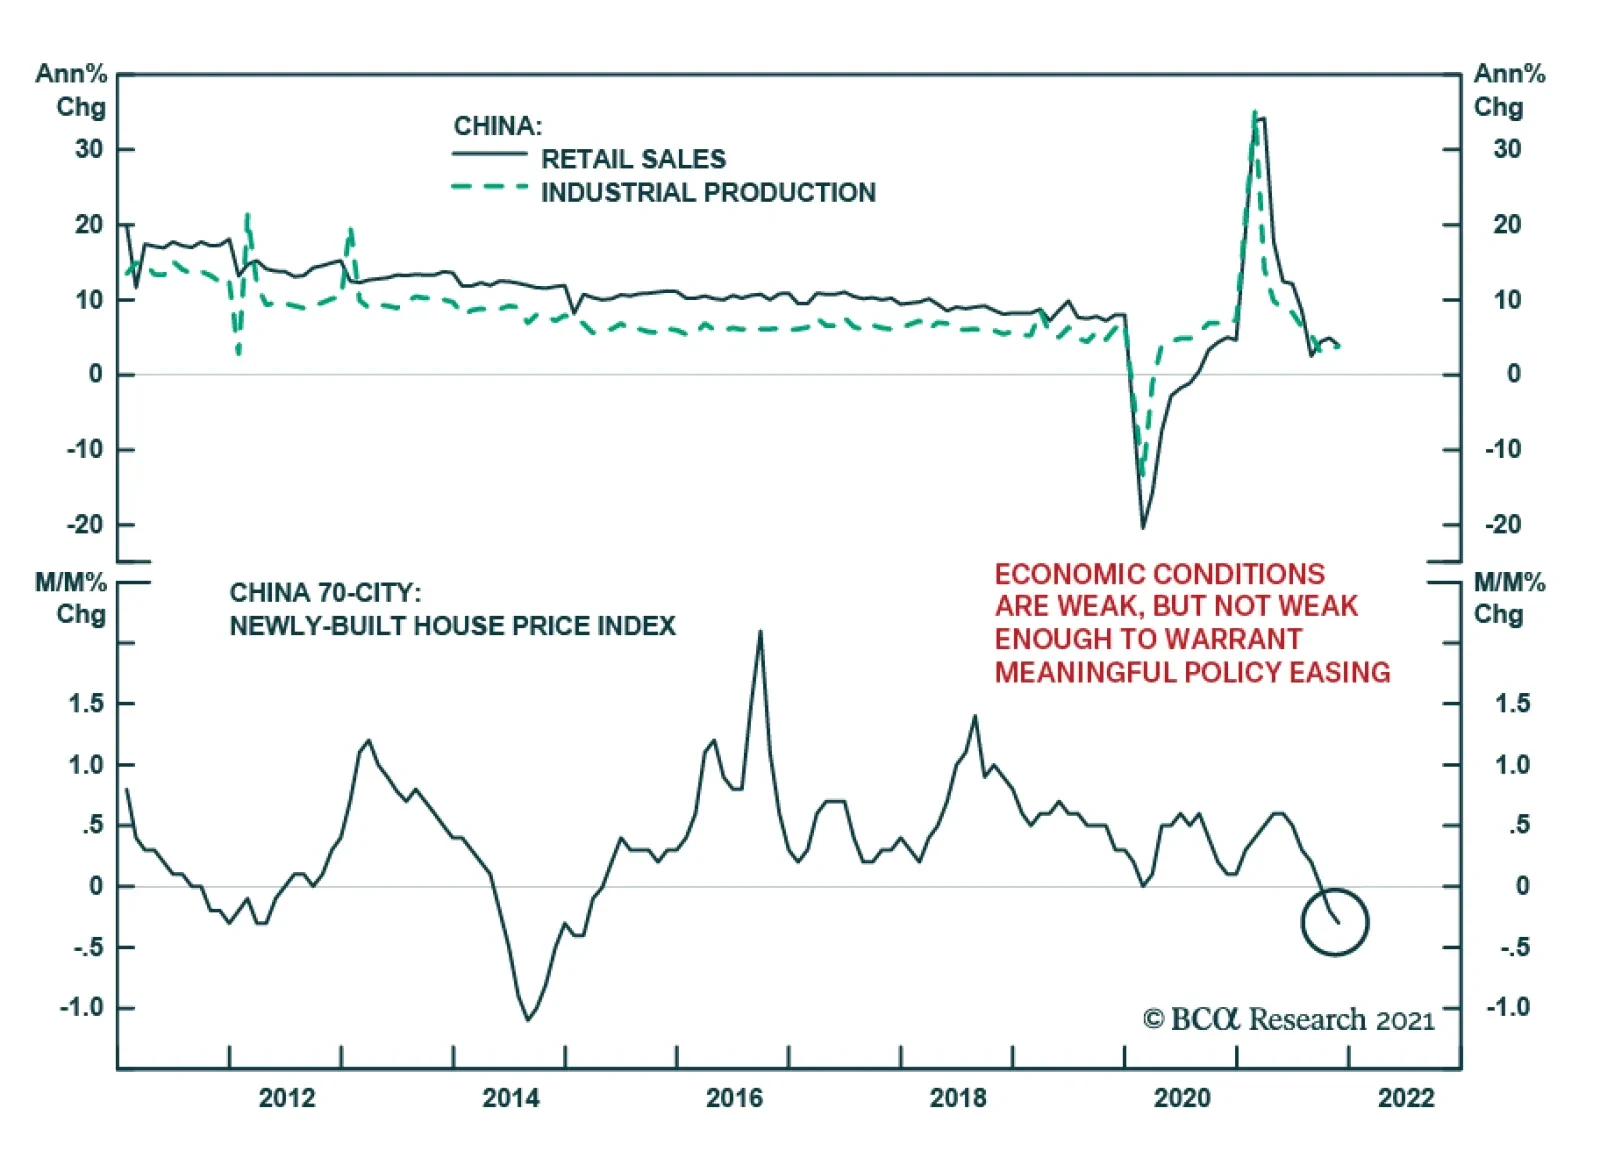
Chinese economic data for November was generally disappointing and indicate that the domestic economy is slowing. Retail sales growth decelerated sharply to 3.9% y/y versus expectations of a mild 0.2 percentage point decline from October’s 4.9%. Both fixed…

Highlights Our three strategic themes over the long run: (1) great power rivalry (2) hypo-globalization (3) populism and nationalism. The implications are inflationary over the long run. Nations that gear up for potential conflict and expand the social safety net to appease popular discontent will consume a lot of resources. Our three key views for 2022: (1) China’s reversion to autocracy (2) America’s policy insularity (3) petro-state leverage. The implications are mostly but not entirely inflationary: China will ease policy, the US will pass more stimulus, and energy supply may suffer major disruptions. Stay long gold, neutral US dollar, short renminbi, and short Taiwanese dollar. Stay tactically long global large caps and defensives. Buy aerospace/defense and cyber-security stocks. Go long Japanese and Mexican equities – both are tied to the US in an era of great power rivalry. Feature Chart 1US Resilience
US Resilience
US Resilience
Global investors have not yet found a substitute for the United States. Despite a bout of exuberance around cyclical non-US assets at the beginning of 2021, the year draws to a close with King Dollar rallying, US equities rising to 61% of global equity capitalization, and the US 30-year Treasury yield unfazed by inflation fears (Chart 1). American outperformance is only partly explained by its handling of the lingering Covid-19 pandemic. The US population was clearly less restricted by the virus (Chart 2). But more to the point, the US stimulated its economy by 25% of GDP over the course of the crisis, while the average across major countries was 13% of GDP. Americans are still more eager to go outdoors and the government has been less stringent in preventing them (Chart 3).
Chart 2
Chart 3Social Restrictions Short Of Lockdown
Social Restrictions Short Of Lockdown
Social Restrictions Short Of Lockdown
Going forward, the pandemic should decline in relevance, though it is still possible that a vaccine-resistant mutation will arise that is deadlier for younger people, causing a new round of the crisis. The rotation into assets outside the US will be cautious. Across the world, monetary and credit growth peaked and rolled over this year, after the extraordinary effusion of stimulus to offset the social lockdowns of 2020 (Chart 4). Government budget deficits started to normalize while central banks began winding down emergency lending and bond-buying. More widespread and significant policy normalization will get under way in 2022 in the face of high core inflation. Tightening will favor the US dollar, especially if global growth disappoints expectations. Chart 4Waning Monetary And Credit Stimulus
Waning Monetary And Credit Stimulus
Waning Monetary And Credit Stimulus
Chart 5Global Growth Stabilization
Global Growth Stabilization
Global Growth Stabilization
Global manufacturing activity fell off its peak, especially in China, where authorities tightened monetary, fiscal, and regulatory policy aggressively to prevent asset bubbles from blowing up (Chart 5). Now China is easing policy on the margin, which should shore up activity ahead of an important Communist Party reshuffle in fall 2022. The rest of the world’s manufacturing activity is expected to continue expanding in 2022, albeit less rapidly. This trend cuts against US outperformance but still faces a range of hurdles, beginning with China. In this context, we outline three geopolitical themes for the long run as well as three key views for the coming 12 months. Our title, “The Gathering Storm,” refers to the strategic challenge that China and Russia pose to the United States, which is attempting to form a balance-of-power coalition to contain these autocratic rivals. This is the central global geopolitical dynamic in 2022 and it is ultimately inflationary. Three Strategic Themes For The Long Run The international system will remain unstable in the coming years. Global multipolarity – or the existence of multiple, competing poles of political power – is the chief destabilizing factor. This is the first of our three strategic themes that will persist next year and beyond (Table 1). Our key views for 2022, discussed below, flow from these three strategic themes. Table 1Strategic Themes For 2022 And Beyond
2022 Key Views: The Gathering Storm
2022 Key Views: The Gathering Storm
1. Great Power Rivalry Multipolarity – or great power rivalry – can be illustrated by the falling share of US economic clout relative to the rest of the world, including but not limited to strategic rivals like China. The US’s decline is often exaggerated but the picture is clear if one looks at the combined geopolitical influence of the US and its closest allies to that of the EU, China, and Russia (Chart 6).
Chart 6
China’s rise is the most destabilizing factor because it comes with economic, military, and technological prowess that could someday rival the US for global supremacy. China’s GDP has surpassed that of the US in purchasing power terms and will do so in nominal terms in around five years (Chart 7).
Chart 7
True, China’s potential growth is slowing and Chinese financial instability will be a recurring theme. But that very fact is driving Beijing to try to convert the past 40 years of economic success into broader strategic security. Chart 8America's Global Role Persists (If Lessened)
America's Global Role Persists (If Lessened)
America's Global Role Persists (If Lessened)
Since China is capable of creating an alternative political order in Asia Pacific, and ultimately globally, the United States is reacting. It is penalizing China’s economy and seeking to refurbish alliances in pursuit of a containment policy. The American reaction to the loss of influence has been unpredictable, contradictory, and occasionally belligerent. New isolationist impulses have emerged among an angry populace in reaction to gratuitous wars abroad and de-industrialization. These impulses appeared in both the Obama and Trump administrations. The Biden administration is attempting to manage these impulses while also reinforcing America’s global role. The pandemic-era stimulus has enabled the US to maintain its massive trade deficit and aggressive defense spending. But US defense spending is declining relative to the US and global economy over time, encouraging rival nations to carve out spheres of influence in their own neighborhoods (Chart 8). Russia’s overall geopolitical power has declined but it punches above its weight in military affairs and energy markets, a fact which is vividly on display in Ukraine as we go to press. The result is to exacerbate differences in the trans-Atlantic alliance between the US and the European Union, particularly Germany. The EU’s attempt to act as an independent great power is another sign of multipolarity, as well as the UK’s decision to distance itself from the continent and strengthen the Anglo-American alliance. If the US and EU do not manage their differences over how to handle Russia, China, and Iran then the trans-Atlantic relationship will weaken and great power rivalry will become even more dangerous. 2. Hypo-Globalization The second strategic theme is hypo-globalization, in which the ancient process of globalization continues but falls short of its twenty-first century potential, given advances in technology and governance that should erode geographic and national boundaries. Hypo-globalization is the opposite of the “hyper-globalization” of the 1990s-2000s, when historic barriers to the free movement of people, goods, and capital seemed to collapse overnight. Chart 9From 'Hyper-Globalization' To Hypo-Globalization
From 'Hyper-Globalization' To Hypo-Globalization
From 'Hyper-Globalization' To Hypo-Globalization
The volume of global trade relative to industrial production peaked with the Great Recession in 2008-10 and has declined slowly but surely ever since (Chart 9). Many developed markets suffered the unwinding of private debt bubbles, while emerging economies suffered the unwinding of trade manufacturing. Periods of declining trade intensity – trade relative to global growth – suggest that nations are turning inward, distrustful of interdependency, and that the frictions and costs of trade are rising due to protectionism and mercantilism. Over the past two hundred years globalization intensified when a broad international peace was agreed (such as in 1815) and a leading imperial nation was capable of enforcing law and order on the seas (such as the British empire). Globalization fell back during times of “hegemonic instability,” when the peace settlement decayed while strategic and naval competition eroded the global trading system. Today a similar process is unfolding, with the 1945 peace decaying and the US facing the revival of Russia and China as regional empires capable of denying others access to their coastlines and strategic approaches (Chart 10).1 Chart 10Hypo-Globalization And Hegemonic Instability
Hypo-Globalization And Hegemonic Instability
Hypo-Globalization And Hegemonic Instability
Chart 11Hypo-Globalization: Temporary Trade Rebound
Hypo-Globalization: Temporary Trade Rebound
Hypo-Globalization: Temporary Trade Rebound
No doubt global trade is rebounding amid the stimulus-fueled recovery from Covid-19. But the upside for globalization will be limited by the negative geopolitical environment (Chart 11). Today governments are not behaving as if they will embark on a new era of ever-freer movement and ever-deepening international linkages. They are increasingly fearful of each other’s strategic intentions and using fiscal resources to increase economic self-sufficiency. The result is regionalization rather than globalization. Chinese and Russian attempts to revise the world order, and the US’s attempt to contain them, encourages regionalization. For example, the trade war between the US and China is morphing into a broader competition that limits cooperation to a few select areas, despite a change of administration in the United States. The further consolidation of President Xi Jinping’s strongman rule will exacerbate this dynamic of distrust and economic divorce. Emerging Asia and emerging Europe live on the fault lines of this shift from globalization to regionalism, with various risks and opportunities. Generally we are bullish EM Asia and bearish EM Europe. 3. Populism And Nationalism A third strategic theme consists of populism and nationalism, or anti-establishment political sentiment in general. These forces will flare up in various forms across the world in 2022 and beyond. Even as unemployment declines, the rise in food and fuel inflation will make it difficult for low wage earners to make ends meet. The “misery index,” which combines unemployment and inflation, spiked during the pandemic and today stands at 10.8% in the US and 11.4% in the EMU, up from 5.2% and 8.1% before the pandemic, respectively (Chart 12). Large budget deficits and trade deficits, especially in the US and UK, feed into this inflationary environment. Most of the major developed markets have elected new governments since the pandemic, with the notable exception of France and Spain. Thus they have recapitalized their political systems and allowed voters to vent some frustration. These governments now have some time to try to mitigate inflation before the next election. Hence policy continuity is not immediately in jeopardy, which reduces uncertainty for investors. By contrast, many of the emerging economies face higher inflation, weak growth, and are either coming upon elections or have undemocratic political systems. Either way the result will be a failure to address household grievances promptly. The misery index is trending upward and governments are continually forced to provide larger budget deficits to shore up growth, fanning inflation (Chart 13). Chart 12DM: Political Risk High But New Governments In Place
DM: Political Risk High But New Governments In Place
DM: Political Risk High But New Governments In Place
Chart 13EM: Political Risk High But Governments Not Recapitalized
EM: Political Risk High But Governments Not Recapitalized
EM: Political Risk High But Governments Not Recapitalized
Chart 14EM Populism/Nationalism Threatens Negative Surprises In 2022
EM Populism/Nationalism Threatens Negative Surprises In 2022
EM Populism/Nationalism Threatens Negative Surprises In 2022
Just as social and political unrest erupted after the Great Recession, notably in the so-called “Arab Spring,” so will new movements destabilize various emerging markets in the wake of Covid-19. Regime instability and failure can lead to big changes in policies, large waves of emigration, wars, and other risks that impact markets. The risks are especially high unless and until Chinese imports revive. Investors should be on the lookout for buying opportunities in emerging markets once the bad news is fully priced. National and local elections in Brazil, India, South Korea, the Philippines, and Turkey will serve as market catalysts, with bad news likely to precede good news (Chart 14). Bottom Line: These three themes – great power rivalry, hypo-globalization, and populism/nationalism – are inflationary in theory, though their impact will vary based on specific events. Multipolarity means that governments will boost industrial and defense spending to gear up for international competition. Hypo-globalization means countries will attempt to put growth on a more reliable domestic foundation rather than accept dependency on an unreliable international scene, thus constraining supplies from abroad. Populism and nationalism will lead to a range of unorthodox policies, such as belligerence abroad or extravagant social spending at home. Of course, the inflationary bias of these themes can be upset if they manifest in ways that harm growth and/or inflation expectations, which is possible. But the general drift will be an inflationary policy setting. Inflation may subside in 2022 only to reemerge as a risk later. Three Key Views For 2022 Within this broader context, our three key views for 2022 are as follows: 1. China’s Reversion To Autocracy As President Xi Jinping leads China further down the road of strongman rule and centralization, the country faces a historic confluence of internal and external risks. This was our top view in 2021 and the same dynamic continues in 2022. The difference is that in 2021 the risk was excessive policy tightening whereas this coming year the risk is insufficient policy easing. Chart 15China Eases Fiscal Policy To Secure Recovery In 2022
China Eases Fiscal Policy To Secure Recovery In 2022
China Eases Fiscal Policy To Secure Recovery In 2022
China’s economy is witnessing a secular slowdown, a deterioration in governance, property market turmoil, and a rise in protectionism abroad. The long decline in corporate debt growth points to the structural slowdown. Animal spirits will not improve in 2022 so government spending will be necessary to try to shore up overall growth. The Politburo signaled that it will ease fiscal policy at the Central Economic Work Conference in early December, a vindication of our 2021 view. Neither the combined fiscal-and-credit impulse nor overall activity, indicated by the Li Keqiang Index, have shown the slightest uptick yet (Chart 15). Typically it takes six-to-nine months for policy easing to translate to an improvement in real economic activity. The first half of the year may still bring economic disappointments. But policymakers are adjusting to avoid a crash. Policy will grow increasingly accommodative as necessary in the first half of 2022. The key political constraint is the Communist Party’s all-important political reshuffle, the twentieth national party congress, to be held in fall 2022 (usually October). While Xi may not want the economy to surge in 2022, he cannot afford to let it go bust. The experience of previous party congresses shows that there is often a policy-driven increase in bank loans and fixed investment. Current conditions are so negative as to ensure that the government will provide at least some support, for instance by taking a “moderately proactive approach” to infrastructure investment (Chart 16). Otherwise a collapse of confidence would weaken Xi’s faction and give the opposition faction a chance to shore up its position within the Communist Party. Chart 16China Aims For Stability, Not Rapid Growth, Ahead Of 20th National Party Congress
China Aims For Stability, Not Rapid Growth, Ahead Of 20th National Party Congress
China Aims For Stability, Not Rapid Growth, Ahead Of 20th National Party Congress
Party congresses happen every five years but the ten-year congresses, such as in 2022, are the most important for the country’s overall political leadership. The party congresses in 1992, 2002, and 2012 were instrumental in transferring power from one leader to the next, even though the transfer of power was never formalized. Back in 2017 Xi arranged to stay in power indefinitely but now he needs to clinch the deal, lest any unforeseen threat emerge from at home or abroad. Xi’s success in converting the Communist Party from “consensus rule” to his own “personal rule” will be measurable by his success in stacking the Politburo and Politburo Standing Committee with factional allies. He will also promote his faction across the Central Committee so as to shape the next generations of party leaders and leave his imprint on policy long after his departure. The government will be extremely sensitive to any hint of dissent or resistance and will move aggressively to quash it. Investors should not be surprised to see high-level sackings of public officials or private magnates and a steady stream of scandals and revelations that gain prominence in western media. The environment is also ripe for strange and unexpected incidents that reveal political differences beneath the veneer of unity in China: defections, protests, riots, terrorist acts, or foreign interference. Most incidents will be snuffed out quickly but investors should be wary of “black swans” from China in 2022. Chinese government policies will not be business friendly in 2022 aside from piecemeal fiscal easing. Everything Beijing does will be bent around securing Xi’s supremacy at all levels. Domestic politics will take precedence over economic concerns, especially over the interests of private businesses and foreign investors, as is clear when it comes to managing financial distress in the property sector. Negative regulatory surprises and arbitrary crackdowns on various industrial sectors will continue, though Beijing will do everything in its power to prevent the property bust from triggering contagion across the economic system. This will probably work, though the dam may burst after the party congress. Relations with the US and the West will remain poor, as the democracies cannot afford to endorse what they see as Xi’s power grab, the resurrection of a Maoist cult of personality, and the betrayal of past promises of cooperation and engagement. America’s midterm election politics will not be conducive to any broad thaw in US-China relations. While China will focus on domestic politics, its foreign policy actions will still prove relatively hawkish. Clashes with neighbors may be instigated by China to warn away any interference or by neighbors to try to embarrass Xi Jinping. The South and East China Seas are still ripe for territorial disputes to flare. Border conflicts with India are also possible. Taiwan remains the epicenter of global geopolitical risk. A fourth Taiwan Strait Crisis looms as China increases its military warnings to Taiwan not to attempt anything resembling independence (Chart 17A). China may use saber-rattling, economic sanctions, cyber war, disinformation, and other “gray zone” tactics to undermine the ruling party ahead of Taiwan’s midterm elections in November 2022 and presidential elections in January 2024. A full-scale invasion cannot be ruled out but is unlikely in the short run, as China still has non-military options to try to arrange a change of policy in Taiwan.
Chart 17
Chart 17BMarket-Based Risk Indicators Say China/Taiwan Risk Has Not Peaked
Market-Based Risk Indicators Say China/Taiwan Risk Has Not Peaked
Market-Based Risk Indicators Say China/Taiwan Risk Has Not Peaked
China has not yet responded to the US’s deployment of a small number of troops in Taiwan or to recent diplomatic overtures or arms sales. It could stage a major show of force against Taiwan to help consolidate power at home. China also has an interest in demonstrating to US allies and partners that their populations and economies will suffer if they side with Washington in any contingency. Given China’s historic confluence of risks, it is too soon for global investors to load up on cheap Chinese equities. Volatility will remain high. Weak animal spirits, limited policy easing, high levels of policy uncertainty, regulatory risk, ongoing trade tensions, and geopolitical risks suggest that investors should remain on the sidelines, and that a large risk premium can persist throughout 2022. Our market-based geopolitical risk indicators for both China and Taiwan are still trending upwards (Chart 17B). Global investors should capitalize on China’s policy easing indirectly by investing in commodities, cyclical equity sectors, and select emerging markets. 2. America’s Policy Insularity Our second view for 2022 centers on the United States, which will focus on domestic politics and will thus react or overreact to the many global challenges it faces. The US faces the first midterm election after the chaotic and contested 2020 presidential election. Political polarization remains at historically high levels, meaning that social unrest could flare up again and major domestic terrorist incidents cannot be ruled out. So far the Biden administration has focused on the domestic scene: mitigating the pandemic and rebooting the economy. Biden’s signature “Build Back Better” bill, $1.75 trillion investment in social programs, has passed the House of Representatives but not the Senate. The spike in inflation has shaken moderate Democratic senators who are now delaying the bill. We expect it to pass, since tax hikes were dropped, but our conviction is low (65% subjective odds), as a single defection would derail the bill. The implication would be inflationary since it would mark a sizable increase in government spending at a time when the output gap is already virtually closed. Spending would likely be much larger than the Congressional Budget Office estimate, shown in Chart 18, because the bill contains various gimmicks and hard-to-implement expiration clauses. Equity markets may not sell if the bill fails, since more fiscal stimulus would put pressure on the Federal Reserve to hike rates faster.
Chart 18
Chart 19
Whether the bill passes or fails, Biden’s legislative agenda will be frozen thereafter. He will have to resort to executive powers and foreign policy to lift his approval rating and court the median voter ahead of the midterm elections. Currently Democrats are lined up to lose the House and probably also the Senate, where a single seat would cost them their majority (Chart 19). The Senate is still in play so Biden will be averse to taking big risks. For the same reason, Biden’s foreign policy goal will be to stave off various bubbling crises. Restoring the Iranian nuclear deal was his priority but Russia has now forced its way to the top of the agenda by threatening a partial reinvasion of Ukraine. In this context Biden will not have room for maneuver with China. Congress will be hawkish on China ahead of the midterms, and Xi Jinping will be reviving autocracy, so Biden will not be able to improve relations much. Biden’s domestic policy could fuel inflation, while his domestic-focused foreign policy will embolden strategic rivals, which increases geopolitical risks. 3. Petro-State Leverage A surge in gasoline prices at the pump ahead of the election would be disastrous for a Democratic Party that is already in disarray over inflation (Chart 20). Biden has already demonstrated that he can coordinate an international release of strategic oil reserves this year. Oil and natural gas producers gain leverage when the global economy rebounds, commodity prices rise, and supply/demand balances tighten. The frequency of global conflicts, especially those involving petro-states, tend to rise and fall in line with oil prices (Chart 21). Chart 20Inflation Constrains Biden Ahead Of Midterms
Inflation Constrains Biden Ahead Of Midterms
Inflation Constrains Biden Ahead Of Midterms
Chart 21
Both Russia and Iran are vulnerable to social unrest at home and foreign strategic pressure abroad. Both have long-running conflicts with the US and West that are heating up for fundamental reasons, such as Russia’s fear of western influence in the former Soviet Union and Iran’s nuclear program. Both countries are demanding that the US make strategic concessions to atone for the Trump administration’s aggressive policies: selling lethal weapons to Ukraine and imposing “maximum pressure” sanctions on Iran. Biden is not capable of making credible long-term agreements since he could lose office as soon as 2025 and the next president could reverse whatever he agrees. But he must try to de-escalate these conflicts or else he faces energy shortages or price shocks, which would raise the odds of stagflation ahead of the election. The path of least resistance for Biden is to lift the sanctions on Iran to prevent an escalation of the secret war in the Middle East. If this unilateral concession should convince Iran to pause its nuclear activities before achieving breakout uranium enrichment capability, then Biden would reduce the odds of a military showdown erupting across the region. Opposition Republicans would accuse him of weakness but public opinion polls show that few Americans consider Iran a major threat. The problem is that this logic held throughout 2021 and yet Biden did not ease the sanctions. Given Iran’s nuclear progress and the US’s reliance on sanctions, we see a 40% chance of a military confrontation with Iran over the coming years. With regard to Ukraine, an American failure to give concessions to Russia will probably result in a partial reinvasion of Ukraine (50% subjective odds). This in turn will force the US and EU to impose sanctions on Russia, leading to a squeeze of natural gas prices in Europe and eventually price pressures in global energy markets. If Biden grants Russia’s main demands, he will avoid a larger war or energy shock but will make the US vulnerable to future blackmail. He will also demoralize Taiwan and other US partners who lack mutual defense treaties. But he may gain Russian cooperation on Iran. If Biden gives concessions to both Russia and Iran, his party will face criticism in the midterms but it will be far less vulnerable than if an energy shock occurs. This is the path of least resistance for Biden in 2022. It means that the petro-states may lose their leverage after using it, given that risk premiums would fall on Biden’s concessions. Of course, if energy shocks happen, Europe and China will suffer more than the US, which is relatively energy independent. For this reason Brussels and Beijing will try to keep diplomacy alive as long as possible. Enforcement of US sanctions on Iran may weaken, reducing Iran’s urgency to come into compliance. Germany may prevent a hardline threat of sanctions against Russia, reducing Russia’s fear of consequences. Again, petro-states have the leverage. Therefore investors should guard against geopolitically induced energy price spikes or shocks in 2022. What if other commodity producers, such as Saudi Arabia, crank up production and sink oil prices? This could happen. Yet the Saudis prefer elevated oil prices due to the host of national challenges they face in reforming their economy. If the US eases sanctions on Iran then the Saudis may make this decision. Thus downside energy price shocks are possible too. The takeaway is energy price volatility but for the most part we see the risk as lying to the upside. Investment Takeaways Traditional geopolitical risk, which focuses on war and conflict, is measurable and has slipped since 2015, although it has not broken down from the general uptrend since 2000. We expect the secular trend to be reaffirmed and for geopolitical risk to resume its rise due to the strategic themes and key views outlined above. The correlation of geopolitical risk with financial assets is debatable – namely because some geopolitical risks push up oil and commodity prices at the expense of the dollar, while others cause a safe-haven rally into the dollar (Chart 22). Global economic policy uncertainty is also measurable. It is in a secular uptrend since the 2008 financial crisis. Here the correlation with the US dollar and relative equity performance is stronger, which makes sense. This trend should also pick up going forward, which is at least not negative for the dollar and relative US equity performance (Chart 23). Chart 22Geopolitical Risk Will Rise, Market Impacts Variable
Geopolitical Risk Will Rise, Market Impacts Variable
Geopolitical Risk Will Rise, Market Impacts Variable
Chart 23Economic Policy Uncertainty Will Rise, Not Bad For US Assets
Economic Policy Uncertainty Will Rise, Not Bad For US Assets
Economic Policy Uncertainty Will Rise, Not Bad For US Assets
We are neutral on the US dollar versus the euro and recommend holding either versus the Chinese renminbi. We are short the currencies of emerging markets that suffer from great power rivalry, namely the Taiwanese dollar versus the US dollar, the Korean won versus the Japanese yen, the Russian ruble versus the Canadian dollar, and the Czech koruna versus the British pound. We remain long gold as a hedge against both geopolitical risk and inflation. We recommend staying long global equities. Tactically we prefer large caps and defensives. Within developed markets, we favor the UK and Japan. Japan in particular will benefit from Chinese policy easing yet remains more secure from China-centered geopolitical risks than emerging Asian economies. Within emerging markets, Mexico stands to benefit from US economic strength and divorce from China. We would buy Indian equities on weakness and sell Chinese and Russian equities on strength. We remain long aerospace and defense stocks and cyber-security stocks. -The GPS Team We Read (And Liked) … Conspiracy U: A Case Study “Crazy, worthless, stupid, made-up tales bring out the demons in susceptible, unthinking people.” Thus the author’s father, a Holocaust survivor translated from Yiddish, on conspiracy theories and the real danger they present in the world. Scott A. Shay, author and chairman of Signature Bank, whose first book was a finalist for the National Jewish Book Award, has written an intriguing new book on the topic and graciously sent it our way.2 Shay is a regular reader of BCA Research’s Geopolitical Strategy and an astute observer of international affairs. He is also a controversialist who has written essays for several of America’s most prominent newspapers. Shay’s latest, Conspiracy U, is a bracing read that we think investors will benefit from. We say this not because of its topical focus, which is too confined, but because of its broader commentary on history, epistemology, the US higher education system – and the very timely and relevant problem of conspiracy theories, which have become a prevalent concern in twenty-first century politics and society. The author and the particular angle of the book will be controversial to some readers but this very quality makes the book well-suited to the problem of the conspiracy theory, since it is not the controversial nature of conspiracy theories but their non-falsifiability that makes them specious. As the title suggests, the book is a polemical broadside. The polemic arises from Shay’s unique set of moral, intellectual, and sociopolitical commitments. This is true of all political books but this one wears its topicality on its sleeve. The term “conspiracy” in the title refers to antisemitic, anti-Israel, and anti-Zionist conspiracy theories, particularly the denial of the Holocaust, coming from tenured academics on both the right and the left wings of American politics. The “U” in the title refers to universities, namely American universities, with a particular focus on the author’s beloved alma mater, Northwestern University in Chicago, Illinois. Clearly the book is a “case study” – one could even say the prosecution of a direct and extended public criticism of Northwestern University – and the polemical perspective is grounded in Shay’s Jewish identity and personal beliefs. Equally clearly Shay makes a series of verifiable observations and arguments about conspiracy theories as a contemporary phenomenon and their presence, as well as the presence of other weak and lazy modes of thought, in “academia writ large.” This generalization of the problem is where most readers will find the value of the book. The book does not expect one to share Shay’s identity, to be a Zionist or support Zionism, or to agree with Israel’s national policies on any issue, least of all Israeli relations with Arabs and Palestinians. Shay’s approach is rigorous and clinical. He is a genuine intellectual in that he considers the gravest matters of concern from various viewpoints, including viewpoints radically different from his own, and relies on close readings of the evidence. In other words, Shay did not write the book merely to convince people that two tenured professors at Northwestern are promoting conspiracy theories. That kind of aberration is sadly to be expected and at least partially the result of the tenure system, which has advantages as well, not within the scope of the book. Rather Shay wrote it to provide a case study for how it is that conspiracy theories can manage to be adopted by those who do not realize what they are and to proliferate even in areas that should be the least hospitable – namely, public universities, which are supposed to be beacons of knowledge, science, openness, and critical thinking, but also other public institutions, including the fourth estate. Shay is meticulous with his sources and terminology. He draws on existing academic literature to set the parameters of his subject, defining conspiracy theories as “improbable hypotheses [or] intentional lies … about powerful and sinister groups conspiring to harm good people, often via a secret cabal.” The definition excludes “unwarranted criticism” and “unfair/prejudiced perspectives,” which are harmful but unavoidable. Many prejudices and false beliefs are “still falsifiable in the minds of their adherents,” which is not the case with conspiracy theories, although deep prejudices can obviously be helpful in spreading such theories. Conspiracy theories often depend on “a stunning amount of uniformity of belief and coordination of action without contingencies.” They also rely excessively on pathos, or emotion, in making their arguments, as opposed to logos (reason) and ethos (credibility, authority). Unfortunately there is no absolute, infallible distinction between conspiracy theories and other improbable theories – say, yet-to-be-confirmed theories about conspiracies that actually occurred. Conspiracy theories differ from other theories “in their relationship to facts, evidence, and logic,” which may sound obvious but is very much to the point. Again, “the key difference is the evidence and how it is evaluated.” There is no ready way to refute the fabrications, myths, and political propaganda that people believe without taking the time to assess the claims and their foundations. This requires an open mind and a grim determination to get to the bottom of rival claims about events even when they are extremely morally or politically sensitive, as is often the case with wars, political conflicts, atrocities, and genocides: Reliable historians, journalists, lawyers, and citizens must first approach the question of the cause or the identity of perpetrators and victims of an event or process with an open mind, not prejudiced to either party, and then evaluate the evidence. The diagnosis may be easy but the treatment is not – it takes time, study, and debate, and one’s interlocutors must be willing to be convinced. This problem of convincing others is critical because it is the part that is so often left out of modern political discourse. Conspiracy theories are often hateful and militant, so there is a powerful urge to censor or repress them. Openly debating with conspiracy theorists runs the risk of legitimizing or appearing to legitimize their views, providing them with a public forum, which seems to grant ethos or authority to arguments that are otherwise conspicuously lacking in it. In some countries censorship is legal, almost everywhere when violence is incited. The problem is that the act of suppression can feed the same conspiracy theories, so there is a need, in the appropriate context, to engage with and refute lies and specious arguments. Clients frequently email us to ask our view of the rise of conspiracy theories and what they entail for the global policy backdrop. We associate them with the broader breakdown in authority and decline of public trust in institutions. Shay’s book is an intervention into this topic that clients will find informative and thought-provoking, even if they disagree with the author’s staunchly pro-Israel viewpoint. It is precisely Shay’s ability to discuss and debate extremely contentious matters in a lucid and empirical manner – antisemitism, the history of Zionism, Holocaust denialism, Arab-Israeli relations, the Rwandan genocide, QAnon, the George Floyd protests, various other controversies – that enables him to defend a controversial position he holds passionately, while also demonstrating that passion alone can produce the most false and malicious arguments. As is often the case, the best parts of the book are the most personal – when Shay tells about his father’s sufferings during the Holocaust, and journey from the German concentration camps to New York City, and about Shay’s own experiences scraping enough money together to go to college at Northwestern. These sequences explain why the author felt moved to stage a public intervention against fringe ideological currents, which he shows to have gained more prominence in the university system than one might think. The book is timely, as American voters are increasingly concerned about the handling of identity, inter-group relations, history, education, and ideology in the classroom, resulting in what looks likely to become a new and ugly episode of the culture and education wars. Let us hope that Shay’s standards of intellectual freedom and moral decency prevail. Matt Gertken, PhD Vice President Geopolitical Strategy mattg@bcaresearch.com Footnotes 1 The downshift in globalization today is even worse than it appears in Chart 10 because several countries have not yet produced the necessary post-pandemic data, artificially reducing the denominator and making the post-pandemic trade rebound appear more prominent than it is in reality. 2 Scott A. Shay, Conspiracy U: A Case Study (New York: Post Hill Press, 2021), 279 pages. Strategic Themes Open Tactical Positions (0-6 Months) Open Cyclical Recommendations (6-18 Months) Appendix: GeoRisk Indicator China
China: GeoRisk Indicator
China: GeoRisk Indicator
Russia
Russia: GeoRisk Indicator
Russia: GeoRisk Indicator
United Kingdom
UK: GeoRisk Indicator
UK: GeoRisk Indicator
Germany
Germany: GeoRisk Indicator
Germany: GeoRisk Indicator
France
France: GeoRisk Indicator
France: GeoRisk Indicator
Italy
Italy: GeoRisk Indicator
Italy: GeoRisk Indicator
Canada
Canada: GeoRisk Indicator
Canada: GeoRisk Indicator
Spain
Spain: GeoRisk Indicator
Spain: GeoRisk Indicator
Taiwan
Taiwan Territory: GeoRisk Indicator
Taiwan Territory: GeoRisk Indicator
Korea
Korea: GeoRisk Indicator
Korea: GeoRisk Indicator
Turkey
Turkey: GeoRisk Indicator
Turkey: GeoRisk Indicator
Brazil
Brazil: GeoRisk Indicator
Brazil: GeoRisk Indicator
Australia
Australia: GeoRisk Indicator
Australia: GeoRisk Indicator
South Africa
South Africa: GeoRisk Indicator
South Africa: GeoRisk Indicator
Section III: Geopolitical Calendar
Dear Clients, This is the final publication for the year, in which we recap some of the key economic developments this month. Our publishing schedule will resume on January 6, 2022. The China Investment Strategy team wishes you a very happy and safe holiday season and a prosperous New Year! Best regards, Jing Sima China Strategist Feature Recently released data show China’s economy is weakening despite easing monetary policy and power-supply constraints. Our credit impulse – measured by the year-on-year change in total social financing as a share of GDP – inched up in November (Chart 1, top panel). Given that the indicator leads economic activity by about six to nine months, we maintain the view that China’s economy will not bottom until Q2 next year. Chinese stocks, driven by business cycle, will remain under downward pressures in the next three to six months (Chart 1, middle and bottom panels). On the policy front, the PBoC announced a 50bps cut in the reserve requirement ratio (RRR) rate taking effect in mid-December. Last week’s Central Economic Work Conference (CEWC) signaled that stabilizing the economy will be the government’s core policy objective for 2022. However, we believe that policymakers will be data dependent and will only allow an overshoot in credit growth when the slowdown in the economy gathers pace in early 2022. Thus, investors should maintain an underweight allocation to Chinese equities relative to global stocks, at least for the next three to six months, until credit growth significantly improves. Chart 1Downside Risks Remain High For Chinese Stocks Until The Econmomy Troughs
Downside Risks Remain High For Chinese Stocks Until The Econmomy Troughs
Downside Risks Remain High For Chinese Stocks Until The Econmomy Troughs
Chart 2Chinese Internet Stocks Are Not Cheap
Chinese Internet Stocks Are Not Cheap
Chinese Internet Stocks Are Not Cheap
Chinese investable stocks, particularly internet companies, will continue to face geopolitical and regulatory headwinds in the next 12 months. Chinese tech stocks sold off this year, but they are not cheap (Chart 2). Economic weakness in the onshore market in the next three to six months may trigger more selloffs and further multiples compressions in Chinese investable stocks. Qingyun Xu, CFA Associate Editor qingyunx@bcaresearch.com Cuts To The RRR And Relending Rates: Not Game Changers Chart 3RRR Cut Is Not A Game Changer
RRR Cut Is Not A Game Changer
RRR Cut Is Not A Game Changer
Following the RRR cut announcement in early December, the PBoC announced a 25bps decrease in the relending rate targeting agriculture and small businesses (Chart 3). The measures sent an easing signal in response to mounting downside risks in the economy. However, their impact on credit growth will likely be limited for the following reasons: First, the PBoC indicated that the RRR cut will release around RMB1.2 trillion in liquidity to the banks. From that amount, RMB950 billion will be used to replace maturing Medium-term Lending Facility (MLF) this month, which leaves only RMB250 billion for new liquidity injection. Chart 4Business Conditions For SMEs Deteriorated Faster Than For Larger Businesses
Business Conditions For SMEs Deteriorated Faster Than For Larger Businesses
Business Conditions For SMEs Deteriorated Faster Than For Larger Businesses
Secondly, the PBoC is trying to prevent a jump in market-based rates in the next two quarters. Demand for liquidity is usually high due to tax season by year-end plus a front-loading of local government bond (LGB) issuance. Moreover, the Chinese New Year in Q1 2022 will further boost demand for liquidity. Thirdly, the targeted relending rate drop is intended to lower the borrowing costs of small-medium enterprises (SMEs) whose profitability has been challenged by rising input costs and sluggish consumer demand (Chart 4). Loan demand from small enterprises, as shown in the PBoC survey, peaked much earlier and tumbled more rapidly than their larger peers (Chart 4, bottom panel). The rate cut has decreased the possibility of a broadly based decline in interest rates in the near-term. China’s Credit Growth May Have Bottomed, But The Rebound Is Moderate Chart 5Below-Expectation Credit Growth In November
Below-Expectation Credit Growth In November
Below-Expectation Credit Growth In November
China’s aggregate credit growth ticked up slightly in November. The modest advance mainly reflects an acceleration in LGB issuance. Chart 5 highlights that excluding LGB financing, China’s credit impulse remains on a downward trend. LGBs will be frontloaded in Q1 2022 before the March National People’s Congress sets the full-year quota for LGBs. However, without a meaningful rebound in bank loan growth, the effects of LGB issuance on infrastructure investment will be limited and short-lived, as occurred in Q1 2019 (Chart 6). Shadow banking, which historically has had a tight correlation with infrastructure investment, continued to slide in November to an all-time low. Infrastructure project approval also does not show any signs of strengthening (Chart 7). Chart 6Improvement In Infrastructure Investment Will Be Limited Without An Acceleration In Loan Growth
Improvement In Infrastructure Investment Will Be Limited Without An Acceleration In Loan Growth
Improvement In Infrastructure Investment Will Be Limited Without An Acceleration In Loan Growth
Chart 7Key Indicators Show Weak Signs Of Revival In Infrastructure Spending
Key Indicators Show Weak Signs Of Revival In Infrastructure Spending
Key Indicators Show Weak Signs Of Revival In Infrastructure Spending
Weak demand for bank loans from corporations dragged down credit growth in November as evidenced by softening growth in medium- and long-term corporate loans (Chart 8). Both corporate financing needs and investment willingness continued to wane, implying that corporate demand for bank lending may not turn around soon despite recent monetary easing (Chart 8, bottom panel). In addition, marginal easing measures in the property market have not worked their way into the sector. Bank loans to real estate developers plummeted to all-time lows last month, while trust loans contracted significantly in November, which indicates that financing conditions for real estate developers have not improved (Chart 9). Chart 8Loan Demand Remains Weak And Unlikely To Turn Around Imminently
Loan Demand Remains Weak And Unlikely To Turn Around Imminently
Loan Demand Remains Weak And Unlikely To Turn Around Imminently
Chart 9Deepening Contraction In Trust Loans Indicates Deteriorating Financing Conditions For Real Estate Developers
Deepening Contraction In Trust Loans Indicates Deteriorating Financing Conditions For Real Estate Developers
Deepening Contraction In Trust Loans Indicates Deteriorating Financing Conditions For Real Estate Developers
Easing Of Property Restrictions Will Marginally Benefit The Housing Market Last week’s Politburo meeting and the CEWC both proposed to promote affordable rental housing and support reasonable housing demand. Loan growth to government-subsidized social welfare housing has been decelerating since 2018 and started to contract this year (Chart 10). It will likely strengthen next year amid policy support, but from a very low level and at a modest rate. In addition, although social welfare housing loans account for around 40% of bank loans to real estate developers, they are only about 6% of developers’ total source of funding as of 2020. We expect more policy finetuning in the coming months, which may help slow the pace of deterioration in real estate developers’ financing conditions. Real estate developers’ financing from banks may bottom on the back of government’s intervention, but the improvement in total funds to developers will be gradual without mortgage rate cuts and a pickup in home sales (Chart 11). Meanwhile, the downward trend in housing completion will be sustained in the coming months (Chart 11, top panel). Chart 10Bank Loans To Social Welfare Housing Will Likely Improve Modestly Amid Policy Support
Bank Loans To Social Welfare Housing Will Likely Improve Modestly Amid Policy Support
Bank Loans To Social Welfare Housing Will Likely Improve Modestly Amid Policy Support
Chart 11Less Funding = Reduced Completions And Investments
Less Funding = Reduced Completions And Investments
Less Funding = Reduced Completions And Investments
Housing prices in most Tier-one and Tier-two cities continued to move down through November. Data for high-frequency floor space sold show that housing demand continued to abate last month despite a modest uptick in household mortgage loans (Chart 12). Home sales will remain depressed as buyers expect more discounts in housing prices and real estate tax reforms loom. Falling prices and constraints in developers’ financing will continue to weigh on housing starts, given the strong positive correlation between property starts and housing prices (Chart 13). Chart 12Demand For Housing In November Showed Little Signs Of Revival
Demand For Housing In November Showed Little Signs Of Revival
Demand For Housing In November Showed Little Signs Of Revival
Chart 13Housing Starts Are Highly Correlated With Prices
Housing Starts Are Highly Correlated With Prices
Housing Starts Are Highly Correlated With Prices
The Rebound In November’s PMI Does Not Signal A Bottom In China’s Economy Chart 14China's PMI Rebounds Amid Supply-Side Improvement
China's PMI Rebounds Amid Supply-Side Improvement
China's PMI Rebounds Amid Supply-Side Improvement
The NBS manufacturing PMI returned to above the 50-expansionary threshold in November, but the rise reflects a near-term supply-side improvement related to the power shortage rather than a demand-driven recovery (Chart 14). China’s overall business conditions and domestic demand are still worsening, indicating that the rebound in the manufacturing PMI may be short-lived. The production subindex jumped by three and half percentage points in November from October, reflecting re-started operation of heavy-industry enterprises that were halted amid electricity shortages in September and October. Robust global demand for China’s manufactured goods supported a strong reading in November’s new export orders subindex. However, domestic demand remains lackluster. A proxy for the new domestic orders derived from the PMI reached its lowest level since February 2020 (Chart 14, bottom panel). In addition, service PMI weakened last month. A sharp resurgence in domestic COVID cases curbed service sector activity last month. Given uncertainties surrounding the Omicron variant and China’s zero-tolerance policy towards COVID, the service sector’s recovery will likely remain below-trend into 1H 2022 (Chart 15 and 16). Chart 15Lingering COVID Effects Will Continue To Impede Service Sector Activity In 1H22
Lingering COVID Effects Will Continue To Impede Service Sector Activity In 1H22
Lingering COVID Effects Will Continue To Impede Service Sector Activity In 1H22
Chart 16Service Sector Recovery In China Has Lagged
Service Sector Recovery In China Has Lagged
Service Sector Recovery In China Has Lagged
Inflation Passthroughs Ongoing Producer price index (PPI) inflation may have peaked. Meanwhile, the consumer price index (CPI) shows another upturn in November. Despite the peak in PPI inflation, it will likely remain above trend through at least 1H22, supported by elevated commodity and energy prices (Chart 17). Chart 17PPI May Have Peaked, But Will Remain Elevated In The Near Term
PPI May Have Peaked, But Will Remain Elevated In The Near Term
PPI May Have Peaked, But Will Remain Elevated In The Near Term
Chart 18Ongoing Inflation Passthroughs
Ongoing Inflation Passthroughs
Ongoing Inflation Passthroughs
A synchronized rise between PPI consumer goods and non-food CPI, and a narrower gap between PPI and CPI inflation, suggest an ongoing inflation passthrough from producers to consumers (Chart 18). Price increases in some key sectors of manufactured consumer goods sped up in November (Chart 19). However, we do not think China’s consumer price inflation will prevent policymakers from further policy easing. Consumer goods prices are lightly weighted in China’s CPI. An acceleration in inflation passthroughs in this component is unlikely to significantly push up the CPI aggregates. Headline CPI may gather steam next year if food prices rise while energy prices remain at current levels. Nonetheless, in recent years China’s monetary policymaking has been more tightly correlated with the PPI and core CPI, and not headline CPI (Chart 20). Chart 19Manufactured Consumer Goods Prices On The Rise
Manufactured Consumer Goods Prices On The Rise
Manufactured Consumer Goods Prices On The Rise
Chart 20Monetary Policy Is Tightly Correlated With Core CPI And Not Headline CPI
Monetary Policy Is Tightly Correlated With Core CPI And Not Headline CPI
Monetary Policy Is Tightly Correlated With Core CPI And Not Headline CPI
Surging Prices Underpin China’s Exports, While The Rebound In Imports Is Unsustainable Chart 21Surging Export Prices Underpinned Strong Growth In The Value Of China's Exports
Surging Export Prices Underpinned Strong Growth In The Value Of China's Exports
Surging Export Prices Underpinned Strong Growth In The Value Of China's Exports
Chinese exports in volume tumbled in November, however, surging export prices underpinned the strong growth in the value of exports (Chart 21). Demand from the US drove Chinese exports this year and the moderation in volume growth was more than offset by escalating prices (Chart 22). China’s export prices have caught up with the global average (Chart 23). Chart 22Strong Demand From US Has Driven Up China's Exports
Strong Demand From US Has Driven Up China's Exports
Strong Demand From US Has Driven Up China's Exports
Chart 23Chinese Export Prices Have Caught Up With The Global Average
Chinese Export Prices Have Caught Up With The Global Average
Chinese Export Prices Have Caught Up With The Global Average
We expect China’s export growth to slow in the new year on the back of softer global growth and a rotation in US household consumption from goods to services (Chart 24). However, while slowing, global economic growth is projected to remain above trend. The low level of industrial inventories will also provide support to the demand for goods, which will help to sustain strong growth in Chinese exports (Chart 25). China’s imports surprised to the upside in November, boosted by imports of commodities such as coal and crude oil. November’s acceleration in imports reflects a higher demand for primary commodities from Chinese producers, who recovered some production capacity from the power shortages in the previous few months. Chart 24US Household Spending Will Shift From Goods To Services
US Household Spending Will Shift From Goods To Services
US Household Spending Will Shift From Goods To Services
Chart 25Inventory Restocking In The US Will Support Chinese Exports Next Year
Inventory Restocking In The US Will Support Chinese Exports Next Year
Inventory Restocking In The US Will Support Chinese Exports Next Year
Furthermore, the increase in import prices in November outpaced the very modest uptick in the volume of imports, indicating that domestic demand remains sluggish (Chart 26). Credit growth, which normally leads import growth by about six months, only climbed moderately in November and will provide limited support to imports in the coming months (Chart 27). Chart 26Rising Import Prices Masked Weakness In China's Domestic Demand
Rising Import Prices Masked Weakness In China's Domestic Demand
Rising Import Prices Masked Weakness In China's Domestic Demand
Chart 27Modest Rebound In Credit Impulse Will Provide Little Support To Chinese Imports
Modest Rebound In Credit Impulse Will Provide Little Support To Chinese Imports
Modest Rebound In Credit Impulse Will Provide Little Support To Chinese Imports
Chart 28Chinese Demand For Industrial Metals Remains In Deep Contraction
Chinese Demand For Industrial Metals Remains In Deep Contraction
Chinese Demand For Industrial Metals Remains In Deep Contraction
China’s imports of industrial metals, such as copper and steel, improved a little in November, but their year-on-year growth remains in deep contraction (Chart 28). Weakening construction activity amid a continued downtrend in China’s property market will likely reduce the demand for industrial metals. Therefore, the rebound in November’s import growth may be short-lived. The RMB Faces Headwinds In 2022 Regardless Of A Rise In FX Deposit RRR The RMB has climbed about 2% against the dollar since late July despite broad-based dollar strength. In trade-weighted terms, the RMB is at its strongest level since late 2015 (Chart 29). A rapidly appreciating RMB does not bode well for China’s industrial sector profits, and thus not at the PBoC’s best interests (Chart 30). Under this backdrop, last week the PBoC announced that it will raise the banks’ foreign exchange (FX) deposit reserve requirement ratio (RRR) to 9% from 7%, effective December 15. This is the second increase this year aimed at easing the RMB’s pace of appreciation. The RMB fell slightly against the US dollar following the announcement last week. Chart 29The RMB Has Strengthened Despite A Strong USD
The RMB Has Strengthened Despite A Strong USD
The RMB Has Strengthened Despite A Strong USD
Chart 30Strengthening RMB Does Not Bode Well For Corporate Profit Growth
Strengthening RMB Does Not Bode Well For Corporate Profit Growth
Strengthening RMB Does Not Bode Well For Corporate Profit Growth
The RMB appreciation against dollar this year was mainly enhanced by China’s record current account surplus and favorable interest rate differentials between China and the US (Chart 31 and 32). Although the increase in the deposit RRR rate will force banks to hold more foreign currencies and lift the cost of RMB speculation, the RRR hike itself has little impact on altering the existing path in RMB exchange rate. Moreover, the balance of FX deposits stands at US$1 trillion as of November this year. The 200bps increase in the FX deposit reserve ratio will only freeze about US$20 billion in FX liquidity, which is negligible compared with the US$580 billion in China’s trade surplus so far this year. Chart 31Current Account Surplus Will Likely Shrink Next Year
Current Account Surplus Will Likely Shrink Next Year
Current Account Surplus Will Likely Shrink Next Year
Chart 32Interest Rate Differentials Will Narrow Further
Interest Rate Differentials Will Narrow Further
Interest Rate Differentials Will Narrow Further
However, looking forward the conditions favored RMB this year are at risk of reversing in 2022. China’s weaker economic fundamentals and a slower pace in trade surplus next year, as well as narrowed interest rate differentials between the US and China due to falling long-duration bond yields in China, will provide headwinds to RMB. Therefore, investors should closely follow these key factors and to be cautious to bet on continued RMB appreciation. Table 1China Macro Data Summary
More Slowdown To Come Before More Easing
More Slowdown To Come Before More Easing
Table 2China Financial Market Performance Summary
More Slowdown To Come Before More Easing
More Slowdown To Come Before More Easing
Footnotes Market/Sector Recommendations Cyclical Investment Stance
Highlights Below-Benchmark Portfolio Duration: Bond investors should keep portfolio duration low in 2022. While the market’s pricing of the expected Fed liftoff date and initial pace of rate hikes is reasonable, terminal fed funds rate expectations are far too low. Own Treasury Curve Steepeners: The 2/10 Treasury slope will flatten by less than what is currently discounted in the forward curve in 2022. Investors should position for this by going long the 2-year note versus a duration-matched barbell consisting of cash and the 10-year note. Sell Short-Maturity TIPS: Investors should maintain a neutral allocation to long-maturity TIPS versus nominal Treasuries and an underweight allocation to short-maturity TIPS versus nominal Treasuries. We also recommend an outright short position in 2-year TIPS, as short-maturity real yields have a lot of upside in 2022. Overweight Corporate Bonds Versus Treasuries … For Now: We are overweight corporate bonds versus duration-matched Treasuries, for now, but expect to turn more defensive in the first half of 2022 once the yield curve sustainably moves into a flatter regime. Relative valuations suggest that investors should favor high-yield corporates over investment grade. Overweight Emerging Market Bonds Versus US Corporates: EM bonds offer an attractive spread advantage versus US corporates, and a weakening US dollar will help boost returns in 2022. A Maximum Overweight Allocation To Municipal Bonds: Municipal bonds offer exceptional value, especially at the long-end of the curve, and state & local government balance sheets are in excellent shape. Underweight Agency MBS: Agency Mortgage-Backed Securities don’t adequately compensate investors for the likely pace of refi activity in 2021. An up-in-coupon stance is also advisable to take advantage of rising bond yields. Feature BCA published its 2022 Outlook on December 1st. That report lays out the main macroeconomic themes that our strategists see driving markets next year. This Special Report explains how investors can profit from those themes in US fixed income markets. Specifically, we offer seven key US fixed income views for 2022. This report is limited to the seven key investment views, and only discusses Fed policy in the context of how it influences those views. Next week we will publish a more comprehensive “Fed In 2022” report that will delve into our outlook for the Fed next year. Outlook Summary First, a summary of the main economic views presented in BCA’s 2022 Outlook.1 On Economic Growth: The COVID-19 pandemic will recede in importance in 2022 allowing US economic growth to remain above trend. Sizeable household savings and wealth will support consumer spending, the composition of which will shift away from goods and towards services. Corporate capital expenditures also look set to surge. On Inflation: A transition in consumer spending from goods to services and an increase in labor supply will cause US inflation to fall in 2022, though it will remain above the Fed’s target. On Fed Policy: The first Fed rate hike will occur between June and December 2022, depending on the paths of inflation and inflation expectations during the next few months. Fed tightening will continue into 2023. On China and Emerging Markets: Further policy easing in H1 2022 will lead to a reacceleration in Chinese economic activity in the back half of the year. The BCA house view is negative on EM equities for now but will turn more bullish when clearer signs of Chinese policy easing emerge. Risks To The Outlook: The greatest risk to the outlook is that the spread of the Omicron variant leads to the re-imposition of public health measures that will weigh on economic activity. The effect of the Omicron variant remains uncertain, but increasingly widespread vaccination and the advent of anti-viral treatments should help mitigate any negative economic impacts. Key View #1: Below-Benchmark Portfolio Duration Bond investors should keep portfolio duration low in 2022, favoring the 2-year maturity over the 10-year. While the market’s pricing of the expected Fed liftoff date and initial pace of rate hikes is reasonable, terminal fed funds rate expectations are far too low. Our recommendation to keep portfolio duration low in 2022 stems directly from our assessment of Federal Reserve policy. Without going into too much detail – we will do that in next week’s “Fed In 2022” report – the Fed appears to have adopted a more hawkish reaction function during the past month. The Fed’s official forward guidance says that it will not lift rates until the labor market reaches “maximum employment”. However, Fed Chair Jay Powell weakened that commitment in recent Senate testimony. Powell said that persistently high inflation threatens the economic recovery and implied that to reach its maximum employment goal the Fed may need to act pre-emptively to tame inflation. To us, this means that the Fed’s “maximum employment” condition for lifting rates is no longer binding. The Fed will accelerate the pace of tapering when it meets this week and will start lifting rates between June and December of next year, depending on the interim trends in inflation and inflation expectations. After liftoff, Fed rate hikes will proceed at a predictable pace of 75-100 bps per year until economic growth slows significantly. We expect the fed funds rate to reach at least 2% before that occurs, consistent with survey estimates of the long-run neutral fed funds rate. Let’s compare our estimate of the future fed funds rate path with what is currently priced in the bond market (Chart 1). Chart 1The Market's Rate Expectations
The Market's Rate Expectations
The Market's Rate Expectations
Liftoff The overnight index swap (OIS) curve is priced for Fed liftoff in May 2022. This is a tad early compared to our projections, but not by much. Pace After liftoff, the OIS curve is priced for the fed funds rate to rise 79 bps during the subsequent 12 months. Again, this is roughly consistent with our own expectations that the Fed will deliver three or four 25 basis point rate hikes per year. Terminal Rate It is the market’s pricing of the endpoint of the next tightening cycle – the terminal fed funds rate – that disagrees significantly with our forecast. The OIS curve is priced for the funds rate to reach 1.5% in 2024 and then stabilize. This is too low. It is too low compared to the last tightening cycle when the fed funds rate reached 2.45% in 2019. It is also too low compared to survey estimates from market participants and primary dealers. The median respondent to the New York Fed’s Survey of Market Participants estimates that the long-run neutral fed funds rate is 2%. The median response to the same question from the Survey of Primary Dealers is 2.25% and the median FOMC participant pegs the long-run neutral rate at 2.5%. Meanwhile, the 5-year/5-year forward Treasury yield – a rough proxy for the long-run neutral interest rate that’s priced in the Treasury market – sits at only 1.73%. Historically, the 5-year/5-year forward yield converges with survey estimates of the long-run neutral rate as the Fed moves toward tightening (Chart 2). This means the 5-year/5-year forward Treasury yield has at least 27-52 bps of upside in 2022. Chart 25y5y Has Room To Rise
5y5y Has Room To Rise
5y5y Has Room To Rise
Treasury Yield Forecasts Chart 3Treasury Yield Forecasts
Treasury Yield Forecasts
Treasury Yield Forecasts
Chart 3 shows the 2-year, 5-year and 10-year Treasury yields along with the expected paths that are discounted in the forward curve for the next 12 months. The shaded regions in each panel represent our fair value estimates of where those yields will trade if the market moves to price-in our expected future path for the fed funds rate. The upper bound of the fair value range represents the most hawkish fed funds rate scenario that we think is feasible. It assumes that Fed liftoff occurs in June, that rate hikes proceed at a pace of 100 bps per year and that the fed funds rate levels-off at a terminal rate of 2.08% (8 bps above the lower-end of a 2%-2.25% target range). The lower bound of the fair value range represents the most dovish fed funds rate scenario that we think is feasible. It assumes that Fed liftoff occurs in December 2022, that rate hikes proceed at a pace of 75 bps per year and that the fed funds rate levels-of at a terminal rate of 2.08%. Chart 3 shows that the 10-year Treasury yield is well below even the lower-end of our fair value range. The 5-year Treasury yield is a bit too low compared to our target range and the 2-year yield is consistent with our fair value range, though at the very upper-end. The investment conclusions are obvious. Bond investors should keep portfolio duration low in 2022. They should avoid the 10-year maturity and allocate most funds to shorter maturities like the 2-year. It should be noted that we used a conservative 2.08% terminal rate estimate in the scenarios presented in Chart 3. This is at the low-end of most survey estimates. What’s more, the BCA Outlook makes a strong case that those survey estimates will be revised higher once it becomes apparent that interest rates will have to rise to well above 2% to contain inflation. We agree that survey estimates of the long-run fed funds rate are probably too low, but we don’t expect them to be revised higher in 2022. Upward terminal rate revisions are probably a story for 2023 or 2024, sometime after the Fed has delivered a few rate hikes and it becomes apparent that more will be needed to slow an overheating economy. Appendix A at the end of this report translates different fed funds rate scenarios into 12-month expected returns for every Treasury maturity. We show scenarios where the liftoff date varies between June 2022 and December 2022, where the pace of rate hikes varies between 75 bps and 100 bps per year and where the terminal fed funds rate varies between 2.08% and 2.58%. The 10-year Treasury note is projected to deliver negative returns in every scenario we tested. Meanwhile, the 2-year Treasury note is projected to deliver a small positive return in every single scenario. These results support our conclusion from Chart 3. Investors should maintain below-benchmark portfolio duration and favor short maturities over long maturities. Risks To The View The first risk to our bearish view on US Treasuries is a resurgence of the pandemic. The 10-year Treasury yield continues to track the “pandemic trade” in the stock market. That is, the 10-year yield rises when a basket of equities that benefit from economic re-opening outperforms a basket of equities that benefit from lockdowns, and vice-versa (Chart 4). So far, the news about the virulence of the Omicron COVID variant has been encouraging, and our base case scenario assumes a further easing of pandemic concerns over the course of 2022. The second risk to our view is that the Fed moves too aggressively toward rate hikes causing an abrupt tightening of financial conditions that weighs on economic growth and sends long-dated bond yields lower. The shaded region in Chart 5 shows that this exact dynamic played out in 2018. Fed rate hikes started to pressure the dollar higher and weigh on equities. This led to tighter financial conditions and slower economic growth. The impact of tighter financial conditions was not immediately evident in the bond market, but slower growth eventually caused the Fed to back away from rate hikes leading to a late-2018 peak in the 10-year yield. Chart 410yr Tracks The "Pandemic Trade"
10yr Tracks The "Pandemic Trade"
10yr Tracks The "Pandemic Trade"
Chart 5Watch Financial Conditions In 2022
Watch Financial Conditions In 2022
Watch Financial Conditions In 2022
Compared to the 2018 scenario, we see less risk of Fed over-tightening in 2022 mainly because the fed funds rate is starting out at a much lower level. However, it will be important to track financial conditions as the Fed moves toward liftoff. Undue tightening would cause us to reverse our positioning. Key View #2: Own Treasury Curve Steepeners The 2/10 Treasury slope will flatten by less than what is currently discounted in the forward curve in 2022. Investors should position for this by going long the 2-year note versus a duration-matched barbell consisting of cash and the 10-year note. We also recommend buying the 20-year bond versus a duration-matched barbell consisting of the 10-year note and 30-year bond as an attractive duration-neutral carry trade. The scenarios presented in the prior section show that the 2-year Treasury yield is priced within the bounds of our estimated fair value range while the 10-year Treasury yield looks too low. Logically, it makes sense to position for a steepening of the 2/10 Treasury curve to profit from this divergence. Chart 6 illustrates the implications of the prior section’s fair value estimates for different Treasury slopes. Our fair value range projects that the 2/10 Treasury slope will be between 38 bps and 89 bps in 12 months, above the 37 bps that is currently priced into the forward curve. The forward curve is also priced for too much flattening in the 2/5 Treasury slope, while the 5/10 slope is consistent with the lower end of our fair value range. The conclusion is that investors should implement 2/10 Treasury curve steepeners in 2022 on the expectation that the 2/10 slope will flatten by less than what is currently discounted in the forward curve. A comparison of the 5-year/5-year forward Treasury yield with a target range based on survey estimates of the long-run neutral fed funds rate also supports the case for 2/10 steepeners. Historically, an increase in the 5-year/5-year forward yield towards its target range corresponds with a steepening of the 2/10 slope (Chart 7). Bear-flattening moves in the 2/10 slope only occur when the 5-year/5-year forward is within its target band, as was the case in 2017/18. Given that the 5-year/5-year forward yield is currently well below its survey-derived target range, there is room for some 2/10 steepening as yields rise. Chart 6Treasury Slope Forecasts
Treasury Slope Forecasts
Treasury Slope Forecasts
Chart 7A Rising 5y5y Will Steepen The Curve
A Rising 5y5y Will Steepen The Curve
A Rising 5y5y Will Steepen The Curve
One way to position for a steeper 2/10 curve is to go long the 5-year Treasury note versus a duration-matched barbell consisting of the 2-year and 10-year notes. Presently, this trade looks very attractive. The 2/5/10 butterfly spread shows a significant yield advantage in the 5-year bullet over the 2/10 barbell, both in absolute terms and relative to our fair value model (Chart 8). While we view this as a good trade, we don’t think it’s the best way to position for 2/10 steepening. We prefer a position long the 2-year note versus a duration-matched barbell consisting of cash and the 10-year note. This trade gives you long exposure at the 2-year maturity instead of the 5-year maturity which will boost returns if the 2/5 slope steepens, as we anticipate it will (Chart 6, panel 2). Chart 8Curve Steepeners Are Cheap
Curve Steepeners Are Cheap
Curve Steepeners Are Cheap
In addition to our recommended 2/10 steepener, we advise clients to favor the 20-year bond versus a duration-matched barbell consisting of the 10-year note and 30-year bond. While we’d expect some flattening of the 10/30 slope in 2022, this trade should still perform well because of its huge carry advantage. The tables in Appendix A show that the 20-year bond earns a massive 12-month carry (income plus rolldown return) of 3.05% compared to 1.85% for the 10-year note and 1.80% for the 30-year bond. Key View #3: Sell Short-Maturity TIPS Chart 9TIPS Breakevens
TIPS Breakevens
TIPS Breakevens
Investors should maintain a neutral allocation to long-maturity TIPS versus nominal Treasuries and an underweight allocation to short-maturity TIPS versus nominal Treasuries. Other attractive positions include: an outright short position in 2-year TIPS, an inflation curve steepener (short 2yr TIPS/long 2yr nominal/long 10yr TIPS/short 10yr nominal), and a TIPS curve flattener (short 2yr TIPS/long 10yr TIPS). As noted at the beginning of this report, we see inflation trending down in 2022. Inflation will remain high enough for the Fed to feel comfortable lifting rates, but it won’t match the elevated readings that are currently discounted in TIPS. Interestingly, long-maturity TIPS breakeven inflation rates are roughly consistent with the Fed’s 2.3%-2.5% target range (Chart 9). The 5-year/5-year forward TIPS breakeven inflation rate is a bit too low, at 2.13%, and the 10-year TIPS breakeven inflation rate is currently 2.47%. With long-dated TIPS breakevens so close to the Fed’s target, we recommend a neutral allocation to long-maturity TIPS versus long-maturity nominal Treasuries heading into 2022. In our view, the mispricing in TIPS lies at the front-end of the curve. The 2-year TIPS breakeven inflation rate has risen to 3.23%, well above the Fed’s 2.3%-2.5% target range. This year’s surge in short-maturity TIPS breakevens has also resulted in a deeply inverted inflation slope (Chart 9, bottom panel). Table 1Regression of Monthly Changes In CPI Swap Rate Versus Monthly Changes In 12-Month Headline CPI Inflation (2010 - Present)
2022 Key Views: US Fixed Income
2022 Key Views: US Fixed Income
Short-maturity inflation expectations are highly sensitive to changes in CPI inflation, much more so than long-maturity expectations. In fact, monthly changes in the 2-year CPI swap rate are more than twice as sensitive to headline inflation than are monthly changes in the 10-year CPI swap rate (Table 1). This means that the cost of short-maturity inflation compensation will decline as inflation moderates in 2022. We recommend an underweight allocation to short-maturity TIPS versus short-maturity nominal Treasuries. We also think an outright short position in 2-year TIPS will be highly profitable in 2022. If we assume that the 2-year TIPS breakeven inflation rate falls to the middle of the Fed’s target range during the next 12 months, and additionally that the 2-year nominal Treasury yield converges with our fair value estimate using the scenario of a September Fed liftoff, 100 bps per year hike pace and 2.08% terminal rate, then we calculate that the 2-year TIPS yield will rise from its current -2.56% to -0.98% during the next 12 months (Chart 10). Chart 10A Lot Of Upside In Short-Maturity Real Yields Short 2-Year TIPS
A Lot Of Upside In Short-Maturity Real Yields Short 2-Year TIPS
A Lot Of Upside In Short-Maturity Real Yields Short 2-Year TIPS
Chart 10 also shows that the anticipated rise in the 2-year TIPS yield greatly outpaces the modest expected increase in the 10-year TIPS yield. This means that a position in 2/10 TIPS curve flatteners will turn a profit in 2022 (Chart 10, bottom panel). Key View #4: Overweight Corporate Bonds Versus Treasuries … For Now We are overweight corporate bonds versus duration-matched Treasuries, for now, but expect to turn more defensive in the first half of 2022 once the yield curve sustainably moves into a flatter regime. Relative valuations suggest that investors should favor high-yield corporates over investment grade. A key pillar of our corporate bond investment process is to split the economic cycle into three phases based on the slope of the yield curve (Chart 11). Phase 1 of the cycle is defined as the period from the end of the last recession until the 3-year/10-year Treasury slope breaks below 50 bps. Phase 2 of the cycle spans the period when the slope is between 0 bps and 50 bps. Phase 3 lasts from when the yield curve inverts until the start of the next recession. Chart 11The Three Phases Of The Economic Cycle
The Three Phases Of The Economic Cycle
The Three Phases Of The Economic Cycle
Our historical analysis shows that excess corporate bond returns versus duration-matched Treasuries tend to be strongest in Phase 1. They are usually positive, but much lower, in Phase 2 and are often negative in Phase 3 (Table 2). Table 2Corporate Bond Returns Across The Three Phases Of The Cycle
2022 Key Views: US Fixed Income
2022 Key Views: US Fixed Income
We have been firmly in Phase 1 since April 2020 and, as we would expect, excess corporate bond returns have been strong. However, we will not remain in Phase 1 much longer. The 3-year/10-year Treasury slope is currently 50 bps, right on the precipice between Phase 1 and Phase 2. We recommend an overweight allocation to corporate bonds versus Treasuries for now, but we will adopt a more defensive posture toward corporates once we transition into Phase 2. We expect this will happen sometime in the first half of 2022. Why Are We Not In Phase 2 Already? Chart 12Curve Flattening Is Overdone
Curve Flattening Is Overdone
Curve Flattening Is Overdone
The 3-year/10-year Treasury slope is hovering right around 50 bps. However, as is noted earlier in this report, we think that recent yield curve flattening is overdone and expect it to reverse somewhat in the coming months. Chart 12 shows the 3-year/10-year slope along with an expected fair value range. This range is based on a 100 bps Fed rate hike pace, a 2.08% terminal rate and varying the liftoff date between June 2022 and December 2022. This fair value range only breaks below 50 bps between March and September of next year. Given our yield curve view, we are positioned for one last period of strong corporate bond outperformance during the next few months. But we will turn more defensive once we judge that we have sustainably transitioned into a Phase 2 environment. Why Turn More Defensive In Phase 2? Chart 13IG Corporate Valuations
IG Corporate Valuations
IG Corporate Valuations
It’s correct to point out that excess corporate bond returns are still generally positive in Phase 2 environments, so ideally, we would remain overweight corporate bonds versus Treasuries throughout Phase 2. This makes sense theoretically, but strategically we think it will be wise to adopt a different approach this cycle. The main reason to err on the side of caution is that corporate bond valuations are extremely stretched. The 12-month breakeven spread for the investment grade corporate bond index is at its 6th percentile since 1995. This means that the investment grade corporate bond index has only been more expensive than today 6% of the time since 1995 (Chart 13). Tight spreads mean that expected returns will be modest, even in a favorable cyclical environment. In other words, we are not sacrificing much expected return by reducing exposure early in the cycle. Given that we can’t predict the start of the next Phase 3 period with exact precision, we think it makes sense to be more defensive this cycle. We will sacrifice some modest expected returns to ensure that we are well positioned for the next period of significant spread widening. Our corporate bond strategy is supported by an empirical study of historical returns. Table 3A shows average 12-month excess returns for the investment grade corporate bond index after certain combinations of the 3/10 Treasury slope and average index option-adjusted spread (OAS) are observed. Table 3B shows 90% confidence intervals for the averages presented in Table 3A.
Chart
Chart
The tables show that a strategy of remaining overweight corporate bonds versus Treasuries after the yield curve transitions into Phase 2 only works when the corporate index OAS is above 100 bps. A transition into Phase 2 portends negative excess corporate bond returns when the OAS is below 100 bps, as it is today. Favor High-Yield Over Investment Grade Chart 14HY Corporate Valuations
HY Corporate Valuations
HY Corporate Valuations
While investment grade corporate bonds look extremely expensive compared to history, high-yield corporate bonds look somewhat expensive, but much less so. The average High-Yield index OAS is 1 bp below its pre-COVID low, but investors still get a nice spread pickup for moving out of the Baa-rated credit tier and into the Ba-rated tier (Chart 14). Our prior research has shown that high-yield corporates tend to outperform duration-matched Treasuries when the excess index spread after accounting for default losses is above 100 bps.2 If we assume a minimum required excess spread of 100 bps and a 40% recovery rate on defaulted debt, we can calculate that the junk index is priced for a default rate of 3.4% during the next 12 months (Chart 14, bottom panel). All available evidence suggests that the default rate will come in below 3.4% during the next 12 months, leading to positive excess returns for high-yield corporate bonds. The default rate came in at 1.8% for the 12-month period ending in November and it has been dropping like a stone, consistent with the reading from our Default Rate Model (Chart 15). We also recently wrote about the exceptionally good health of corporate balance sheets.3 We expect the default rate will be in the mid-2% range in 2022, below what is priced into the junk index. Chart 15Corporate Defaults Will Stay Low In 2022
Corporate Defaults Will Stay Low In 2022
Corporate Defaults Will Stay Low In 2022
Junk’s valuation advantage leads us to recommend that investors maintain a preference for high-yield corporates over investment grade. We will turn more defensive on both investment grade and high-yield corporates once we transition into a Phase 2 environment, but we may still retain our preference for high-yield over investment grade at that time, as long as junk stays relatively cheap. Key View #5: Overweight Emerging Market Bonds Versus US Corporates Investment grade USD-denominated Emerging Market bonds (both sovereigns and corporates) will outperform US corporate bonds with the same credit rating and duration in 2022. EM bonds offer an attractive spread advantage versus US corporates, and 2022 returns will be boosted by a weakening US dollar. We see an opportunity in Emerging Market (EM) bonds for US investors in 2022. Note that we are only referring to investment grade EM bonds denominated in US dollars. We consider both investment grade USD-denominated EM sovereign bonds and investment grade USD-denominated EM corporate & quasi-sovereign bonds. EM Sovereigns Chart 16EM Sovereigns
EM Sovereigns
EM Sovereigns
EM sovereigns have modestly outperformed Treasuries so far this year (see Appendix B for a complete breakdown of year-to-date performance for different corporate bond sectors), and yet the sector remains attractively valued in the sense that the average index OAS has still not recovered its pre-COVID low (Chart 16). A look at recent performance trends shows that EM sovereigns outperformed credit rating and duration-matched US corporates in H2 2020 when the sector benefited from a huge yield advantage and a rapidly depreciating US dollar.4 This year, EM sovereigns lagged US corporates as the dollar strengthened. Looking ahead to 2022, we think that the recent bout of dollar strength is close to its end as the bond market has already moved to price-in an extremely hawkish Fed outlook at the front-end of the curve. A flat or depreciating dollar will benefit EM bonds in 2022, as will the yield advantage in EM sovereigns versus credit rating and duration-matched US corporates (Chart 16, panel 4). This yield advantage will only look more attractive as the Treasury curve flattens and the outlook for US corporate spreads deteriorates. At the country level, we see the best EM sovereign opportunities in Mexico, Russia, Chile, UAE, Qatar and Saudi Arabia. The bonds of all these countries outperformed credit rating and duration-matched US corporate bonds during the past 12 months, and they continue to offer a sizeable spread advantage (Chart 17).
Chart 17
EM Corporates & Quasi-Sovereigns The investment grade USD-denominated EM Corporate & Quasi-Sovereign index shows a similar relative return pattern to the EM Sovereign index, though overall performance has been better (Chart 18). We see that the index outperformed credit rating and duration-matched US corporates dramatically in H2 2020 when the dollar was under pressure. Relative returns have been more stable this year as the dollar has strengthened. Chart 18EM Corporates & Quasi-Sovereigns
EM Corporates & Quasi-Sovereigns
EM Corporates & Quasi-Sovereigns
EM corporates & quasi-sovereigns should continue to outperform credit rating and duration-matched US corporates in 2022. A weaker dollar will certainly help, but the main driver of outperformance will be the very attractive yield advantage (Chart 18, panel 4). Key View #6: A Maximum Overweight Allocation To Municipal Bonds Municipal bonds offer exceptional value, especially at the long-end of the curve, and state & local government balance sheets are in excellent shape. US bond investors should favor tax-exempt municipal bonds relative to both Treasuries and equivalently-rated corporate bonds. Long-maturity tax-exempt municipal bonds continue to be one the most attractively priced assets in the US fixed income space. As we discussed in a recent report, one big reason for the attractive valuation is that municipal bonds tend to pay premium coupon rates.5 This significantly reduces the duration risk in long-dated munis. The first two columns of Table 4 show the yield ratios and breakeven tax rates between different municipal bond sectors and duration-matched Treasury securities. We see that the breakeven tax rate – the tax rate that equalizes after-tax yields between the two sectors – is a mere 11% for 12-17 year general obligation munis. The breakeven tax rate between 12-17 year revenue munis and duration-matched Treasuries is only 3%, and the longest-maturity munis actually offer a before-tax yield advantage versus Treasuries! Table 4Muni/Treasury And Muni/Credit Yield Ratios
2022 Key Views: US Fixed Income
2022 Key Views: US Fixed Income
Table 4 shows that munis also offer excellent value compared to corporate bonds with the same credit rating and duration, especially at the long-end of the curve. Breakeven tax rates between munis and corporate credit range from 3% to 21% for maturities longer than 12 years. What’s even more impressive about municipal bonds is that their attractive valuations are buttressed by extremely high credit quality. State & local government balance sheets have received a huge boost from federal stimulus during the past two years, and this has sent net state & local government savings (revenues minus expenditures) surging into positive territory (Chart 19). But it’s not just federal stimulus that has aided state & local governments. Even if we exclude transfer payments altogether, we find that the difference between tax receipts and consumption expenditures is rising sharply relative to interest expense (Chart 19, panel 2). Ratings agencies have noticed the improvement in state & local government budgets and ratings upgrades have far outpaced downgrades during the past year (Chart 19, bottom panel). Chart 19State & Local Balance Sheets In Good Shape
State & Local Balance Sheets In Good Shape
State & Local Balance Sheets In Good Shape
Key View #7: Underweight Agency MBS Chart 20Poor MBS Performance Will Continue
Poor MBS Performance Will Continue
Poor MBS Performance Will Continue
Agency Mortgage-Backed Securities don’t adequately compensate investors for the likely pace of refi activity in 2021. An up-in-coupon stance is also advisable to take advantage of rising bond yields. We noted in a recent report that Agency Mortgage-Backed Securities have performed poorly in 2021.6 The main reason for the poor performance is that the compensation for prepayment risk embedded in MBS spreads (aka option cost) started the year at a very low level, but mortgage refinancing activity has been much higher than expected (Chart 20). The conventional 30-year MBS option cost has been rising, but it is still only back to where it was in 2019 (Chart 20, panel 2). This is not sufficiently attractive for us to advocate buying MBS. While rising bond yields will be a tailwind for refi activity in 2022, we still expect the pace of refinancings to be relatively strong because the rapid run-up in home prices has made it extremely enticing for households to tap the equity in their homes through cash-out refis. Within a recommended underweight allocation to MBS, we recommend that investors favor higher coupon securities over lower coupon ones. Higher-coupon MBS carry less duration than lower-coupon MBS and also wider OAS and greater convexity. This means that high-coupon MBS will outperform low-coupon MBS if bond yields rise in 2022, as we expect they will. Appendix A: Treasury Return Forecasts
Image
Image
Image
Image
Image
Image
Image
Image
Image
Image
Image
Image
Appendix B: US Bond Sector Year-To-Date Performance
Image
Image
Ryan Swift US Bond Strategist rswift@bcaresearch.com Footnotes 1 Please see The Bank Credit Analyst, “Outlook 2022: Peak Inflation – Or Just Getting Started?”, dated December 1, 2021. 2 Please see US Bond Strategy Weekly Report, “No Holding Back”, dated June 16, 2020. 3 Please see US Bond Strategy Weekly Report, “The Fed’s Inflation Problem”, dated November 23, 2021. 4 A weaker dollar tends to benefit USD-denominated EM bonds because it makes it easier for foreign issuers to service their dollar denominated debts. 5 Please see US Bond Strategy Weekly Report, “The Best & Worst Spots On The Yield Curve”, dated October 26, 2021. 6 Please see US Bond Strategy Weekly Report, “The Omicron Impact”, dated November 30, 2021. Recommended Portfolio Specification Other Recommendations Treasury Index Returns Spread Product Returns

The JP Morgan Emerging Markets Currency Index has fallen sharply over the past month and is now at lows last seen during the initial phase of the COVID-19 crisis in the spring of 2020. The currency index that excludes China, Korea, and Taiwan is nearing…
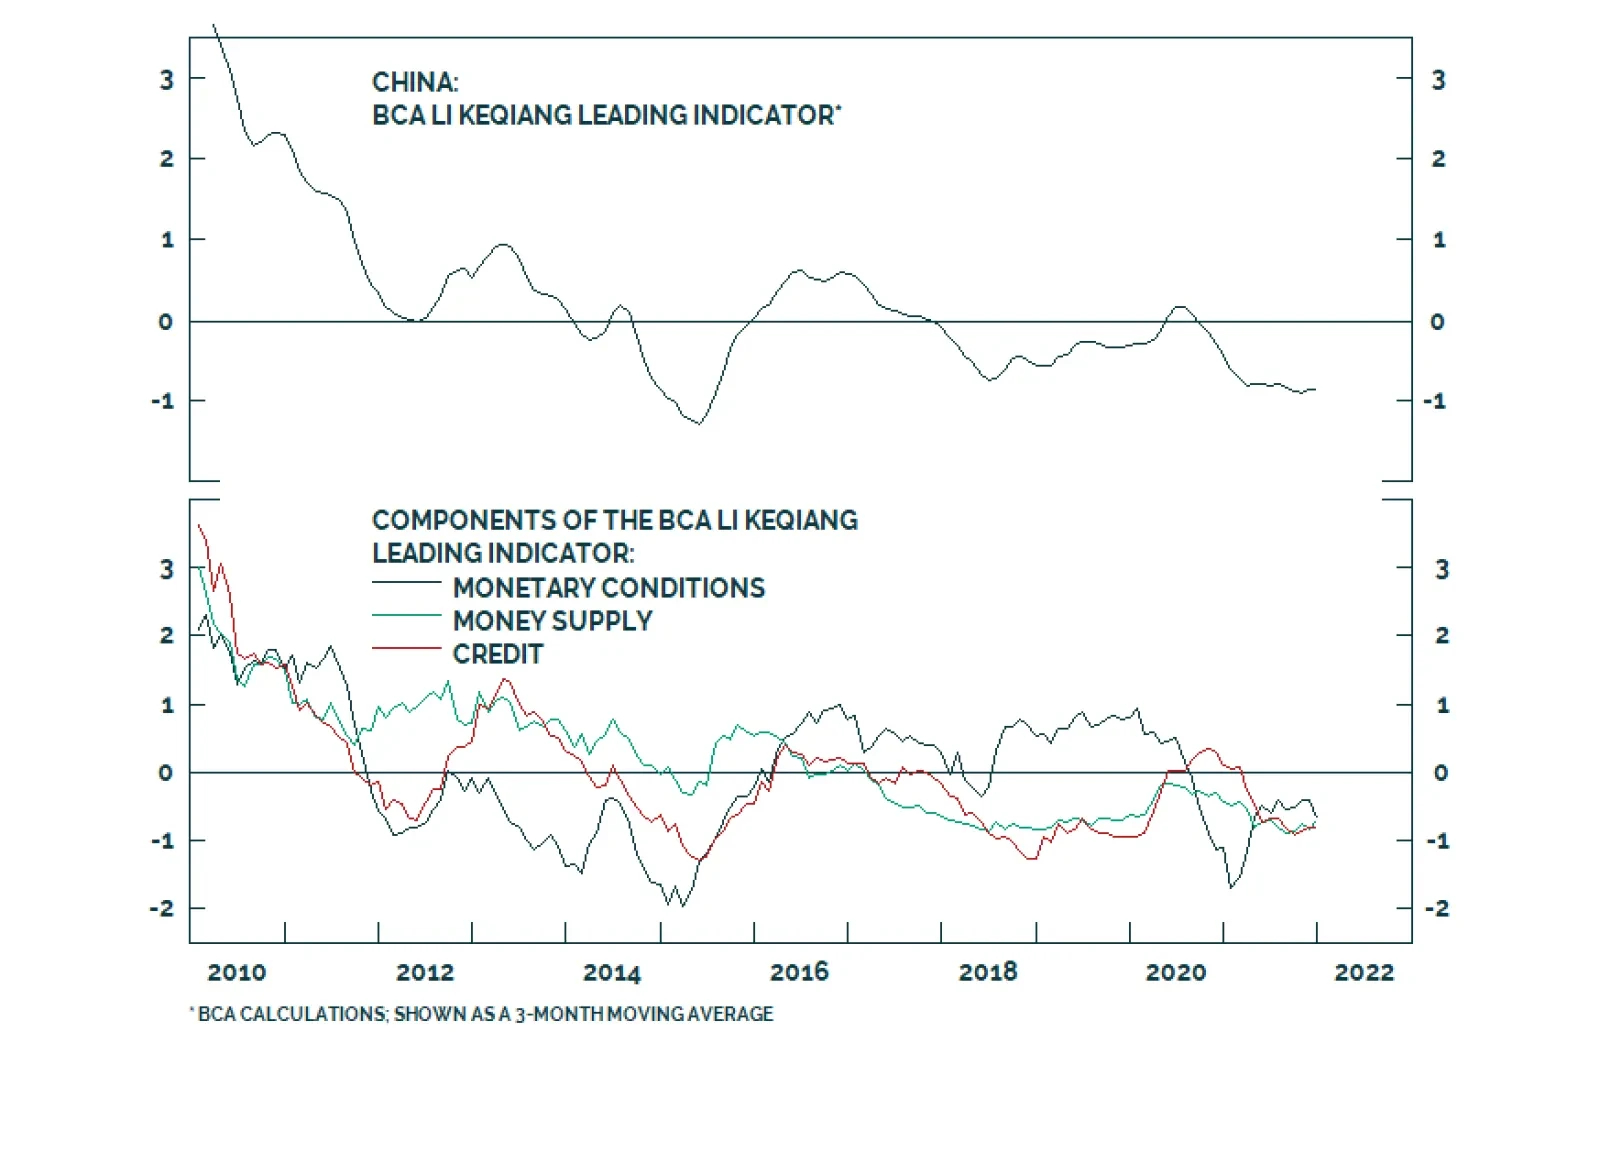
China In 2022: '''Ensuring Stability'''
…
Highlights A partial reinvasion of Ukraine cannot be ruled out. The constraints on Russia are not prohibitive, especially amid global energy shortages. On this issue, it is better to be alarmist than complacent. We would put the risk of a partial re-invasion of Ukraine as high as 50/50, albeit with an uncertain time frame over 12-36 months. The negative impact of conflict may not stay contained within Russian and eastern European markets. The US and EU are now threatening major retaliatory sanctions if Russia invades. In response Russia could reduce energy exports, exacerbating global shortages and damaging Europe’s overall economy. Investors should stay short Russian assets and overweight developed European equities over emerging European peers. Stay long gold and GBP-CZK. The dollar will be flat-to-up. Feature Chart 1Ruble Faces More Downside From Geopolitics
Ruble Faces More Downside From Geopolitics
Ruble Faces More Downside From Geopolitics
Geopolitical tensions surrounding Russia remain unresolved and investors should continue to reduce holdings of assets exposed to any renewed conflict in Ukraine and the former Soviet Union. The ruble has dropped off its peaks since early November when strategic tensions revived (Chart 1). Presidents Joe Biden and Vladimir Putin held their second bilateral summit on a secure video link on December 7 to discuss the situation in Ukraine, where Russia has amassed 95,000-120,000 troops on the border in a major show of force. Russia also mustered troops in April and only partially drew them down after the Biden-Putin summit in Geneva where the two sides agreed to hold talks to address differences. The two presidents agreed to hold consultations regarding Ukraine. Putin accused NATO of building up Ukraine’s military and demanded “reliable, legally fixed guarantees excluding the expansion of NATO in the eastern direction and the deployment of offensive strike weapons systems in the states adjacent to Russia.”1 President Putin’s red line against Ukraine joining NATO is well known. Recently he said his red line includes the placement of western military infrastructure or missile systems in Ukraine. Biden refused to accept any limits on NATO membership in keeping with past policy. After the summit National Security Adviser Jake Sullivan said, “I will tell you clearly and directly [Biden] made no such commitments or concessions. He stands by the proposition that countries should be able to freely choose who they associate with.” 2 Biden, who had conferred with the UK, France, Germany, and Italy prior to the call, outlined the coordinated economic sanctions that would be leveled against Russia if it resorted to military force, as well as defense aid that would go to Ukraine and other eastern European countries. Thus Putin gave an ultimatum and Biden rebuffed it – and yet the two agreed to keep talking. The Russians have since said that they will present proposals to the Americans in less than a week. Talks are better than nothing. But neither side has given concrete indication of a change in position that would de-escalate strategic tensions – instead they have both raised the stakes. Therefore investors should proceed with the strong presumption that tensions will remain elevated or escalate in the coming months. Clearing Away Misconceptions Before going further we should clear away a few misconceptions about the current situation: Ukraine has unique strategic value to Russia. Like Belarus, but unlike Central Asia, Ukraine serves as critical buffer territory protecting Moscow and the Russian core from any would-be invaders. Russia lacks firm geological borders so it protects itself by means of distance and winter. This grand strategy succeeded against King Charles XII of Sweden, Napoleon, and Hitler. The collapse of the Soviet Union left Russia shorn of much of its buffer territory. Ukraine also offers access to the Black Sea. Russia has long striven to gain access to warm-water ports. The loss of control over Ukraine resulted in a loss of access. Russia’s seizure of Crimea in 2014 only partially rectified the situation. Ukraine’s southern coastline around Crimea is the territory at risk today (Map 1).
Chart
It is Ukraine’s physical existence and unique strategic value – not its democratic leanings or ideological orientation – that ensures perpetual tensions with post-Soviet Russia. Russia has a strategic imperative to reassert control or at least prevent control by foreign powers. Ideological opposition may make things worse but an anti-Russian Ukrainian dictator would also face Russian coercion or aggression, perhaps even more than the current weak democracy. In fact Russia is trying to force Ukraine to revise its constitution and adopt a federal structure so as to grant greater autonomy to separatist regions Donetsk and Luhansk that Russia helped break away in 2014. But Ukraine has not relented to Moscow’s demands of political reform. It is not authoritarianism but a permanent foreclosure of Ukrainian membership in the EU and NATO that Moscow is after. Yet it is highly unlikely that Russia would try to invade and conquer all of Ukraine. Ukraine is the largest country by territory in Europe and has 255,000 active soldiers and 900,000 reserves (contra Russia’s 1 million active and 2 million reserves) who would defend their freedom and sovereignty against an invader.3 Russia would not be able to stage a full-scale invasion with the 175,000 maximum troop buildup that US intelligence is warning about. It would have to mobilize fully, dangerously neglecting other vast dimensions of its national security, and would inevitably get bogged down fighting a vicious insurgency backed by the NATO powers. It would save blood and treasure by paralyzing Ukraine’s politics and preventing it from allying with western militaries, which is what Putin is attempting to do today. Putin uses foreign adventures to strengthen his grip at home but an adventure of this nature would impose such burdens as to threaten his grip at home. A limited re-invasion of Ukraine could yield historic strategic advantages to Russia. Moscow could focus on a partial military incursion that would annex or shore up Donbass, or extend its control from Donbass to the Black Sea, conceivably all the way to the Dnieper river. This pathway would yield Russia maritime access and a buffer space to fortify Crimea. Naval warfare could also yield control of deep-water ports (Yuzhne, Odessa, Mykolaiv, Chornomorsk), control of the mouth of the Dnieper, control of the canal that supplies water to Crimea, and a means of bottling up the Ukrainian navy and preventing foreign maritime assistance. Ukraine would be further weakened and Russia would have a larger beachhead in Ukraine for future pressure tactics. Russia is not bluffing – its military buildup poses a credible threat. If there is anywhere Russia’s threats are credible, it is in taking military action against former Soviet republics like Georgia (2008) and Ukraine (2014) that have pro-western leanings yet lack the collective security of the NATO alliance. At very least, given that Russian forces did deploy in Ukraine in 2014, Russian action in Ukraine cannot be ruled out. The military balance has not changed so significantly in that time and strongly favors Russia (Chart 2). The US has provided around $2.5 billion in military aid to Ukraine since 2014, and has sent lethal weapons including Javelin anti-tank missiles and launchers since 2017-18, including $450 million worth of military aid under the Biden administration (and $300 million just authorized by Congress on December 7). NATO allies have also provided defense aid. This is part of Putin’s complaint but these new arms are not game changers that would prevent Russia from taking military action.
Chart 2
Thus if the West rejects Moscow’s core demands, war is likely. This is true even if Russia would prefer to achieve its aims through political and economic rather than military means. Russia does not deem the West’s threat of sanctions as prohibitive of invasion. The West’s sanctions since 2014 have failed to change Russia’s government, strategy, or posture in Ukraine. Yes, European nations joined the US in imposing sanctions. But Germany also pursued the Nord Stream II pipeline as a means of bypassing Ukraine and working directly with Russia to preserve economic engagement and energy security. Former Chancellor Merkel forced the pipeline through despite the objections of eastern Europeans and the United States. The allies also formed the “Normandy Quartet,” excluding the US, to force Ukraine to accept the Minsk agreements on resolving the conflict. Thus the lesson of 2014-21 is not that NATO allies stood shoulder-to-shoulder in defense of Ukraine’s sovereignty and territorial integrity but rather that Germany and the EU, and the EU and the US, have major differences in interests and risk-tolerance in dealing with Russia. Russia does not face, or may think it does not face, a united front among the western powers. A partial reinvasion of Ukraine would bring the western allies together initially but probably not for long. Russia determines the timing of any new military incursion in Ukraine. Winter is not the ideal time to invade Ukraine, though it is possible. Russia could act in spring 2022, as the US has warned, but it could also act in the summer of 2023, the spring of 2024, or other times. From a strategic point of view, Russia has enjoyed a historic window of opportunity since 2001 when the US got bogged down in Afghanistan and Iraq and then the US and the EU got bogged down in economic and financial crisis. Given that the American political establishment is withdrawing from foreign quagmires, reactivating fiscal policy, bulking up the military-industrial complex, and making a dedicated effort to revitalize its global alliances, Russia may believe that its historic window is closing. Russia’s domestic fundamentals are deteriorating over time. Putin could decide it is necessary to seize strategic ground in Ukraine sooner rather than later. Bottom Line: Ukraine offers unique and irreplaceable buffer space and maritime access to Russia. Russia’s military actions in 2014 led to stalemate, such that Russia remains insecure, Ukraine remains defiant, and the West is still entertaining defense cooperation or even NATO membership with Ukraine. Yet the Crimea conflict also revealed a lack of concert among western powers exemplified by Germany’s Nord Stream II pipeline. Today Russia has the military capability to seize another slice of Ukrainian territory. Western retaliatory actions would be painful but may not be deemed prohibitive. Investors cannot rule out a partial re-invasion of Ukraine. Nord Stream Pipeline Is Not The Sole Factor Is Russia not making a show of military force merely to ensure that Nord Stream II pipeline goes into operation? Will Russia not back down if the pipeline is guaranteed? A common view in Washington and the financial industry is that Russia’s military buildup is just a bluff, i.e. Moscow’s aggressive way of demanding that Germany’s new government and the European Union approve Nord Stream. The pipeline finished construction in September but now awaits formal regulatory certification. Approval was originally expected by May 2022 but has now been delayed. The pipeline would carry 55 billion cubic meters of natural gas into Europe, about half of Russia’s current export capacity outside of Ukraine. Ukraine’s total capacity is around 150 billion cubic meters. The pipeline enables Russia and Germany to bypass Ukraine, whose conflicts with Moscow since 2004 have threatened Germany’s energy security. About 18% of EU’s total energy imports come from Russia, whilst this figure is 16% for Germany. That is about 0.5% and 0.2% of EU and German GDP, respectively. Meanwhile Russian energy exports to Germany and the EU make up 0.8% and 5.6% of GDP, respectively (Chart 3).
Chart 3
The problem with this reasoning is that the US conceded Nord Stream to Russia over the summer. The US initially raised the threat of sanctions because the pipeline strengthened Russo-German ties, diminished Ukraine’s leverage, and deprived the US of a chance to sell liquefied natural gas to Europe. But the Biden administration proved unwilling to take this aggressive approach. Secretary of State Anthony Blinken has a long history of arguing that the US should prioritize strong relations with its European allies rather than punitive measures to try to block Russian gas sales. Biden met with outgoing Chancellor Angela Merkel in July and agreed to let Nord Stream go forward. The only proviso was that Russia not “weaponize natural gas,” i.e. withhold supplies for geopolitical purposes, as it has done in the past.4 Before Russia’s military threats, Germany and the EU were expected to certify the pipeline by no later than May 2022 and an earlier certification looked possible because of Europe’s low natural gas supplies. Yet Russia, fresh off parliamentary elections, did precisely what Germany said it was not supposed to do. The pipeline was completed in September and reports of Russian limitations on natural gas supply surfaced in October. Moscow not only weaponized the gas but also mustered its army on the Ukrainian border again. Putin may have feared that the new German government, which officially took office on December 8, would change policy and refuse to certify the pipeline. He also could have feared that the US Congress would pass a Republican-backed provision that would require Biden to impose sanctions that would halt the pipeline. But these explanations are not satisfactory. First, the German government was not likely to halt Nord Stream. Quite the opposite, Berlin has pushed against all opposition to speed the pipeline into action. It only delayed the regulatory approval when Russia did the one thing that Germany had expressly prohibited, which was weaponize natural gas. Second, the US Congress was never likely to pass mandatory sanctions on Nord Stream operators. The Democrats opposed it, as it would have tied Biden’s hands, whereas presidents always retain discretion over foreign policy and national security. Even moderate Republicans opposed the measure, for the same reason. If either of these were the reason for Putin’s latest buildup, then the buildup will probably dissipate in the coming months. Putin also wants to force Ukraine to implement the Minsk agreements. But the Biden administration adopted the Minsk framework in June for the first time, which was a concession to Russia. So the latest military threats are not solely about coercing Europe to approve the pipeline or Ukraine to implement Minsk. Putin is driving at something else. Putin’s Focus On Ukraine And NATO Putin used military pressure on Ukraine’s border to force the US to accept the pipeline and the Minsk agreements. He is now using the same tactic to raise the stakes and demand that the US and its allies permanently rule out NATO membership and defense cooperation with Ukraine. Biden rejected the first demand during the summit, as mentioned. There is no way that the US or NATO will forswear any and all eastward expansion. Even on Ukraine specifically, Biden cannot give Russia a legal guarantee because it would require a 60-seat majority in the Senate (not likely). Any future president would retain prerogative over the matter anyway and Putin knows this. Moreover Ukraine is never going to join NATO. Russia would attack. And NATO members would not be unanimous (as is required for new members) because the collective defense treaty would require them to defend Ukraine. They would be signing up for a war with Russia. Still Biden is unlikely to disavow Ukrainian NATO membership because to do so would be to deny the self-determination of nations, capitulate to Russian coercion, and demoralize the Ukrainians, whom the US hopes will maintain a plucky resistance against Russian domination. It would also demoralize US allies and partners – namely Taiwan, which also lacks a formal defense treaty and would be forced to sue for peace with China in the face of American abandonment. Biden’s refusal to ban Ukraine from NATO is encapsulated in Diagram 1, an exercise in game theory that exemplifies why the risk of war should not be dismissed. Diagram 1Game Theory Suggests Russia Will Keep Applying Military Pressure
Russia/Ukraine: Don’t Be Complacent
Russia/Ukraine: Don’t Be Complacent
Biden may give private or executive assurances on Ukraine and NATO but Putin will know that these mean nothing since Biden may be out of office as early as January 2025 and then Putin would have to renegotiate. America is not a credible negotiator because partisanship has resulted in extreme foreign policy vacillations – the next president could revoke the deal. Even after Putin is gone Russia would have to negotiate with the US to prevent the US from arming Ukraine. Hence Moscow may decide to reduce Ukraine and improve Russia’s strategic position by force of arms. This is true even if Biden forswears the NATO option, as Diagram 1 illustrates. Putin’s second demand – that the US not provide offensive weapon systems in countries adjacent to Russia – is more material. This is what the new round of talks will focus on. This new Ukraine line of talks is separate, more urgent and important, than the other bilateral dialogues on the arms race, and cyber-war. US-Russia talks on Iran are also urgent, however, and Russia’s cooperation there may be contingent on US concessions regarding Ukraine. The US may be willing to stop its defense cooperation with Ukraine but not with other allies and partners, however. It is also not clear what Putin will accept. These negotiations will have to be watched. Biden cannot make major concessions with a gun to his head. It is unclear how far the US is willing to concede on defense cooperation with countries around Russia. The US may quietly abandon Ukraine but then it would need to reinforce its other defense relationships. If Putin draws down the troops, and Biden calls a stop to defense aid to Ukraine, then a crisis may be averted. What Could Go Wrong? Economic sanctions under consideration in Washington are significant: the US could freeze bank transactions, expand restrictions on trading Russian sovereign and corporate debt, and lobby Belgium to kick Russia off the SWIFT financial messaging system. However, these sanctions may not be effective in preventing Russia from using military force. Russia has weathered US sanctions since 2014, and the smaller and weaker Iranian economy has weathered maximum pressure sanctions since 2019. Energy producers like Russia and Iran have maximum geopolitical leverage when global energy inventories draw down, as is the case today. Even in the face of Russian military aggression, the Biden administration is vacillating on sanctions targeting Russia’s energy sector that would contribute to global shortages and ultimately raise prices at the pump for voters in a midterm election year.5 Germany’s new government also hesitates to declare unambiguously that it will discontinue the Nord Stream II pipeline if Russia invades Ukraine. True, Germany signaled that the pipeline would be halted. Its energy regulator declared that the pipeline’s ownership must be unbundled, which pushes back the certification date to sometime after May 2022 – this was a geopolitical not a legalistic decision. But construction is completed, the pipeline physically exists, which will vitiate Germany’s commitment to sanctions whenever natural gas shortages occur, as is the case this winter (Chart 4). Shortages will continue to occur and Russia controls a large share of supply.
Chart 4
Chart 5
It would take a catastrophe to drive Germany to restart coal and nuclear plants, so natural gas will continue to be in demand. Germany does not have liquefied natural gas import capability yet. If Europe imposes crippling sanctions on Russia, Russia could reduce energy supplies and harm Europe’s economy (Chart 5). The Russian economy and society would suffer which is one reason any military action in Ukraine would be limited in scope. Still, Moscow may believe that Germany would restrain the EU, and the EU would restrain the US, thereby preventing sanctions from being fully, uniformly, and durably implemented. Prior to Russia’s aggression, public opinion polls showed that the German public strongly supported Nord Stream. Even a majority of Green Party members supported it despite the fact that the Greens were the most critical of increasing Germany’s dependency on fossil fuels and an authoritarian petro-state. While public approval of the pipeline has surely suffered in the face of Russian aggression, a majority probably still favors the pipeline. Germany has a national consensus in support of engagement with Russia and avoiding a new cold war, given that the original Cold War cut Germany in half. For that reason invasion may only temporarily unite the western powers – it could ultimately drive a wedge between Germany and other EU members, namely in the former Soviet bloc. It would also divide the more risk-averse EU from the US in terms of how to deal with Russia. And it would weaken the Biden administration at a time when it is extremely vulnerable, exacerbating America’s internal divisions. Russian domestic patriotism would rally, at least initially. Note that Russia could miscalculate on this issue and that is one reason for high level of risk. Perhaps the West would prove far more unified and aggressive in its sanctions enforcement than it was after 2014. A falling ruble and rising inflation could cause Russian social unrest. But Russia could misread the situation. Unless the US and Europe escalate the sanctions threat massively to better deter Russia, their lack of concert is another reason for investors not to be complacent about renewed conflict. Bottom Line: The threat of sanctions may prove insufficient to deter renewed Russian aggression against Ukraine. Germany favors engagement with Russia and Europe’s energy dependency on Russia makes it vulnerable to supply disruptions. Russia has leverage given tight global energy markets, Europe’s low natural gas inventories, and US domestic political considerations ahead of the 2022 midterms. Investment Takeaways The point of this report argues that a partial re-invasion of Ukraine cannot be ruled out. Russia has the capability to reinforce de facto control of Donbas, or expand its footprint in southern Ukraine, though not to invade the whole country. The threat of economic sanctions is not yet so overwhelming as to warrant overconfident predictions of de-escalation. In this case it is better to be alarmist than complacent. Russia would want to maintain an element of surprise so the timing of any belligerence is hard to predict. For de-escalation, investors should watch for Russia to withdraw troops from the Ukrainian border, US-Russia consultations to begin promptly and proceed regularly, and for the US and allies to delay or halt defense cooperation and arms transfers to Ukraine. While global investors would quickly become de-sensitized to conflict that is entirely contained in Ukraine, the trans-Atlantic threat of major sanctions now raises the stakes and suggests that global energy shocks could negatively affect the European or global economy in the event of conflict. Any conflict could also spill outside of Ukraine’s borders, as with Malaysian Airlines flight MH17, which was shot down by Russian-backed Ukrainian separatists in July 2014. The Black Sea has seen a dangerous uptick in naval saber-rattling and that strategic situation would become permanently more dangerous if Russia seized more of coastal Ukraine. Russian military integration with Belarus is also a source of insecurity for EU and NATO members. Global financial markets have only started to price the geopolitical risk emanating from Russia. Our Russian GeoRisk Indicator has ticked up (Chart 6). But Russian equity performance relative to broad emerging markets is only arguably underperforming what is implied by Brent crude oil prices. Chart 6Market Slow To React To Ukraine Crisis - Risk To Downside For Russian Assets
Market Slow To React To Ukraine Crisis - Risk To Downside For Russian Assets
Market Slow To React To Ukraine Crisis - Risk To Downside For Russian Assets
This relatively muted reaction suggests more downside lies ahead if we are right that strategic tensions will be flat-to-up over the coming months. Sell the RUB-USD on any strength. Stay long GBP-CZK. Tactically short Russian equities versus EM-ex-Asia (Chart 7). They are exposed to further correction as a result of escalating geopolitical risk. Chart 7Russia Falling Off Peaks Of Performance Versus EM-Ex-Asia
Russia Falling Off Peaks Of Performance Versus EM-Ex-Asia
Russia Falling Off Peaks Of Performance Versus EM-Ex-Asia
Chart 8Developed Europe A Safer Bet Than Emerging Europe Amid Tensions
Developed Europe A Safer Bet Than Emerging Europe Amid Tensions
Developed Europe A Safer Bet Than Emerging Europe Amid Tensions
Stick to long DM Europe versus EM Europe – our main trade this year to capture rising geopolitical risk between Russia and the West (Chart 8). Matt Gertken Vice President Geopolitical Strategy mattg@bcaresearch.com Footnotes 1 President of Russia, "Meeting with US President Joseph Biden," December 7, 2021, kremlin.ru. 2 White House, "Press Briefing by Press Secretary Jen Psaki and National Security Advisor Jake Sullivan, December 7, 2021," whitehouse.gov. 3 Dan Peleschuk, "Ukraine’s military poses a tougher challenge for Russia than in 2014," Politico, April 14, 2021, politico.eu.; see also Gav Don, "LONG READ: Russia looks poised to invade Ukraine, but what would an invasion actually look like?" Intellinews, November 24, 2021, intellinews.com. 4 US Department of State, "Joint Statement of the United States and Germany on Support for Ukraine, European Energy Security, and our Climate Goals," July 21, 2021, state.gov. 5 Kylie Atwood and Natasha Bertrand, "US likely to hold off for now on energy sanctions for Russia, fearing impact on global prices," CNN, December 9, 2021, cnn.com. Strategic Themes Open Tactical Positions (0-6 Months) Open Cyclical Recommendations (6-18 Months)

On this week's Week In Review, we are sending you a webcast that was recorded recently titled EM/China: An Unfinished Adjustment featuring Arthur Budaghyan, Chief Emerging Markets Strategist and Roukaya Ibrahim, Vice-President, Daily Insights. In…
Highlights The last two years have taught us to live with Covid-19. This means global growth will remain strong in 2022. That is not reflected in a strong dollar. The RMB will be a key arbiter between a bullish and bearish dollar view. This is because a weak RMB will be deflationary for many commodity currencies, especially if it reflects weak Chinese demand. Inflation in the US will remain stronger than in other countries. The key question is what the Federal Reserve does next year. In our view, they will stay patient which will keep real interest rates in the US very low. Upside in the DXY is nearing exhaustion according to most of our technical indicators. We upgraded our near-term target to 98. Over a longer horizon, we believe the DXY will break below 90, towards 85 in the next 12-18 months. A key theme for 2022 will be central bank convergence. Either inflation proves sticky and dovish central banks turn a tad more hawkish, or inflation subsides and aggressive rate hikes priced in some G10 OIS curves are revised a tad lower. The path for bond yields will naturally be critical. Lower bond yields will initially favor defensive currencies such as the DXY, CHF and JPY. This is appropriate positioning in the near-term. Further out in 2022, as bond yields rise, the Scandinavian currencies will be winners. Portfolio flows into US equities have been a key driver of the dollar rally. This has been because of the outperformance of technology. Should this change, equity flows could switch from friend to foe for the dollar. A green technology revolution is underway and this will benefit the currencies of countries that will supply these raw materials. The AUD could be a star in 2022 and beyond. The rise in cryptocurrencies will continue to face a natural gravitational pull from policy makers. Gold and silver will rise in 2022, but silver will outperform gold. Feature 2022 has spooky echoes of 2020. In December 2019, we were optimistic about the global growth outlook, positive on risk assets, and bearish the US dollar. That view was torpedoed in March 2020, when it became widely apparent that COVID-19 was a truly global epidemic. More specifically, the dollar DXY index (a proxy for safe-haven demand) rose to a high of 103. US Treasury yields fell to a low of 0.5%. Chart 1Covid-19 And The Dollar
Covid-19 And The Dollar
Covid-19 And The Dollar
Today, the DXY index is sitting at 96, exactly the midpoint of the March 2020 highs and the January 2021 lows. Once again, the dollar is discounting that the new Omicron strain will be malignant – worse than the Delta variant, but not as catastrophic as the original outbreak (Chart 1). Going into 2022, we are cautiously optimistic. First, we have two years of data on the virus and are learning to live with it. This suggests the panic of March 2020 will not be repeated. Second, policymakers are likely to stay very accommodative in the face of another exogenous shock. This will especially be the case for the Fed. Our near-term target for the DXY index is 98, given that the macro landscape remains fraught with risks. This is a speculative level based on exhaustion from our technical indicators (the dollar is overbought) and valuation models (the dollar is expensive). Beyond this level, if our scenario analysis plays out as expected, we believe the DXY index will break below 90 in 2022. Omicron And The Global Growth Picture Chart 2Global Growth And The Dollar
Global Growth And The Dollar
Global Growth And The Dollar
Our golden rule for trading the dollar is simple – sell the dollar if global growth will remain robust, and US growth will underperform its G10 counterparts. Historically, this rule has worked like clockwork. Using Bloomberg consensus growth estimates for 2022, US growth is slated to stay strong, but give way to other economies (Chart 2). News on the Omicron variant continues to be fluid. As we go to press, Pfizer suggests a third booster dose of its vaccine results in a 25-fold increase in the antibodies that attack the virus. Additionally, a new vaccine to combat the Omicron variant will be available by March. If this proves accurate, it suggests the world population essentially has protection against this new strain. The good news is that vaccinations are ramping up around the world, especially in emerging markets. Countries like the US and the UK were the first countries to see a majority of their population vaccinated. Now many developed and emerging market countries have a higher share of their population vaccinated compared to the US (Chart 3). Chart 3ARising Vaccinations Outside The US
Rising Vaccinations Outside The US
Rising Vaccinations Outside The US
Chart 3BRising Vaccinations Outside The US
Rising Vaccinations Outside The US
Rising Vaccinations Outside The US
This has resulted in a subtle shift – growth estimates for 2022 are increasingly favoring other countries relative to the US (Chart 4). Let us consider the case of Japan - just in June this year, ahead of the Olympics, only 25% of the population was vaccinated. Today, Japan has vaccinated 77% of its population and new daily infections are near record lows. While Omicron is a viable risk, the starting point for Japan is very encouraging and should open a window for a recovery in pent-up demand and a pickup in animal spirits. Chart 4ARising Growth Momentum Outside The US
Rising Growth Momentum Outside The US
Rising Growth Momentum Outside The US
Chart I-4
This template could very much apply to other countries as well. This view is not embedded in the dollar, which continues to price in an outperformance of US growth (Chart 5). The Risks From A China Slowdown China sits at the epicenter of a bullish and bearish dollar view. If Chinese growth is bottoming, then the historical relationship between the credit impulse and pro-cyclical currencies will hold (Chart 6). This will benefit the EUR, the AUD, the CAD and even the SEK which that track the Chinese credit impulse in real time. As an expression of this view, we went long the AUD at 70 cents. Chart 5Economic Surprises Outside The US
Economic Surprises Outside The Us
Economic Surprises Outside The Us
Chart 6Chinese Credit Demand And Currencies
Chinese Credit Demand And Currencies
Chinese Credit Demand And Currencies
Just as global policy makers are calibrating the risk from the Omicron variant, the Chinese authorities are also acknowledging the risk of an avalanche from a property slowdown. They have already eased monetary policy on this basis. Specific to the dollar, a key arbiter of a bullish or bearish view will be the Chinese RMB. So far, markets have judiciously separated the risk, judging that the Chinese authorities can surgically diffuse the real estate market, without broad-based repercussions in other parts of the economy (such as the export sector). Equities and corporate credit prices have collapsed in specific segments of the Chinese market but the RMB remains strong (Chart 7). Correspondingly, inflows into China remain very robust, a testament to the fact that Chinese growth (while slowing) remains well above that of many other countries (Chart 8). Chart 7The RMB Has Diverged From The Carnage In China
The RMB Has Diverged From The Carnage In China
The RMB Has Diverged From The Carnage In China
Chart 8Strong Portfolio Inflows Into China
Strong Portfolio Inflows Into China
Strong Portfolio Inflows Into China
China contributed 20% to global GDP in 2021 and will likely contribute a bigger share in 2022, according to the IMF (Chart 9). This suggests that foreign direct investment in China will remain strong . This will occur at a time when the authorities could have diffused the risk from a property market slowdown.
Chart I-9
The commodity-side of the equation will also be important to monitor, especially as it correlates strongly with developed-market commodity currencies. It is remarkable that despite the slowdown in Chinese real estate, commodity prices remain resilient (Chart 10). This has been due to adjustment on the supply side, as our colleagues in the Commodity & Energy Strategy team have been writing. Finally, China offers one of the best real rates in major economies. It also runs a current account surplus. This suggests there is natural demand and support for the RMB (Chart 11). A strong RMB limits how low developed-market commodity currencies can fall. Chart 10Commodity Prices Remain Well Bid
Commodity Prices Remain Well Bid
Commodity Prices Remain Well Bid
Chart 11Real Interest Rates Favor The RMB
Real Interest Rates Favour The RMB
Real Interest Rates Favour The RMB
Inflation And The Policy Response Output gaps are closing around the world as fiscal stimulus has helped plug the gap in aggregate demand. This suggests that while inflation has been boosted by idiosyncratic factors (supply bottlenecks) that could soon be resolved, rising aggregate demand will start to pose a serious problem to the inflation mandate of many central banks. Chart 12A Key Driver Of The Dollar Rally
A Key Driver Of The Dollar Rally
A Key Driver Of The Dollar Rally
As we wrote a few weeks ago, there have been consistencies and contradictions with the market response to higher inflation. The market is now pricing in that the Fed will raise interest rates much faster, compared to earlier this year. According to the overnight index swap (OIS) curve, the Fed is now expected to lift rates at least twice by December 2022, compared to earlier this year. Meanwhile, market pricing is even more aggressive when looking at the December 2022 Eurodollar contract, relative to either the Euribor contract (European equivalent) or Tibor (Japanese equivalent) (Chart 12). The reality is that outside the ECB and the BoJ, other central banks have actually been more proactive compared to the Federal Reserve. The Bank Of Canada has ended QE and will likely raise interest rates early next year, the Reserve Bank of New Zealand has ended QE and raised rates twice, and the Reserve Bank of Australia has already been tapering asset purchases. The Bank of England will also be ahead of the Fed in raising interest rates, according to our Global Fixed Income Strategy colleagues. This suggests that the pricing of a policy divergence between the Fed and other G10 central banks could be a miscalculation and a potential source of weakness for the dollar. Chart 13The US Is Generating Genuine Inflation
The US Is Generating Genuine Inflation
The US Is Generating Genuine Inflation
Rising inflation is a global phenomenon and not specific to the US (Chart 13). So either inflation subsides and the Fed turns a tad more accommodative, or inflation proves sticky and other central banks turn a tad more hawkish to defend their policy mandates. We have two key short-term trades penned on this view – long EUR/GBP and long AUD/NZD. While the European Central Bank will lag the Bank of England (and the Fed) in raising interest rates, expectations for the path of policy are too hawkish in the UK, with 4 rate hikes priced in by the end of 2022. Similarly, hawkish expectations for the Reserve Bank of New Zealand are likely to be revised lower, relative to the Reserve Bank of Australia. As for the US, the Fed is likely to hike interest rates next year but real rates will remain very low relative to history (Chart 14A and 14B). Low real rates will curb the appeal of US Treasuries. Chart 14AReal Interest Rates In The US Are Very Negative
Real Interest Rates In The US Are Very Negative
Real Interest Rates In The US Are Very Negative
Chart I-14
The Dollar And The Equity Market Chart 15The US Stock Market And The Dollar
The US Stock Market And The Dollar
The US Stock Market And The Dollar
One of the biggest drivers of a strong dollar this year (aside from rising interest rate expectations), has been equity inflows. The greenback tends to do well when US bourses are outperforming their overseas peers (Chart 15). It is also the case that value tends to underperform growth in an environment where the dollar is rising. We discussed this topic in depth in our special report last summer. Flows tend to gravitate to capital markets with the highest expected returns. So if investors expect the pandemic winners (technology and healthcare) to keep driving the market in an Omicron setting, the US bourses that are overweight these sectors will do well. We will err on the other side of this trade for 2022. Part of that is based on our analysis of the global growth picture in the first section of this report. If growth rotates from the US to other economies, their bourses should do well as profits in these economies recover. Earnings revisions in the US have been sharply revised lower compared to other countries (Chart 16). This has usually led to a lower dollar eventually. In the case of the euro area, there has been a strong and consistent relationship between relative earnings revisions vis-à-vis the US, and the performance of the euro (Chart 17). Chart 16Earnings Revisions Are Moving Against US Companies
Earnings Revisions Are Moving Against US Companies
Earnings Revisions Are Moving Against US Companies
Chart 17Earnings Revisions Are Moving In Favor Of Euro Area Companies
Earnings Revisions Are Moving In Favor Of Euro Area Companies
Earnings Revisions Are Moving In Favor Of Euro Area Companies
In a nutshell, should profits in cyclical sectors recover on the back of rising bond yields, strong commodity prices and a tentative bottoming in the Chinese economy, value sectors that are heavily concentrated in countries with more cyclical currencies such as Australia, Norway, Sweden, and Canada, will benefit. Ditto for their currencies. The Outlook For Petrocurrencies
Chart I-18
When the pandemic first hit in 2020, oil prices (specifically the Western Texas Intermediate blend) went negative. This drop pushed the Canadian dollar towards 68 cents and USD/NOK punched above 12. This time around, the drop in oil prices (20% from the peak for the Brent blend) has been more muted. We think this sanguine market reaction is more appropiate in our view for two key reasons. First, as our colleagues in the Commodity & Energy Stategy team have highlighted, investment in the resource sector, specifically oil and gas, has been anemic in recent years. In Canada, investment in the oil and gas sector has dropped 68% since 2014 at the same time as energy companies are becoming more and more compliant vis-à-vis climate change (Chart 18). Second, if we are right, and Omicron proves to be a red herring, then transportation demand (the biggest source of oil demand) will keep recovering. In terms of currencies, our preference is to be long a petrocurrency basket relative to oil consumers. As the US is the biggest oil producer in the world (Chart 19), being long petrocurriences versus the dollar has diverged from its historical positive relationship with oil prices. Chart 20 shows that a currency basket of oil producers versus consumers has had both a strong positive correlation with oil prices and has outperformed a traditional petrocurrency basket. Chart 19The US Is Now A Major Oil Producer
The US Is Now A Major Oil Producer
The US Is Now A Major Oil Producer
Chart 20Hold A Basket Of Oil Consumers Versus Producers
Hold A Basket Of Oil Consumers Versus Producers
Hold A Basket Of Oil Consumers Versus Producers
Technical And Valuation Indicators The dollar tends to be a momentum-driven currency. Past strength begets further strength. We modelled this when we published our FX Trading Model, which showed that a momentum strategy outperformed over time (Chart 21). The problem with momentum is that it works until it does not. Net speculative long positions in the dollar are approaching levels that have historically signaled exhaustion (Chart 22). There is a dearth of dollar bears in today’s environment. That is positive from a contrarian standpoint. Meanwhile, our capitulation index (a measure of how overbought or oversold the dollar is) is approaching peak levels. Chart 21The Dollar Is A Momentum Currency
The Dollar Is A Momentum Currency
The Dollar Is A Momentum Currency
Chart 22Long Dollar Is A Consensus Trade
Long Dollar Is A Consensus Trade
Long Dollar Is A Consensus Trade
Valuation is another headwind for the dollar. According to all of our in-house models, the dollar is expensive. That is the case according to both our in-house curated PPP model (Chart 23) and a simple one based on headline consumer prices (Chart 24).
Chart I-23
Chart 24The Dollar is Expensive
The Dollar is Expensive
The Dollar is Expensive
In a broader sense, we have built an attractiveness ranking for currencies (Chart 25). This ranks G10 currencies on a swathe of measures, including their basic balances, our internal valuation models, sentiment measures, economic divergences, and external vulnerability. The ranking is in order of preference, with a lower score suggesting the currency is sitting in the top/most attractive quartile of the measures. The Norwegian krone and Swedish krona are especially attractive as 2022 plays.
Chart I-25
More specifically, the Scandinavian currencies have been one of the hardest hit this year. The Norwegian krone will benefit from the reopening of economies, particularly through the rising terms-of-trade. The Swedish krona will benefit from a pickup in the industrial sector, and continued strength in global trade. The least attractive G10 currencies are the New Zealand dollar and the greenback. This is mostly due to valuation. As we have highlighted in previous reports, valuation is a poor timing tool in the short term but over a longer-term horizon, currencies tend to revert towards fair value. Where Next For EUR/USD? Our bias is that the euro has bottomed. The ECB will lag the Fed in raising interest rates, but the spread between German bund yields and US Treasuries does not justify the current level of the euro. More importantly, if European growth recovers next year, this will sustain portfolio flows into the eurozone, which are cratering (Chart 26). Our 2022 target for EUR/USD is 1.25, a level that will unwind 10.6% of the undervaluation versus the dollar. Beyond valuation,s a few key factors support the euro: As a pioneer in green energy and a pro-cyclical currency, the euro will benefit from portfolio flows into renewable energy companies, as well as foreign direct investment. A close proxy for these flows are copper prices, that have positively diverged from the performance of the euro (Chart 27). Chart 26The Euro And Portfolio Flows
The Euro And Portfolio Flows
The Euro And Portfolio Flows
Chart 27EUR/USD And Copper
EUR/USD And Copper
EUR/USD And Copper
Inflation in the euro area is lagging the US, but is undeniably strong. As such, while the ECB will lag the Fed in tightening monetary policy, the divergence in monetary policy will not widen. Earnings revisions are moving in favor of European companies, as we have shown earlier. Historically, this has put a floor under the euro. Safe-Haven Demand: Long JPY Safe-haven currencies will perform well in the near term. We are long the yen, which is the cheapest currency according to our models and also one of the most shorted. CHF will also do well in the near term, though as we have argued, will induce more intervention from the Swiss National Bank.
Chart I-28
We are long both the yen and CHF/NZD as short-term trades, but our preference is for the yen. First, Japan has one of the highest real rates in the developed world. So, outflows from JGBs are going to be curtailed. Second, the DXY and USD/JPY have a strong positive correlation, and this places the yen in a very enviable position as the dollar weakens in 2022 (Chart 28). A Final Word On Gold, Silver, And Precious Metals Chart 29Hold Some Gold
Hold Some Gold
Hold Some Gold
Along with our commodity strategists, we remain bullish precious metals. In our view, inflation could prove stickier than most investors expect. This will depress real rates and support precious metals. Within the precious metals sphere, we particularly like silver and platinum. Almost every major economy now has negative real interest rates. Gold (and silver) have a long-standing relationship with negative interest rates (Chart 29). Central banks are also becoming net purchasers of gold, which is bullish for demand. The true precious metals winner in 2022 could be silver. The Gold/Silver ratio (GSR) tends to track the US dollar quite closely, so a bearish view on the dollar can be expressed by being short the GSR (Chart 30). Second, gold is very expensive compared to silver (Chart 31). In general, when gold tends to make new highs (as it did in 2020), silver tends to follow suit. This means silver prices could double from current levels over the next few years, to reclaim their 2011 highs. Finally, the bullish case for platinum is the same as for silver. It has lagged both gold and palladium prices. Meanwhile, breakthroughs are being made in substituting palladium for platinum in gasoline catalytic converters. Chart 30Hold Some Silver
Hold Some Silver
Hold Some Silver
Chart 31Stay Short The GSR
Stay Short The GSR
Stay Short The GSR
Concluding Thoughts Our currency positions, as we enter 2022, are biased towards a lower dollar, but we also acknowledge that there are key risks to the view. Our recommendations are as follows: The DXY will could touch 98 in the near term, but will break below 90 over the next 12-18 months. An attractiveness ranking reveals the most appealing currencies are JPY, SEK, and NOK, while the least attractive are USD and NZD. Chart 32Hold Some AUD
Hold Some AUD
Hold Some AUD
Policy convergence will be a key theme at the onset of 2022. Stay long EUR/GBP and AUD/NZD as a play on this theme. Look to buy a basket of oil producers versus consumers once volatility subsides. We went long the AUD at 70 cents. Terms of trade are likely to remain a tailwind for the Australian dollar (Chart 32). The AUD will benefit specifically in a green revolution. Chester Ntonifor Foreign Exchange Strategist chestern@bcaresearch.com Trades & Forecasts Strategic View Cyclical Holdings (6-18 months) Tactical Holdings (0-6 months) Limit Orders Forecast Summary
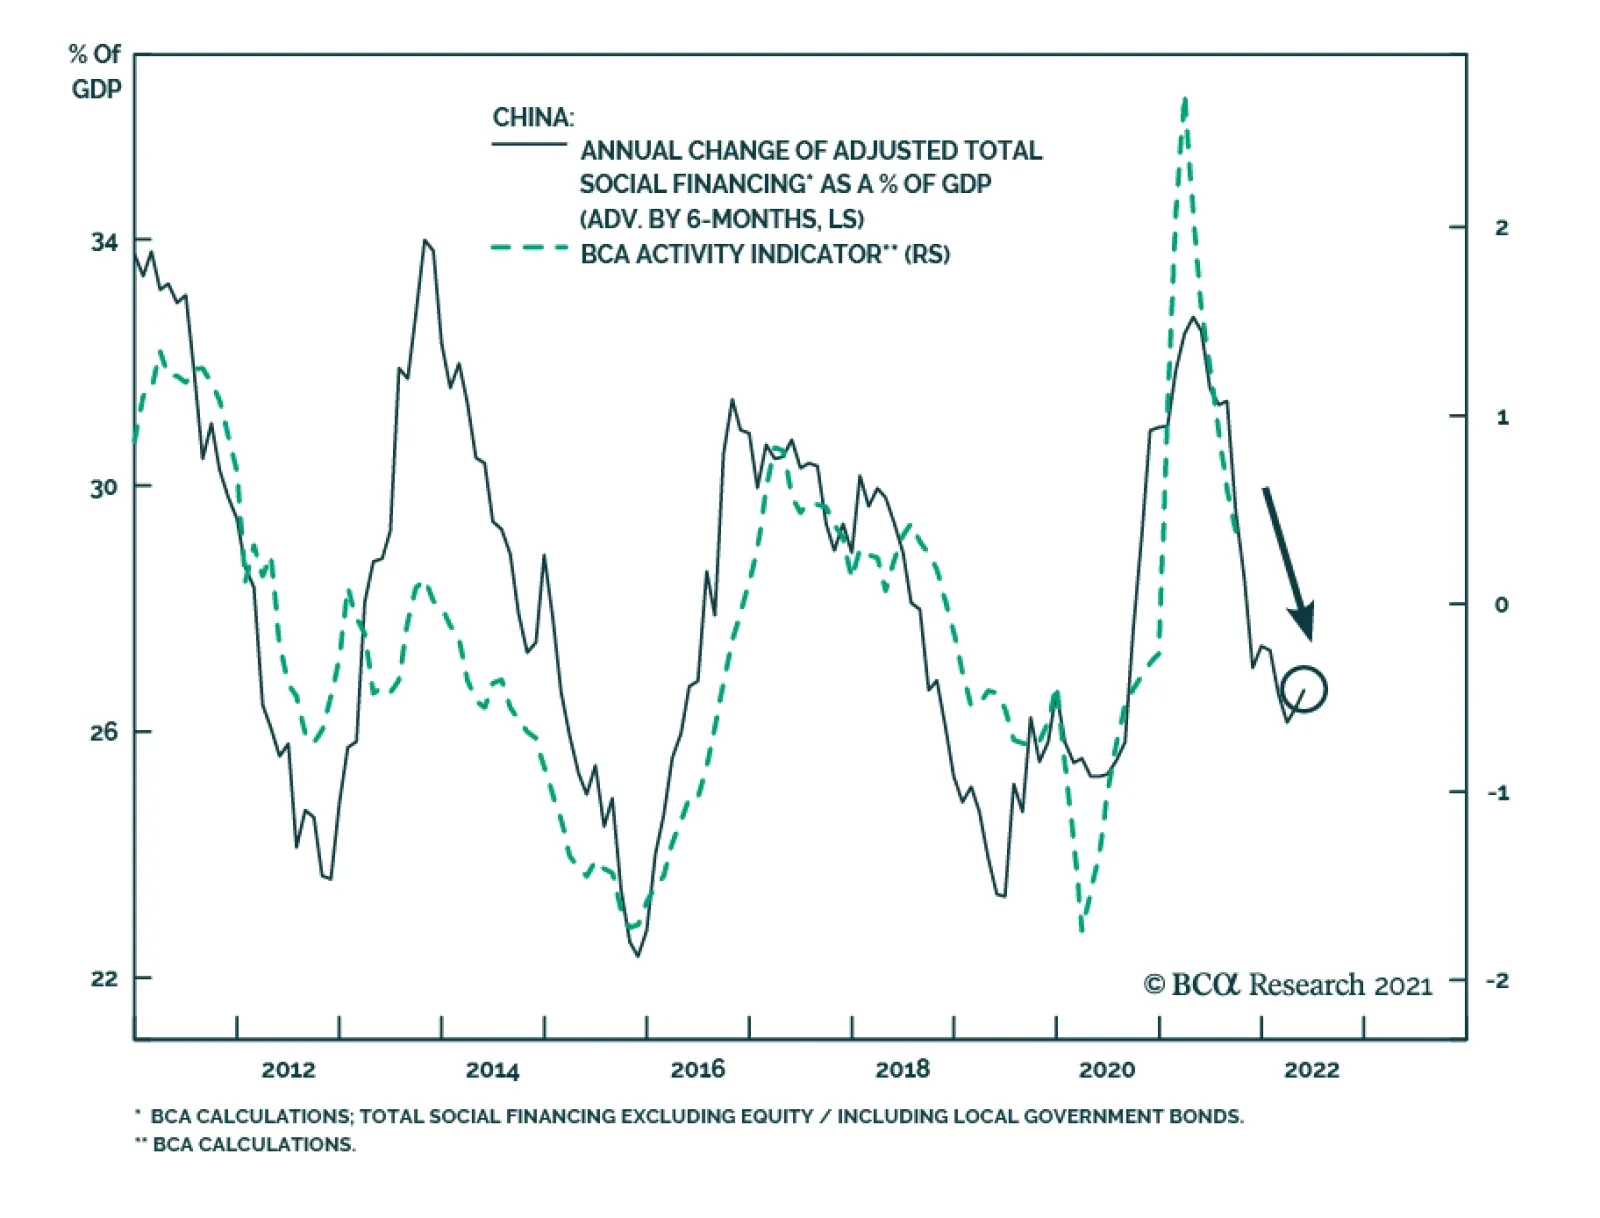
Although China’s credit data improved in November, it fell below expectations. Aggregate financing increased from CNY 1.6 trillion to CNY 2.6 trillion, slightly below the anticipated CNY 2.7 trillion. Although new yuan loans rose to CNY 1.3 trillion, they…