Emerging Markets
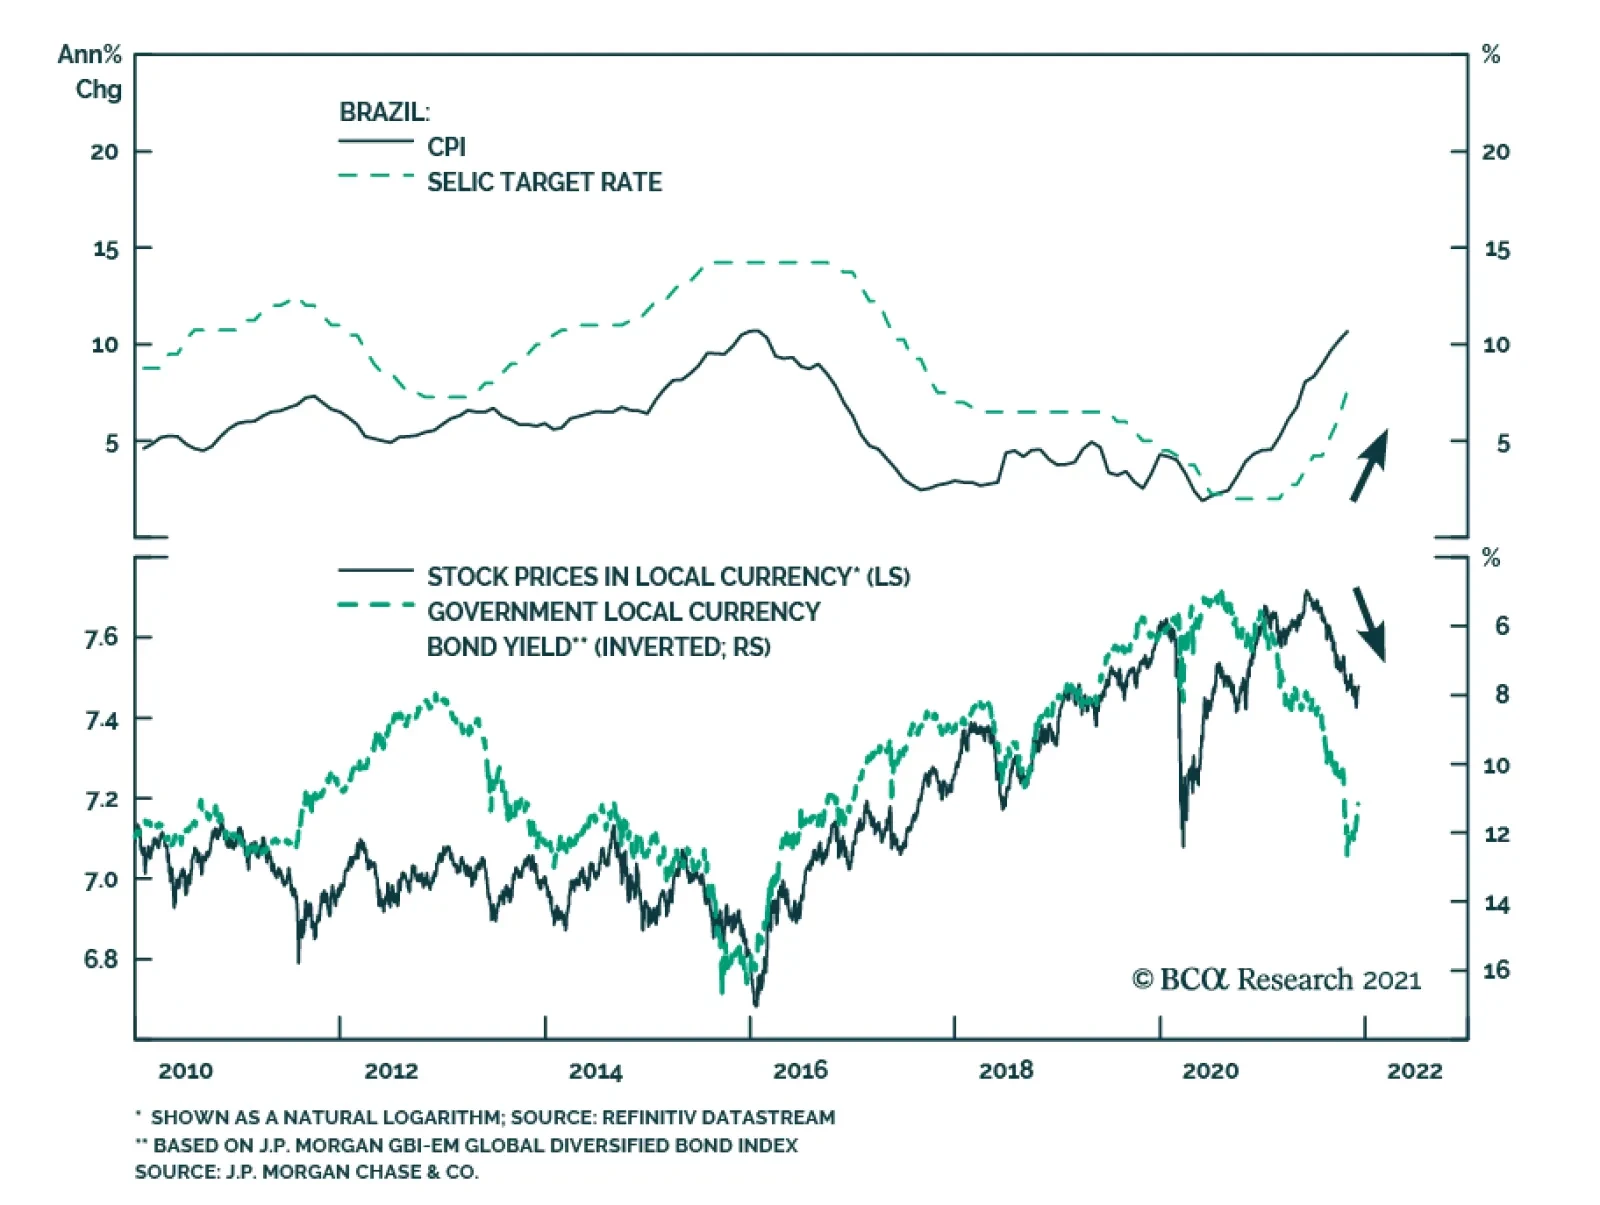
As expected, Brazil’s Central Bank lifted the benchmark Selic rate by 150 bps to 9.25% on Wednesday. This move brings the total increase since the beginning of the year to 725 bps. Policymakers also signaled that another rate hike is likely at its next policy…
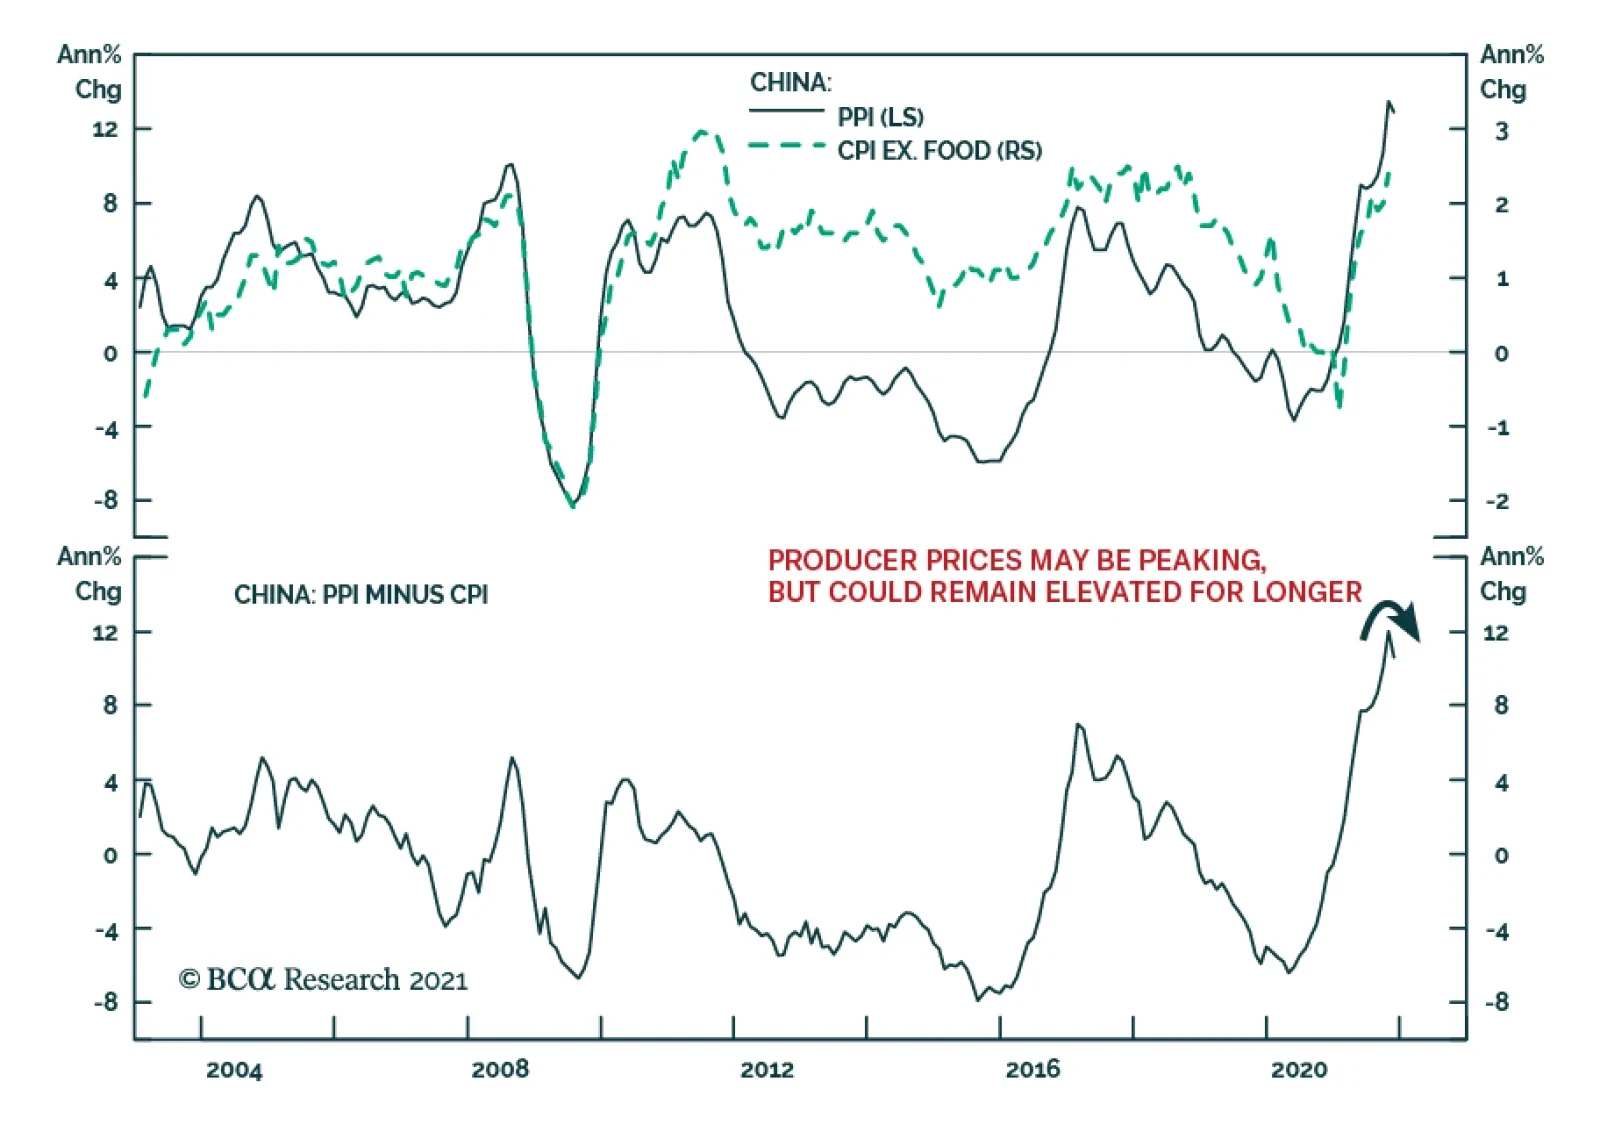
The gap between Chinese producer and consumer price inflation narrowed in November. PPI growth slowed from 13.5% to 12.9% while consumer price inflation accelerated to 2.3% from 1.5%. The moderation in producer prices reflects lower commodity prices amid…
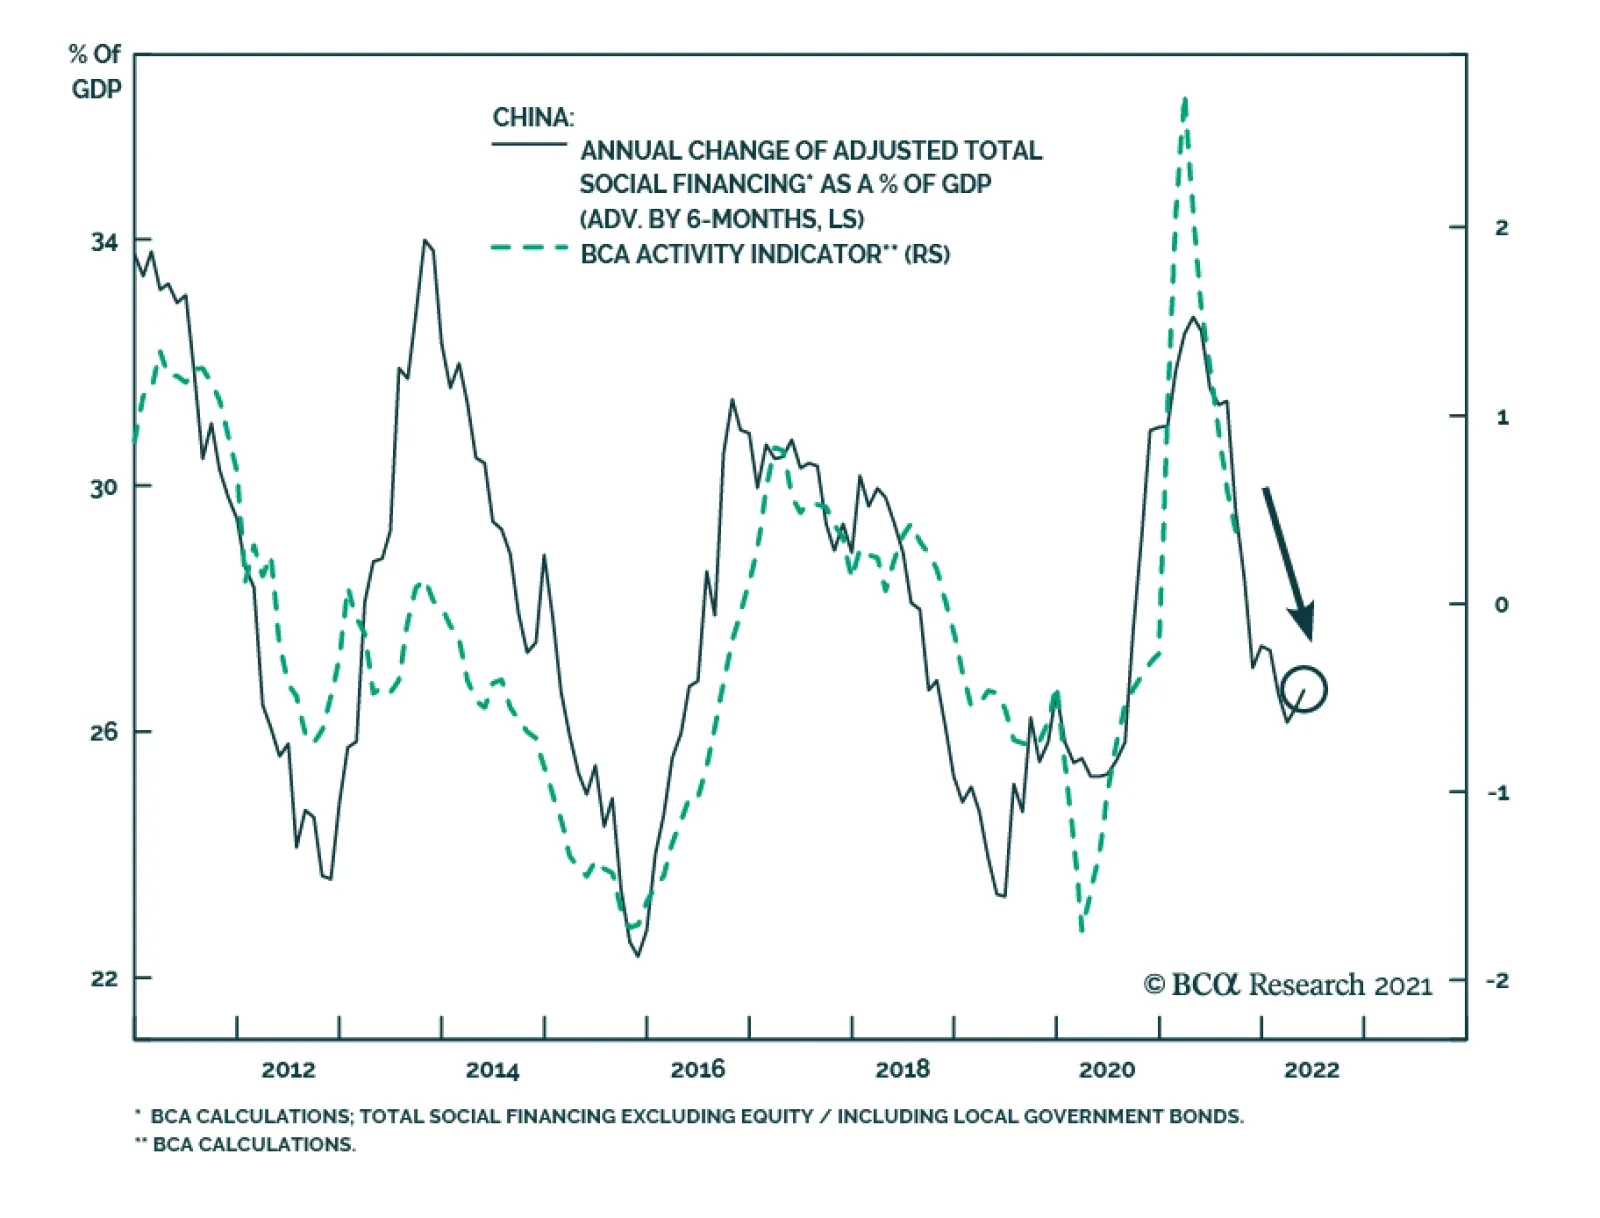
Although China’s credit data improved in November, it fell below expectations. Aggregate financing increased from CNY 1.6 trillion to CNY 2.6 trillion, slightly below the anticipated CNY 2.7 trillion. Although new yuan loans rose to CNY 1.3 trillion, they…

Dear Clients, Next week, in addition to sending you the China Macro And Market Review, we will be presenting our 2022 outlook on China at our last webcasts of the year “China 2021 Key Views: A Challenging Balancing Act”. The webcasts will be held Wednesday, December 15 at 10:00 am EDT (English) and Thursday, December 16 at 9:00 am HKT (Mandarin). Best regards, Jing Sima China Strategist Highlights China’s policymakers are balancing between staying the course with structural reforms and stabilizing the economy. This carefully calibrated approach means that Beijing will only initiate piecemeal policy easing in the near term. China will ramp up investment in the new economy, which is too small to fully offset the drag on the aggregate economy from weakening old economy sectors. In the next three to six months, the economy will deteriorate further, but Beijing will only press the stimulus accelerator harder if their pressure points are breached. A zero-tolerance policy towards COVID will be maintained for the foreseeable future. Uncertainties surrounding the Omicron variant will reinforce this approach. The common prosperity policy initiative will likely accelerate ahead of the 20th National Congress of the Chinese Communist Party (NCCCP) in the fall of 2022. While the plan will ultimately benefit income and consumption for the majority of Chinese households, the uncertainties surrounding impending tax reforms will curb demand for housing and luxury goods in the short term. We remain underweight Chinese stocks. Prices for onshore stocks will likely fall in the next three to six months when the market starts to price in lower-than-expected economic growth and disappointing stimulus. Selloffs in the first half of 2022 may present an opportunity to turn positive on onshore stocks in absolute terms. We will turn bullish on Chinese stocks relative to global equities only when credit expansion overshoots weakness in the economy, which has a low likelihood. We continue to favor onshore stocks versus offshore within a Chinese equity portfolio. Tensions between the US and China may intensify leading up to the political events next year. Chinese offshore stocks, highly concentrated in internet companies, still face the risks of being caught in both geopolitical crossfires and domestic regulatory pressures. Feature China’s economy slowed significantly in 2H21, with the extent of policy tightening and magnitude of the decline in growth much larger than global investors expected. As we forecasted in our last year’s Key Views report, 2021 marked the beginning of a new era in which policymakers would switch gears from building a "moderately prosperous society" to becoming a "great modern socialist nation”.The pivot means that officials would tolerate slower economic growth, implement tougher financial and industry regulations, and accelerate structural reforms. On the cusp of 2022, we are cautious about the willingness of China’s top leadership to initiate large-scale policy easing. Even though policy tone has shifted to a more pro-growth bias, authorities are still trying to replace old economic drivers with the new economy sectors. Furthermore, they are struggling to maintain a delicate balance between boosting short-term growth and maintaining long-term reforms goals. As a result, their policies are sending mixed signals. As seen in 2018 and 2019, the policymakers’ reluctance to activate a full-scale stimulus does not bode well for global commodity prices. Chinese onshore stocks underperformed their global counterparts during the 2018-19 period. Chinese stocks will face nontrivial headwinds in the coming months and warrant a cautious stance until more stimulus is introduced and the macro picture begins to meaningfully improve. The main themes in our outlook for 2022 are discussed below. Key View #1: Balancing Between The Old And New Economies Despite a recent pro-growth bias in the policy tone, the speed of easing has been incremental and the magnitude piecemeal. Moreover, authorities are telegraphing policy support in new economy sectors (such as high tech and clean energy), while only somewhat loosening restrictions in old economy sectors (mainly property and infrastructure). Chart 1Current Easing Path Is Looking A Lot Like In 2018/19
Current Easing Path Is Looking A Lot Like In 2018/19
Current Easing Path Is Looking A Lot Like In 2018/19
China’s policy framework has shifted since late 2017 as we noted in previous reports. The top leadership is more determined to stay the course with reforms and tolerate slower growth in the old economy. Our BCA Li Keqiang Leading Indicator highlights policymakers’ carefully calibrated policy actions to avoid a dramatic overshoot of credit growth; these actions are consistent with 2018/19 and starkly contrast with policy frameworks in 2012 and 2015. Monetary conditions have meaningfully eased, but the rebound in money supply and credit growth has lagged and is muted due to heightened regulatory oversight (Chart 1). Investors should keep low expectations about the policymakers’ willingness to boost growth in old economy sectors. The easing of restrictions in property sector – from prompting banks to resume lending to qualified homebuyers and developers, to allowing funding for developers to acquire distressed real estate assets – are steps to alleviate an escalating risk of widespread bankruptcies among real estate developers. However, regulators have not changed the direction of their structural policies. Funding constraints placed on both developers and banks since last August remain intact. Banks still need to meet the “two red lines” that set the upper limit on the portion of their lending to the property sector, while developers must bring their leverage ratios below the “three red lines” by end-2023. Maintaining these binding constraints on developers and banks will continue to weigh on the housing market in the coming years. The recent easing may reduce the intensity of funding constraints, but the banks will be extremely cautious to extend lending to a broad range of developers. Aggressive crackdowns on property market speculation in the past 12 months has fundamentally shifted both developers’ and consumers’ expectations for future home prices. Growth in home sales and new projects dropped to their 2015 lows, while current real estate inventories are comparable to 2015 highs (Chart 2). Therefore, unless regulators are willing to initiate more aggressive policy boosts, such as cutting mortgage rates and/or providing government funds to monetize inventory excesses in the housing market, the current easing measures probably will not revive sentiment in the property market. Thus, odds are that the property market downtrend will extend through 2022 (Chart 3). Chart 2Downward Momentum In Property Market Comparable To 2015
Downward Momentum In Property Market Comparable To 2015
Downward Momentum In Property Market Comparable To 2015
Chart 3Policymakers Will Have To Allow Significant Re-leveraging To Revive The Market
Policymakers Will Have To Allow Significant Re-leveraging To Revive The Market
Policymakers Will Have To Allow Significant Re-leveraging To Revive The Market
Chart 4Key Indicators Show Weak Signs Of Revival In Infrastructure Spending
Key Indicators Show Weak Signs Of Revival In Infrastructure Spending
Key Indicators Show Weak Signs Of Revival In Infrastructure Spending
We expect some modest increase in infrastructure spending next year from the meager 0.7% growth in 2021, but we are skeptical that policymakers will allow any substantial rebound. Shadow banking activity and infrastructure project approval, two key indicators we monitor for signs of a meaningful easing in infrastructure spending, show little improvement (Chart 4). Our outlook for infrastructure investment is based on the following: Since 2017 policymakers have assumed a much more hawkish approach toward reducing investment in the capital-intensive and unproductive old economic sectors. Next year’s 20th NCCCP will not fundamentally change this policy setting. The 19th NCCCP in late 2017 deviated from the past; infrastructure investment growth downshifted following the event, whereas significant spending boosts had followed previous NCCCPs (Chart 5). Beijing adhered to its structural downshift in infrastructure spending even during the 2018/19 US-China trade war and after last year’s pandemic-induced economic contraction. Chart 5Infrastructure Investment Shifted To A Lower Gear Following The 19th NCCCP
Infrastructure Investment Shifted To A Lower Gear Following The 19th NCCCP
Infrastructure Investment Shifted To A Lower Gear Following The 19th NCCCP
Chart 6
Secondly, government spending since 2017 has tilted towards social welfare over building “bridges to nowhere”, a meaningful change from the past and in keeping with President Xi Jinping’s political priorities (Chart 6). The trend will likely continue next year because local governments need to maintain large social welfare budgets to counter the economic impact of the prolonged domestic battle against COVID. Local government revenues, on the other hand, will be reduced due to slumping land sales. Thirdly, there has been strong policy guidance by the central government to shift investment to the new economy sectors and away from traditional infrastructure projects. The PBoC in early November launched the carbon emission reduction facility (CERF) to offer low interest loans to financial institutions that help firms cut carbon emissions.
Chart 7
China’s new economy sectors have experienced rapid growth in recent years, but in the short-term, infrastructure spending in those sectors will not fully offset a reduction in traditional infrastructure (Chart 7). The combined spending in tech infrastructure (including information transmission such as 5G technology and services) and green energy stood at RMB1.6 trillion last year, compared with the RMB19 trillion investment in traditional infrastructure and RMB14 trillion in the real estate sector. Bottom Line: Beijing will continue to push for investment in new economy sectors since the leadership is determined to reduce dependency on unproductive segments of the economy. Even as the economy slows, they will be reluctant to ramp up leverage and channel capital to the old economy sectors. Unfortunately, the small size of the new economy’s sectors versus the old economy will inhibit their ability to stabilize and accelerate economic growth via these policies. Key View #2: The Pressure Points We do not think Beijing will allow the economy to freefall past the “point of no return”. The economy still needs to grow by 4.5-5.0% per annum between 2021 and 2035 to achieve the target of doubling GDP by 2035 (Chart 8A and 8B). Chart 8AThe Structural Downshift In Chinese Growth Will Continue…
The Structural Downshift In Chinese Growth Will Continue…
The Structural Downshift In Chinese Growth Will Continue…
Chart 8B...But A 5%+/- Rate Of Growth Will Keep China Well On Track Of Doubling Its GDP By 2035
...But A 5%+/- Rate Of Growth Will Keep China Well On Track Of Doubling Its GDP By 2035
...But A 5%+/- Rate Of Growth Will Keep China Well On Track Of Doubling Its GDP By 2035
Investors should watch the following pressure points to assess whether China’s leaders will feel the urgency to turn policy to outright reflationary: A collapse in onshore financial market prices. China’s economic fundamentals will weaken further in the next three to six months and the risks to Chinese equity prices are on the downside. However, the odds are still low that the onshore equity, bond and currency markets will plunge as in 2015. Onshore stocks are cheaper than during the height of their 2015 boom-bust cycle, margin trading remains well below its 2015 level and economic fundamentals are stronger (Chart 9). Selloffs by global investors in China’s offshore equity and high-yield bond markets have not triggered much panic in the onshore markets and, therefore, will not drive Beijing to change its macro policy (Chart 10). Chart 9Valuations In Chinese Stocks Are Not As Extreme As In 2015
Valuations In Chinese Stocks Are Not As Extreme As In 2015
Valuations In Chinese Stocks Are Not As Extreme As In 2015
Chart 10Onshore Markets Have Been Relatively Calm
Onshore Markets Have Been Relatively Calm
Onshore Markets Have Been Relatively Calm
Chart 11China/US Growth Rates In 2022 Will Be Uncomfortably Close, Based On IMF Forecasts
China/US Growth Rates In 2022 Will Be Uncomfortably Close, Based On IMF Forecasts
China/US Growth Rates In 2022 Will Be Uncomfortably Close, Based On IMF Forecasts
Narrowing growth differentials between China and the US. In the IMF’s October World Economic Outlook, economic growth in 2022 for China and the US is projected at 5.6% and 5.2%, respectively. The forecast suggests that next year the growth differential between the two largest economies will be narrowed to less than one percentage point, rarely seen in China’s post-reform history (Chart 11). Notably, the most recent Bloomberg consensus estimate for the 2022 US real GDP growth is much lower at 3.9%, whereas China is expected to grow by 5.3% and in line with the IMF forecast. We do not suggest that Beijing will make its policy decisions based on these growth projections. Rather, we expect that if China’s growth in 1H22 falls behind that in the US, Chinese policymakers will feel an urgency to stimulate the economy and show a better economic scorecard ahead of the all-important 20th NCCCP next fall. Rising unemployment. Current data shows a mixed picture. Unemployment rates have been falling in all age groups (Chart 12). Demand for labor in urban areas, on the other hand, has been shrinking (Chart 13). The employment subindex in China’s service PMIs has also been dropping. Our view is that the resilient export/manufacturing sector has provided strong support to employment this year, while the labor supply in urban areas has been sluggish due to tighter travel restrictions and frequent regional lockdowns. The combination of strong manufacturing demand for labor and a lack of supply has reduced excesses in the labor market and the urgency to stimulate the economy (Chart 13, bottom panels). However, the picture could change if China’s exports start to slow into next year. Chart 12China's Unemployment Rate Is Falling...
China's Unemployment Rate Is Falling...
China's Unemployment Rate Is Falling...
Chart 13...But Demand For Labor Is Also Falling
...But Demand For Labor Is Also Falling
...But Demand For Labor Is Also Falling
Bottom Line: In the coming year, investors should watch for three pressure points that may trigger more forceful growth-supporting actions from policymakers: the onshore financial markets, economic growth differentials between the US and China, and labor market dynamics. Key View #3: The Exit Strategy Chart 14Service Sector Activities Have Been Restricted By Domestic Covid Cases And Frequent Lockdowns
Service Sector Activities Have Been Restricted By Domestic Covid Cases And Frequent Lockdowns
Service Sector Activities Have Been Restricted By Domestic Covid Cases And Frequent Lockdowns
China will not completely lift its zero-tolerance policy toward COVID in the coming year. We will likely see tightened domestic preventive measures leading to the Beijing Olympics in February and the NCCCP in October. The zero-tolerance policy cannot be sustained in the long run; China’s stringent counter-COVID measures have created a stop-and-go pattern in China’s service sector, which has taken a toll on household consumption (Chart 14). As such, Chinese policymakers will face a trade-off between hefty economic costs from its current counter-COVID measures, and the potential social costs and risks if there is a dramatic increase in domestic COVID cases. China is estimated to have fully vaccinated more than 80% of its citizens and is close to launching its own mRNA vaccine next year to be used as a booster shot. However, the inoculation rate will likely matter less to Beijing’s decision to relax its draconian approach towards COVID given the emergence of the virulent Omicron variant. Recent statement by China's top respiratory experts suggests that China will return to normalcy if fatality rate of COVID-19 drops to around 0.1%, and when R0 (the virus reproduction ratio) sits between 1 and 1.5. A more important factor that could influence Beijing’s decision is the development and effectiveness of anti-viral drug treatments. Pfizer recently announced that its anti-viral oral drug Paxlovid can reduce the hospitalization and death rates by 89% if taken within three days of the onset of symptoms. The drug-maker has announced its intention to produce enough of the medication to treat 50 million people in 2022. China’s Tsinghua University has also developed an antibody combination drug that may reduce hospitalization and mortality by 78% and is expected to be approved by Chinese regulators within this year. Beijing’s decision to abandon its zero-tolerance policy, therefore, will be based on the combined effectiveness of both vaccines and treatments. If clinical trials prove that the new antiviral drugs are effective in treating COVID patients, combined with China’s aggressive rollout of booster shots, then Beijing may incrementally relax its COVID containment measures by late 2022 or early 2023. Bottom Line: China will not loosen its zero-tolerance policy until a combination of vaccines and treatments proves to be effective against COVID. Key View #4: Common Prosperity Will Gather Steam We expect the notion of common prosperity espoused by President Xi Jinping to gain momentum ahead of the 20th NCCCP. Beijing will likely roll out measures to support consumption, particularly for low-income households. At the same time, there is a high possibility that policymakers will introduce taxes on luxury goods and accelerate the legislative process on real estate taxes. Chart 15The Slump In Property Market Will Likely Be An Extended One
The Slump In Property Market Will Likely Be An Extended One
The Slump In Property Market Will Likely Be An Extended One
The property market will remain in a limbo in 2022. In the near term, potential homebuyers will likely maintain their wait-and-see attitude before details of real estate taxes are disclosed. Home sales will remain in contraction despite improved mortgage lending conditions (Chart 15). Consumption taxes are expected to increase, targeting consumer discretionary and/or luxury goods. Chinese consumption of luxury goods benefited from government pro-growth measures last year, flush liquidity in the market and global travel restrictions. Meanwhile, growth in aggregate household income and consumption has been lackluster. President Xi Jinping’s common prosperity policy initiative is intended to narrow the income and wealth gap between the rich and poor. Moreover, empirical studies show that the marginal propensity to consume among lower- and middle-income groups, which account for more than 80% of China’s total population, is significantly higher than that of high-income groups. We expect more support for lower income groups as Beijing looks to stabilize the economy and narrow the wealth gap. Bottom Line: There is a high probability that policymakers will introduce taxes on the consumption of luxury goods and initiate the legislative process on real estate taxes in the next 12 months. Investment Conclusions Chinese stocks in both the onshore and offshore markets have cheapened relative to global equities. However, in absolute terms onshore stocks are not unduly cheap and offshore stocks are cheap for a reason (Chart 16). We remain defensive in our investment strategy for Chinese stocks in the next two quarters, given the headwinds facing the onshore and offshore markets. We do not rule out the possibility that China’s authorities will stimulate more forcefully in the next 12 months. However, for Chinese policymakers to ramp up leverage again, the near-term dynamics in the country’s economic cycle will have to significantly worsen. Chinese stocks will sell off in this scenario, but the selloff will provide investors with a good buying opportunity in the expectation of a more decisive stimulus (Chart 17). Chart 16Chinese Onshore Stocks Are Not Particularly Cheap, While Offshore Stocks Are Cheap For A Reason
Chinese Onshore Stocks Are Not Particularly Cheap, While Offshore Stocks Are Cheap For A Reason
Chinese Onshore Stocks Are Not Particularly Cheap, While Offshore Stocks Are Cheap For A Reason
Chart 17Selloff Risks Are High Before The Economy Stabilizes
Selloff Risks Are High Before The Economy Stabilizes
Selloff Risks Are High Before The Economy Stabilizes
Chart 18A Deja Vu Of 2018-2019?
A Deja Vu Of 2018-2019?
A Deja Vu Of 2018-2019?
If the economy slows in an orderly and gradual manner, then there is a slim chance that policymakers will allow an overshoot in stimulus. The Politburo meeting on Monday sent a stronger pro-growth message, the PBoC cut the reserve requirement ratio (RRR) rate by 50bps, and regulators will likely allow a front-loading of local government special-purpose bonds in Q1 next year. However, based on the lessons learned in 2019, regulators can be quick to scale back policy support if they see there is a risk of overshooting in credit expansion (Chart 18). The measured stimulus during the 2018-2019 period did not bode well for Chinese stocks or global commodity prices (Chart 19A and 19B). Meanwhile, we do not think the recent selloff in offshore stocks provided good buying opportunities. In the next 6 to 12 months, any tactical rebound in Chinese investable stocks will present a good selling point. Chart 19AChina's Measured Stimulus In 2018-2019 Did Not Bode Well For Global Commodity Prices
China's Measured Stimulus In 2018-2019 Did Not Bode Well For Global Commodity Prices
China's Measured Stimulus In 2018-2019 Did Not Bode Well For Global Commodity Prices
Chart 19BChinese Stocks Underperformed In 2018-2019
Chinese Stocks Underperformed In 2018-2019
Chinese Stocks Underperformed In 2018-2019
Investable stocks, highly concentrated in China’s internet companies, are caught in domestic regulatory clampdowns and geopolitical crossfires. We expect tensions between China and the US to intensify in 2022 in light of next fall’s 20th NCCCP in China and mid-term elections in the US. Furthermore, Didi Global’s decision to delist from the New York Stock Exchange last week highlights that both China and the US are unanimous in their efforts (although for different reasons) to remove Chinese firms from US bourses. Risks associated with future delisting of Chinese firms will continue to depress the valuations of Chinese technology stocks. Jing Sima China Strategist jings@bcaresearch.com Market/Sector Recommendations Cyclical Investment Stance
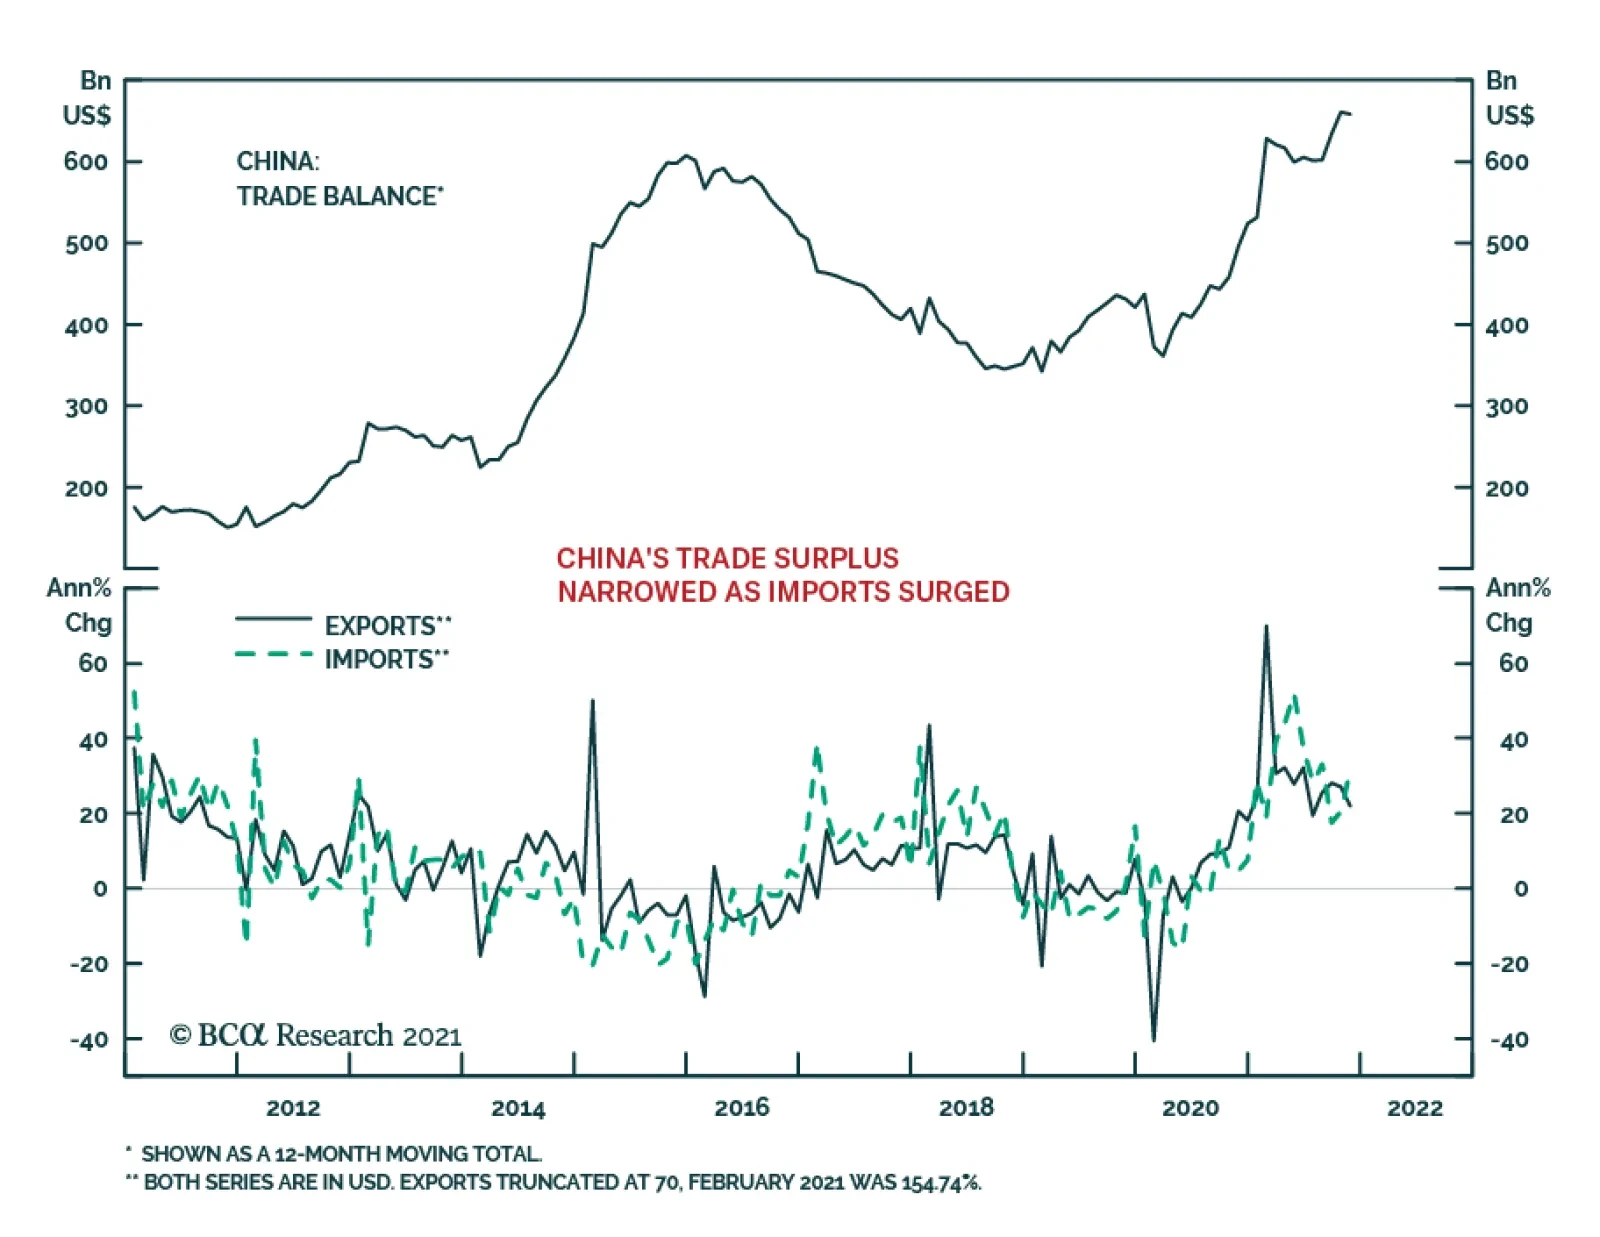
China’s trade surplus eased to $71.7 billion in November, below expectations that it would remain broadly unchanged following October’s record $84.5 billion. The narrower trade balance reflects both an acceleration in imports and a deceleration in exports. …
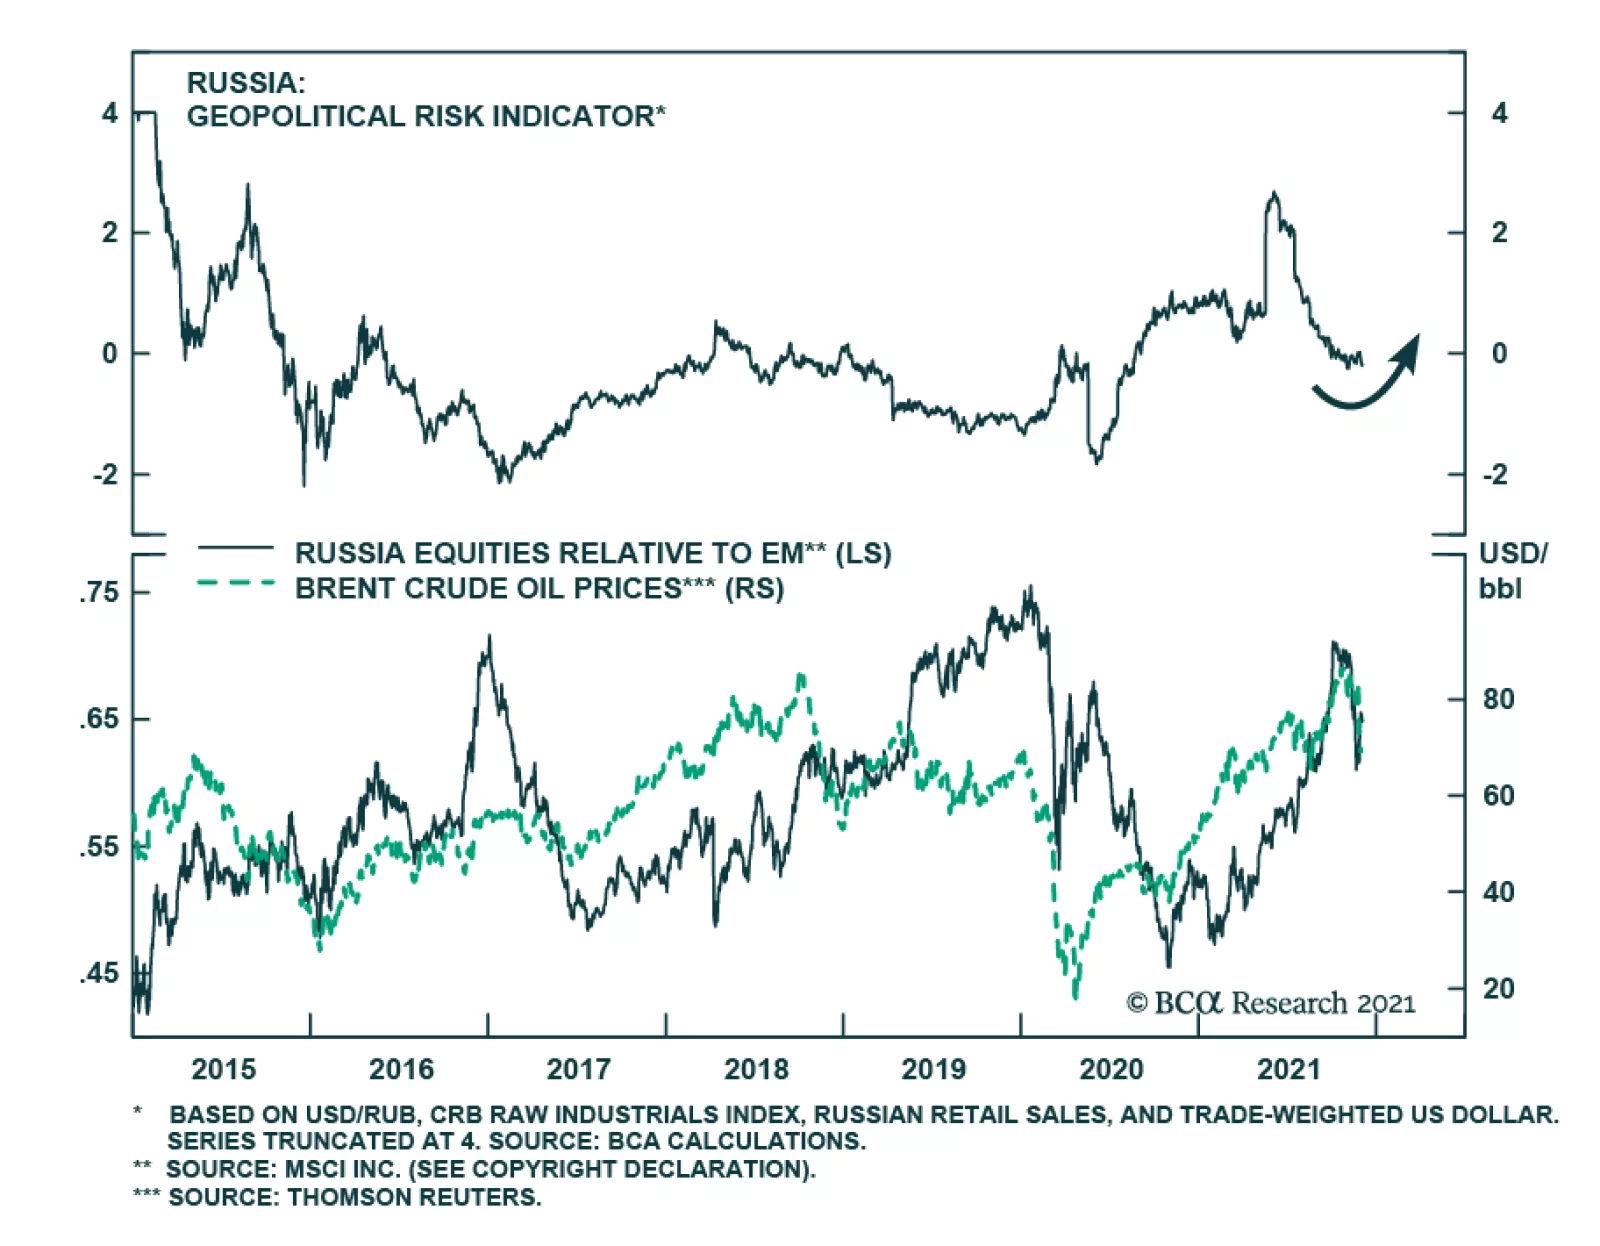
Tensions are once again soaring along the Russia-Ukraine border. Moscow has deployed nearly 100,000 Russian troops as well as weaponry, raising alarm bells that they are planning an incursion. US policymakers are warning of an invasion as soon as early 2022. …
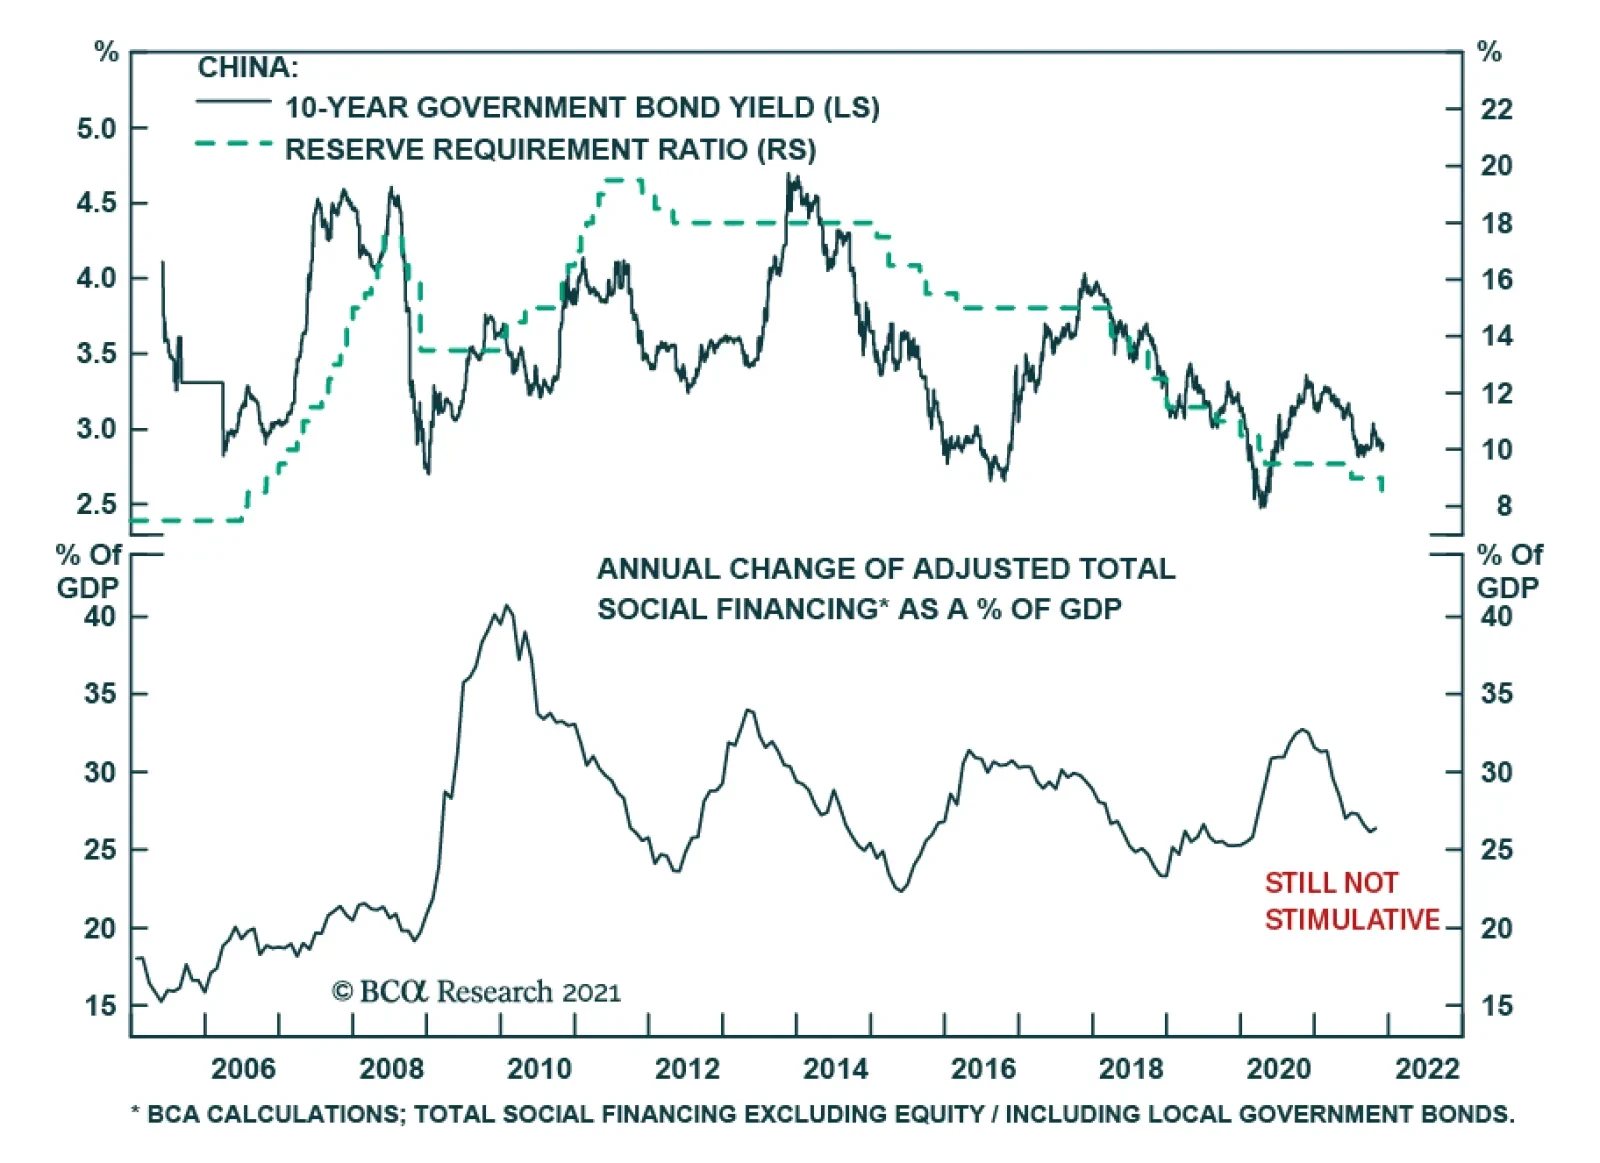
The PBoC’s decision to cut the reserve requirement ratio by 50 bps is unlikely to be a game changer for the Chinese economy. The more important drivers of China’s business cycle and financial markets are credit growth and investment. Both these variables…
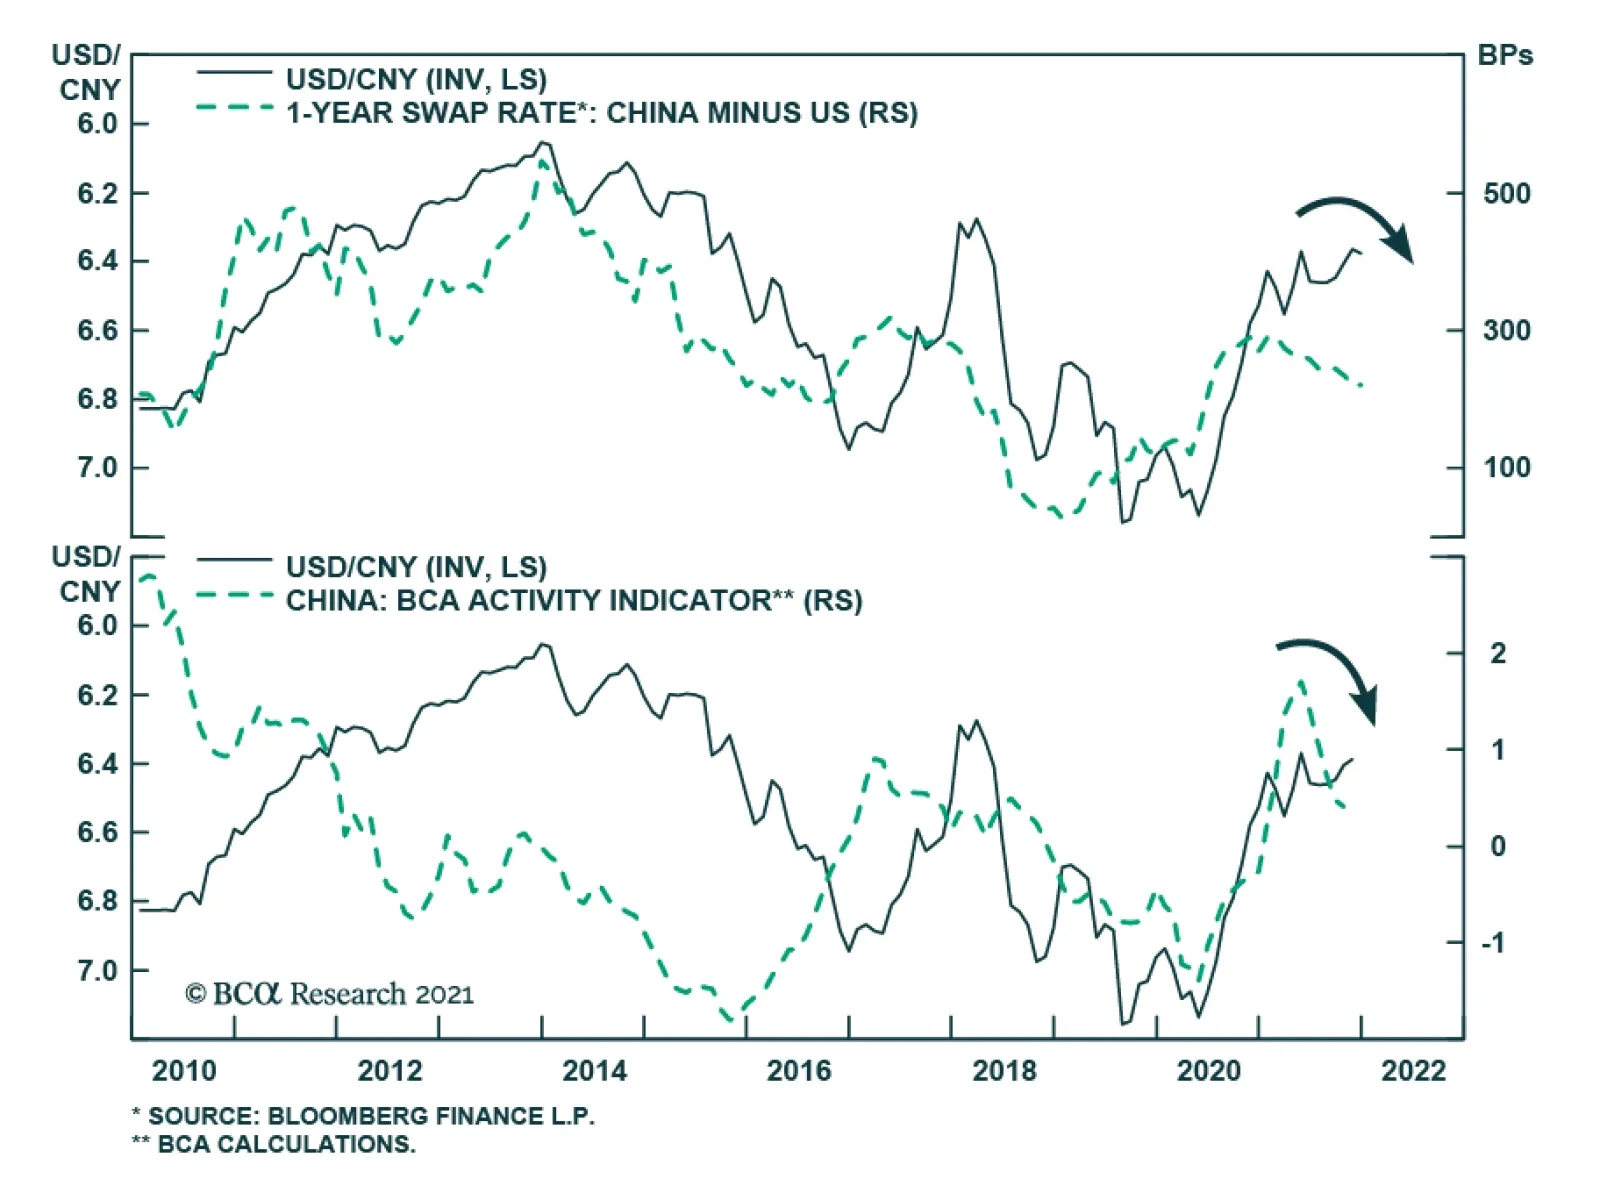
The world’s two largest economies are diverging on monetary policy. The Fed is starting to normalize policy by tapering its asset purchases and preparing to hike interest rates next year. Meanwhile, the PBoC is easing monetary policy – announcing the second…
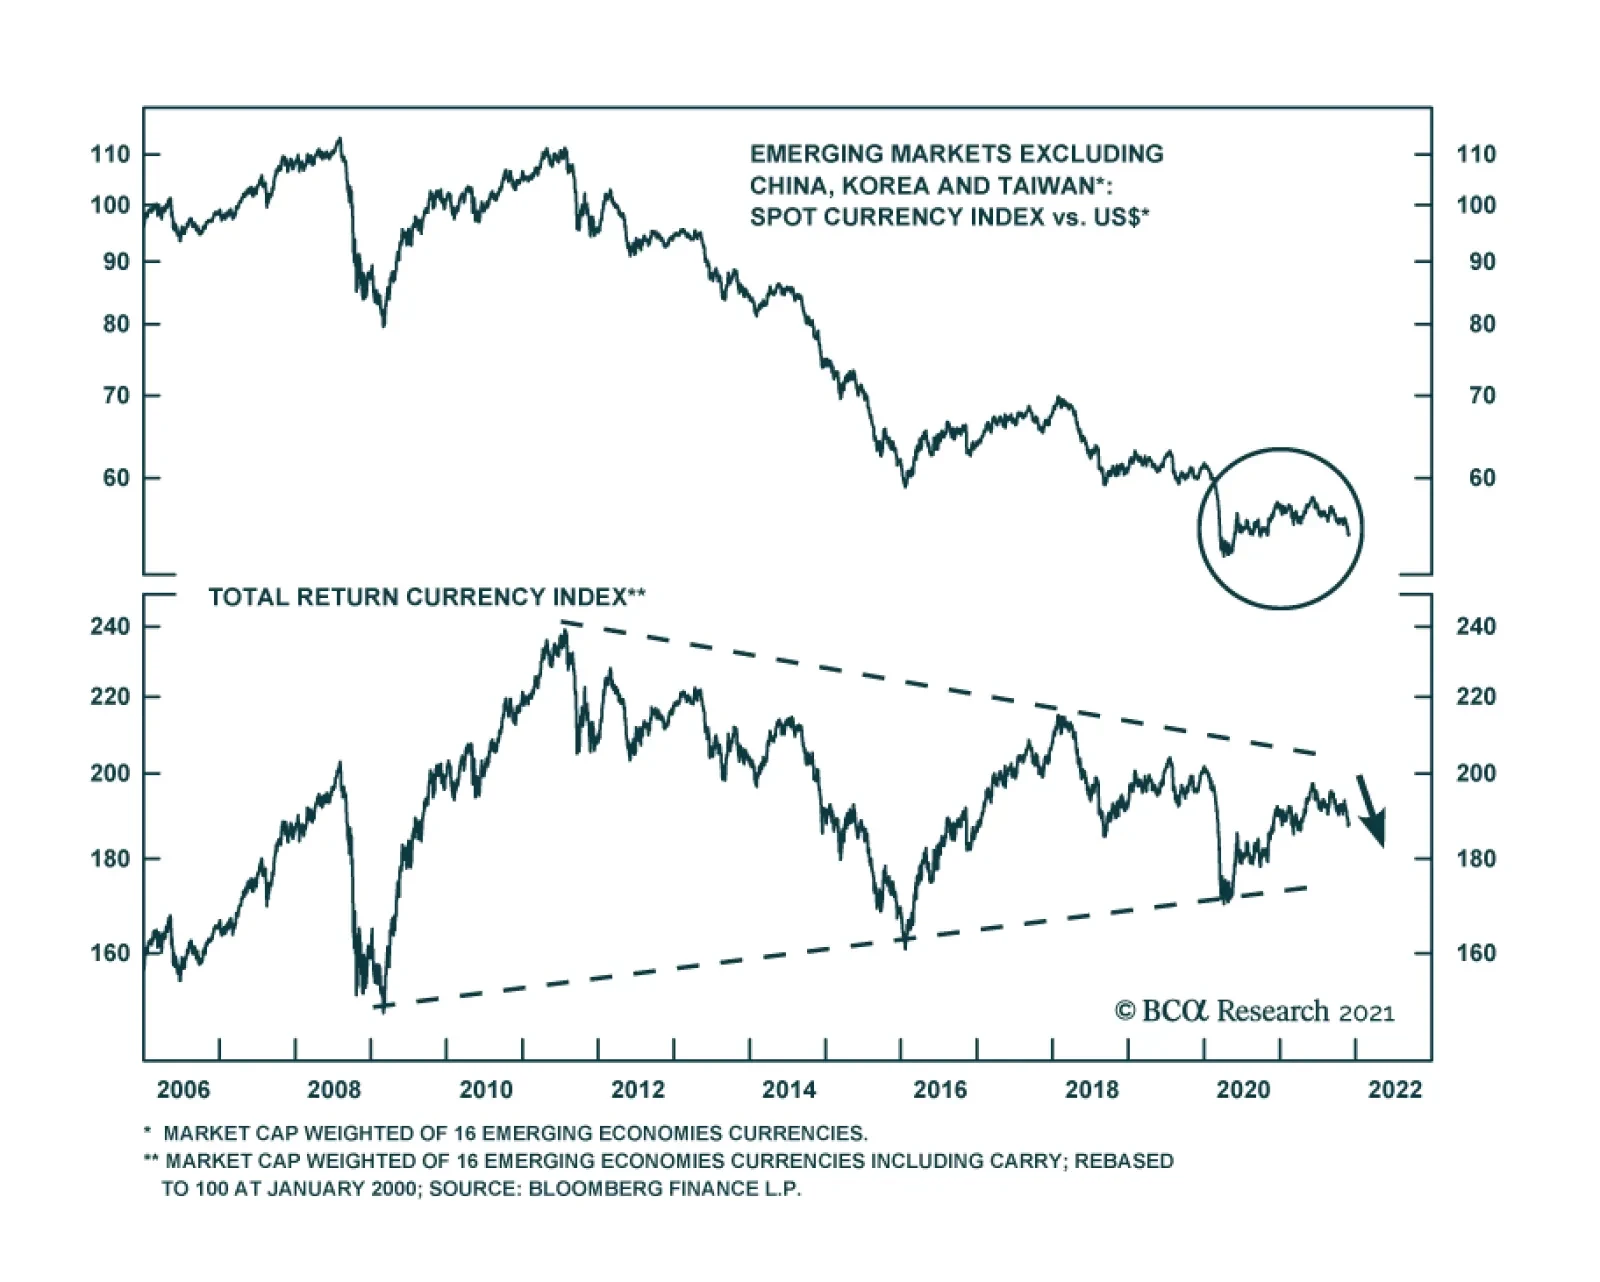
The mainstream EM (EM economies excluding China, Korea and Taiwan) equity market cap-weighted currency spot rate versus the US dollar is not far from its 2020 spring lows. On a total return basis – when carry is taken into account – mainstream…
Dear Client, We are sending you our Strategy Outlook today where we outline our thoughts on the global economy and the direction of financial markets for 2022 and beyond. Next week, please join me for a webcast on Friday, December 10th at 10:00 AM EST (3:00 PM GMT, 4:00 PM CET, 11:00 PM HKT) to discuss the outlook. Also, we published a report this week transcribing our annual conversation with Mr. X, a long-standing BCA client. Please join my fellow BCA strategists and me on Tuesday, December 7th for a follow-up discussion hosted by my colleague, Jonathan LaBerge. Finally, you will receive a Special Report prepared by our Global Asset Allocation service on Monday, December 13th. Similarly to previous years, Garry Evans and his team have prepared a list of books and articles to read over the holiday period. This year they recommend reading materials on key themes of the moment, such as climate change, cryptocurrencies, supply-chain disruption, and gene technology. Included in this report are my team’s recommendations on what to read to understand the underlying causes of inflation. Best regards, Peter Berezin, Chief Global Strategist Highlights Macroeconomic Outlook: Despite the risks posed by the Omicron variant, global growth should remain above trend in 2022. Inflation will temporarily dip next year as goods prices come off the boil. However, the structural trend for inflation is to the upside, especially in the US. Equities: Remain overweight stocks in 2022, favoring cyclicals, small caps, value stocks, and non-US equities. Look to turn more defensive in mid-2023 in advance of a stagflationary recession in 2024 or 2025. Fixed income: Maintain below-average interest rate duration exposure. The US 10-year Treasury yield will rise to 2%-to-2.25% by the end of 2022. Underweight the US, UK, Canada, and New Zealand in a global bond portfolio. Credit: Corporate debt will outperform high-quality government bonds next year. Favor HY over IG. Spreads will widen again in 2023. Currencies: As a momentum currency, the US dollar could strengthen some more over the next month or two. Over a 12-month horizon, however, the trade-weighted dollar will weaken. The Canadian dollar will be the best performing G10 currency next year. Commodities: Oil prices will rise, with Brent crude averaging $80/bbl in 2022. Metals prices will remain resilient thanks to tight supply and Chinese stimulus. We prefer gold over cryptos. I. Macroeconomic Outlook Running out of Greek Letters Just as the world was looking forward to “life as normal”, a new variant of the virus has surfaced. While little is known about the Omicron variant, preliminary indications suggest that it is more transmissible than Delta. The emergence of the Omicron variant is coming in the midst of yet another Covid wave. The number of new cases has skyrocketed across parts of northern and central Europe, prompting governments to re-introduce stricter social distancing measures (Chart 1). New cases have also been trending higher in many parts of the US and Canada since the start of November.
Chart 1
Despite the risks posed by Omicron, there are reasons for hope. BioNTech has said that its vaccine, jointly developed with Pfizer, will provide at least partial immunity against the new strain. At present, 55% of the world’s population has had at least one vaccine shot; 44% is fully vaccinated (Chart 2). China is close to launching its own mRNA vaccine next year, which it intends to administer as a booster shot.
Chart 2
In a worst-case scenario, BioNTech has said that it could produce a new version of its vaccine within six weeks, with initial shipments beginning in about three months. New antiviral medications are also set to hit the market. Pfizer claims its newly developed pill cuts the risk of hospitalization by nearly 90% if taken within three days from the onset of symptoms. The drug-maker has announced its intention to produce enough of the medication to treat 50 million people in 2022. In addition, it is allowing generic versions to be manufactured in developing countries. The company has indicated that its antiviral pills will be effective in treating the new strain. Global Growth: Slowing but from a High Level Assuming the vaccines and antiviral drugs are able to keep the new strain at bay, global growth should remain solidly above trend in 2022. Table 1 shows consensus GDP growth projections for the major economies. G7 growth is expected to tick up from 3.6% in 2021Q3 to 4.5% in 2021Q4. Growth is set to cool to 4.1% in 2022Q1, 3.6% in 2022Q2, 2.9% in 2022Q3, 2.3% in 2022Q4, and 2.1% in 2023Q1. Table 1Growth Is Slowing, But From Very High Levels
Strategy Outlook - 2022 Key Views: The Beginning Of The End
Strategy Outlook - 2022 Key Views: The Beginning Of The End
Chart 3
According to the OECD, potential real GDP growth in the G7 is about 1.4% (Chart 3). Thus, while growth in developed economies will slow next year, it is unlikely to return to trend until the second half of 2023. Emerging markets face a more daunting outlook. The Chinese property market is weakening, and the recent collapse of the Turkish lira highlights the structural problems that some EMs face. Nevertheless, the combination of elevated commodity prices, forthcoming Chinese stimulus, and the resumption of the US dollar bear market starting next year should support EM growth. Relative to consensus, we think the risks to growth in both developed and emerging markets are tilted to the upside in 2022. Growth will likely start surprising to the downside in late 2023, however. The United States: No Shortage of Demand US growth slowed to only 2.1% in the third quarter, reflecting the impact of the Delta variant wave and supply-chain bottlenecks. The semiconductor shortage hit the auto sector especially hard. The decline in vehicle spending alone shaved 2.2 percentage points off Q3 GDP growth. Chart 4Durable Goods Spending Is Still Above Pre-Pandemic Trend, While Services Spending Is Catching Up
Durable Goods Spending Is Still Above Pre-Pandemic Trend, While Services Spending Is Catching Up
Durable Goods Spending Is Still Above Pre-Pandemic Trend, While Services Spending Is Catching Up
The fourth quarter is shaping up to be much stronger. The Bloomberg consensus estimate is for real GDP to expand by 4.9%. The Atlanta Fed’s GDPNow model is even more optimistic. It sees growth hitting 9.7%. The demand for goods will moderate in 2022. As of October, real goods spending was still 10% above its pre-pandemic trendline (Chart 4). In contrast, the demand for services will continue to rebound. While restaurant sales have recovered all their lost ground, spending on movie theaters, amusement parks, and live entertainment in October was still down 46% on a seasonally-adjusted basis compared to January 2020. Hotel spending was down 23%. Spending on public transport was down 25%. Spending on dental services was down 16% (Chart 5).
Chart 5
US households have accumulated $2.3 trillion in excess savings over the course of the pandemic. Some of this money will be spent over the course of 2022 (Chart 6). Increased borrowing should also help. After initially plunging during the pandemic, credit card balances are rising again (Chart 7). Banks are eager to make consumer loans (Chart 8). Chart 6Plenty Of Pent-Up Demand
Plenty Of Pent-Up Demand
Plenty Of Pent-Up Demand
Chart 7Credit Card Spending Is Recovering Following The Pandemic Slump
Credit Card Spending Is Recovering Following The Pandemic Slump
Credit Card Spending Is Recovering Following The Pandemic Slump
Household net worth has risen by over 100% of GDP since the start of the pandemic (Chart 9). In an earlier report, we estimated that the wealth effect alone could boost annual consumer spending by up to 4% of GDP. Chart 8Banks Are Easing Credit Standards For Consumer Loans
Banks Are Easing Credit Standards For Consumer Loans
Banks Are Easing Credit Standards For Consumer Loans
Chart 9A Record Rise In Household Net Worth
A Record Rise In Household Net Worth
A Record Rise In Household Net Worth
Business investment will rebound in 2022, as firms seek to build out capacity, rebuild inventories, and automate more production in the face of growing labor shortages. After moving sideways for the better part of two decades, core capital goods orders have broken out to the upside. Surveys of capex intentions have improved sharply (Chart 10). Nonresidential investment was 6% below trend in Q3 – an even bigger gap than for consumer services spending – so there is plenty of scope for capex to increase. Residential investment should also remain strong in 2022 (Chart 11). The homeowner vacancy rate has dropped to a record low, as have inventories of new and existing homes for sale. Homebuilder sentiment rose to a 6-month high in November. Building permits are 7% above pre-pandemic levels. Chart 10Business Investment Should Be Strong In 2022
Business Investment Should Be Strong In 2022
Business Investment Should Be Strong In 2022
Chart 11Residential Construction Will Be Well Supported
Residential Construction Will Be Well Supported
Residential Construction Will Be Well Supported
US Monetary and Fiscal Policy: Baby Steps Towards Tightening Policy is unlikely to curb US aggregate demand by very much next year. While the Federal Reserve will expedite the tapering of asset purchases and begin raising rates next summer, the Fed is unlikely to raise rates significantly until inflation gets out of hand. As we discuss in the Feature section later in this report, the next leg in inflation will be to the downside, even if the long-term trend for inflation is to the upside. The respite from inflation next year will give the Fed some breathing space. A major tightening campaign is unlikely until mid-2023. Reflecting the Fed’s dovish posture, long-term real bond yields hit record low levels in November (Chart 12). Despite giving up some of its gains in recent days, Goldman’s US Financial Conditions Index stands near its easiest level in history (Chart 13). Chart 12US Real Bond Yields Hitting Record Lows
US Real Bond Yields Hitting Record Lows
US Real Bond Yields Hitting Record Lows
Chart 13Easy Financial Conditions In The US
Easy Financial Conditions In The US
Easy Financial Conditions In The US
US fiscal policy will get tighter next year, but not by very much. In November, President Biden signed a $1.2 trillion infrastructure bill into law, containing $550 billion in new spending. BCA’s geopolitical strategists expect Congress to pass a $1.5-to-$2 trillion social spending bill using the reconciliation process. The emergence of the Omicron strain will facilitate passage of the bill because it will allow the Democrats to add some “indispensable” pandemic relief to the package. All in all, the IMF foresees the US cyclically-adjusted primary budget deficit averaging 4.9% of GDP between 2022 and 2026, compared to 2.0% of GDP between 2014 and 2019 (Chart 14).
Chart 14
It should also be noted that government spending on goods and services has been quite weak over the past two years (Chart 15). The budget deficit surged because transfer payments exploded. Unlike direct government spending, which is set to accelerate over the next few years, households saved a large share of transfer payments. Thus, the fiscal multiplier will increase next year, even as the budget deficit shrinks. Chart 15While Overall Consumption Has Recovered, Business Spending and Direct Government Expenditures Remain Below Trend
While Overall Consumption Has Recovered, Business Spending and Direct Government Expenditures Remain Below Trend
While Overall Consumption Has Recovered, Business Spending and Direct Government Expenditures Remain Below Trend
Chart 16European Banks Have Cleaned Up Their Act
European Banks Have Cleaned Up Their Act
European Banks Have Cleaned Up Their Act
Europe: Room to Grow The European economy faces near-term growth pressures. In addition to Covid-related lockdowns, high energy costs will take a bite out of growth. After having dipped in October, natural gas prices have jumped again due to delays in the opening of the Nord Stream 2 pipeline, strong Chinese gas demand, and rising risks of a colder winter due to La Niña. The majority of Germans are in favor of opening the pipeline, suggesting that it will ultimately be approved. This should help reduce gas prices. Meanwhile, the winter will pass and Chinese demand for gas should abate as domestic coal production increases. The combination of increased energy supplies, easing supply-chain bottlenecks, and hopefully some relief on the pandemic front, should all pave the way for better-than-expected growth across the euro area next year. After a decade of housecleaning, European banks are in much better shape (Chart 16). Capex intentions have risen (Chart 17). Consumer confidence is even stronger in the euro area than in the US (Chart 18).
Chart 17
Chart 18Consumer Confidence Is At Pre-Pandemic Levels In The Euro Area, Unlike In The US
Consumer Confidence Is At Pre-Pandemic Levels In The Euro Area, Unlike In The US
Consumer Confidence Is At Pre-Pandemic Levels In The Euro Area, Unlike In The US
Euro area fiscal policy should remain supportive. Infrastructure spending is set to increase as the Next Generation EU fund begins operations. Germany’s “Traffic Light” coalition will pursue a more expansionary fiscal stance. The IMF expects the euro area to run a cyclically-adjusted primary deficit of 1.2% of GDP between 2022 and 2026, compared to a surplus of 1.2% of GDP between 2014 and 2019. For its part, the ECB will maintain a highly accommodative monetary policy. While net asset purchases under the PEPP will end next March, the ECB is unlikely to raise rates until 2023 at the earliest. In contrast to the US, trimmed-mean inflation has barely risen in the euro area (Chart 19). Moreover, unlike their US counterparts, European firms are reporting few difficulties in finding qualified workers (Chart 20). In fact, euro area wage growth slowed to an all-time low of 1.35% in Q3 (Chart 21). Chart 19Trimmed-Mean Inflation: Higher In The US Than In The Euro Area And Japan
Trimmed-Mean Inflation: Higher In The US Than In The Euro Area And Japan
Trimmed-Mean Inflation: Higher In The US Than In The Euro Area And Japan
Chart 20
Chart 21Wage Growth Remains Contained Across The Euro Area
Wage Growth Remains Contained Across The Euro Area
Wage Growth Remains Contained Across The Euro Area
The UK finds itself somewhere between the US and the euro area. Trimmed-mean inflation is running above euro area levels, but below that of the US. UK labor market data remains very strong, as evidenced by robust employment gains, firm wage growth, and a record number of job vacancies. The PMIs stand at elevated levels, with the new orders component of November’s manufacturing PMI rising to the highest level since June. While worries about the impact of the Omicron variant will likely cause the Bank of England to postpone December’s rate hike, we expect the BoE to begin raising rates in February. Japan: Short-Term Stimulus Boost A major Covid wave during the summer curbed Japanese growth. Consumer spending rebounded after the government removed the state of emergency on October 1 but could falter again if the Omicron variant spreads. The government has already told airlines to halt reservations for all incoming international flights for at least one month. On the positive side, the economy will benefit from new fiscal measures. Following the election on October 31, the new government led by Prime Minister Fumio Kishida announced a stimulus package worth 5.6% of GDP. As with most Japanese stimulus packages, the true magnitude of fiscal support will be much lower than the headline figure. Nevertheless, the combination of increased cash payments to households, support for small businesses, and subsidies for domestic travel should spur consumption in 2022. The capex recovery in Japan has lagged other major economies. This is partly due to the outsized role of the auto sector in Japan’s industrial base. Motor vehicle shipments fell 37% year-over-year in October, dragging down export growth with it. As automotive chip supplies increase, Japan’s manufacturing sector should gain some momentum. Despite the prospect of stronger growth next year, the Bank of Japan will stand pat. Core inflation remains close to zero, while long-term inflation expectations remain far below the BOJ’s 2% target. We do not expect the BOJ to raise rates until 2024 at the earliest. China: Crosswinds The Chinese economy faces crosswinds going into 2022. On the one hand, the energy crisis should abate, helping to boost growth. China has reopened 170 coal mines and will probably begin re-importing Australian coal. Chinese coal prices have fallen drastically over the past 6 weeks (Chart 22). Coal accounts for about two-thirds of Chinese electricity generation. Chart 22Coal Prices Are Renormalizing In China
Coal Prices Are Renormalizing In China
Coal Prices Are Renormalizing In China
Chart 23China's Property Market Has Weakened
China's Property Market Has Weakened
China's Property Market Has Weakened
The US may also trim tariffs on Chinese goods, as Treasury Secretary Yellen hinted this week. This will help Chinese manufacturers. On the other hand, the property market remains under stress. Housing starts, sales, and land purchases were down 34%, 21%, and 24%, respectively, in October relative to the same period last year. The proportion of households planning to buy a home has plummeted. Loan growth to real estate developers has decelerated to the lowest level on record (Chart 23). Nearly half of their offshore bonds are trading at less than 70 cents on the dollar. The authorities have taken steps to stabilize the property market. They have relaxed restrictions on mortgage lending and land sales, cut mortgage rates in some cities, and have allowed some developers to issue asset backed securities to repay outstanding debt. Most Chinese property is bought “off-plan”. The government does not want angry buyers to be deprived of their property. Thus, the existing stock of planned projects will be built. Chart 24 shows that this is a large number; in past years, developers have started more than twice as many projects as they have completed. The longer-term problem is that China builds too many homes. Like Japan in the early 1990s, China’s working-age population has peaked (Chart 25). According to the UN, it will decline by over 400 million by the end of the century. China simply does not need to construct as many new homes as it once did. Chart 24Chinese Construction: Halfway Done
Chinese Construction: Halfway Done
Chinese Construction: Halfway Done
Chart 25Demographic Parallels Between China And Japan
Demographic Parallels Between China And Japan
Demographic Parallels Between China And Japan
Chart 26
Japan was unable to fill the gap that a shrinking property sector left in aggregate demand in the early 1990s. As a result, the economy fell into a deflationary trap. China is likely to have more success. Unlike Japan, which waited too long to pursue large-scale fiscal stimulus, China will be more aggressive. The authorities will raise infrastructure spending next year with a focus on clean energy. They will also boost social spending. A frayed social safety net has forced Chinese households to save more than they would otherwise for precautionary reasons. This has weighed on consumption. The fact that China is a middle-income country helps. In 1990, Japan’s output-per-worker was nearly 70% of US levels; China’s output-per-worker is still 20% of US levels (Chart 26). If Chinese incomes continue to grow at a reasonably brisk pace, this will make it easier to improve home affordability. It will also allow China to stabilize its debt-to-GDP ratio without a painful deleveraging campaign. II. Feature: The Long-Term Inflation Outlook Two Steps Up, One Step Down We expect inflation in the US, and to a lesser degree abroad, to follow a “two steps up, one step down” trajectory of higher highs and higher lows. The US is currently near the top of those two steps. Inflation should dip over the next 6-to-9 months as the demand for goods moderates and supply-chain disruptions abate. Chart 27 shows that container shipping costs have started to come down. The number of ships anchored off the ports of Los Angeles and Long Beach is falling. US semiconductor firms are working overtime (Chart 28). Chip production in Japan and Korea is rising swiftly. DRAM chip prices have already started to decline. Chart 27Signs Of Easing Supply Issues On The Rough Seas
Signs Of Easing Supply Issues On The Rough Seas
Signs Of Easing Supply Issues On The Rough Seas
Chart 28Semiconductor Manufacturers Are Stepping Up Their Game
Semiconductor Manufacturers Are Stepping Up Their Game
Semiconductor Manufacturers Are Stepping Up Their Game
Reflecting the easing of supply-chain bottlenecks, both the “prices paid” and “supplier delivery” components of the manufacturing ISM declined in November. The respite from inflation will not last long, however. The US labor market is heating up. So far, most of the wage growth has been at the bottom end of the income distribution (Chart 29). Wage growth will broaden out over the course of 2022, pushing up service price inflation in the process. Chart 29Wage Growth Has Picked Up, But Mainly At The Bottom Of The Income Distribution
Wage Growth Has Picked Up, But Mainly At The Bottom Of The Income Distribution (I)
Wage Growth Has Picked Up, But Mainly At The Bottom Of The Income Distribution (I)
Chart 30Rent Inflation Has Increased
Rent Inflation Has Increased
Rent Inflation Has Increased
Rent inflation will also rise, as the unemployment rate falls further. The Zillow rent index has spiked 14% (Chart 30). Rents account for 8% of the US CPI basket and 4% of the PCE basket. Biased About Neutral? Investors are assuming that the Fed will step in to extinguish any inflationary fires before they get out of hand. The widely-followed 5-year/5-year forward TIPS breakeven inflation rate has fallen back below the Fed’s comfort zone (Chart 31). Chart 31Long-Term Inflation Expectations Are Not A Source Of Worry For The Fed
Long-Term Inflation Expectations Are Not A Source Of Worry For The Fed (II)
Long-Term Inflation Expectations Are Not A Source Of Worry For The Fed (II)
Chart 32Both The Fed And Investors Have Lowered Their Estimate Of The Neutral Rate
Both The Fed And Investors Have Lowered Their Estimate Of The Neutral Rate
Both The Fed And Investors Have Lowered Their Estimate Of The Neutral Rate
This may be wishful thinking. Back in 2012, when the Fed began publishing its “dots”, it thought the neutral rate of interest was 4.25%. Today, it considers it to be around 2.5% (Chart 32). Market participants broadly agree. Both investors and policymakers have bought into the secular stagnation thesis hook, line, and sinker. If the neutral rate turns out to be higher than widely believed, the Fed could find itself woefully behind the curve. Given the “long and variable” lags between changes in monetary policy and the resulting impact on the economy, inflation is liable to greatly overshoot the Fed’s target. Structural Forces Turning More Inflationary Meanwhile, the forces that have underpinned low inflation over the past few decades are starting to fray: Globalization is in retreat: The ratio of global trade-to-manufacturing output has been flat for over a decade (Chart 33). Looking out, the ratio could decline as geopolitical tensions between China and the rest of the world continue to simmer, and more companies shift production back home in order to gain greater control over the supply chains of essential goods. Baby boomers are leaving the labor force en masse: As a group, baby boomers hold more than half of US household wealth (Chart 34). They will continue to run down their wealth once they retire. However, since they will no longer be working, they will no longer contribute to national output. Spending that is not matched by output tends to drive up inflation. Chart 33Globalization Plateaued Over a Decade Ago
Globalization Plateaued Over a Decade Ago
Globalization Plateaued Over a Decade Ago
Chart 34
Social stability is in peril: The US homicide rate increased by 27% in 2020, the biggest one-year jump on record. All indications suggest that crime has continued to rise in 2021, coinciding with the ongoing decline in the incarceration rate (Chart 35). Amazingly, the murder rate and inflation are highly correlated (Chart 36). If the government cannot credibly commit to keeping people safe, how can it credibly commit to keeping inflation low? Without trust in government, inflation expectations could quickly become unmoored. Chart 35The Homicide Rate Has Tended To Rise When The Institutionalization Rate Has Declined
The Homicide Rate Has Tended To Rise When The Institutionalization Rate Has Declined
The Homicide Rate Has Tended To Rise When The Institutionalization Rate Has Declined
Chart 36Bouts Of Inflation Tend To Coincide With Rising Crime
Bouts Of Inflation Tend To Coincide With Rising Crime
Bouts Of Inflation Tend To Coincide With Rising Crime
The temptation to monetize debt will rise: Public-sector debt levels have soared to levels last seen during World War II. If bond yields rise as the Congressional Budget Office expects, debt-servicing costs will triple by the end of the decade (Chart 37). Faced with the prospect of having to divert funds from social programs to pay off bondholders, the government may apply political pressure on the Fed to keep rates low.
Chart 37
A Post-Pandemic Productivity Boom?
Chart 38
Might faster productivity growth bail out the economy just like it did following the Second World War? Don’t bet on it. US labor productivity did increase sharply during the initial stages of the pandemic. However, that appears to have been largely driven by composition effects that saw many low-skilled, poorly-paid service workers lose their jobs. As these low-skilled workers have returned to the labor force, productivity growth has dropped. The absolute level of productivity declined by 5.0% at an annualized rate in the third quarter, leading to an 8.3% increase in labor costs. Productivity growth has been extremely weak outside the US (Chart 38). This gives weight to the view that the pandemic-induced changes in business practices have not contributed to higher productivity, at least so far. It is worth noting that a recent study of 10,000 skilled professionals at a major IT company revealed that work-from-home policies decreased productivity by 8%-to-19%, mainly because people ended up working longer. Increased investment spending should eventually boost productivity. However, the near-term impact of higher capex will be to boost aggregate demand, stoking inflation in the process. III. Financial Markets A. Portfolio Strategy Above-Trend Global Growth Will Support Equities Our golden rule of investing is about as simple as they come: Don’t bet against stocks unless you think that there is a recession around the corner. As Chart 39 shows, recessions and equity bear markets almost always overlap.
Chart 39
Chart 40Sentiment Towards Equities Is Already Bearish
Sentiment Towards Equities Is Already Bearish
Sentiment Towards Equities Is Already Bearish
Equity corrections can occur outside of recessionary periods. In fact, we are experiencing such a correction right now. Yet, with the percentage of bearish investors reaching the highest level in over 12 months in this week’s AAII survey, chances are that the correction will not last much longer (Chart 40). A sustained decline in stock prices requires a sustained decline in corporate earnings; the latter normally only happens during economic downturns. Admittedly, it is impossible to know for sure if a recession is lurking around the corner. If the Omicron variant is able to completely evade the vaccines, growth will slow considerably over the coming months. Yet, even in that case, the global economy is unlikely to experience a sudden-stop of the sort that occurred last March. As noted at the outset of this report, pharma companies have the tools to tweak the vaccines, and most experts believe that the soon-to-be-released antivirals will be effective against the new strain. If economic growth remains above trend, earnings will rise (Chart 41). S&P 500 companies generated $53.82 per share in profits in Q3. The bottom-up consensus is for these companies to generate an average of $54.01 in quarterly profits between 2021Q4 and 2022Q3, implying almost no growth from 2021Q3 levels. This is a very low bar to clear. We expect global equities to produce high single-digit returns next year. Chart 41Analysts Increased Earnings Estimates This Year
Analysts Increased Earnings Estimates This Year
Analysts Increased Earnings Estimates This Year
The Beginning of the End Our guess is that 2022 will be the last year of the secular equity bull market that began in 2009. In mid-2023 or so, the Fed will come around to the view that the neutral rate is higher than it once thought. Unfortunately, by then, it will be too late; a wage-price spiral will have already emerged. A nasty bear flattening of the yield curve will ensue: Long-term bond yields will rise but short-term rate expectations will increase even more. A recession will follow in 2024 or 2025. The most important real-time indicator we are focusing on to gauge when to turn more bearish on stocks is the 5y/5y forward TIPS breakeven rate. As noted earlier, it is still at the bottom end of the Fed’s comfort zone. If it were to rise above 3%, all hell could break loose, especially if this happened without a corresponding increase in crude oil prices. The Fed takes great pride in the success it has had in anchoring long-term expectations. Any evidence that expectations are becoming unmoored would cause the FOMC to panic. B. Equity Sectors, Regions, And Styles Favor Value, Small Caps, and Non-US Markets in 2022 Until the Fed takes away the punch bowl, a modestly procyclical stance towards equity sectors, styles, and regional equity allocation is warranted. Chart 42The Relative Performance Of Value Stocks Has Closely Tracked Bond Yields This Year
The Relative Performance Of Value Stocks Has Closely Tracked Bond Yields This Year
The Relative Performance Of Value Stocks Has Closely Tracked Bond Yields This Year
The relative performance of value versus growth stocks has broadly followed the trajectory of the 30-year Treasury yield this year (Chart 42). Rising yields should buoy value stocks, with banks being the biggest beneficiaries (Chart 43). In contrast, rising yields will weigh on tech stocks. Chart 43Rising Bond Yields Will Help Bank Shares But Hurt Tech Stocks
Rising Bond Yields Will Help Bank Shares But Hurt Tech Stocks
Rising Bond Yields Will Help Bank Shares But Hurt Tech Stocks
Chart 44The Winners And Losers Of Covid Waves
The Winners And Losers Of Covid Waves
The Winners And Losers Of Covid Waves
If we receive some good news on the pandemic front, this should disproportionately help value. As Chart 44 illustrates, the relative performance of value versus growth stocks has tracked the number of new Covid cases globally. The correlation between new cases and the relative performance of IT and energy has been particularly strong. Rising capex spending will buoy industrial stocks. Industrials are overrepresented in value indices both in the US and abroad (Table 2). Along with financials, industrials are also overrepresented in small cap indices (Table 3). US small caps trade at 15-times forward earnings compared to 21-times for the S&P 500. Table 2Breaking Down Growth And Value By Sector
Strategy Outlook - 2022 Key Views: The Beginning Of The End
Strategy Outlook - 2022 Key Views: The Beginning Of The End
Table 3Financials And Industrials Have A Larger Weight In US Small Caps
Strategy Outlook - 2022 Key Views: The Beginning Of The End
Strategy Outlook - 2022 Key Views: The Beginning Of The End
Time to Look Abroad? Given our preference for cyclicals and value in 2022, it stands to reason that we should also favor non-US markets. Table 4 shows that non-US stock markets have more exposure to cyclical and value sectors. Table 4Cyclicals Are Overrepresented Outside The US
Strategy Outlook - 2022 Key Views: The Beginning Of The End
Strategy Outlook - 2022 Key Views: The Beginning Of The End
Admittedly, favoring non-US stock markets has been a losing proposition for the past 12 years. US earnings have grown much faster than earnings abroad over this period (Chart 45). US stock returns have also benefited from rising relative valuations. Chart 45The US Has Been The Earnings Leader In Recent Years
The US Has Been The Earnings Leader In Recent Years
The US Has Been The Earnings Leader In Recent Years
At this point, however, US stocks are trading at a significant premium to their overseas peers, whether measured by the P/E ratio, price-to-book, or price-to-sales (Chart 46). US profit margins are also more stretched than elsewhere (Chart 47).
Chart 46
Chart 47US Profit Margins Look Stretched
US Profit Margins Look Stretched
US Profit Margins Look Stretched
Chart 48Non-US Stocks Tend To Do Best When The US Dollar Is Weakening
Non-US Stocks Tend To Do Best When The US Dollar Is Weakening
Non-US Stocks Tend To Do Best When The US Dollar Is Weakening
The US dollar may be the ultimate arbiter of whether the US or international stock markets outperform in the 2022. Historically, there has been a close correlation between the trade-weighted dollar and the relative performance of US versus non-US equities (Chart 48). In general, non-US stocks do best when the dollar is weakening. The usual relationship between the dollar and the relative performance of US and non-US stocks broke down in 2020 when the dollar weakened but the tech-heavy US stock market nonetheless outperformed. However, if “reopening plays” gain the upper hand over “pandemic plays” in 2022, the historic relationship between the dollar and US/non-US returns will reassert itself. As we discuss later on, while near-term momentum favors the dollar, the greenback is likely to weaken over a 12-month horizon. This suggests that investors should look to increase exposure to non-US stocks in a month or two. Around that time, the energy shortage gripping Europe will begin to abate, China will be undertaking more stimulus, and investors will start to focus more on the prospect of higher US corporate taxes. C. Fixed Income Maintain Below-Benchmark Duration The yield on a government bond equals the expected path of policy rates over the duration of the bond plus a term premium that compensates investors for locking in their savings at a fixed rate rather than rolling them over at the prevailing short-term rate. While expected policy rates have moved up in the US over the past 2 months, the market’s expectations of where policy rates will be in the second half of the decade have not changed much (Chart 49). Investors remain convinced of the secular stagnation thesis which postulates that the neutral rate of interest is very low.
Chart 49
As for the term premium, it remains stuck in negative territory, much where it has been for the past 10 years (Chart 50). Chart 50Negative Term Premium Across The Board
Negative Term Premium Across The Board
Negative Term Premium Across The Board
The Term Premium Will Increase The notion of a negative term premium may seem odd, as it implies that investors are willing to pay to take on duration risk. However, there is a good reason for why the term premium has been negative: The correlation between bond yields and stock prices has been positive (Chart 51). Chart 51Stocks And Bond Yields Have Not Always Been Positively Correlated
Stocks And Bond Yields Have Not Always Been Positively Correlated
Stocks And Bond Yields Have Not Always Been Positively Correlated
When bond yields are positively correlated with stock prices, bonds are a hedge against bad economic news. If the economy falls into recession, equity prices will drop; the value of your home will go down; you may not get a bonus, or even worse, you may lose your job. But at least the value of your bond portfolio will go up! There is a catch, however: Bonds are a hedge against bad economic news only if that news is deflationary in nature. The 2001 and 2008-09 recessions all saw bond yields drop as the economy headed south. Both recessions were due to deflationary shocks: first the dotcom bust, and later, the bursting of the housing bubble. In contrast, bond yields rose in the lead up to the recession in the 1970s and early 80s. Bonds were not a good hedge against falling stock prices back then because it was surging inflation and rising bond yields that caused stocks to fall in the first place. This raises a worrying possibility that investors have largely overlooked: The term premium may increase as it becomes increasingly clear that the next recession will be caused not by inadequate demand but by Fed tightening in response to an overheated economy. A rising term premium would exacerbate the upward pressure on bond yields stemming from higher-than-expected inflation as well as upward revisions to estimates of the real neutral rate of interest. Again, we do not think that a “term premium explosion” is a significant risk for 2022. However, it is a major risk for 2023 and beyond. Investors should maintain a modestly below-benchmark duration stance for now but look to go maximally underweight duration towards the end of next year. Global Bond Allocation BCA’s global fixed-income strategists recommend underweighting the US, Canada, the UK, and New Zealand in 2022. They suggest overweighting Japan, the euro area, and Australia. US Treasuries trade with a higher beta than most other government bond markets (Chart 52). Our bond strategists expect the US 10-year Treasury yield to hit 2%-to-2.25% by the end of next year. Chart 52High-And Low-Beta Bond Yields
High-And Low-Beta Bond Yields
High-And Low-Beta Bond Yields
As discussed earlier, neither the ECB nor the BoJ are in a hurry to raise rates. Both euro area and Japanese bonds have outperformed the global benchmark when Treasury yields have risen (Chart 53).
Chart 53
Chart 54UK Inflation Expectations Are Higher Than In Other Major Developed Economies
UK Inflation Expectations Are Higher Than In Other Major Developed Economies
UK Inflation Expectations Are Higher Than In Other Major Developed Economies
While rate expectations in Australia have come down on the Omicron news, the markets are still pricing in four hikes next year. With wage growth still below the RBA’s target, our fixed-income strategists think the central bank will pursue a fairly dovish path next year. In contrast, they think New Zealand will continue its hiking cycle. Like Canada, the Reserve Bank of New Zealand has become increasingly concerned about soaring home prices and household indebtedness. Inflation expectations are higher in the UK than elsewhere (Chart 54). With the BoE set to raise rates early next year, gilts will underperform the global benchmark. Overweight High-Yield Corporate Bonds… For Now Chart 55High-Yield Spreads Are Pricing In A Default Rate Of Close To 4%
High-Yield Spreads Are Pricing In A Default Rate Of Close To 4%
High-Yield Spreads Are Pricing In A Default Rate Of Close To 4%
The combination of above-trend economic growth and accommodative monetary policy will provide support for corporate bonds in 2022. For now, we prefer high yield over investment grade. According to our bond strategists, while high-yield spreads are quite tight, they are still pricing in a default rate of 3.8% (Chart 55). This is more than their fair value default estimate of 2.3%-to-2.8%. It is also above the year-to-date realized default rate of 1.7%. As with equities, the bull market in corporate credit will end in 2023 as the Fed is forced to accelerate the pace of rate hikes in the face of an overheated economy and rising long-term inflation expectations. D. Currencies and Commodities Dollar Strength Will Reverse in Early 2022 Since bottoming in May, the US dollar has been trending higher. The US dollar is a high momentum currency: When the greenback starts rising, it usually keeps rising (Chart 56). A simple trading rule that buys the dollar when it is trading above its various moving averages has delivered positive returns (Chart 57). This suggests that the greenback could very well strengthen further over the next month or two.
Chart 56
Chart 57
Over a 12-month horizon, however, we think the trade-weighted dollar will weaken. Both speculators and asset managers are net long the dollar (Chart 58). Current positioning suggests we are nearing a dollar peak. Rising US rate expectations have helped the dollar this year. Chart 59 shows that both USD/EUR and USD/JPY have tracked the spread between the yield on the December 2022 Eurodollar and Euribor/Euroyen contracts, respectively. While the Fed will expedite the pace of tapering, the overall approach will still be one of “baby-steps” towards tightening next year. BCA’s bond strategists do not expect US rate expectations for end-2022 to rise from current levels. Chart 58Long Dollar Positions Are Getting Crowded
Long Dollar Positions Are Getting Crowded
Long Dollar Positions Are Getting Crowded
Chart 59Interest Rates Have Played A Major Role On The Dollar's Performance This Year
Interest Rates Have Played A Major Role On The Dollar's Performance This Year
Interest Rates Have Played A Major Role On The Dollar's Performance This Year
The present level of real interest rate differentials is consistent with a much weaker dollar (Chart 60). Using CPI swaps as a proxy for expected inflation, 2-year real rates in the US are 42 basis points below other developed economies. This is similar to where real spreads were in 2013/14, when the trade-weighted dollar was 16% weaker than it is today. Chart 60AThe Dollar And Interest Rate Differentials (I)
The Dollar And Interest Rate Differentials (I)
The Dollar And Interest Rate Differentials (I)
Chart 60BThe Dollar And Interest Rate Differentials (II)
The Dollar And Interest Rate Differentials (II)
The Dollar And Interest Rate Differentials (II)
Meanwhile, growth outside the US will pick up next year as Europe’s energy crisis abates and China ramps up stimulus. If history is any guide, firmer growth abroad will put downward pressure on the dollar (Chart 61). Chart 61The Dollar Will Weaken As Global Growth Rotates From The US To The Rest Of The World
The Dollar Will Weaken As Global Growth Rotates From The US To The Rest Of The World
The Dollar Will Weaken As Global Growth Rotates From The US To The Rest Of The World
Chart 62Dollar Headwinds
Dollar Headwinds
Dollar Headwinds
Pricey Greenback The dollar’s lofty valuation has left it overvalued by nearly 20% on a Purchasing Power Parity (PPP) basis. The PPP exchange rate equalizes the price of a representative basket of goods and services between the US and other economies. Reflecting the dollar’s overvaluation, the US trade deficit has widened sharply. Excluding energy exports, the US trade deficit as a share of GDP is now the largest on record. Equity inflows have helped finance America’s burgeoning current account deficit (Chart 62). However, these inflows are starting to abate, and could drop further if global investors abandon their infatuation with US tech stocks. Favor Commodity Currencies We favor commodity currencies for 2022, especially the Canadian dollar, which we expect to be the best performing G10 currency. Canadian real GDP growth will average nearly 5% in Q4 and the first half of next year. The Bank of Canada will start hiking rates next April. Oil prices should remain reasonably firm next year, helping the loonie and other petrocurrencies. Bob Ryan, BCA’s chief Commodity Strategist, expects the price of Brent crude to average $80/bbl in 2022 and 81$/bbl in 2023, which is well above the forwards (Chart 63). Years of underinvestment in crude oil production have led to tight supply conditions (Chart 64). Proven global oil reserves increased by only 6% between 2010 and 2020, having risen by 26% over the preceding decade.
Chart 63
Chart 64
As with oil, there has been little investment in mining capacity in recent years. While a weaker property market in China will weigh on metals prices, this will be partly offset by Chinese fiscal stimulus. Looking further ahead, the outlook for metals remains bright. Whereas the proliferation of electric vehicles is bad news for oil demand over the long haul, it is good news for many metals. The typical electric vehicle requires about four times as much copper as a typical gasoline-powered vehicle. Huge amounts of copper will also be necessary to expand electrical grids. The RMB Will Be Stable in 2022 It is striking that despite the appreciation in the trade-weighted dollar since June and escalating concerns about the health of the Chinese economy, the RMB has managed to strengthen by 0.3% against the US dollar. Chinese export growth will moderate in 2022 as global consumption shifts from goods to services. Rising global bond yields may also narrow the yield differential between China and the rest of the world. Nevertheless, we doubt the RMB will weaken very much. China wants the RMB to be a global reserve currency. A weak RMB would run counter to that goal. Rather than weakening the yuan, the Chinese authorities will use fiscal stimulus to support growth. Gold Versus Cryptos? Gold prices tend to move closely with real bond yields (Chart 65). Since August 2020, however, the price of gold has slumped from a high of $2,067/oz to $1,768/oz, even though real yields remain near record lows. The divergence between real yields and gold prices may partly reflect growing demand for cryptocurrencies. Investors increasingly see cryptos as not just a disruptive economic force, but as the premier “anti-fiat” hedge. Whether that view pans out remains to be seen. So far, the vast majority of the demand for cryptocurrencies has stemmed from people hoping to get rich by buying cryptos. To the extent that people are using cryptos for online purchases, it is usually for illegal goods (Chart 66). Chart 65Gold Prices Tend To Correlate Closely With Real Interest Rates
Gold Prices Tend To Correlate Closely With Real Interest Rates
Gold Prices Tend To Correlate Closely With Real Interest Rates
Chart 66
Crypto proponents like to say that the supply of cryptos is finite. While this may be true for individual cryptocurrencies, it is not true for the sector as a whole. Over the past 8 years, the number of cryptocurrencies has swollen from 26 in 2013 to 7,877 (Chart 67). At least with gold, they are not adding any new elements to the periodic table.
Chart 67
At any rate, the easy money in the crypto space has already been made. Bitcoin has doubled in price seven times since the start of 2016. If it were to double just one more time to $120,000, it would be worth $2.2 trillion, equal to the entire stock of US dollars in circulation. Investors looking to hedge long-term inflation risk should shift back into gold. Peter Berezin Chief Global Strategist pberezin@bcaresearch.com Global Investment Strategy View Matrix
Image
Special Trade Recommendations
Image
Current MacroQuant Model Scores
Image