Emerging Markets

Highlights Financial markets in both mainstream EM and China are undergoing an adjustment that is not yet complete. EM equity and currency valuations are neutral. When valuations are neutral, the profit and liquidity cycles become the key drivers of share prices. Both these factors are currently headwinds to equity prices. Our investment strategy is to remain defensive going into the new year. Yet, the longer-term outlook is brighter. We see with high odds that the first half of the year will present an opportunity to turn positive on EM assets in absolute terms, and upgrade EM versus DM within global equity and fixed-income portfolios. Our checklist of fundamental factors that will cause us to turn bullish on EM and China include: (1) significant stimulus in China leading to a strong recovery in its credit impulse; (2) a rollover in Latin America’s core inflation that will open the door for monetary policy easing in these economies; and (3) the Fed abandoning its plans to hike rates, creating conditions for durable US dollar weakness. Feature Introduction: Beyond Omicron There is low visibility regarding the Omicron variant of the COVID-19 virus’s impact on societies and economies. We do not pretend to be experts in virology and on pandemics. So, in this 2022 outlook, we will focus on the macro fundamentals that go beyond Omicron. If the latter proves to be very disruptive for many economies, EM risk assets will sell off materially in the coming weeks. If Omicron proves to be a non-issue, macro fundamentals will prevail. In this case (and if our analysis is correct) EM risk assets will still fare poorly, at least in the early months of 2022. Chart 1The EM Selloff Has Been Occurring Since February 2021
The EM Selloff Has Been Occurring Since February 2021
The EM Selloff Has Been Occurring Since February 2021
Notably, the cross rate between the Swedish krona and Swiss franc correlates well with EM share prices and both had already been falling well before Omicron arrived (Chart 1). Overall, our investment strategy is to remain defensive going into the new year. Nevertheless, odds are significant that in H1 2022 there will be a buying opportunity in EM assets in absolute terms, and a better entry point to upgrade EM relative to DM within global equity and fixed-income portfolios. China’s Business Cycle And Macro Policy Will China ease policy substantially? It depends on how bad the economy, financial markets and business/consumer sentiment get. Beijing has already initiated piecemeal monetary and fiscal easing. However, if the growth slowdown is gradual and orderly, and financial markets do not panic, then policy easing will be measured. On the contrary, if growth tumbles sharply, business and consumer confidence deteriorate markedly and onshore share prices sell off hard, then policymakers will accelerate the stimulus. In a nutshell, substantial policy easing is not likely unless Chinese onshore stocks experience a meaningful deterioration. In the meantime, the Mainland economy will continue disappointing, and the path of least resistance for China-related plays is down: The annual change in excess reserves – that PBOC injects into the banking system – leads the credit impulse by six months (Chart 2, top panel). The former has stabilized but has not yet turned up. Hence, in the near term, the credit impulse will be stabilizing at very low levels but will not revive materially until spring 2022. This entails more growth disappointments in China’s old economy (Chart 2, bottom panel). In turn, the average of the manufacturing PMI’s new orders and backlog of orders series heralds more downside in EM non-TMT share prices (Chart 3). Chart 2China: An Economic Revival Is Not Imminent
China: An Economic Revival Is Not Imminent
China: An Economic Revival Is Not Imminent
Chart 3EM Non-TMT Stocks Remain At Risk
EM Non-TMT Stocks Remain At Risk
EM Non-TMT Stocks Remain At Risk
Property construction will not recover quickly. Marginal easing of real estate regulations and restrictions will not be sufficient to revive animal spirits among property developers and buyers. As we argued in a recent special report on the property market, real estate in China benefited from the biggest carry trade in the world over the past decade. With borrowing costs below the pace of house price appreciation, property developers in China have done what any business would do: they borrowed as much as they could and accumulated real estate assets in the forms of land, incomplete construction, and completed but unsold properties. Chart 4The Carry Trade In China's Real Estate
The Carry Trade In China's Real Estate
The Carry Trade In China's Real Estate
The top panel of Chart 4 illustrates that developers have been starting many more projects than they have been completing. As a result, their unfinished construction has ballooned (Chart 4, bottom panel). Such a business model was profitable since developers’ borrowing costs were below the pace of real estate asset price appreciation. This dynamic will reverse going forward: real estate asset price appreciation will be below developers’ borrowing costs. Thus, property developers have every incentive to shed their assets as quickly as possible. This will discourage new land investment and new construction. In brief, odds are rising that the property market downtrend will be an extended one. In 2015, when property inventories swelled (Chart 4, bottom panel), it took outright monetization of residential properties by the PBOC through the PSL program1 to revive real estate demand and construction. Currently, anything short of aggressive monetization or a very large policy boost will be insufficient to reignite property market sentiment. Thus, the real estate market will continue to struggle. Chart 5 illustrates that real estate developer financing has dried up, heralding a significant contraction in floor space completion, i.e., construction activity. This will weigh on industrial commodities (Chart 5, bottom panel). Even if the government approves a larger special bond quota for local governments, traditional infrastructure spending is unlikely to accelerate meaningfully (Chart 6). The basis is that local governments will continue facing financing constraints from an ongoing slump in their land sales. The RMB 3.65 trillion special bond issuance quota in 2021 accounted for only 18% of local government on- and off-budget revenues. Meanwhile, land sales by local governments account for 40% of their on- and off-budget revenues. As the property market travails continue, local governments will not be able to materially increase traditional infrastructure spending. Chart 5Less Funding = Less Completions = Less Commodity Demand
Less Funding = Less Completions = Less Commodity Demand
Less Funding = Less Completions = Less Commodity Demand
Chart 6China: Traditional Infrastructure Has Been Weak
China: Traditional Infrastructure Has Been Weak
China: Traditional Infrastructure Has Been Weak
In sum, the Chinese economy has developed formidable downward momentum that will not be easy to reverse. That said, authorities will likely begin injecting more stimulus in 2022 to secure a stable economy and financial markets in the second half of 2022, ahead of the important Party Congress. Bottom Line: The slowdown in the Chinese old economy will continue for now with negative ramifications for China-related financial markets. A buying opportunity for China plays leveraged to its old economy is likely sometime in 2022. Chinese Internet Stocks Chart 7Chinese Internet Stocks Are Not Cheap
Chinese Internet Stocks Are Not Cheap
Chinese Internet Stocks Are Not Cheap
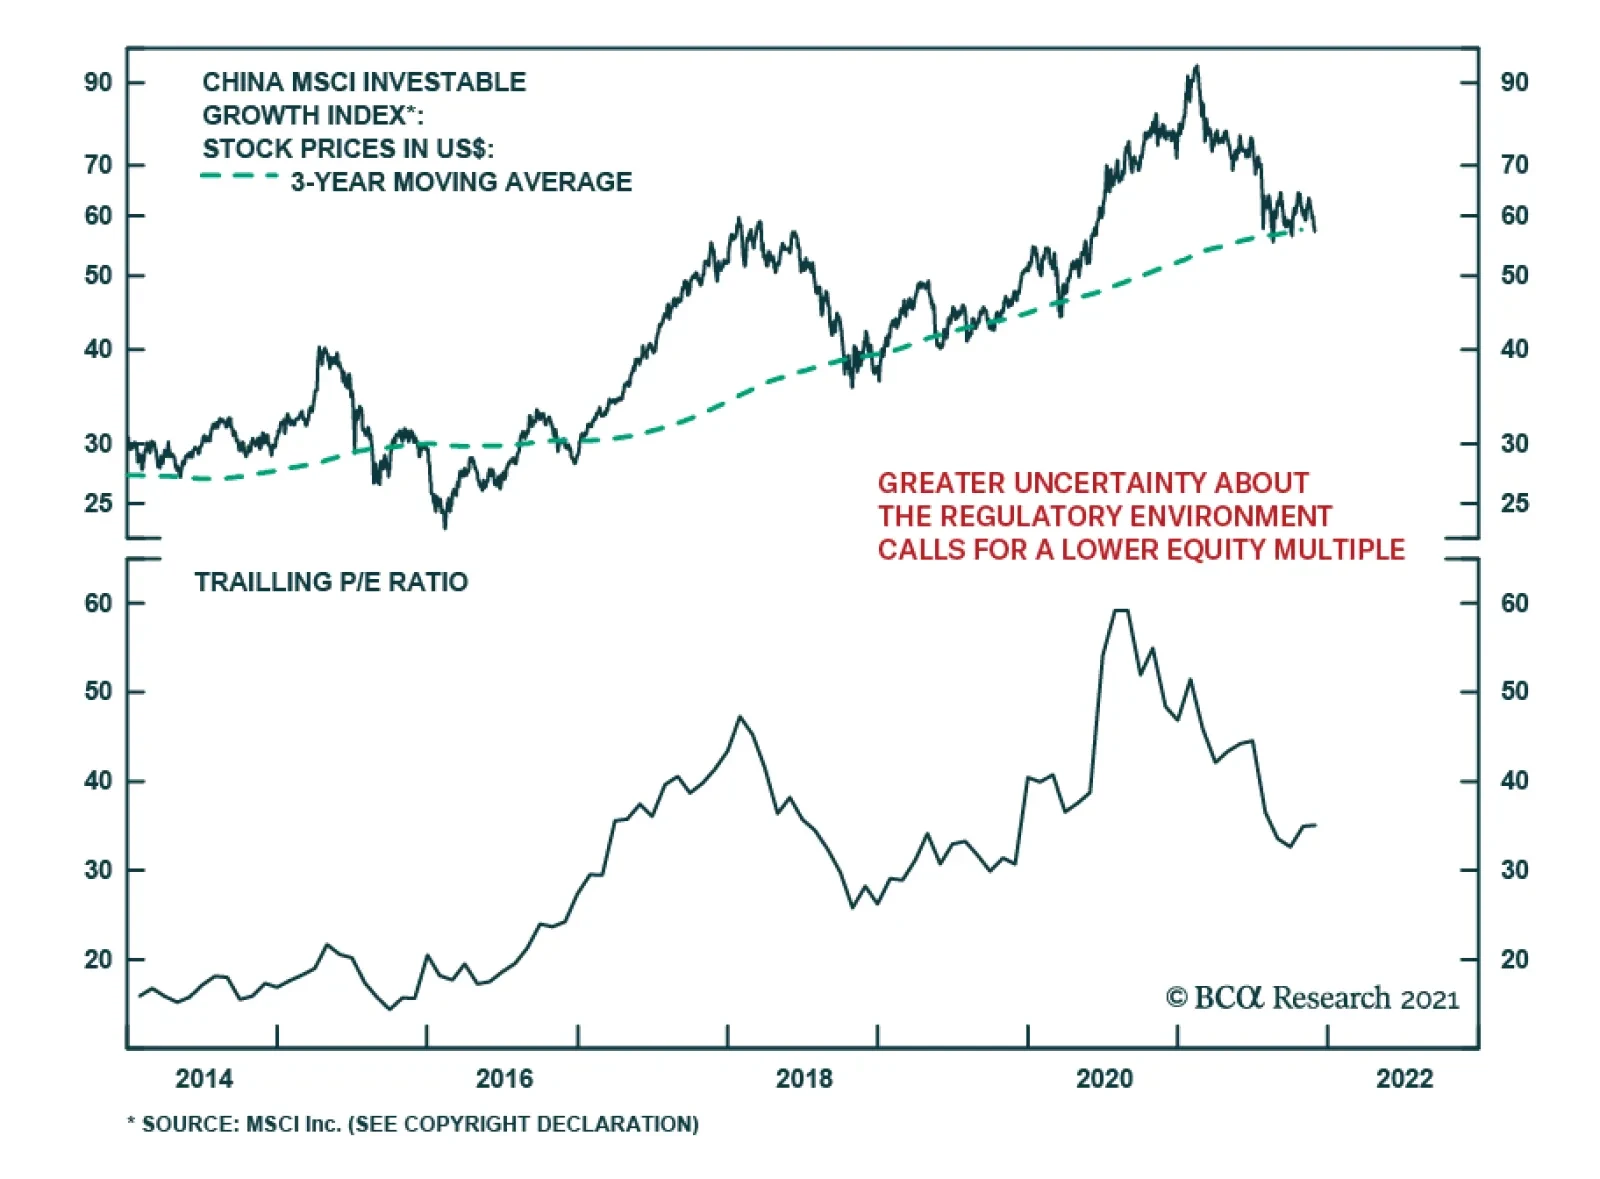
The outlook for Chinese TMT stocks remains uninspiring. We maintain that the regulatory changes affecting Chinese internet stocks are structural rather than cyclical in nature. There could be periods when the pace of regulatory clampdown eases, but these regulations will not be rolled back in any meaningful way. While Chinese platform companies’ equity valuations have already de-rated, these stocks are not cheap: their trailing and forward P/E ratios stand at 35 and 30, respectively (Chart 7). Their multiples will compress further for the following reasons: Their business models have to change because of regulatory requirements. Higher uncertainty about their future business models currently entails a higher equity risk premium. Authorities will cap these companies’ profitability like regulators do with monopolies and oligopolies, which heralds a lower return on equity. In addition, in line with the common prosperity policy, these companies will perform social duties – redistributing profits from shareholders to the society. All these will lower their profitability, warranting permanently lower multiples than those in the past 10 years. Beijing’s involvement in their management and the prioritization of national and geopolitical objectives over shareholder interests will lead foreign investors to dis-invest from these companies. Some large companies face non-trivial risks of delisting from the US. Last week, Beijing reportedly asked Didi to delist from the US due to concerns over its data security. For very different reasons, US and Chinese authorities do not want Chinese companies to be listed in the US. And when Chinese and US authorities do not want to see some of these stocks listed in the US, they will not be. Odds are rising that a few of them might be delisted in the coming years. In such a scenario, US institutional investors will offload their holdings of these companies. Chart 8China: Online Retail Sales Have Slowed Down
China: Online Retail Sales Have Slowed Down
China: Online Retail Sales Have Slowed Down
In addition to the risk to multiples, these internet companies’ profits are also under threat. Chart 8 shows that online retail sales of goods and services have been lackluster compared to their torrid pace in the past 10 years. Bottom Line: The path of least resistance for Chinese internet/platform share prices remains down. Mainstream EM Economies In the majority of EM economies ex-China, Korea and Taiwan (herein referred to as mainstream EM), domestic demand will remain in the doldrums in H1 2022: Monetary policy has tightened in Latin America and Russia while real interest rates are elevated/restrictive in the ASEAN region. In countries where central banks have been hiking rates, domestic demand is bound to decelerate (Chart 9, top panel). In fact, domestic demand remains below pre-pandemic levels in many mainstream EMs (Chart 9, bottom panel). Rate hikes and/or high borrowing costs in real terms will continue to weigh on money and credit growth. The annual growth rates of broad money and bank loans have already reached record lows in both nominal and real terms (Chart 10). These are equity market-weighted aggregates for EM ex-China, Korea and Taiwan. Chart 9Mainstream EM: Domestic Demand Is At Risk Of A Relapse
Mainstream EM: Domestic Demand Is At Risk Of A Relapse
Mainstream EM: Domestic Demand Is At Risk Of A Relapse
Chart 10Mainstream EM: Tepid Money And Credit Growth
Mainstream EM: Tepid Money And Credit Growth
Mainstream EM: Tepid Money And Credit Growth
Chart 11Mainstream EM: No Fiscal Reprieve In 2022
Mainstream EM: No Fiscal Reprieve In 2022
Mainstream EM: No Fiscal Reprieve In 2022
For the same universe, the fiscal thrust in 2022 will be around -1% of GDP (Chart 11). Chart 12 illustrates the 2022 fiscal thrust – defined as the yearly change in the cyclically adjusted budget deficit – for individual countries. Only Turkey is projected to have a small positive fiscal thrust next year.
Chart 12
The slowdown in China’s old economy will weigh on Asian economies and commodity producers elsewhere. Table 1 demonstrates that China is the top destination for Asian and commodity producing economies’ exports. Finally, political uncertainty and volatility will remain high in Latin America while geopolitical tensions will linger and escalate from time to time around Russia and Taiwan. We do not think political and geopolitical risks are fully reflected in these financial markets. This leaves these bourses vulnerable to these risks. Bottom Line: Economic growth in mainstream EM economies will disappoint, at least in H1 2022. What We Are Looking To Turn Bullish On EM Assets? Equities: A combination of the following will make us consider issuing a buy recommendation on EM equities: Significant stimulus in China leading to a strong recovery in its credit impulse (shown in Chart 2 above). A rollover in Latin America’s core inflation that will open the door for monetary policy easing in these economies. Regarding indicators, we would need to see all three of the following: EM M1 growth accelerates (Chart 13) Analysts’ net EPS expectations drop to their previous lows (Chart 14) Investor sentiment on EM equities declines to its previous lows (Chart 15). EM equity valuations are neutral in absolute terms. When valuations are neutral, share prices could rise or fall. In these cases, the profit cycle is the key driver of share prices. EM equity market cap-weighted narrow money (M1) growth suggests that EM EPS growth will decelerate well into 2022 (Chart 13 above). Such a profit slump is not yet priced in according to Chart 14. Chart 13An EM Profit Slump Is Imminent
An EM Profit Slump Is Imminent
An EM Profit Slump Is Imminent
Chart 14Analysts Are Not Pricing In An EM Profit Slump
Analysts Are Not Pricing In An EM Profit Slump
Analysts Are Not Pricing In An EM Profit Slump
Chart 15Investor Sentiment On EM Stocks Is Not Downbeat
Investor Sentiment On EM Stocks Is Not Downbeat
Investor Sentiment On EM Stocks Is Not Downbeat
Chart 16Mainstream EM Currencies: Spot And Total Return Indexes
Mainstream EM Currencies: Spot And Total Return Indexes
Mainstream EM Currencies: Spot And Total Return Indexes
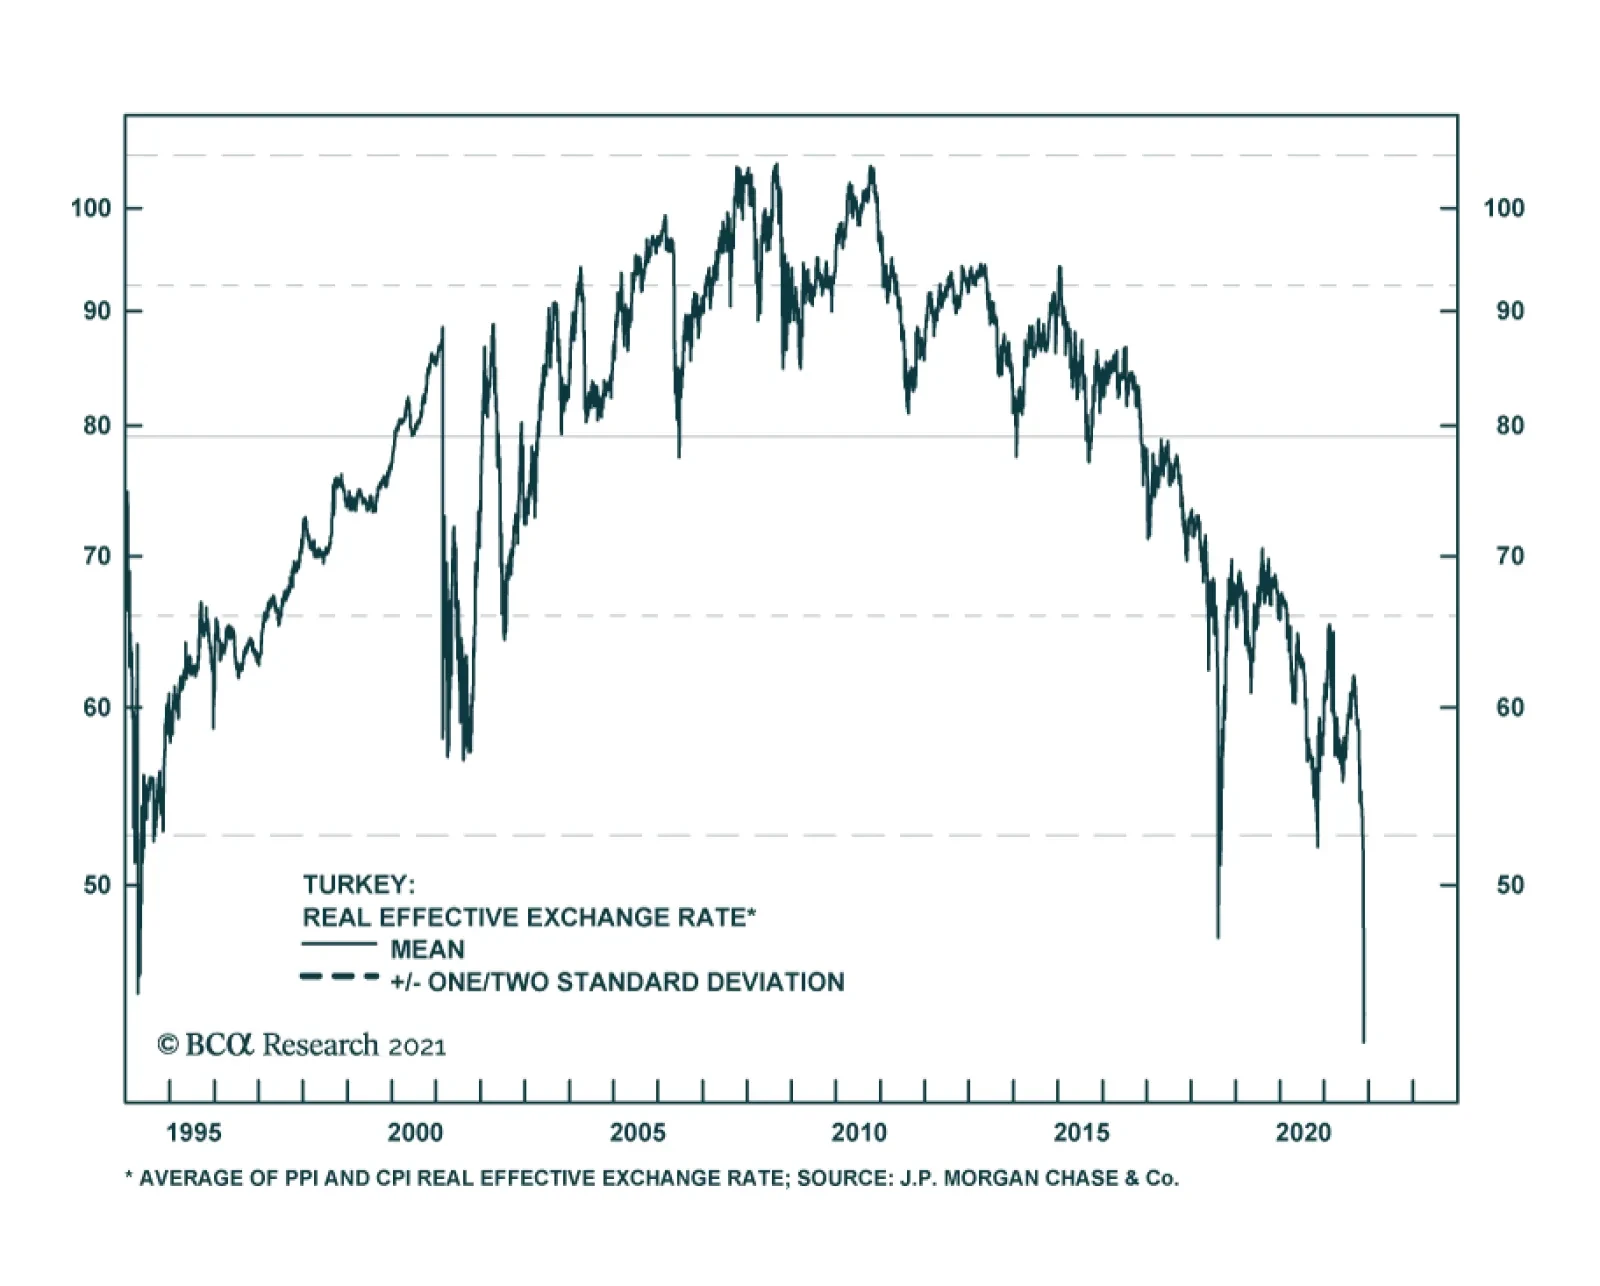
Exchange Rates: The mainstream EM equity market cap-weighted currency spot rate versus the US dollar is not far from its 2020 spring lows. On a total return basis – when carry is taken into account – mainstream EM currencies are still above their March 2020 lows (Chart 16). Chart 17Mainstream EM: Real Effective Exchange Rates
Mainstream EM: Real Effective Exchange Rates
Mainstream EM: Real Effective Exchange Rates
Critically, EM currencies are not particularly cheap (Chart 17). Given the lingering headwinds, they are likely to depreciate further. The mainstream EM aggregate real effective exchange rate will likely drop to one or two standard deviations below its mean before these currencies find a bottom (Chart 17). Barring a scenario in which the Omicron variant becomes a major drag on the US economy, the Federal Reserve will maintain its recent hawkish rhetoric due to rising core US inflation. This will support the US dollar and weigh on EM currencies. If Omicron produces a major selloff in financial markets, EM currencies will depreciate. In a nutshell, weak domestic demand and return on capital, political volatility, a slowdown in China and potentially lower commodity prices will all continue depressing EM currencies in the early months of 2022. In the following section about local rates, we list signposts that will make us turn positive on EM currencies Local Rates: EM local rates have gone up a great deal and they offer good value. However, as long as EM currencies do not find a floor, interest rates in high-yield local bond markets will not decline. Critically, US dollar returns on EM local currency bonds are primarily determined by exchange rates. Hence, a buying opportunity for international investors in EM high-yield local bonds will coincide with a bottom in their currencies. We recommend turning positive on mainstream EM currencies versus the US dollar if two out of these three conditions are met: The Fed abandons its intention to hike rates. Significant stimulus in China leading to a strong recovery in its credit impulse Mainstream EM’s aggregate real effective exchange rate drops more than one standard deviation below its mean (Chart 17). Chart 18EM Credit Spreads Are Driven By The EM Business Cycle And Currencies
EM Credit Spreads Are Driven By The EM Business Cycle And Currencies
EM Credit Spreads Are Driven By The EM Business Cycle And Currencies
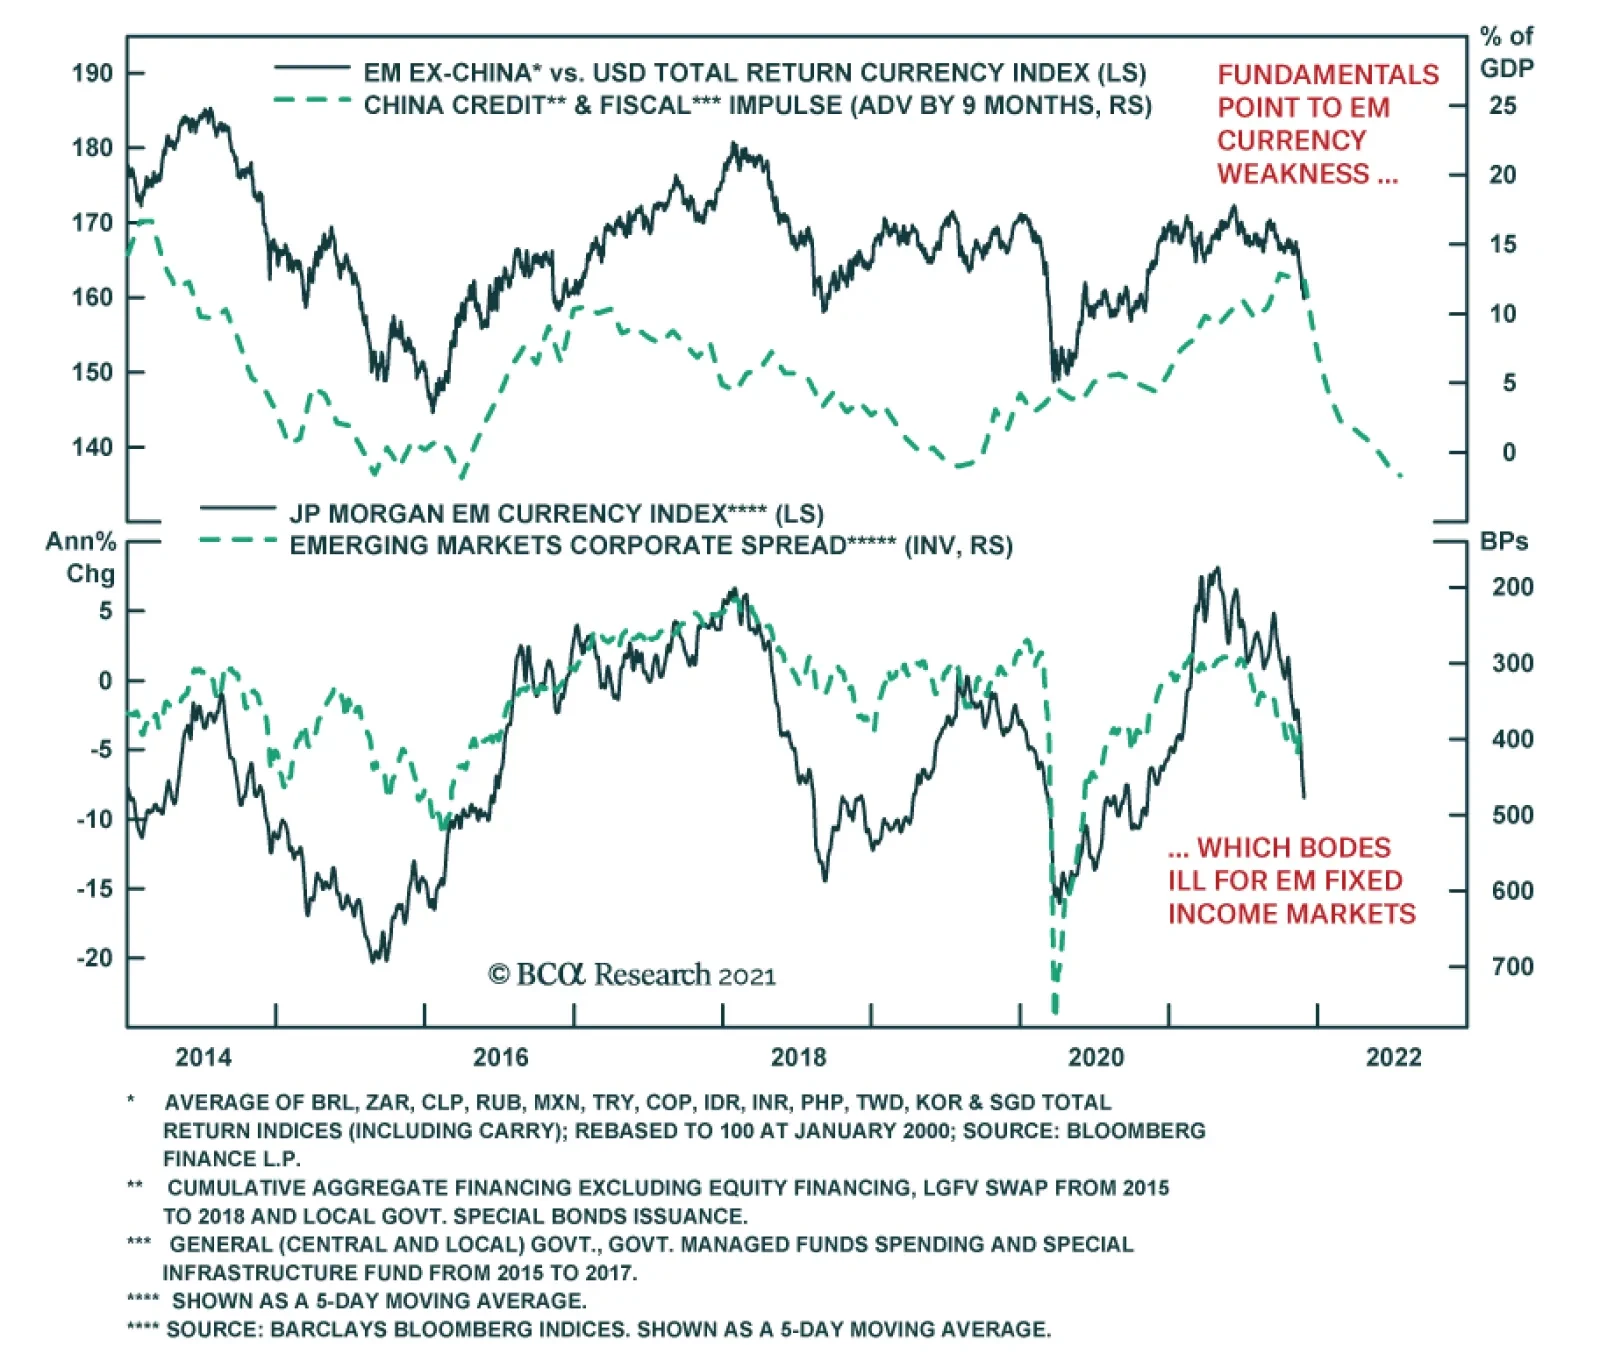
Credit Markets: As we discussed in a report published earlier this year titled A Primer on EM USD Bonds, the two key drivers of EM sovereign and corporate credit spreads are economic growth and the exchange rate (Chart 18). A positive turn on the EM/China business cycles and their currencies will make us immediately bullish on EM sovereign credit. As for high-yield Chinese USD property developers’ bonds, they are not a buy given their extremely high indebtedness and the dismal outlook for real estate. Investment Strategy Odds are that there will be a buying opportunity in EM equities, fixed income and currencies in 2022. The checklists we highlighted above outline what we will be monitoring to make us turn positive on EM equities, local rates, exchange rates and credit. Our current investment stance is as follows: There is likely to be more downside in EM equities in absolute terms. They will also continue underperforming their DM peers. We downgraded EM equities from neutral to underweight on March 25, 2021 and this strategy remains intact. Within the EM benchmark, our overweights are Korea, Singapore, China (favoring A shares over investable stocks), Vietnam, Russia, central Europe and Mexico. Our equity underweights are Brazil, Chile, Peru, Colombia, South Africa, Turkey and Indonesia. We recommend a neutral allocation to all other bourses in mainstream EM. A word on India, Korea and Mexico is warranted. We will publish a report on India next week. Concerning our overweight in the Korean bourse, lower DRAM prices and China’s slowdown have weighed on its performance in 2021 (Chart 19). However, weakness in semiconductor prices will prove to be short lived as the semiconductor industry is in a structural upswing. Besides, Korea and Mexico are two countries in the EM universe that will benefit from the US industrial boom – one of our major multi-year themes. Chart 20 shows that Korea’s relative equity performance versus the overall EM benchmark closely tracks global industrials relative share prices versus global non-TMT stocks. Chart 19A Soft Spot In The DRAM Industry
A Soft Spot In The DRAM Industry
A Soft Spot In The DRAM Industry
Chart 20Overweight The KOSPI Within The EM Equity Space
Overweight The KOSPI Within The EM Equity Space
Overweight The KOSPI Within The EM Equity Space
The path of least resistance for EM currencies versus the US dollar is presently down. We continue to recommend shorting the following basket of EM currencies versus the US dollar: BRL, CLP, COP, PEN, ZAR, KRW, THB and PHP. Last week, we recommended adding the Indonesian rupiah to this list and today we are booking profits on the short position in TRY. The currencies that we currently favor are CNY, INR, MYR, SGD, TWD, RUB, CZK and MXN. In local rates, we have been betting on the yield curve flattening in Mexico and Russia, have been recommending receiving 10-year swap rates in China and Malaysia as well as paying 10-year rates in the Czech Republic. In the EM credit space, we continue to recommend underweighting EM versus US corporate credit, quality adjusted. As with equities, we downgraded this allocation from neutral to underweight on March 25, 2021. Within the EM credit space, we favor sovereign versus corporate credit, quality adjusted. For EM sovereign credit and domestic bond portfolios, our recommended allocations across various countries are shown in the tables enclosed below. Finally, today we are closing our volatility trades: long EM equity volatility and EM currency volatility. Both positions were initiated on February 4, 2021 and have been profitable. Arthur Budaghyan Chief Emerging Markets Strategist arthurb@bcaresearch.com Footnotes 1Pledged Supplementary Lending was in effect in 2014-2018: The PBOC lent at very low interest rates to the three policy banks who in turn re-lent to local governments and regional property developers (mainly in tier-2 and smaller cities). These entities then bought slums from their owners, putting cash in their hands to purchase new and better properties. Equities Recommendations Currencies, Credit And Fixed-Income Recommendations
Chinese authorities are taking steps to limit foreign listings of Chinese companies. According to media reports, Beijing is planning to ban companies from using the variable interest entities structure – a loophole used by Chinese tech companies – to go…
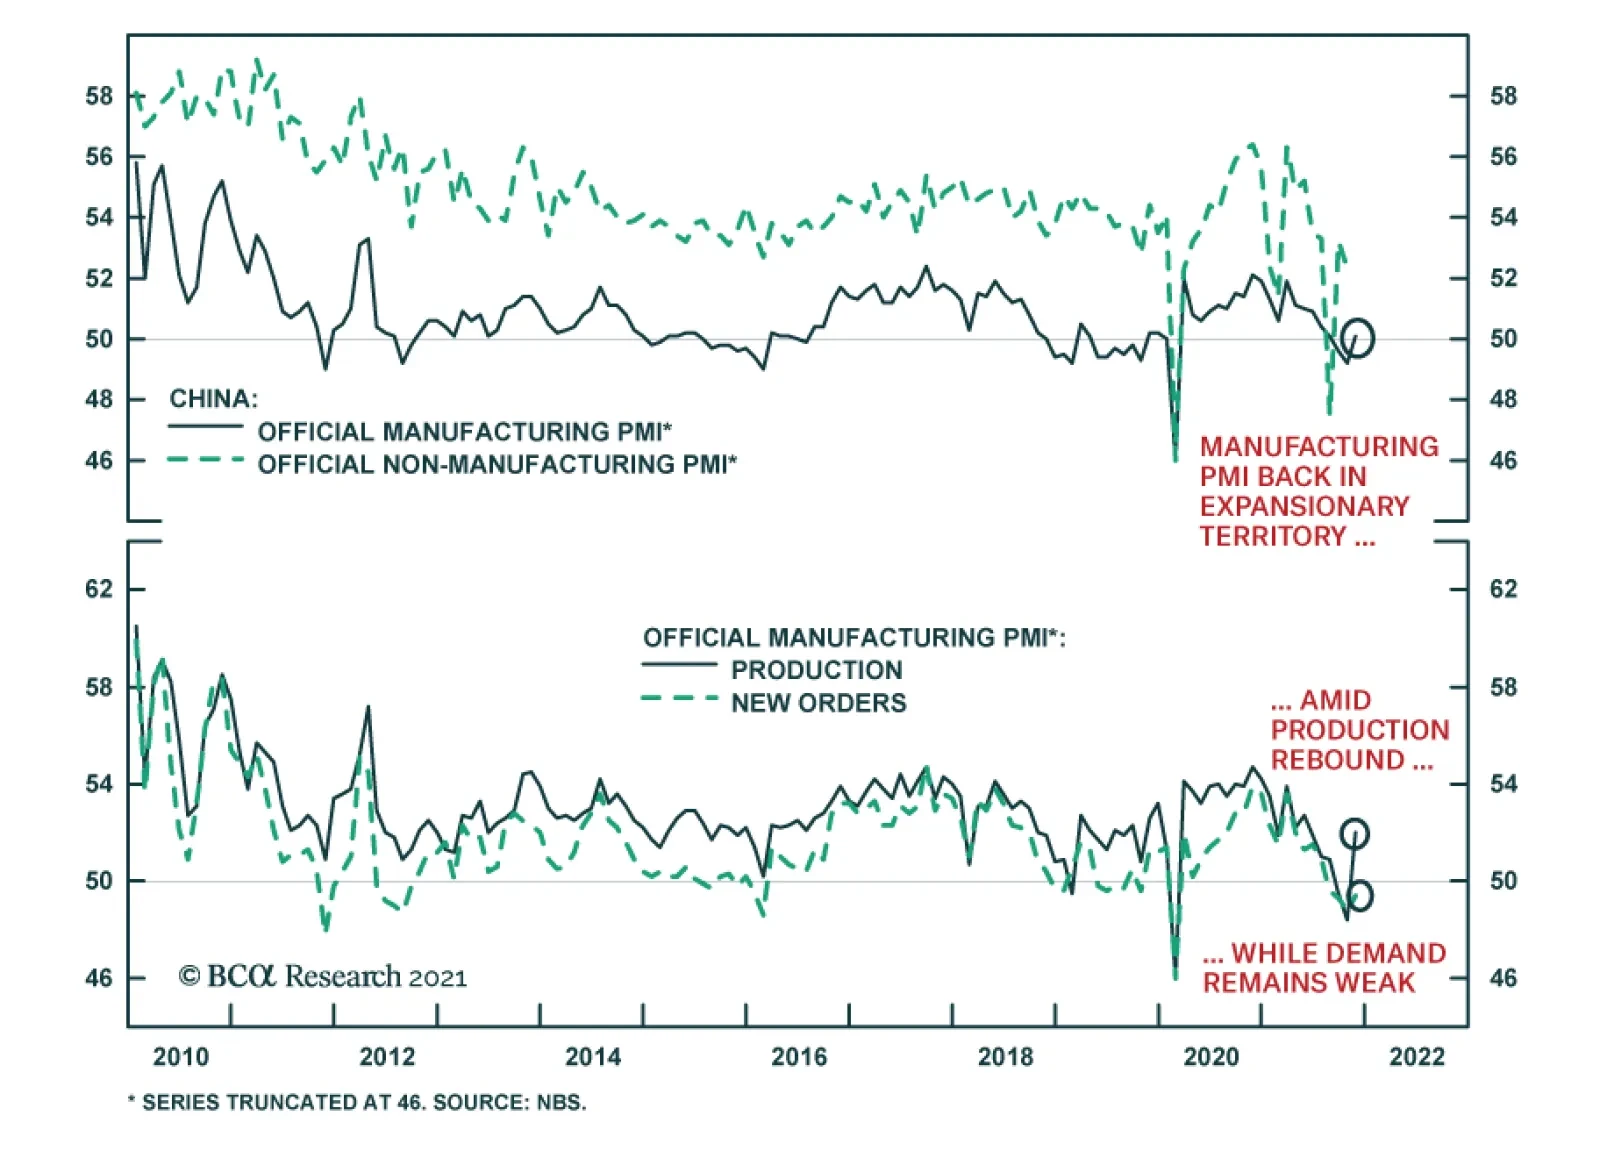
According to China’s National Bureau of Statistics, Chinese economic activity accelerated in November. The composite PMI increased by 1.4 percentage points to 52.2. This improvement reflects the manufacturing PMI’s rebound from 49.2 to 50.1 – above the…
Emerging market currencies have weakened sharply over the past two weeks. The JP Morgan EM currency index is now at lows last seen during the initial COVID-19 shock in spring 2020. The significant selloff raises the possibility that EM currencies could…

Chinese industrial profit growth accelerated to 24.6% y/y in October from the prior month’s 16.3% y/y. This brings the year-to-date increase in profits to 42.2% y/y for the first 10 months of the 2021. Higher commodity prices boosted Chinese industrial…
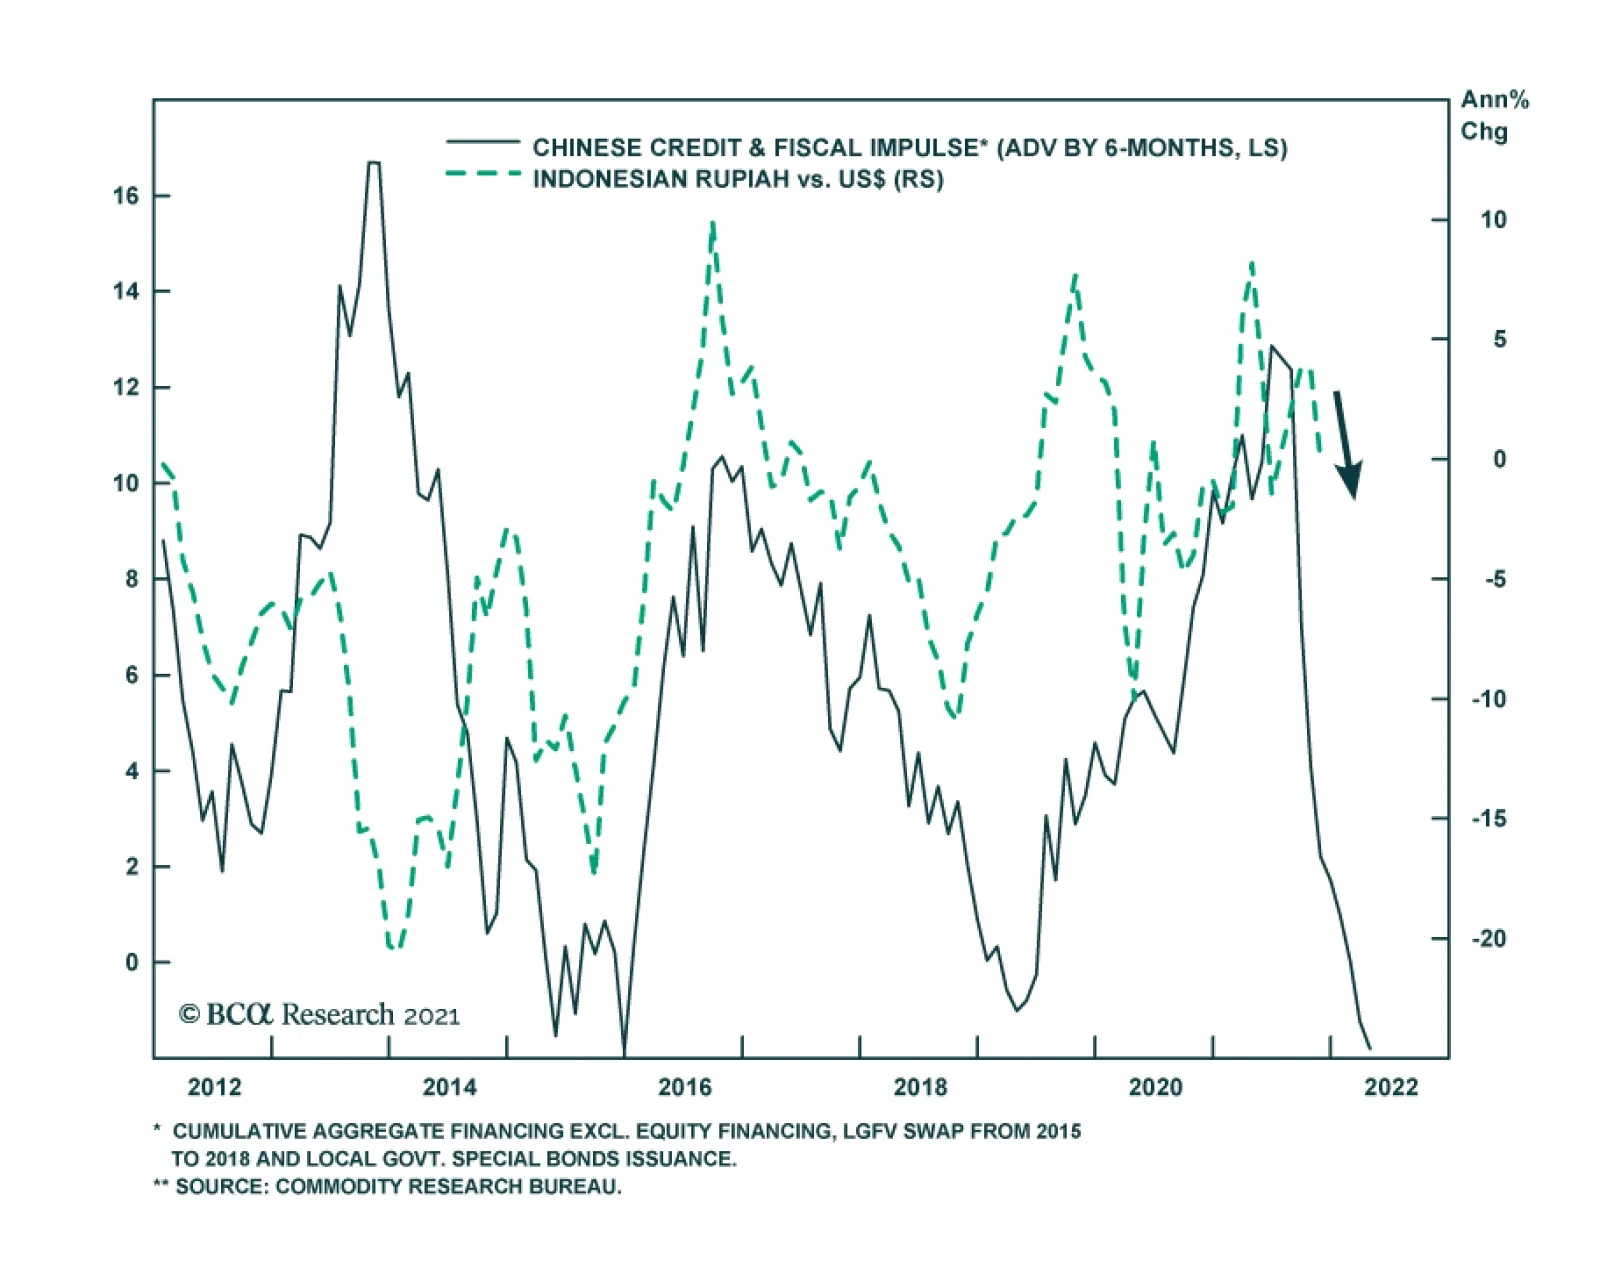
Indonesia’s domestic demand is struggling to recover in the face of a very tight policy setting. Domestic consumption and consumer confidence are languishing well below pre-pandemic levels. Real borrowing costs for the private sector are of the order of 10%.…
Turkey’s unorthodox macroeconomic policies have backfired again. After a 100-bps interest rate cut by the Central Bank of Turkey (CBTR) at their latest meeting, the Turkish lira has plunged by 15%. Still, the central bank of Turkey (CBTR) is refusing to…
Highlights Few emerging market peers have a track record of democracy like India does. Russia and others have long histories of political instability and one-man rule. Several large EMs have experienced stints of military rule in the post-WWII era. While India’s democratic credentials are real, these should not be exaggerated. India’s political system suffers from some structural and cyclical vulnerabilities. These imperfections deserve attention today, more than ever, given that India trades at a record premium to peers. From a strategic perspective, we remain Buyers of India. India’s democratic traditions will lend political stability as the country’s economic heft grows. However, on a time horizon, we recommend paring exposure to Indian assets. A loaded state election calendar awaits in 2022, which will be followed by crucial state elections in 2023 and general elections in 2024. While we expect the incumbent political party to retain power in 2024, history suggests that the road to general elections is paved with policy risks. Policymakers tend to shift attention from market friendly-reform to voter-friendly policies as these key state elections approach. Additionally, geopolitical risks for India are ascendant as dangerous transitions are underway to India’s west and east too. Feature
Chart 1
Investors regard India as being exceptionally well-off on political parameters. It is viewed by many as the blue-eyed boy of emerging market democracies. And for good reason. Despite its massive population and very low per capita incomes, India has remained a functional democracy for over seventy years. Democratic political regimes are a relatively new trend. The number of democracies began exceeding the number autocracies in the world only very recently in 2002 (Chart 1). India was one of the earliest adopters of this trend compared to emerging market peers. Its democratic traditions are so well-entrenched now that they are comparable to those of some of the most developed economies of the world (Chart 2). To add to these democratic credentials, every government at the national level in India has completed its full five-year term since 1999, thereby offering stability. Investors greatly value the political stability that India offers. While political stability is only one factor that investors consider, India has traded at a 28% premium relative to democracies and a 67% premium to non-democracies like Russia and China over the last decade (Chart 3).
Chart 2
Chart 3
In this report we highlight that while India’s democratic credentials are real, these should not be exaggerated. The political system in India is solid but far from perfect. It suffers from both structural and cyclical vulnerabilities. These imperfections deserve attention today more than ever, given that India trades at a record premium to peers (Chart 3). Also, a closer look at India’s political system is warranted given that both geopolitical and macroeconomic risks for India are ascendant. With India, the devil always lies in the details. India is the largest democracy of the world but is also one of the few large democracies that follows a first-past-the-post (FPTP) method of determining election winners and has no effective limit on the number of political parties that can contest elections. Most democracies, either combine an FPTP system with natural or legislative limit on the number of competing political parties (such as in the case of UK and US) or rely on a non-FPTP system, with specific vote thresholds to enter Parliament. The combination of an FPTP system along with a system that allows multiple small political parties to exist entails challenges and makes the system vulnerable to some structural policy problems that are often overlooked. These include: A Tendency To Go All-In: An FPTP system means that at an election, the contestant with the highest number of votes is declared the winner even if the victory margin is very low. For instance, the narrowest victory margin recorded at an Indian constituency-level election is a mere 9 votes! Such a system where the winner takes all, irrespective of the victory margin, creates perverse incentives for contesting candidates to go all-in on populism ahead of elections. Indian elections have thus seen candidates offer everything from food and free laptops, to free alcohol and hard cash, in a bid to woo voters in the run up to elections. Too Many Players Can Spoil The Election: An FPTP system alongside a multi-party system can lead to very high degrees of political competition. While competition is usually a virtue, very high levels of political competition tend to fragment the electorate. Owing to these reasons, political competition in India tends to be very high in general. For instance, the last two general elections in India saw 15 candidates contest from each constituency on average. This compares to an average number of contestants from each constituency being 5 for UK or 6 for Canada. The problem with this fragmentation is that the victorious politician may lack a strong popular mandate. Smaller Indian states bear the brunt of this problem. The smaller the state, the cost of the pre-election campaign is lower, so the number of contestants shoots up in smaller regions (Chart 4).
Chart 4
Rent-Seeking Becomes A Necessity: Such a system which combines FPTP and no major entry barriers for contestants arguably encourages rent-seeking behavior, which election winners frequently display. Populist spending promised by candidates to lure voters ahead of elections can be very high, especially when political competition is stiff. Winners then are keen to recover this “sunk cost” and to create a war chest for the next election. This prompts the rent-seeking that often becomes a necessity for candidates who run expensive election campaigns. To conclude, few emerging market peers have a sustained track record of democracy like India does. Russia and others have long histories of both political instability and one-man rule. Brazil, Turkey, Thailand, South Korea, Taiwan, and Indonesia have all experienced stints of military rule and revolutions in the post-WWII era. Whilst India’s political stability credentials are solid, the existence of high degrees of political competition alongside high degrees of social complexity will spawn both structural and cyclical policy risks in India. Navigating India’s Political Peculiarities It is heuristically convenient to assume that policy risks in India are uniform across time. However, in this report, we highlight that policy risks for India hardly tend to be the same through the five-year term of a political party in charge at the national level. The five-year term of any central government in India is paved with cyclical policy risks. The good news is that there is a method to the madness. We present a simple method to identify a “pattern” to the cyclical policy risks: We break down India’s general election cycle into a five-year sequence. Year 1 is defined as the year after a general election takes place (such as 2020) and Year 5 is defined as the year in which a general election takes place (such as 2019 or 2024). (See the Appendix for a quick overview of India’s political system.) Given that India has 28 states and a state government’s term lasts five years, about six state elections are held each year. After identifying this five-year sequence, we then identify specific states that become due for state elections during this five-year period. Such a characterization of India’s election cycle shows how the five-year period from one election to the other is hardly the same. In fact, it becomes clear how policy risks tend to be definitively elevated in the years leading up to a general election. Year 3 in such a framework sees elections in some of India’s largest states (size), India’s politically most sensitive states (sensitivity), and India’s socially most complex states (complexity). 2022 will mark the beginning of Year 3 of the current five-year cycle and will see: Size: The most loaded state election schedule which will affect more than a quarter of India’s population (Chart 5). Sensitivity: Elections take place in most of India’s northern region (Chart 6), which is a key constituency for the ruling Bhartiya Janata Party (BJP).
Chart 5
Chart 6
Complexity: Elections take place in some of the most socially conflict-prone states such as say Manipur (Chart 7). Year 3 of India’s cycle is also worth bracing for as it typically sees the policy machinery’s attention shift away from big-ticket reform to populism. This is probably because Year 4 sees some of the poorest states in India undergo elections (Chart 8) and then Year 5 sees a general election.
Chart 7
Chart 8
What becomes clear now is that India is set to enter the business-end of its five-year election cycle in 2022. So, what specific policy changes should investors expect? The Road To Elections … Is Paved With Policy Risks Irrespective of the political party in power at the centre, populism as a theme tends to become more defined in the two years leading to a general election in India. For instance, history suggests that government spending in the two years leading up to a general election tends to be higher than in the previous three years (Chart 9). The last time this theme did not play out was in the run up to the elections of 2014 when in fact the incumbent i.e., the Indian National Congress (INC) lost elections to the Bhartiya Janata Party (BJP). Distinct from the fiscal support to the economy that tends to rise in the run up to elections, it is notable that even money supply growth, inflation to an extent and even the pace of Rupee depreciation tends to be faster in India in the years leading up to a general election (Chart 10).
Chart 9
Chart 10
The run up to Year 3 and Year 4 of India’s election cycle also tends to see the announcement of voter-friendly policies that may not necessarily be market-friendly. Examples of this phenomenon include: Record Increase In Revenue Spends Ahead Of 1999 General Elections: In 1998 the-then Finance Minister oversaw a whopping 20% year-on-year increase in revenue expenditure. This is almost double the average growth rate of 13% seen in this metric over the last 25 years. Farm-loan Waiver Ahead of 2009 General Elections: In 2008 i.e., the year before the general elections of 2009, the Indian National Congress (INC)-led central government announced its decision to write off farm loans of about $15 billion (in inflation-adjusted terms today). Demonetization Decision Ahead Of 2017 Uttar Pradesh State Elections: The BJP-led central government announced its decision to demonetize 86% of currency in circulation in November 2016 in a bid to prove the government’s commitment to crackdown on black money. GST Rate Cuts Ahead Of 2017 Gujarat State Elections: The Goods and Services Tax (GST) council announced a cut in the GST rate for over 150 items in November 2017. This was ahead of Gujarat state elections that were due in December 2017. Such decisions are known to work with voters. The incumbent political party that announced these policy decisions, in each of the three cases cited above, won the elections that they subsequently contested. Just last week, the Indian Government decided to repeal farm sector reform related laws which it had announced a year ago. It is not entirely coincidental that this pro-voter decision has been announced just a few months ahead of critical state elections due in 2022. Key State Elections To Watch In 2022
Chart 11
State elections are due in seven states in India in 2022. State elections due in 2022 will have an indelible impact on India’s policy outlook for 2022 because the BJP is the incumbent party in most of these states and BJP’s popularity has suffered because of the pandemic (Chart 11). The government’s decision last week to roll back farm sector reform is a great example of this phenomenon. Of all the state elections due in 2022, the two key elections that will have the biggest bearing on the 2024 general elections will be the elections in Uttar Pradesh in February 2022 and in Gujarat in December 2022. BJP’s popularity in these states should be closely watched to get a better sense of the 2024 general election outcome. The BJP won about 80% of the cumulative seats these two states offer at the 2019 general elections. At the last state elections held in Uttar Pradesh in 2017, the BJP stormed into power in the state, winning 77% of seats. BJP’s entry into power there was symbolic as the road to New Delhi is said to pass through this state (Chart 12). Gujarat on the other hand has been a BJP stronghold and PM Modi began his political innings as the chief minister of this state. Despite being in power in Gujarat for over two decades, the BJP managed to retain power in this state at the last elections held in 2017 (Chart 13).
Chart 12
Chart 13
Accurate pre-poll data for these states will be available only closer to election day. Our early on-ground checks suggest that the BJP is set to almost certainly retain power in Uttar Pradesh in 2022. However, the BJP runs the risk of losing some vote share in Gujarat owing to the anti-incumbency effect it faces and owing to the rise of parties like the Aam Aadmi Party (AAP) in the state of Gujarat. Another tool that can be used to estimate the likely result of these two key state elections is the economic growth momentum in these states. State election results from 2021 suggest that this macro variable matters a great deal. While it is not the only variable that matters, the incumbent lost elections in large states in 2021 when growth decelerated excessively (Chart 14). For instance, in 2021, Tamil Nadu saw its GDP growth decelerate significantly but West Bengal saw its GDP growth decelerate by a lesser extent. Notably, the incumbent was displaced out of power in Tamil Nadu but managed to retain power in West Bengal possibly because of several factors including a lesser slowdown in economic growth (Chart 14). If GDP growth were to affect election outcomes in 2022 as well then, the incumbent i.e., the BJP, will comfortably retain power in Uttar Pradesh but may have to deal with the risk of losing some vote share in Gujarat. This is because economic growth accelerated in Uttar Pradesh over the last five years before the pandemic. GDP growth rates remained high in Gujarat but the pace of acceleration was weaker (Chart 15).
Chart 14
Chart 15
However, from the perspective of the general elections of 2024, BJP’s position in these two states remains fairly strong, and this is true even if it experiences minor setbacks in the upcoming state elections. National parties like the BJP tend to enjoy greater fervor amongst voters in general elections as opposed to state elections. It hence would take an earthquake defeat in these state elections to alter this assumption – an outcome which appears unlikely at this stage. The takeaway from the above is that investors must brace for the BJP pursuing populist policies over the next two years. In fact, we are increasingly convinced that the BJP government’s budget for FY23 (due to be announced on 1 February 2022) will see a marked increase in transfer payments for farmers in specific or low-income groups in general. The announcement of a brand-new program aimed at lifting incomes of India’s lowest economic strata cannot be ruled out. But from the perspective of the 2024 elections, the BJP appears well-placed to retain power. Investors will face negative policy turbulence in the short run but should maintain a base case of policy continuity over the long run. Investment Conclusions If You Are Playing A Long Game, Then Hold: From a strategic perspective, we remain Buyers of India. India’s democratic traditions will lend political stability as the country’s economic heft grows. Its democratic credentials will also yield geopolitical advantages as America aims to create an axis of democracies to contain autocratic regimes. It is notable that the US’s most recent alliance-formation efforts - such as the Quadrilateral Security Dialogue or the AUKUS nuclear submarine deal - involve some of the oldest democracies of the world. As India sheds its historical stance of neutrality, in favor of closer alignment with the US against China, its democratic credentials will help India deepen its engagement with geopolitically powerful democracies. If You Are Playing A Short Game, Then Fold: The Indian market appears priced for perfection today. We recommend paring exposure to Indian assets on a tactical time horizon. Historically India’s premium relative to emerging markets has shown some correlation with the BJP’s popularity (Chart 16). However, India’s premium relative to EMs has shot through the roof over the last year and hence even if BJP wins the Uttar Pradesh elections (our base case), then it is unclear if that victory will drive another bout of price-to-earnings re-rating for India. Moreover, as outlined, the road to state elections in 2022 will be paved with policy risks as the government prioritizes populism ahead of pro-market reform.
Chart 16
The BJP has managed to expand its influence in India over the last decade (Chart 17). But a unique problem now confronts Indian policymakers: while stock markets in India have risen almost vertically, wage inflation has collapsed (Chart 18). Additionally, India has administered a weak post-pandemic fiscal stimulus (Chart 19). We reckon that this fiscal restraint will be tested in the run up to key elections in 2022-23.
Chart 17
Chart 18
Chart 19
Unlike in developed economies, where fiscal stimulus is seen as pro-market because it suggests policymaking is improving and deflationary risks will be dispelled, fiscal stimulus can be market-negative in the context of an EM like India. Increases in populist spending can end up adding to existent inflationary pressures and hence can drive bond yields higher. Stock market earnings too may not end up getting a major boost on the back of increase in transfer payments to low-income groups. This is because the share of market cap accounted for by sectors which directly benefit from pro-poor spending, like Consumer Staples, has been drifting lower on Indian bourses from 10.8% in 2013 to 8.9% today. As we have been highlighting, distinct from policy risks that confront India on a tactical horizon, geopolitical risks confronting India are elevated too. Dangerous transitions are underway to India’s west (involving Pakistan and Afghanistan) as well as east (involving China). While China’s woes drive EM investors to India, any clashes with neighbors will create much better entry points into Indian stocks. Ritika Mankar, CFA Editor/Strategist ritika.mankar@bcaresearch.com Appendix: An Overview Of India’s Political System India follows a parliamentary model of democracy with a federal structure where the government at the centre as well as state level is elected for a period of five years. The central government of India is formed through general elections that are held every five years. Power is held by a political party (or a coalition of parties) that can secure and maintain a simple majority in the Lower House (or Lok Sabha) through this five-year term. India also constitutes 28 states, each with its own legislative assembly. Each state government is formed through a state election held every five years. Much like at the centre, power is held by a political party that can maintain a simple majority at the legislative assembly for this five-year term.
Dear Client, Next week, we will be sending you BCA Research’s Annual Outlook, featuring long-time BCA client Mr. X, who visits towards the end of each year to discuss the economic, financial and commodity market outlook for the year ahead. All the best, Bob Ryan Chief Commodity & Energy Strategist Highlights Local politics in Chile and Peru will become critical to the global energy transition, particularly as regards the supply side of the most critical metal for this transition: copper. Chile's runoff elections next month will pit a former congressman portrayed as a hard-right candidate against a protest leader-turned-legislator in a battle for the presidency of a country that accounts for ~ 30% of global copper mining output. In Peru, which accounts for just over 10% of global copper production, the left-of-center administration indicated it will mediate talks to close two gold and silver mines, despite protests from its corporate owners. Tightly balanced supply-demand fundamentals will keep inventories of refined copper extremely low, which will slow the early-stage global transition to renewable power generation until these stocks can be replenished (Chart of the Week). Chinese copper smelters reportedly are collaborating to move refined metal to LME-approved warehouses to restock depleted inventories. While this could reduce backwardations in futures markets, it has not overly depressed flat-price levels, which are within ~ 7% of all-time highs of $4.78/lb ($10,533/MT) put up in May. Fundamentally, base metals – especially copper and aluminum – will remain tight, which supports our long positions in the S&P GSCI and the COMT ETF. Feature Despite a marked deceleration of growth in China brought on by fuel and power shortages, and a strong USD creating tighter financial conditions globally, copper prices – and base metals generally – remain well supported, even as speculative interest, for the most part, has waned this year (Chart 2). Chart of the WeekTight Copper Inventories Support Prices, Backwardation
Tight Copper Inventories Support Prices, Backwardation
Tight Copper Inventories Support Prices, Backwardation
Chart 2Specs Back The Truck Up For Copper Spec Interest Wanes
Specs Back The Truck Up For Copper Spec Interest Wanes
Specs Back The Truck Up For Copper Spec Interest Wanes
Copper and the other metals are well bid because of tight fundamentals – the level of demand has been and remains above the level of supply globally (Chart3). This will continue to exert pressure on inventories and force a re-shuffling of stocks globally – likely from China bonded warehouses to the LME (Chart 4). The London Metal Exchange (LME) was forced to take extraordinary measures to maintain orderly markets and has prompted Chinese smelters to collaborate on shifting material to LME sheds in Asia.1 However, much more refined copper will have to be shipped to these sheds to keep markets from launching into another steep backwardation on the LME similar to last month's $1,100/MT first-to-third-month spread last month – an indication of desperation on the buy side. Chart 3Low Copper Stocks Will Persist
Low Copper Stocks Will Persist
Low Copper Stocks Will Persist
That said, if the only thing that improves LME stocks is a re-shuffle from existing inventories, the net position of the world will largely remain unchanged over time. Demand will be met with inventory draw-downs, but supply will not have increased, which, at the end of the day, means markets will continue to tighten. Chart 4Globally, Exchange Warehouses Tighten
Globally, Exchange Warehouses Tighten
Globally, Exchange Warehouses Tighten
Chile, Peru Politics Become Fundamental Geopolitics always is at the heart of commodity markets: Who's in power and the agendas being pursued matter so much, because, in many cases, unrefined exports of raw commodities sustain governments and important elements of economies in many states. This is becoming clear in Chile and Peru, two states with contestable elections, where the outcomes can profoundly affect the supply side of global fundamentals. Earlier this year, it looked like Chile's presidential and congressional elections would favor left-of-center candidates who did not campaign on market-oriented policies. National elections this past weekend resulted in a run-off that will be held 19 December, as neither the left- nor right-of-center candidates polled an absolute majority. Right-of-center candidates also polled unexpectedly well in congressional elections. This likely translates into something resembling the divided government in the US, which means neither side will be able to get all it wants through the legislature. In the lead-up to the Constitutional re-write expected following elections, the agendas of the left and right are markedly opposed. On the left, greater government involvement in the resources sector has been part of the campaigning, while on the right increased private investment in the stated-owned Codelco, the largest copper producer in the world, is advocated. Both sides also disagree on changes in taxes and royalties, which obviously is of great concern to investors and copper-market participants.2 Chile also is a world-class supplier of lithium, zinc, gold, silver and lead, so it's not just copper markets following developments there with concern. In Peru, the country's newly sworn-in prime minister said she is willing to broker talks on shutting down gold and silver mines in communities where residents have been protesting as soon as possible. This drew a heated reply from mining interests immediately. Peru is the second largest copper miner in the world behind Chile, and the treatment of the owner of the disputed gold and silver mines, Hochschild Mining, is being followed closely. Base and precious metals markets are being forced to factor in a new set of political dynamics, as local political tensions spill into the supply side, causing overall political uncertainty in critical mining states to increase. This will restrain investment, which bodes ill for the global renewable- energy transition. Copper Defies Stronger USD Despite a stronger-than-expected USD this year – boosted most recently by the re-appointment of Jay Powell as Fed Chair and the elevation of Lael Brainard as Vice Chair – copper and base metals have held up well.3 Generally, a strong dollar is bearish for base metals prices (Chart 5), and copper especially (Chart 6). A stronger USD tightens global financial conditions, which, not unexpectedly, is bearish for copper; however, as Chart 7 shows, this effect also has been overcome by the tight copper fundamentals globally.4 We remain bearish the USD going into next year, in line with our colleagues at BCA's Foreign Exchange Strategy. Massive fiscal stimulus in the US in particular, along with continued monetary accommodation from the Fed to fund the deficits this will produce, is expected to weaken the dollar and boost trade. Chart 5Base Metals Defy Strong USD
Base Metals Defy Strong USD
Base Metals Defy Strong USD
Chart 6Copper Defies USD Strength, Boosted By Cyclicals Performance
Copper Defies USD Strength, Boosted By Cyclicals Performance
Copper Defies USD Strength, Boosted By Cyclicals Performance
Chart 7Copper Overcomes Tighter Global Financial Conditions
Copper Overcomes Tighter Global Financial Conditions
Copper Overcomes Tighter Global Financial Conditions
In a recent simulation, we show a 10% fall in the USD and a 5% pick-up in EM imports, along with continued strong performance from cyclicals would lift copper prices to $5.30/lb on the CME Comex by year-end 2022, in our estimation (Chart 8). Chart 8Weaker USD, Stronger EM Imports, Cyclical Strength Would Booster Copper.
Weaker USD, Stronger EM Imports, Cyclical Strength Would Booster Copper.
Weaker USD, Stronger EM Imports, Cyclical Strength Would Booster Copper.
Investment Implications Base metals markets, particularly copper, have withstood tightening financial conditions brought on by a strong USD, a sharp slowdown in Chinese growth brought on by an energy shortage and rising interest rates. This is largely due to extremely tight supply-demand fundamentals, which continue to keep global inventories under pressure. Copper, metals generally, and precious metals also will get a lift from local political tensions spilling into the supply side of markets as overall political uncertainty in critical mining states restrains investment. We remain long the S&P GSCI and the COMT ETF, anticipating higher copper prices and a return to steeper backwardation. Robert P. Ryan Chief Commodity & Energy Strategist rryan@bcaresearch.com Ashwin Shyam Research Associate Commodity & Energy Strategy ashwin.shyam@bcaresearch.com Paula Struk Research Associate Commodity & Energy Strategy paula.struk@bcaresearch.com Commodities Round-Up Energy: Bullish Oil markets looked right through the announcement the US will tap its Strategic Petroleum Reserve (SPR) for 50mm barrels beginning next month, rallying 3.3% to $82.31/bbl by Tuesday's close following the announcement (Chart 9). Under a Congressionally mandated release, the 18mm barrels already authorized had been factored into market balances. The incremental 32mm barrels of crude oil being supplied to the market will be released to successful bidders between 16Dec21 and 30Apr22. These volumes will be repaid during US fiscal years 2022-24, with a volumetric premium added to the initial volume lifted by the successful bidders, which will be specified in the terms of the crude-oil loan. The US fiscal year begins on 1 October. The longer it takes to return the crude oil back to the SPR, the higher the premium volume of crude oil will be required, per the SPR's terms and conditions. The Biden administration succeeded in persuading the governments of China, India, Japan, South Korea and the UK to release unspecified volumes from their SPRs as well. Although volume commitments and release dates were not included in the press release from the White House some 20mm to 30mm barrels reportedly could be supplied from these SPRs. Precious Metals: Bullish Gold prices fell violently, and the US dollar rose following Jay Powell’s re-nomination to Fed chair (Chart 10). Markets assume the Fed will stay the course on its current monetary policy, as opposed to loosening further, which would have lifted gold prices on the back of higher inflation expectations. We believe interest rate hikes will not be brought forward unless inflation expectations become unhinged. In the short run, however, high fuel prices and logistical bottlenecks will continue to feed into higher inflation, implying the Fed will remain behind the curve. Both Powell and Lael Brainard, who was nominated as vice chair of the Fed, stressed vigilance against inflation. In his statement following Biden's decision to re-appoint him as Fed Chair, Powell noted: "Today, the economy is expanding at its fastest pace in many years, carrying the promise of a return to maximum employment. … We know that high inflation takes a toll on families, especially those less able to meet the higher costs of essentials like food, housing, and transportation. We will use our tools both to support the economy and a strong labor market, and to prevent higher inflation from becoming entrenched." Brainard's remarks struck a similar tone. Chart 9
Brent Prices Are Going Up...
Brent Prices Are Going Up...
Chart 10
...As Well As Gold Prices
...As Well As Gold Prices
Footnotes 1 Please see Column: All eyes on China as LME copper spreads collapse: Andy Home, published by reuters.com 18 November 2021. 2 Please see Chile elections may impact a third of the world’s copper supply, published by mining.com on November 19, 2021. 3 Please see Precious Metals commentary in the Commodity Round-Up section. 4 The model shown in Chart 7 also includes iron ore and steel traded in China as explanatory variables. It is noteworthy that copper prices remain resilient to a collapse in iron ore prices brought on by forced closures in China of steel mills to conserve coal and natural gas supplies for human-needs use going into what is expected to be a colder-than-normal winter on the back of a second La Niña in the Northern Hemisphere. Please see our report published 30 September entitled La Niña And The Energy Transition for additional discussion. Investment Views and Themes Strategic Recommendations
The Mexican peso has weakened sharply vis-à-vis the USD over the past three weeks, dropping to its lowest level since early March. It was the second worst performing emerging market currency on Wednesday, falling nearly 1% on the day. Three forces are…