Emerging Markets
The virtual summit between Presidents Joe Biden and Xi Jinping on Monday evening did not produce a major change in the bilateral relationship. President Biden initiated the meeting with the objective of ensuring that any misunderstanding between the two…
October new home prices fell for the second consecutive month in China (see The Numbers). Given how highly leveraged the Chinese property sector is, a continued decline in home prices would be an unwelcome development for Chinese policymakers. It raises the…
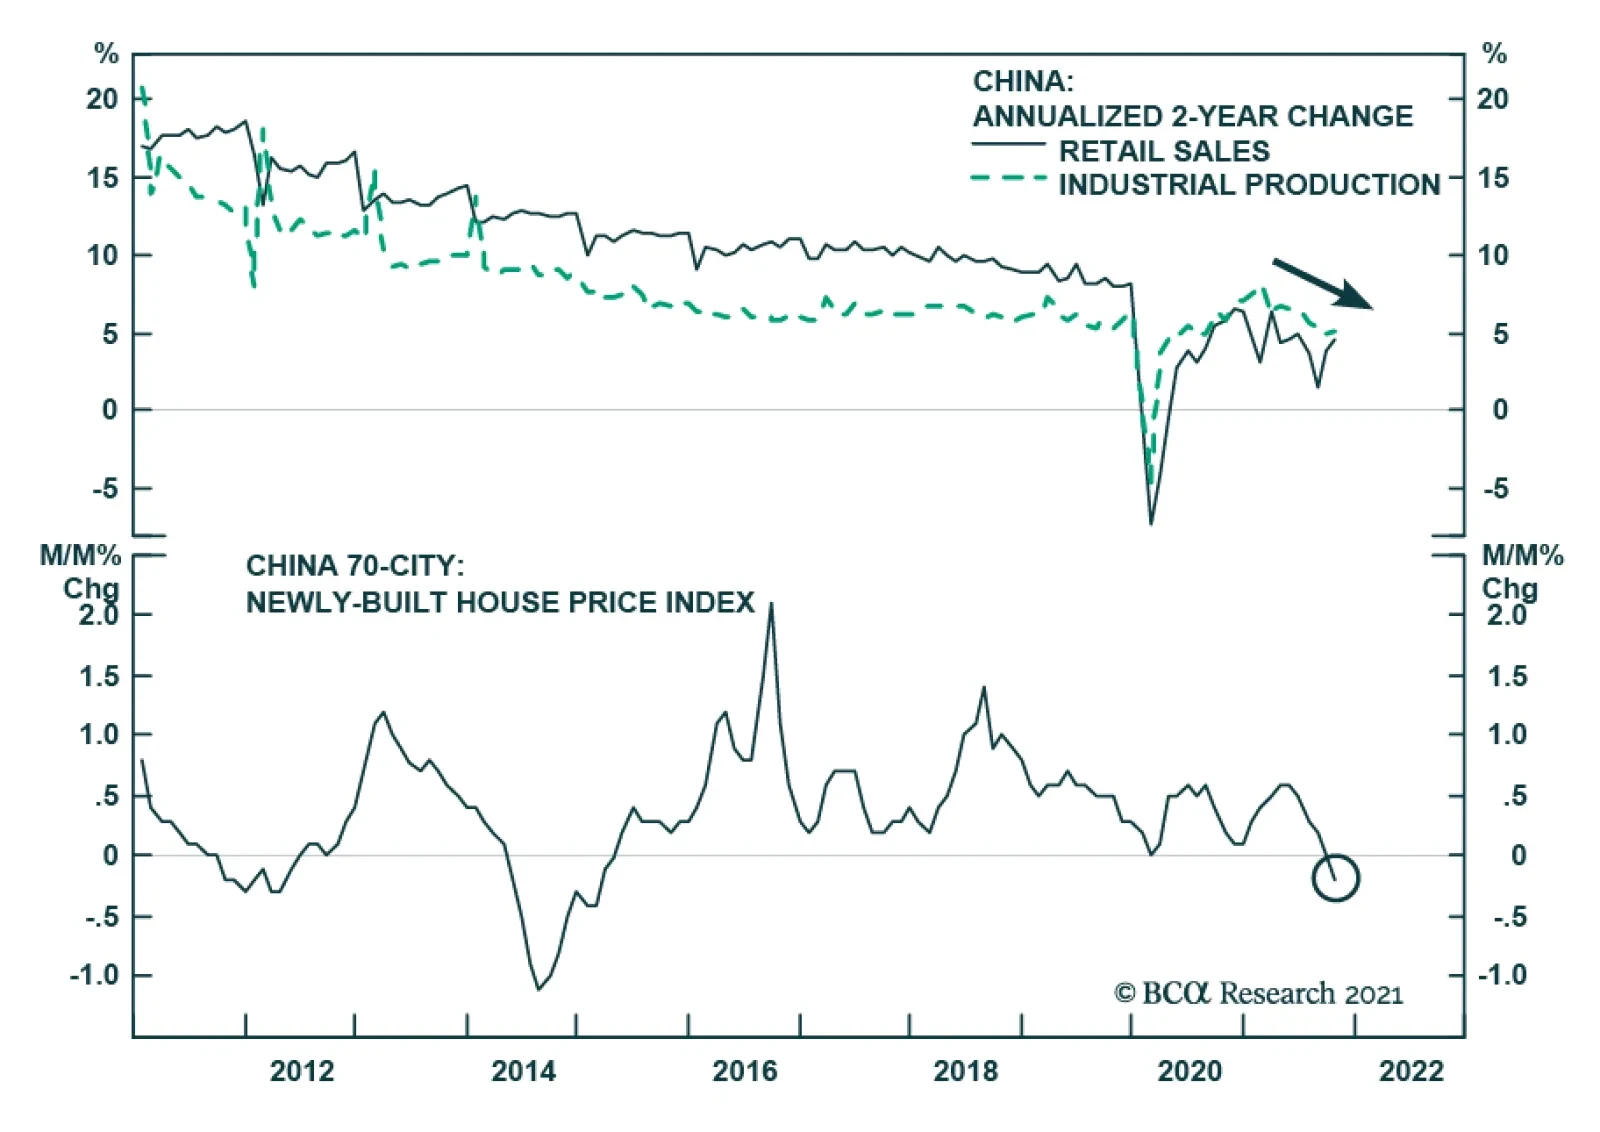
Chinese retail sales and industrial production data for October surprised to the upside. Retail sales growth accelerated slightly from 4.4% to 4.9% y/y and beat expectations of a slowdown to 3.7%. Similarly, industrial production expanded by 3.5% y/y versus…
The Bank of Mexico raised rates by 25 bps on Thursday, marking the fourth consecutive rate increase this year and bringing the benchmark rate to 5%. These hikes come as the central bank attempts to temper rising inflation. At 6.24% y/y, CPI headline inflation…

Highlights Geopolitical conflicts point to energy price spikes and could add to inflation surprises in the near term. However, US fiscal drag and China’s economic slowdown are both disinflationary risks to be aware of. Specifically, energy-producers like Russia and Iran gain greater leverage amid energy shortages. Europe’s natural gas prices could spike again. Conflict in the Middle East could disrupt oil flows. President Biden’s $1.75 trillion social spending bill is a litmus test for fiscal fatigue in developed markets. It could fail, and even assuming it passes it will not prevent overall fiscal drag in 2022-23. However, it is inflationary over the long run. China’s slowdown poses the chief disinflationary risk. But we still think policy will ease to avoid an economic crash ahead of the fall 2022 national party congress. We are closing this year’s long value / short growth trade for a loss of 3.75%. Cyclical sectors ended up being a better way to play the reopening trade. Feature Equity markets rallied in recent weeks despite sharp upward moves in core inflation across the world (Chart 1). Inflation is fast becoming a popular concern and we see geopolitical risks that could drive headline inflation still higher in the short run. We also see underrated disinflationary factors, namely China’s property sector distress and economic slowdown. Several major developments have occurred in recent weeks that we will cover in this report. Our conclusions: Biden’s domestic agenda will pass but risks are high and macro impact is limited. Congress passed Biden’s infrastructure deal and will probably still pass his signature social spending bill, although inflation is creating pushback. Together these bills have little impact on the budget deficit outlook but they will add to inflationary pressures. Energy shortages embolden Russia and Iran. Winter weather is unpredictable, the energy crisis may not be over. But investors are underrating Russia’s aggressive posture toward the West. Any conflict with Iran could also cause oil disruptions in the near future. US-China relations may improve but not for long. A bilateral summit between Presidents Joe Biden and Xi Jinping will not reduce tensions for very long, if at all. Climate change cooperation is an insufficient basis to reverse the cold war-style confrontation over the long run. Chart 1Inflation Rattles Policymakers
Inflation Rattles Policymakers
Inflation Rattles Policymakers
The investment takeaway is that geopolitical tensions could push energy prices still higher in the short term. Iran and Russia need to be monitored. However, China’s economic slowdown will weigh on growth. China poses an underrated disinflationary risk to our views. US Congress: Bellwether For Fiscal Fatigue While inflation is starting to trouble households and voters, investors should bear in mind that the current set of politicians have long aimed to generate an inflation overshoot. They spent the previous decade in fear of deflation, since it generated anti-establishment or populist parties that threatened to disrupt the political system. They quietly built up an institutional consensus around more robust fiscal policy and monetary-fiscal coordination. Now they are seeing that agenda succeed but are facing the first major hurdle in the form of higher prices. They will not simply cut and run. Inflation is accompanied by rising wages, which today’s leaders want to see – almost all of them have promised households a greater share of the fruits of their labor, in keeping with the new, pro-worker, populist zeitgeist. Real wages are growing at 1.1% in the US and 0.9% across the G7 (Chart 2). Even more than central bankers, political leaders are focused on jobs and employment, i.e. voters. Yet the labor market still has considerable slack (Chart 3). Almost all of the major western governments have been politically recapitalized since the pandemic, either through elections or new coalitions. Almost all of them were elected on promises of robust public investment programs to “build back better,” i.e. create jobs, build infrastructure, revitalize industry, and decarbonize the energy economy. Thus while they are concerned about inflation, they will leave that to central banks, as they will be loathe to abandon their grand investment plans. Chart 2Higher Wages: Real Or Nominal?
Higher Wages: Real Or Nominal?
Higher Wages: Real Or Nominal?
Still, there will be a breaking point at which inflation forces governments to put their spending plans on hold. The US Congress is the immediate test of whether today’s inflation will trigger fiscal fatigue and force a course correction. Chart 3Policymakers Fear Populism, Focus On Employment
Policymakers Fear Populism, Focus On Employment
Policymakers Fear Populism, Focus On Employment
President Biden’s $550 billion infrastructure bill passed Congress last week and will be signed into law around November 15. Now he is worried that his signature $1.75 trillion social spending bill will falter due to inflation fears. He cannot spare a single vote in the Senate (and only three votes in the House of Representatives). Odds that the bill fails are about 35%. Democratic Party leaders will not abandon the cause due to recent inflation prints. They see a once-in-a-generation opportunity to expand the role of government, the social safety net, and the interests of their constituents. If they miss this chance due to inflation that ends up being transitory then they will lose the enthusiastic left wing of the party and suffer a devastating loss in next year’s midterm elections, in which they are already at a disadvantage. Biden’s social bill is also likely to pass because the budget reconciliation process necessary to pass the bill is the same process needed to raise the national debt limit by December 3. A linkage of the two by party leaders would ensure that both pass … and otherwise Democrats risk self-inflicting a national debt default. The reconciliation bill is more about long-term than short-term inflation risk. The bill does not look to have a substantial impact on the budget outlook: the new spending is partially offset by new taxes and spread out over ten years. The various legislative scenarios look virtually the same in our back-of-the-envelope budget projections (Chart 4).
Chart 4
However, given that the output gap is virtually closed, this bill combined with the infrastructure bill will add to inflationary pressures. The fiscal drag will diminish by 2024, not coincidentally the presidential election year 2024, not coincidentally the presidential election year. The deficit is not expected to increase or decrease substantially between 2023 and 2024. From then onward the budget deficit will expand. The increased government demand for goods and services and the increased disposable income for low-earning families will add to inflationary pressures. Other developed markets face a similar situation: inflation is picking up, but big spending has been promised and normalizing budgets will marginally weigh on growth in the next few years (Chart 5). True, growth should hold up since the private economy is rebounding in the wake of the pandemic. But politicians will not be inclined to renege on campaign promises of liberal spending in the face of fiscal drag. The current crop of leaders is primed to make major public investments. This is true of Germany, Japan, Canada, and Italy as well as the United States. It is partly true in France, where fiscal retrenchment has been put on hold given the presidential election in the spring. The effect will be inflationary, especially for the US where populist spending is more extravagant than elsewhere.
Chart 5
The long run will depend on structural factors and how much the new investments improve productivity. Bottom Line: A single vote in the US Senate could derail the president’s social spending bill, so the US is now the bellwether for fiscal fatigue in the developed world. Biden is likely to pass the bill, as global fiscal drag is disinflationary over the next 12 months. Yet inflation could stay elevated for other reasons. And this fiscal drag will dissipate later in the business cycle. Russia And Iran Gain Leverage Amid Energy Crunch The global energy price spike arose from a combination of structural factors – namely the pandemic and stimulus. It has abated in recent weeks but will remain a latent problem through the winter season, especially if La Niña makes temperatures unusually cold as expected. Rising energy prices feed into general producer prices, which are being passed onto consumers (Chart 6). They look to be moderating but the weather is unpredictable. There is another reason that near-term energy prices could spike or stay elevated: geopolitics. Tight global energy supply-demand balances mean that there is little margin of safety if unexpected supply disruptions occur. This gives greater leverage to energy producers, two of which are especially relevant at the moment: Russia and Iran. Russia’s long-running conflict with the West is heating up on several fronts, as expected. Russia may not have caused the European energy crisis but it is exacerbating shortages by restricting flows of natural gas for political reasons, as it is wont to do (Chart 7). Moscow always maintains plausible deniability but it is currently flexing its energy muscles in several areas: Chart 6Energy Price Depends On Winter ... And Russia/Iran!
Energy Price Depends On Winter ... And Russia/Iran!
Energy Price Depends On Winter ... And Russia/Iran!
Ukraine: Russia has avoided filling up and fully utilizing pipelines and storage facilities in Ukraine, where the US is now warning that Russia could stage a large military action in retaliation for Ukrainian drone strikes in the still-simmering Russia-Ukraine war. Belarus: Russia says it will not increase the gas flow through the major Yamal-Europe natural gas pipeline in 2022 even as Belarus threatens to halt the pipeline’s operation entirely. Belarus, backed by Russia, is locked in a conflict with Poland and the EU over Belarus’s funneling of migrants into their territory (Chart 8). The conflict could lead not only to energy supply disruptions but also to a broader closure of trade and a military standoff.1 Russia has flown two Tu-160 nuclear-armed bombers over Belarus and the border area in a sign of support. Moldova: Russia is withholding natural gas to pressure the new, pro-EU Moldovan government.
Chart 7
Chart 8
Russia’s main motive is obvious: it wants Germany and the EU to approve and certify the new Nord Stream II pipeline. Nord Stream II enables Germany and Russia to bypass Ukraine, where pipeline politics raise the risk of shortages and wars. Lame duck German Chancellor Angela Merkel worked with Russia to complete this pipeline before the end of her term, convincing the Biden administration to issue a waiver on congressional sanctions that could have halted its construction. However, two of the parties in the incoming German government, the Greens and the Free Democrats, oppose the pipeline. While these parties may not have been able to stop the pipeline from operating, Russia does not want to take any chances and is trying to force Germany’s and the EU’s hand. The energy crisis makes it more likely that the pipeline will be approved, since the European Commission will have to make its decision during a period when cold weather and shortages will make it politically acceptable to certify the pipeline.2 The decision will further drive a wedge between Germany and eastern EU members, which is what Russia wants. EU natural gas prices will likely subside sometime next year and will probably not derail the economic recovery, according to both our commodity and Europe strategists. A bigger and longer-lasting Russian energy squeeze would emerge if the Nord Stream II pipeline is not certified. This is a low risk at this point but the next six months could bring surprises. More broadly, the West’s conflict with Russia can easily escalate from here. First, President Vladimir Putin faces economic challenges and weak political support. He frequently diverts popular attention by staging aggressive moves abroad. There is no reason to believe his post-2004 strategy of restoring Russia’s sphere of influence in the former Soviet space has changed. High energy prices give him greater leverage even aside from pipeline coercion – so it is not surprising that Russia is moving troops to the Ukraine border again. Growing military support for Belarus, or an expanded conflict in Ukraine, are likely to create a crisis now or later. Second, the US-Germany agreement to allow Nord Stream II explicitly states that Russia must not weaponize natural gas supply. This statement has had zero effect so far. But when the energy shortage subsides, the EU could pursue retaliatory measures along with the United States. Of course, Russia has been able to weather sanctions. But tensions are already escalating significantly. After Russia, Iran also gains leverage during times of tight energy supplies. With global oil inventories drawing down, Iran is in the position to inflict “maximum pressure” on the US and its allies, a role reversal from the 2017-20 period in which large inventories enabled the US to impose crippling sanctions on Iran after pulling out of the 2015 nuclear deal (Chart 9). Iran is rapidly advancing on its nuclear program and a new round of diplomatic negotiations may only serve to buy time before it crosses the “breakout” threshold of uranium enrichment capability as early as this month or next. In a recent special report we argued that there is a 40% chance of a crisis over Iran in the Middle East. Such a crisis could ultimately lead to an oil shock in the Persian Gulf or Strait of Hormuz. Chart 9Now Iran Can Use 'Maximum Pressure'
Now Iran Can Use 'Maximum Pressure'
Now Iran Can Use 'Maximum Pressure'
Bottom Line: Russia’s natural gas coercion of Europe could keep European energy prices high through March or May. More broadly Russia’s renewed tensions with the West confirm our view that oil producers gain geopolitical leverage amid the current supply shortages. Iran also gains leverage and its conflict with the US could lead to global oil supply disruptions anytime over the next 12 months. Until Nord Stream II is certified and a new Iranian nuclear agreement is signed, there are two clear sources of potential energy shocks. Moreover in today’s inflationary context there is limited margin of safety for unexpected supply disruptions regardless of source. Xi’s Historical Rewrite China continues to be a major source of risk for the global economy and financial markets in the lead-up to the twentieth national party congress in fall 2022. While Chinese assets have sold off this year, global risk assets are still vulnerable to negative surprises from China. The five-year political reshuffle in 2022 is more important than usual since President Xi Jinping was originally supposed to step down but will instead stick around as leader for life, like China’s previous strongmen Mao Zedong and Deng Xiaoping.3 Xi’s rejection of term limits became clear in 2017 and is not really news. But Xi will fortify himself and his faction in 2022 against any opposition whatsoever. He is extremely vigilant about any threats that could disrupt this process, whether at home or abroad. The Communist Party’s sixth plenary session this week highlights both Xi’s success within the Communist Party and the sensitivity of the period. Xi produced a new “historical resolution,” or interpretation of the party’s history, which is only the third such resolution. A few remarks on this historical resolution are pertinent: Mao’s resolution: Chairman Mao wrote the first such resolution in 1945 to lay down his version of the party’s history and solidify his personal control. It is naturally a revolutionary leftist document. Deng’s revision of Mao: General Deng Xiaoping then produced a major revision in 1981, shortly after initiating China’s economic opening and reform. Deng’s interpretation aimed to hold Mao accountable for “gross mistakes” during the Cultural Revolution and yet to recognize the Communist Party’s positive achievements in founding the People’s Republic. His version gave credit to the party and collective leadership rather than Mao’s personal rule. Two 30-year periods: The implication was that the party’s history should be divided into two thirty-year periods: the period of foundations and conflict with Mao as the party’s core and the period of improvement and prosperity with Deng as the core. Jiang’s support of Deng: Deng’s telling came under scrutiny from new leftists in the wake of Tiananmen Square incident in 1989. But General Secretary Jiang Zemin largely held to Deng’s version of the story that the days of reform and opening were a far better example of the party’s leadership because they were so much more stable and prosperous.4 Xi’s reaction to Jiang and Deng: Since coming to power in 2012, Xi Jinping has shown an interest in revising the party’s official interpretation of its own history. The central claim of the revisionists is that China could never have achieved its economic success if not for Mao’s strongman rule. Mao’s rule and the Communist Party’s central control thus regain their centrality to modern China’s story. China’s prosperity owes its existence to these primary political conditions. The two periods cannot be separated. Xi’s synthesis of Deng and Mao: Now Xi has written himself into that history above all other figures – indeed the communique from the Sixth Plenum mentions Xi more often than Marx, Mao, or Deng (Chart 10). The implication is that Xi is the synthesis of Mao and Deng, as we argued back in 2017 at the end of the nineteenth national party congress. The synthesis consists of a strongman who nevertheless maintains a vibrant economy for strategic ends.
Chart 10
What are the practical policy implications of this history lesson? Higher Country Risk: China’s revival of personal rule, as opposed to consensus rule, marks a permanent increase in “country risk” and political risk for investors. Autocratic governments lack institutional guardrails (checks and balances) that prevent drastic policy mistakes. When Xi tries to step down there will probably be a succession crisis. Higher Macroeconomic Risk: China is more likely to get stuck in the “middle-income trap.” Liberal or pro-market economic reform is de-emphasized both in the new historical resolution and in the Xi administration’s broader program. Centralization is already suppressing animal spirits, entrepreneurship, and the private sector. Higher Geopolitical Risk: The return to autocracy and the withdrawal from economic liberalism also entail a conflict with the United States, which is still the world’s largest economy and most powerful military. The US is not what it once was but it will put pressure on China’s economy and build alliances aimed at strategic containment. Bottom Line: China is trying to escape the middle-income trap, like Taiwan, Japan, and South Korea, but it is trying to do so by means of autocracy, import substitution, and conflict with the United States. These other Asian economies improved productivity by democratizing, embracing globalization, and maintaining a special relationship with the United States. China’s odds of succeeding are low. China will focus on power consolidation through fall 2022 and this will lead to negative surprises for financial markets. China Slowdown: The Disinflationary Risk While it is very unlikely that Xi will face serious challenges to his rule, strange things can happen at critical junctures. Therefore the regime will be extremely alert for any threats, foreign or domestic, and will ultimately prioritize politics above all other things, which means investors will suffer negative surprises. The lingering pandemic still poses an inflationary risk for the rest of the world while the other main risk is disinflationary: Inflationary Risk – Zero COVID: The “Covid Zero” policy of attempting to stamp out any trace of the virus will still be relevant at least over the next 12 months (Chart 11). Clampdowns serve a dual purpose since the Xi administration wants to minimize foreign interference and domestic dissent before the party congress. Hence the global economy can suffer more negative supply shocks if ports or factories are closed. Inflationary Risk – Energy Closures: The government is rationing electricity amid energy shortages to prioritize household heating and essential services. This could hurt factory output over the winter if the weather is bad. Disinflationary Risk – Property Bust: The country is still flirting with overtightening monetary, fiscal, and regulatory policies. Throughout the year we have argued that authorities would avoid overtightening. But China is still very much in a danger zone in which policy mistakes could be made. Recent rumors suggest the government is trying to “correct the overcorrection” of regulatory policy. The government is reportedly mulling measures to relax the curbs on the property sector. We are inclined to agree but there is no sign yet that markets are responding, judging by corporate defaults and the crunch in financial conditions (Chart 12).
Chart 11
Chart 12China Has Not Contained Property Turmoil
China Has Not Contained Property Turmoil
China Has Not Contained Property Turmoil
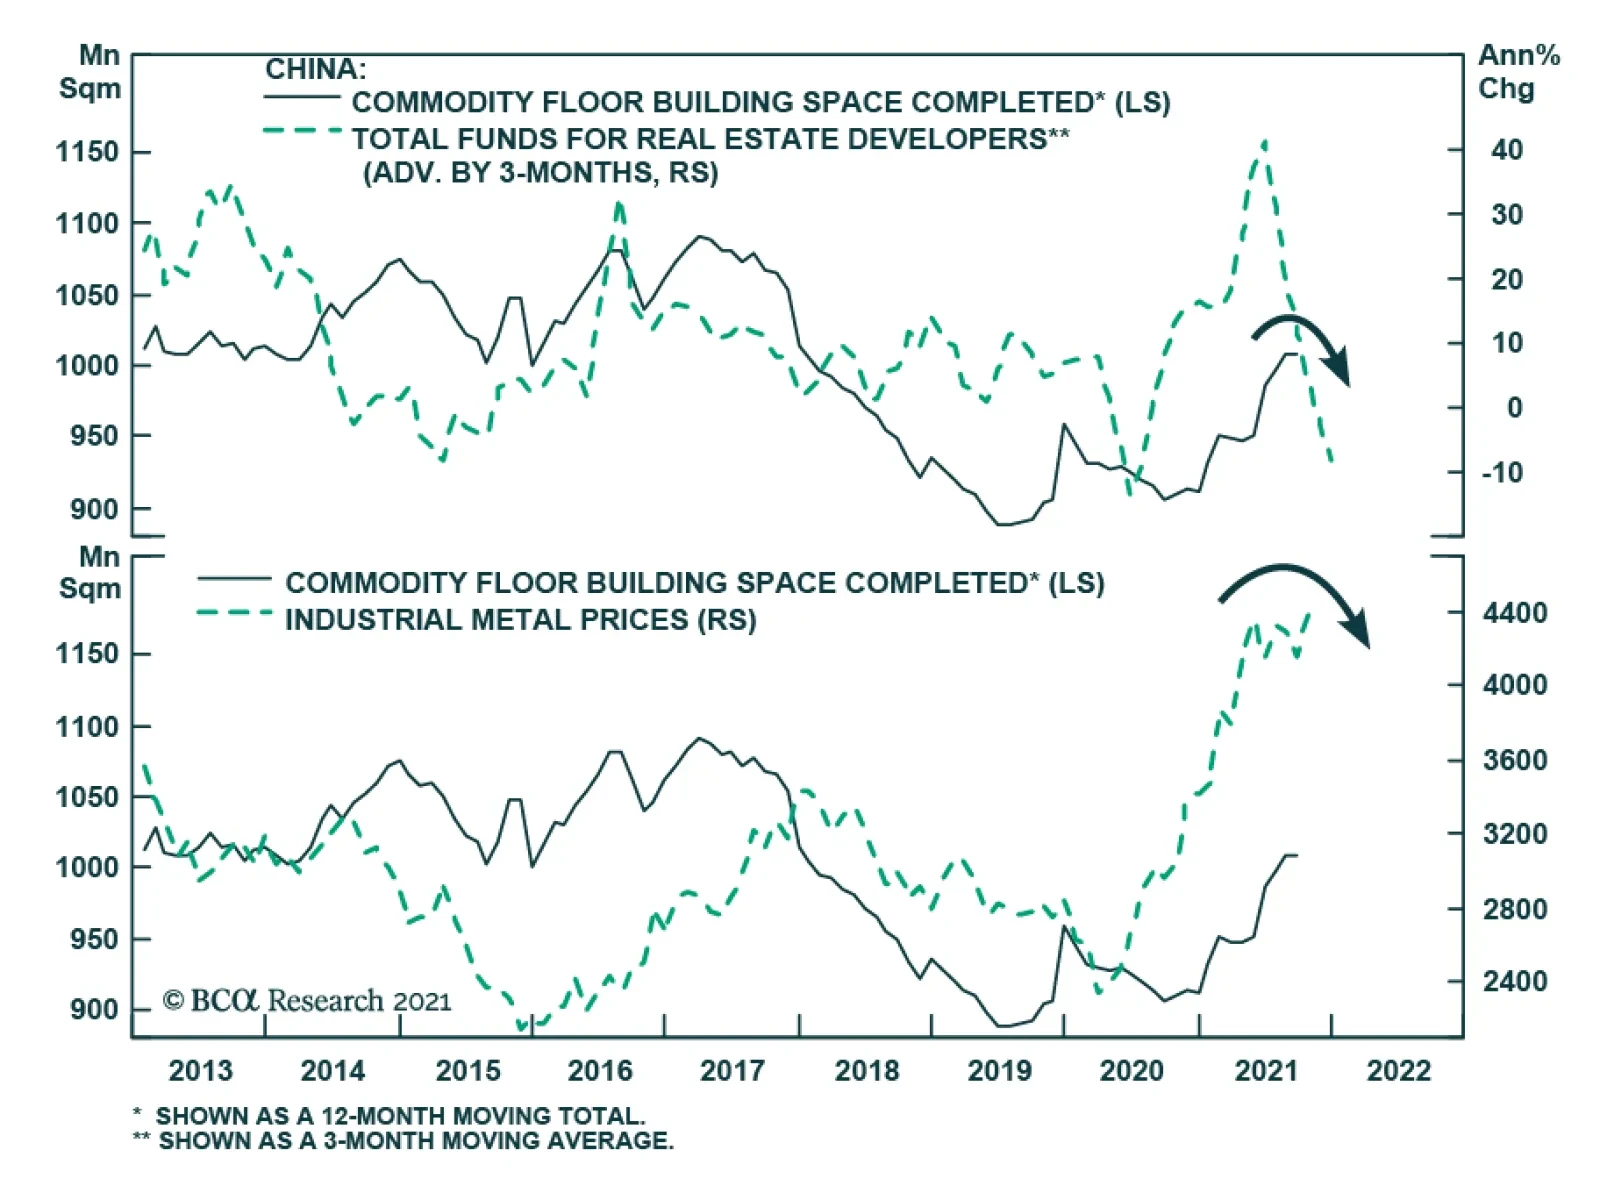
Evergrande, the world’s most indebted property developer, is still hobbling along, but its troubles are not over. There are signs of contagion among other developers, including state-owned enterprises, that cannot meet the government’s “three red lines.” 5 Credit growth has now broken beneath the government’s target range of 12%, though money growth has bounced off the lower 8% limit set for this year (Chart 13). China is dangerously close to overtightening. China’s economic slowdown has not yet been fully felt in the global economy based on China’s import volumes, which are tightly linked to the combined credit-and-fiscal-spending impulse (Chart 14). The implication is that recent pullbacks in industrial metal prices and commodity indexes will continue. Chart 13China Tries To Avoid Over-Tightening
China Tries To Avoid Over-Tightening
China Tries To Avoid Over-Tightening
Chart 14China Slowdown Not Yet Fully Felt
China Slowdown Not Yet Fully Felt
China Slowdown Not Yet Fully Felt
Until China eases policy more substantially, it poses a disinflationary risk and a strong point in favor of the transitory view of global inflation. It is difficult for China to ease policy – let alone stimulate – when producer prices are so high (see Chart 6 above). The result is a dangerous quandary in which the government’s regulatory crackdowns are triggering a property bust yet the government is prevented from providing the usual policy support as the going gets tough. Asset prices and broader risk sentiment could go into free fall. However, the party has a powerful incentive to prevent a generalized crisis ahead of the party congress. So we are inclined to accept signs that property curbs and other policies will be eased. Bottom Line: The full disinflationary impact of China’s financial turmoil and economic slowdown has yet to be felt globally. Biden-Xi Summit Not A Game Changer As long as inflation prevents robust monetary and fiscal easing, Beijing is incentivized to improve sentiment in other ways. One way is to back away from the regulatory crackdown in other sectors, such as Big Tech. The other is to improve relations with the United States. A stabilization of US ties would be useful before the party congress since President Xi would prefer not to have the US interfering in China’s internal affairs during such a critical hour. No surprise that China is showing signs of trying to stabilize the relationship. The US is apparently reciprocating. Presidents Biden and Xi also agreed to hold a virtual bilateral summit next week, which could lead to a new series of talks. The US Trade Representative also plans to restart trade negotiations. The plan is to enforce the Phase One trade deal, issue waivers for tariffs that hurt US companies, and pursue new talks over outstanding structural disputes. The Phase One trade deal has fallen far short of its goals in general but on the energy front it is doing well. China will continue importing US commodities amid global shortages (Chart 15).
Chart 15
Chart 15
The summit alone will have a limited impact. Biden had a summit with Putin earlier this year but relations could deteriorate tomorrow over cyber-attacks, Ukraine, or Belarus. However, there is some basis for the US and China to cooperate next year: Iran. Xi is consolidating power at home in 2022 and probably wants to use negotiations to keep the Americans at bay. Biden is pivoting to foreign policy in 2022, since Congress will not get anything done, and will primarily focus on halting Iran’s nuclear program. If China assists the US with Iran, then there is a basis for a reduction in tensions. The problem is not only Iran itself but also that China will not jump to enforce sanctions on Iran amid energy shortages. And China is not about to make sweeping structural economic concessions to the US as the Xi administration doubles down on state-guided industrial policy. Meanwhile the US is pursuing a long-term policy of strategic containment and Biden will not want to be seen as appeasing China ahead of midterm elections, especially given Xi’s reversion to autocracy. What about cooperation on climate change? The US and China also delivered a surprise joint statement at the United Nations climate change conference in Scotland (COP26), confirming the widely held expectation that climate policy is an area of engagement. These powers and Europe have a strategic interest in reducing dependency on Middle Eastern oil (Chart 16). Climate talks will begin in the first half of next year. However, climate cooperation is not significant enough alone to outweigh the deeper conflicts between the US and China. Moreover climate policy itself is somewhat antagonistic, as the EU and US are looking at applying “carbon adjustment fees” to carbon-intensive imports, e.g. iron and steel exports from China and other high-polluting producers (Chart 17). While the EU and US are not on the same page yet, and these carbon tariffs are far from implementation, the emergence of green protectionism does not bode well for US-China relations even aside from their fundamental political and military disputes.
Chart 16
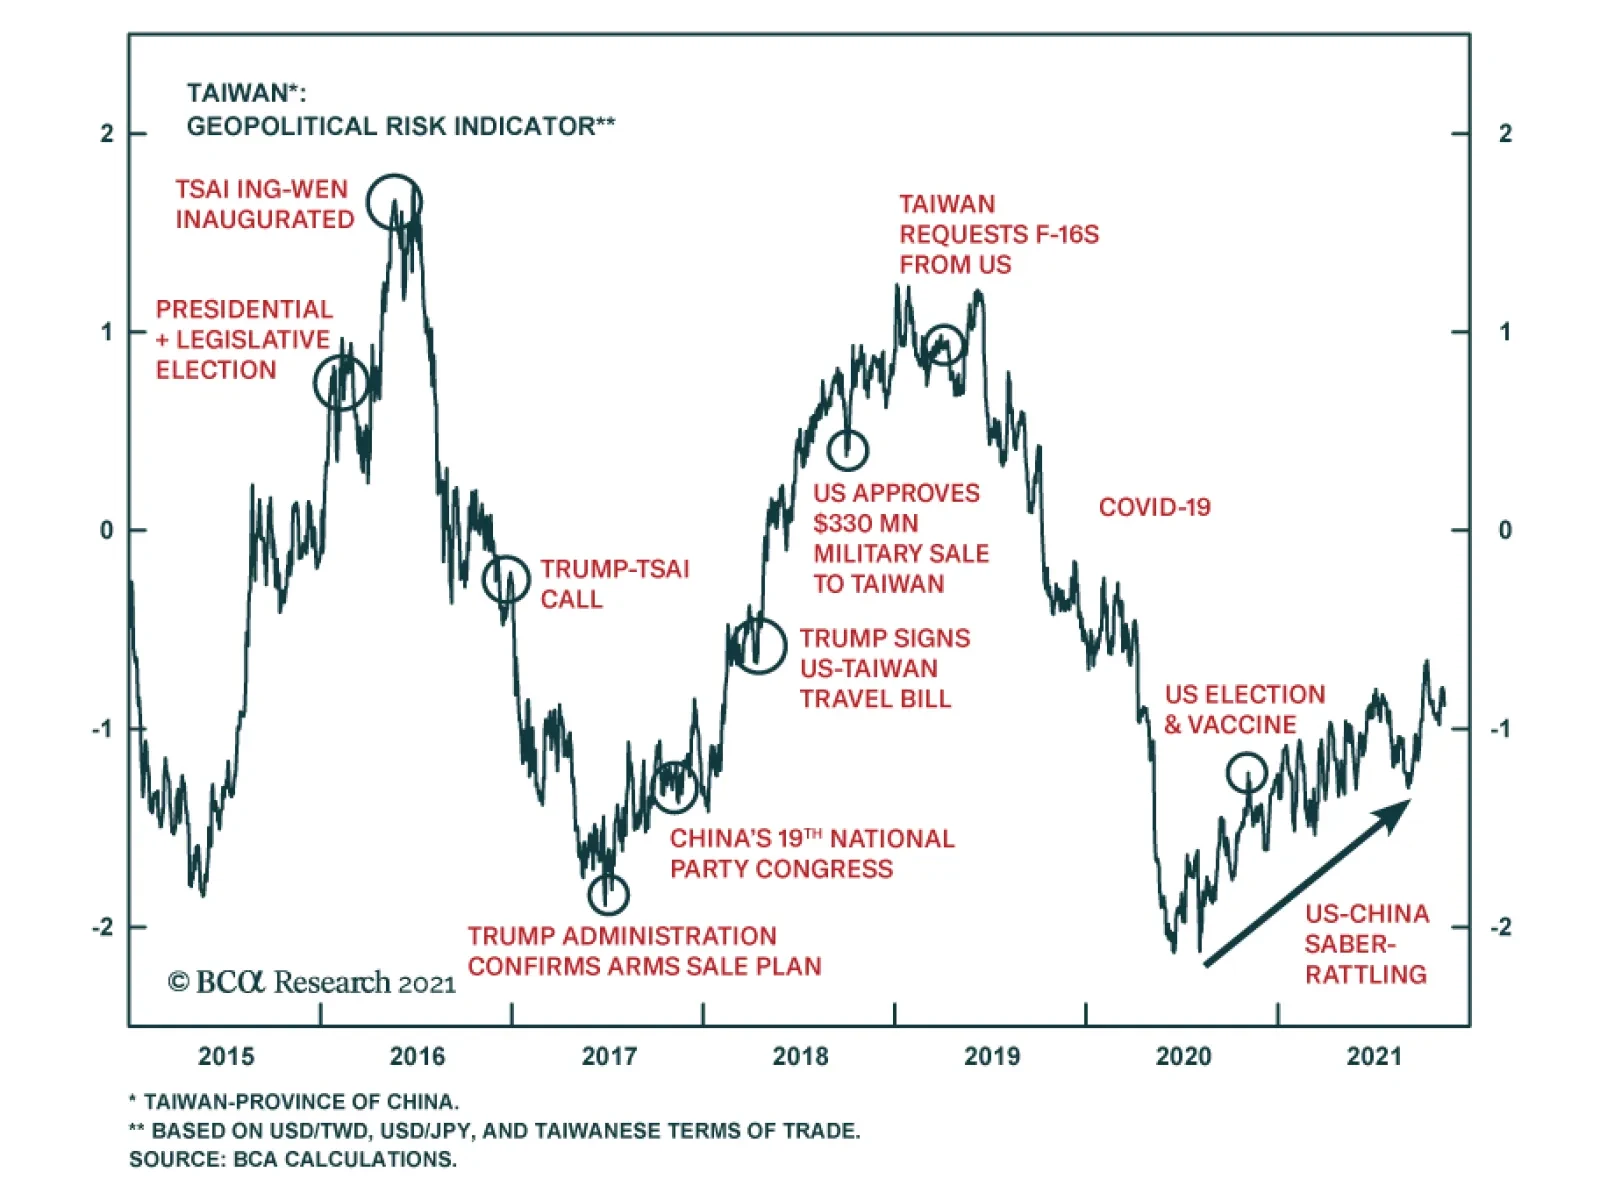
Bottom Line: Some short-term stabilization of US-China relations is possible but not guaranteed. Markets will cheer if it happens but the effect will be fleeting. Chinese assets are still extremely vulnerable to political and geopolitical risks.
Chart 17
Investment Takeaways Gold can still go higher. Financial markets are pricing higher inflation and weak real rates. Gold has been our chief trade to prepare both for higher inflation and geopolitical risk. We are closing our long value / growth equity trade for a loss of 3.75%. We are maintaining our long DM Europe / short EM Europe trade. This trade has performed poorly due to the rally in energy prices and hence Russian equities. But while energy prices may overshoot in the near term, investors will flee Russian equities as geopolitical risks materialize. We are maintaining our long Korea / short Taiwan trade despite its being deeply in the red. This trade is valid over a strategic or long-term time horizon, in which a major geopolitical crisis and/or war is likely. Our expectation that China will ease policy to stabilize the economy ahead of fall 2022 should support Korean equities. Matt Gertken Vice President Geopolitical Strategy mattg@bcaresearch.com Footnotes 1 Over the past year President Alexander Lukashenko’s repression of domestic unrest prompted the EU to impose sanctions. Lukashenko responded by organizing an immigration scheme in which Middle Eastern migrants are flown into Belarus and funneled into the EU via Poland. The EU is threatening to expand sanctions while Belarus is threatening to cut off the Yamal-Europe pipeline amid Europe’s energy crisis. See Pavel Felgenhauer, “Belarus as Latest Front in Acute East-West Standoff,” Jamestown Foundation, November 11, 2021, Jamestown.org. 2 Both Germany and the EU must approve of Nord Stream II for it to enter into operation. The German Federal Network Agency has until January 8, 2022 to certify the project. The Economy Ministry has already given the green light. Then the European Commission has two-to-four months to respond. The EU is supposed to consider whether the pipeline meets the EU’s requirement that gas transport be “unbundled” or separated from gas production and sales. This is a higher hurdle but Germany’s clout will be felt. Hence final approval could come by March 8 or May 8, 2022. The energy crisis will put pressure for an early certification but the EU Commission may take the full time to pretend that it is not being blackmailed. See Joseph Nasr and Christoph Steitz, “Certifying Nord Stream 2 poses no threat to gas supply to EU – Germany,” Reuters, October 26, 2021, reuters.com. 3 Xi is not serving for an “unprecedented third term,” as the mainstream media keeps reporting. China’s top office is not constant nor were term limits ever firmly established. Each leader’s reign should be measured by their effective control rather than technical terms in office. Mao reigned for 27 years (1949-76), Deng for 14 years or more (1978-92), Jiang Zemin for 10 years (1992-2002), and Hu Jintao for 10 years (2002-2012). 4 See Joseph Fewsmith, “Mao’s Shadow” Hoover Institution, China Leadership Monitor 43 (2014), and “The 19th Party Congress: Ringing In Xi Jinping’s New Age,” Hoover Institution, China Leadership Monitor 55 (2018), hoover.org. 5 Liability-to-asset ratios less than 70%, debt-to-equity less than 100%, and cash-to-short-term-debt ratios of more than 1.0x. Strategic View Open Tactical Positions (0-6 Months) Open Cyclical Recommendations (6-18 Months) Open Trades & Positions
Image
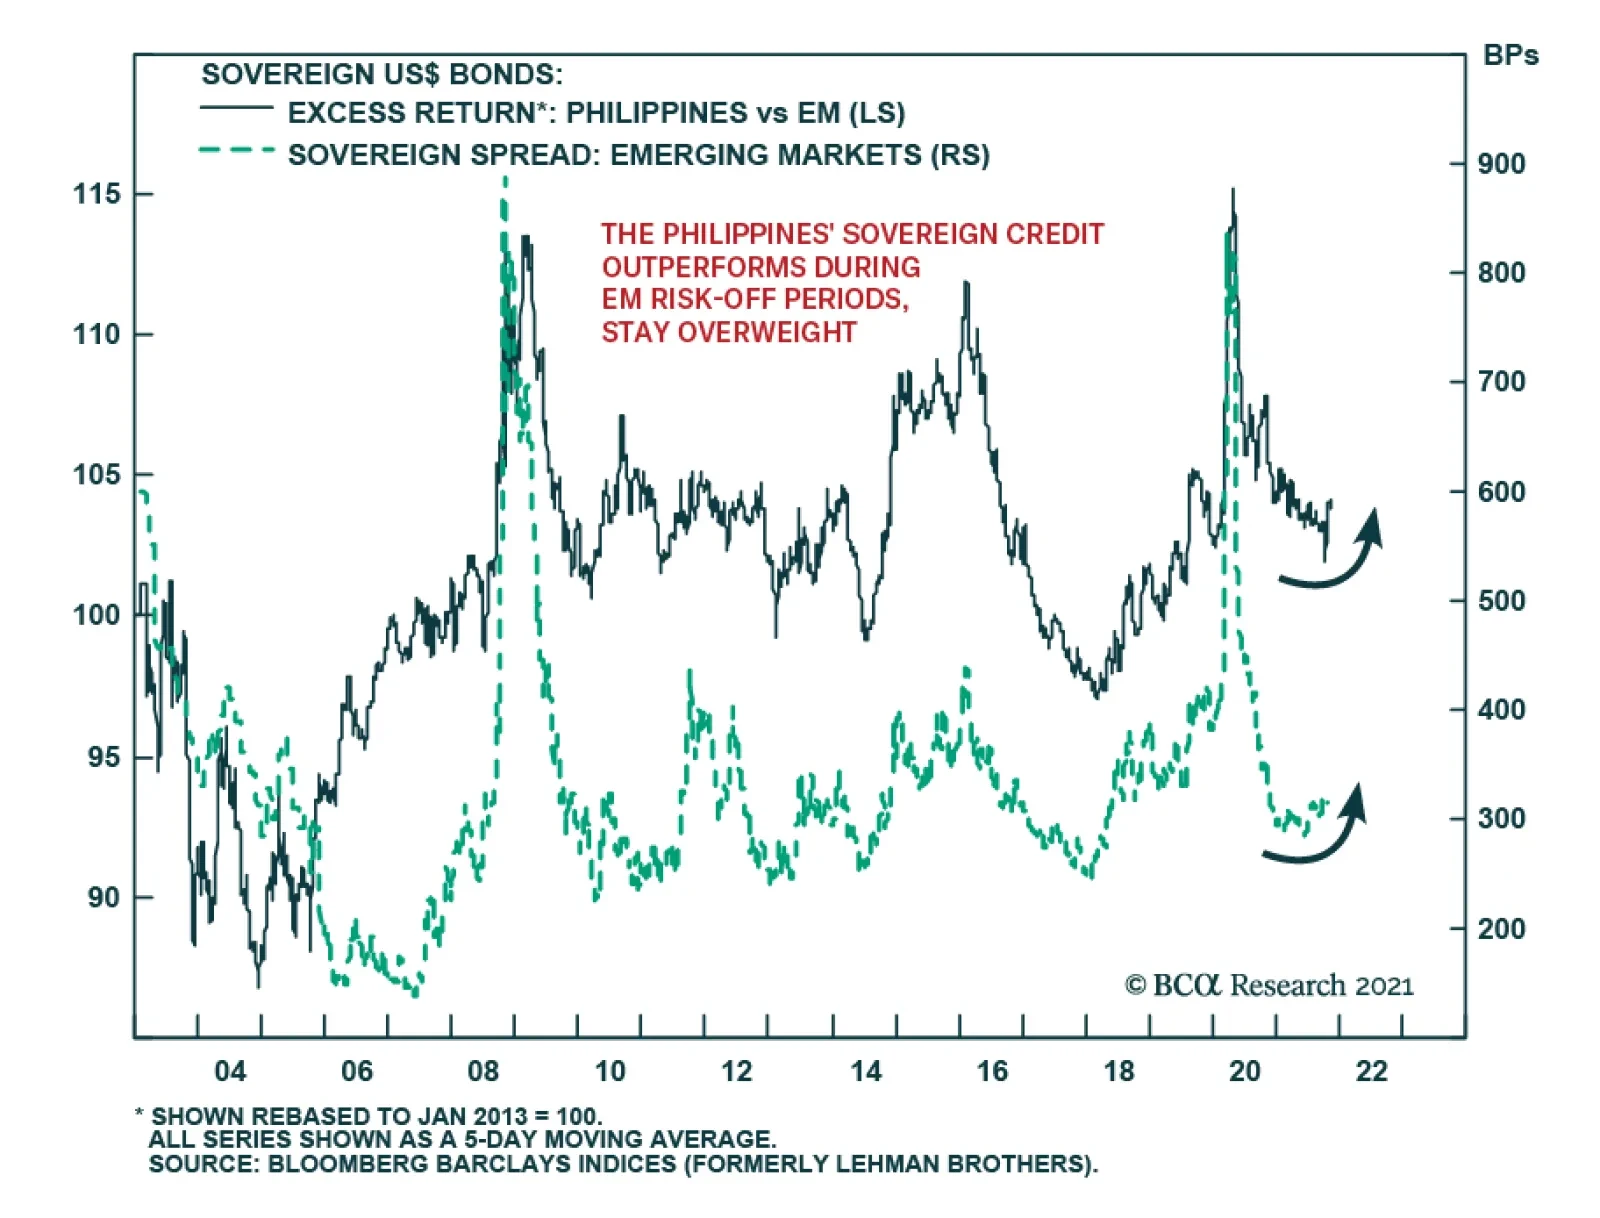
BCA Research’s Emerging Markets Strategy service expects Philippine sovereign credit to outperform its EM counterparts. A negative outlook on overall EM sovereign credit warrants overweighting Philippine sovereign credit relative to its EM brethren. The…
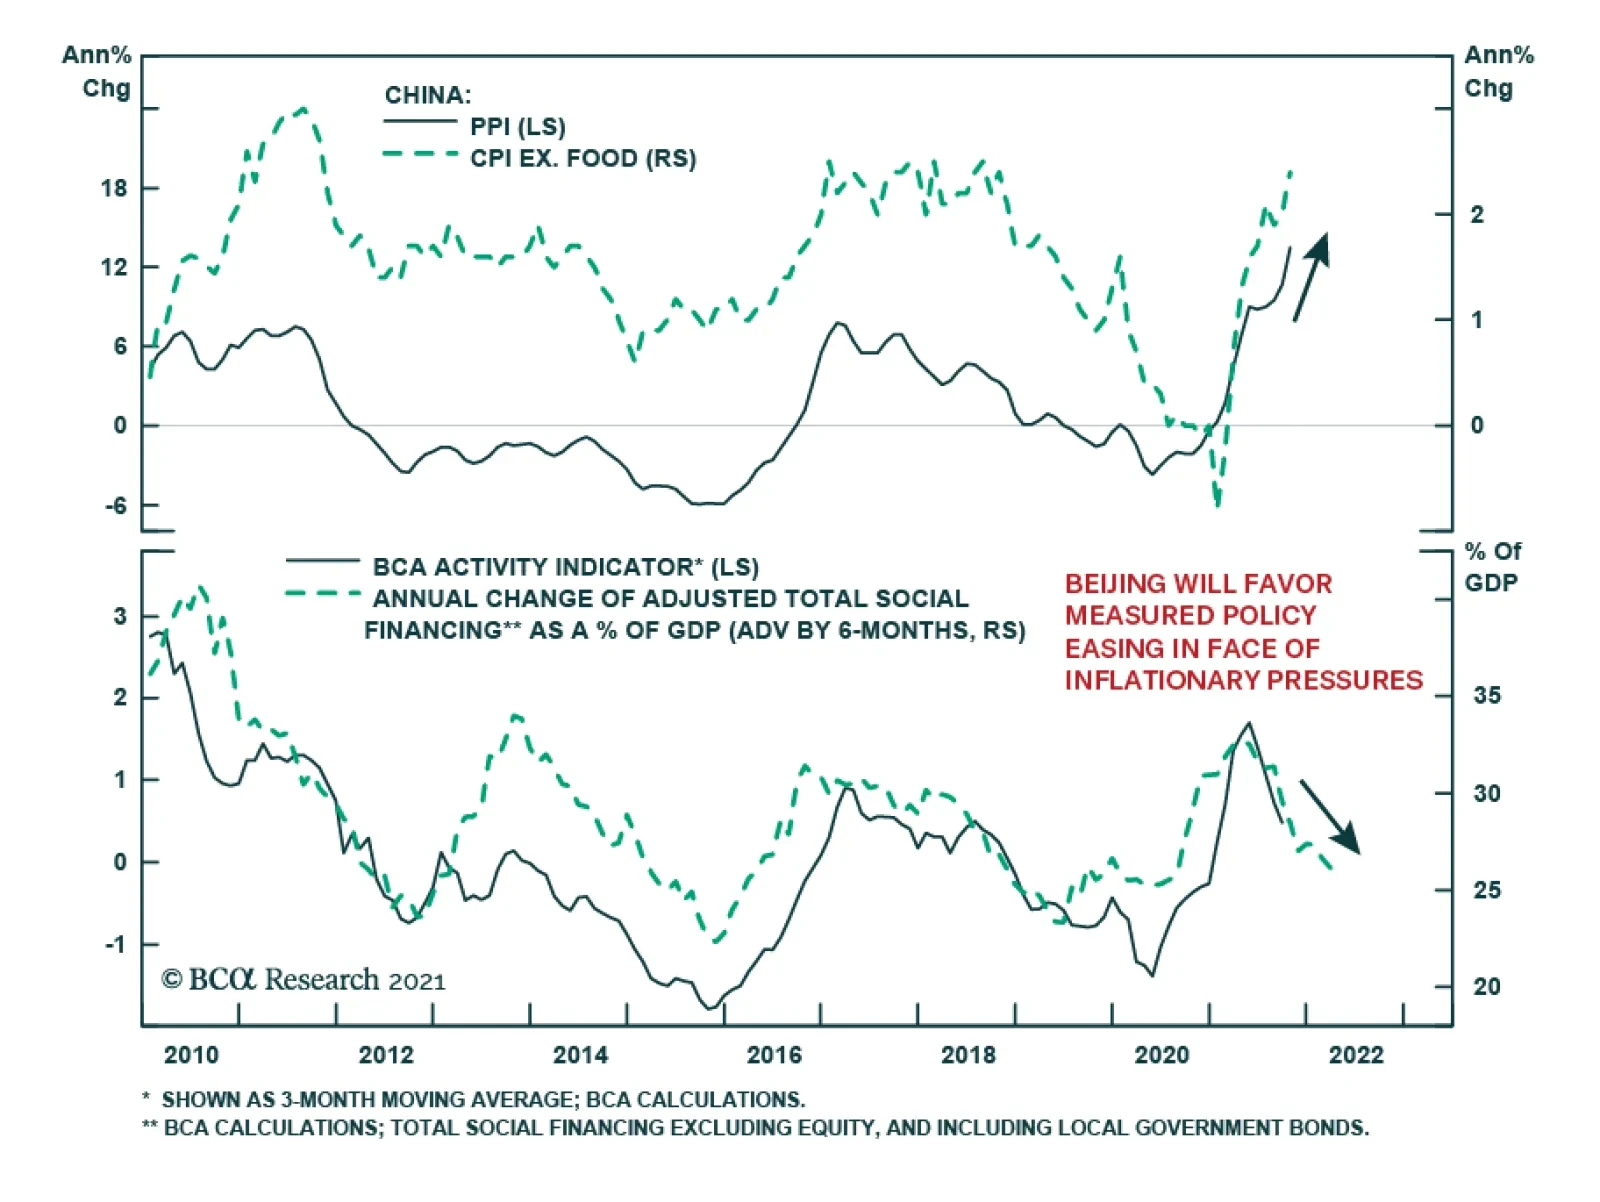
Chinese inflationary pressures intensified in October. PPI inflation accelerated from 10.7% to a 26 year high of 13.5% y/y, beating the anticipated 12.3% increase. Price pressures are particularly acute among PPI producer goods: the excavation index surged…
Dear Client, Next week I will be hosting and attending client events, both virtual and in person. Our next report, on November 24 will be a recap of my observations from the meetings with our clients. Best regards, Jing Sima China Strategist Executive Summary Chart Of The DayThe Gap Between Chinese Manufacturing Input And Output Prices Reached Multi-Year High
The Gap Between Chinese Manufacturing Input And Output Prices Reached Multi-Year High
The Gap Between Chinese Manufacturing Input And Output Prices Reached Multi-Year High
Producer price inflation in China will likely peak in the next two quarters, but inflation could remain elevated well into 2022. Chinese producers will continue to pass on inflation to domestic and foreign consumers. Core CPI is only a notch below its pre-pandemic level; rising energy and food prices, along with improved service sector consumption, will push up headline consumer prices next year. Lack of meaningful policy easing is creating an air pocket for China’s economy, with significant near-term risks for a faster-than-expected economic slowdown. We continue to prefer the CSI500 Index over the broader onshore market.
In Limbo
In Limbo
Bottom Line: China’s business cycle has rapidly matured while inflation remains a risk. We are still underweight Chinese equities in a global portfolio. Within Chinese stocks, we continue to favor CSI500 Index which has a greater exposure to external demand. Feature Chart 1Persistently Negative Economic Surprises
Persistently Negative Economic Surprises
Persistently Negative Economic Surprises
China’s economic conditions deteriorated in the third quarter. Chart 1 shows that the nation’s economic surprise index remains in deep contraction. However, the combination of power shortages and persistent supply-side price pressures has limited policy choices, particularly the traditional measures used to stimulate the economy. We are closely monitoring the BCA China Play Index and the relative performance of domestic infrastructure stocks versus global equities as proxies for reflation; neither is signaling a significant improvement (Chart 2). The outlook for Chinese stocks in the next 6 to 12 months remains dim. Chinese corporate profit growth has peaked, and input cost pressure on domestic producers may prove to be stickier than the market has currently priced in (Chart 3). Chart 2Reflation Proxies Are Not Signaling A Major Economic Upturn
Reflation Proxies Are Not Signaling A Major Economic Upturn
Reflation Proxies Are Not Signaling A Major Economic Upturn
Chart 3Corporate Profit Growth Has Peaked
Corporate Profit Growth Has Peaked
Corporate Profit Growth Has Peaked
Producer Price Inflation Remains A Near-Term Risk China’s producer price index (PPI) inflation may stay high longer than the market is expecting. Supply-side pressures and bottlenecks will abate, but perhaps not as fast as investors expect. Moreover, energy prices will likely remain elevated into 2022 and labor shortages in the urban areas will further exacerbate inflationary pressures. As discussed in a previous report, the surge in China’s manufacturing output and prices has been driven by strong US consumer demand for goods. Robust external demand this year occurred as China’s industrial sector had gone through years of capacity reduction and domestic de-carbonization efforts gained momentum. Chart 4Expanding Mining Capacity Takes Time
Expanding Mining Capacity Takes Time
Expanding Mining Capacity Takes Time
Capacity in the mining sector will expand in the next 6 to 12 months if the power crunch persists. However, the 2015/16 supply-side reforms significantly reduced China’s upstream industry’s capability to produce. Given the capital-intensive nature of upstream industries, expanding production output often takes a long time. Chart 4 shows the significant lag between mining’s higher product prices, which indicate rising demand and tighter supply, and improved output and investment in the sector. The industrial sector’s capacity utilization rate remains elevated. China’s manufacturers can ramp up output more easily compared with mining enterprises. However, both manufacturing investment growth and output in volume have been falling (Chart 5). The wide gap between manufacturing input and output prices means that the profit margin among producers of manufacturing goods has been squeezed, giving them little incentive to expand business operations (Chart 6). Chart 5Manufacturing Investment Growth And Output Volume Have Been Falling
Manufacturing Investment Growth And Output Volume Have Been Falling
Manufacturing Investment Growth And Output Volume Have Been Falling
Chart 6The Gap Between Chinese Manufacturing Input And Output Prices Reached Multi-Year High
The Gap Between Chinese Manufacturing Input And Output Prices Reached Multi-Year High
The Gap Between Chinese Manufacturing Input And Output Prices Reached Multi-Year High
In addition, PPI inflation may be slow to decline for the following reasons: Coal futures prices have been clobbered since mid-October in the wake of government regulatory measures to curb speculation in the domestic commodity exchange market (Chart 7). However, the plunge does not solve the supply shortage issue. Coal prices at China’s major ports have been trending sideways and remain at historic highs (Chart 8). Chart 7Regulators Have Squashed Coal Price Speculations In Commodity Exchanges...
Regulators Have Squashed Coal Price Speculations In Commodity Exchanges...
Regulators Have Squashed Coal Price Speculations In Commodity Exchanges...
Chart 8...But Coal Prices At Ports Remain High
...But Coal Prices At Ports Remain High
...But Coal Prices At Ports Remain High
Regulators have allowed electricity producers to boost prices by as much as 20% to industrial users. We estimate that a 20% increase in electricity prices can add anywhere from half to one percentage point to PPI. The recovery in the global service sector will provide support to oil prices (Chart 9). BCA’s Commodity and Energy Strategy service expects energy prices to soften in the next 12 months, but not by as much as the markets are discounting. Our latest forecast sets Brent crude oil at an average $81/bbl in 2021Q4, $80/bbl in 2022 (versus market expectations of $77/bbl) and $81/bbl in 2023 (versus market expectations of $71/bbl) (Chart 10). Chart 9Oil Prices Find Support From Recovery In Global Service Activity
Oil Prices Find Support From Recovery In Global Service Activity
Oil Prices Find Support From Recovery In Global Service Activity
Chart 10
China’s domestic demand has weakened, particularly in the construction sector. Prices for steel rebar, iron ore and cooper have all rolled over and/or fallen sharply (Chart 11). Nonetheless, the prices remain well above pre-pandemic levels and policy-induced production cuts may limit the downside. Labor shortages in China’s urban areas have not improved. Reverse migration has increased since early last year when China imposed travel restrictions to contain domestic COVID transmission. Workers from rural areas opted to remain in their hometowns rather than return to work in urban areas. As of Q3 this year, there were still about 2 million fewer migrant workers than in the pre-COVID years, which has exacerbated an urban labor shortage that existed before the pandemic (Chart 12). Chart 11Commodity Prices In China Have Rolled Over, But Downside May Be Limited
Commodity Prices In China Have Rolled Over, But Downside May Be Limited
Commodity Prices In China Have Rolled Over, But Downside May Be Limited
Chart 12Migrant Workers Are Slow To Return To Urban Jobs
Migrant Workers Are Slow To Return To Urban Jobs
Migrant Workers Are Slow To Return To Urban Jobs
Bottom Line: PPI should peak in the next one to two quarters as supply bottlenecks ease and the base factor wanes. However, China’s industrial capacity and labor market remain tight. Producer inflationary pressures may sustain longer than investors expect. Passing On Costs To Consumers Chart 13Households Are Paying Higher Prices For Durable Goods And Daily Necessities
Households Are Paying Higher Prices For Durable Goods And Daily Necessities
Households Are Paying Higher Prices For Durable Goods And Daily Necessities
The weakness in demand from Chinese households has kept consumer price inflation subdued so far this year. Nonetheless, Chinese producers have started to pass on supply-side cost pressures to consumers, both domestic and foreign. Rising raw material costs have pushed up the price of Chinese consumer durable goods, such as home appliances (Chart 13). Consumer prices for fuel have reached the highest level since the data collection started in 2016. The cost of consumer daily necessities is also climbing: households are paying more for utilities (water, electricity and fuel) compared with pre-pandemic years and prices are at 2013 highs. Escalating electricity prices will further strengthen inflationary pressures on the CPI. While residential electricity costs are strictly regulated in China and are unlikely to rise in the near future, price inflation passthroughs will be mainly via higher costs on both consumer goods and services. If the 20% increase in electricity costs among Chinese manufacturers is passed onto consumers, it could potentially push up the CPI by about 0.2 -0.4 percentage points. The cost of food and vegetables has also jumped since early October. Given the high likelihood of La Niña this winter, food inflation could further mount and potentially push the headline CPI close to the PBoC’s 3% inflation target next year. The recovery in China’s service sector has lagged due to domestic COVID flareups and subsequent lockdowns (Chart 14A and 14B). However, service CPI has recovered to above its pre-pandemic level, with strong rebounds in tourism and transportation (Chart 15). Given that China is accelerating vaccine boosters, an improvement in the domestic COVID situation next year could further support the service sector’s consumption and prices. Chart 14AService Sector Recovery In China Has Lagged...
Service Sector Recovery In China Has Lagged...
Service Sector Recovery In China Has Lagged...
Chart 14BService Sector Recovery In China Has Lagged...
Service Sector Recovery In China Has Lagged...
Service Sector Recovery In China Has Lagged...
Chart 15...But Prices Have Not
...But Prices Have Not
...But Prices Have Not
Chart 16Chinese Export Growth Remained Buyout Through October
Chinese Export Growth Remained Buyout Through October
Chinese Export Growth Remained Buyout Through October
China’s exporters are passing on inflation to their foreign customers too. Newly released trade data highlights buoyant export growth through October (Chart 16). Even though goods consumption in the US will likely converge to its long-term trend next year, inventories are at multi-year lows while global industrial production growth remains well above trend (Chart 17). China’s export growth may stay strong in the next two quarters, as suggested by our regression-based modelling (Chart 18). Exporters have been charging US and global customers less than average prices (Chart 19). Robust demand for consumer and capital goods from the US and Europe should give China’s exporters sustained pricing power. Chart 17Extremely Low Inventories In The US Will Benefit Chinese Exports
Extremely Low Inventories In The US Will Benefit Chinese Exports
Extremely Low Inventories In The US Will Benefit Chinese Exports
Chart 18Above-Trend Growth In Global Industrial Production Will Also Support Chinese Exports
Above-Trend Growth In Global Industrial Production Will Also Support Chinese Exports
Above-Trend Growth In Global Industrial Production Will Also Support Chinese Exports
Bottom Line: China’s producers will continue to pass on inflation to their domestic and foreign customers. Chart 19Chinese Export Prices Are Below Global Average
Chinese Export Prices Are Below Global Average
Chinese Export Prices Are Below Global Average
Chart 20Favor CSI500 Index Over A-Shares
Favor CSI500 Index Over A-Shares
Favor CSI500 Index Over A-Shares
Investment Conclusions China’s authorities will unlikely use policy measures to cool domestic demand, but they will be constrained by lingering inflationary risks driven by external consumption and supply-side pressures in the next six months. Monetary and fiscal policies will ease to counter the slowdown in the economy, but reflationary measures will be gradual. We expect the money and credit impulse to bottom in Q4, but the rebound will be subdued. As such, domestic demand will remain sluggish and economic growth will likely decelerate faster than the onshore market has currently discounted. While we maintain a cautious stance on Chinese stocks in general, we continue to favor the CSI500 Index relative to the broader A-share market. External demand growth may remain above trend in the next six months. The CSI500 has a larger exposure to the global economy and lower valuation relative to China’s broad onshore market, and should still have some upside potentials. (Chart 20). Jing Sima China Strategist jings@bcaresearch.com Market/Sector Recommendations Cyclical Investment Stance
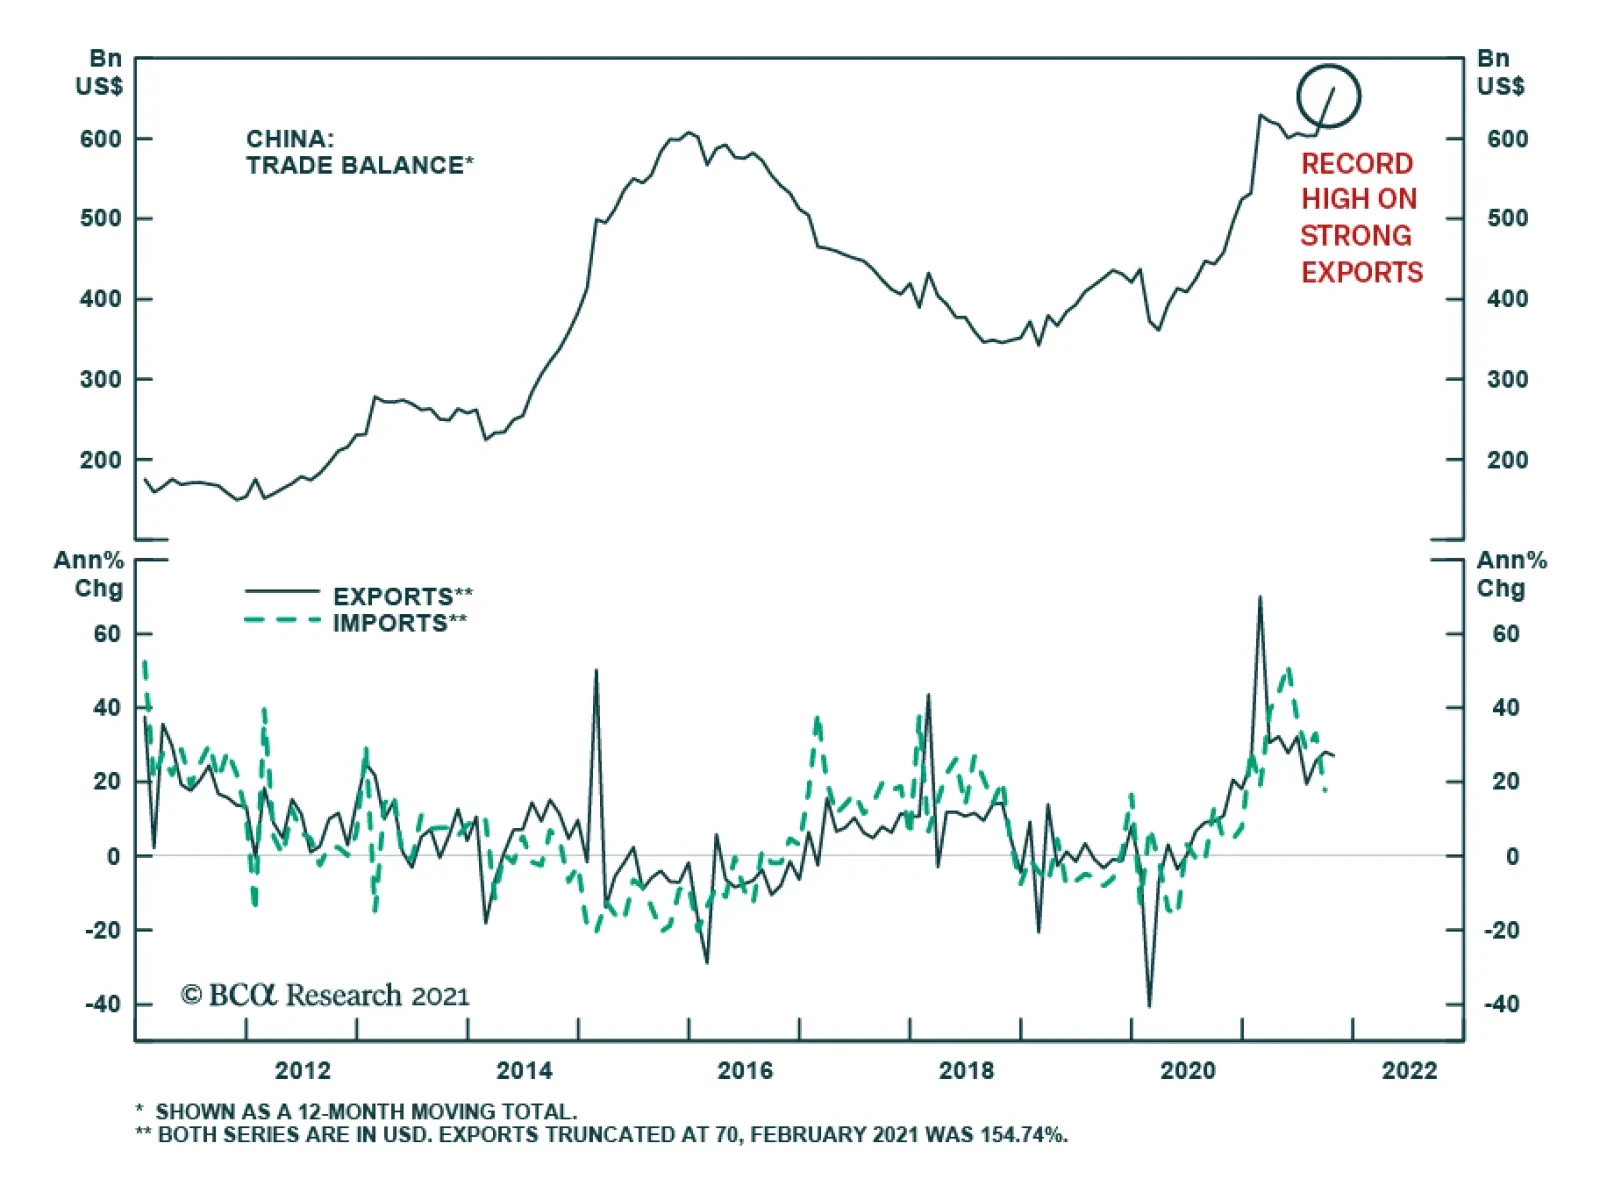
China’s trade surplus expanded to a record $84.5 billion in October – above the prior month’s $66.8 billion and expectations of $64.0 billion. The wider surplus reflects a 27.1% y/y jump in exports versus an anticipated deceleration to 22.8% from September’s…
Highlights We introduce our rotation graphs to assess the evolution of the relative trend and momentum of various assets. US equities remain on firm footing, but their weakening relative momentum suggests that investors may soon begin to rotate away from this market in favor of the Eurozone and EM. Cyclicals continue to dominate defensives, globally and in Europe. European value stocks are experiencing improving momentum, which suggests that a rotation out of growth equities is afoot. While European small-cap equities sport attractive fundamentals, rotational dynamics indicate it is still too early to overweight them aggressively. The energy crisis is a dominant driver of the relative sector performance in Europe and resulted in a massive shift in leadership from industrials to energy. As long as oil and natural gas act as a drag, industrials will lag. Financials are well supported. Swedish stocks have borne the brunt of the energy price spike, while Norwegian equities have been its main beneficiaries. The improvement in momentum of German stocks suggests that their relative underperformance will soon end. Spanish shares look attractive from a tactical perspective. Swiss industrials will need a recovery in EUR/CHF to outperform other European industrials. UK industrials will continue to outperform their continental competitors, while Spanish industrials have a window through which to shine. A rotation into UK financials may soon begin as their momentum improves. The darkest days for German financials are ending, while Spanish, Italian, and Swedish financials may soon witness a wave of underperformance. Spanish consumer discretionary equities are becoming more attractive compared to their European counterparts. While Dutch names continue to outperform other European tech equities, their softening momentum suggests investors are beginning to rotate out of this country. Spanish and German tech names offer an attractive diversification opportunity within the industry. Feature Methodology The combination of excess liquidity, large pools of fast money, elevated valuations across most securities, and the existence of the near-term momentum reversal effect encourage investors to rotate from one asset to the next in the hope of rapid profits. Measures to assess where each market stands in this rotational pattern can be useful for investors to catch these swings. In this optic, we introduce our rotation screener focused on equities. It is a simple tool that looks at whether a sector or a country is strengthening relative to its benchmark and whether this strength is happening at a faster or slower momentum. To measure each dimension, we use proprietary indicators of relative strength and momentum. Once each asset’s relative strength and relative momentum are established, we can position them in quadrants. We follow traditional terminology. The upper right quadrant denotes “Leading” assets, or securities that are outperforming their benchmark with strengthening momentum. The bottom right quadrant denotes “Weakening” assets, or securities that are outperforming their benchmark but with a deteriorating momentum. The bottom left quadrant denotes “Lagging” assets, or securities that are underperforming with decreasing momentum. Finally, the top left quadrant indicates “Improving” assets, or securities that are underperforming but with increasing momentum. Investors should move to overweight assets that are in the Improving quadrants and to underweight assets that are inching toward the “Lagging” from the “Weakening” quadrants. This method is very flexible and can be applied to sectors, countries, styles, and so on, as long as a benchmark is available to generate comparisons. In this report, we will analyze the following from a rotational perspective: global national markets, global cyclicals vs global defensive’s, European cyclicals vs European defensives, European sectors, European national markets, European financials, European consumer discretionaries, and European tech stocks. Global National Markets
Chart 1
US equities have moved from the Leading quadrant to the Weakening one as they continue to outperform the global benchmark but with a decelerating momentum (Chart 1). This locates the US market in a risky position that could herald a period of underperformance, especially if global economic surprises accelerate. From a rotational perspective, US stocks could still experience another wave of outperformance over the coming weeks, as momentum has been firming over the past four weeks. The Euro Area benchmark has fully moved from the Weakening quadrant in August to the Lagging one today. Investors should monitor Europe’s relative momentum closely, because a pick-up from here would push the Eurozone into Improving territory, a warning of an imminent trend change in European relative stock prices. Emerging markets have exited the Lagging zone and moved into the Improving quadrant. The move is far from decisive and remains at risk with Chinese credit growth still decelerating. The recent decline in steel prices in China suggests that construction activity in that economy continues to slow. Thus, as long as Chinese credit flows deteriorate, EM stocks will have trouble moving into the Leading quadrant. Cyclicals Vs Defensives Global defensive equities tried to move into the Leading quadrant at the end of the summer, but, ultimately, they plunged back into Lagging territory as global stocks recovered in October (Chart 2). Meanwhile, global cyclicals moved in the opposite trajectory, shifting from the Lagging quadrant to the Leading one over the past three months. Cyclicals continue to benefit from the general uptrend in the market. Even the recent decline in yields is doing little to boost the performance of defensive equities. The biggest risk to these stocks remains the Chinese economic slowdown. For now, this deterioration has not been large enough to compensate for the general vigour in profits and consumption in advanced economies. However, if inflation worries do not abate, then the Chinese slowdown will become more problematic for global cyclicals as it will raise the spectre of stagflation.
Chart 2
Chart 3
The rotational pattern for European cyclicals vs defensive stocks mimics that of global equities (Chart 3). However, European cyclicals are somewhat softer than their global equivalents, hurt by Europe’s greater exposure to the Chinese business cycle compared to the US’s exposure. European Investment Styles
Chart 4
Over the past three months, European investment styles have begun a major shift. Value has moved from the Lagging quadrant to the Improving one, which suggests that flows could push value into the Leading quadrant (Chart 4). Moreover, growth has moved from the Leading quadrant to the weakening one, which created a similar dynamic as the decline in performance of the quality factor. This confirms that the rise in yields is beginning to favour a shift in style from growth to value. Meanwhile, small-cap stocks have tumbled into the Lagging quarter. We do expect attractive returns for European small-cap names over an 18- to 24-month investment horizon. However, we have not moved yet to overweight this sector of the market and rotational patterns confirm it is too early to do so safely. European Sectors
Chart 5
Sectors have begun to make some important shifts in European markets (Chart 5). Tech has moved from the Leading quadrant to the weakening one. While the sector continues to outperform, it is doing so with a declining momentum, and it could soon move to the Lagging quadrant. This deteriorating price action must be monitored closely. Consumer discretionary names, which were strong performers that have become increasingly weak, have moved from the Weakening quadrant to the lagging one. However, their momentum is not deteriorating as much as it did nine weeks ago, which suggests a move to the Improving quadrant could soon be in the offing. Financials have greatly enjoyed the uptick in global yields. After a short passage through the Lagging quadrant, they have shifted into the Leading one. This suggests that the winds remain behind this sector, which we continue to overweight. Industrials and energy have become mirror images of one another, highlighting the negative impact on European economic activity and profitability of the recent surge in energy prices. The industrials have moved from the Leading quadrant to the lagging one, as the energy sector experienced the opposite direction of travel. This suggests that industrials will only recover their shine once the energy crisis abates, which will also hurt energy stocks. European National Markets
Chart 6
The rotational pattern exhibited by European national markets bears their respective sectoral footprints (Chart 6). The tech-heavy Dutch market has moved from the Leading quadrant to the Weakening one, the industrials-focused Swedish market has fallen into the Lagging quadrant from the Weakening one and the Norwegian market has leapt out of Lagging into Leading territory. Hence, if the rotation out of tech deepens, The Netherlands will tumble directly into the Lagging zone, while an easing in energy prices will force Norway and Sweden to switch places on the back of a rotation out of energy into industrials. Germany is of particular interest. It is a well-diversified market that has become oversold. Moreover, as we wrote in September, its relative performance exhibits a significant discount to relative earnings. From a rotational perspective, Germany is moving to leave the Lagging quadrant; a durable shift into the Improving quadrant will sufficiently assuage traders into buying this market. This process will support our overweight position in German equities. Spain is another market we like on a tactical basis. Over the course of the past three months, it moved out of Lagging territory into the Improving zone. This price action supports our thesis that the large country-discount embedded across Spanish equity sectors is excessive and should soon dissipate. The main risk to this view would be another down leg in bond yields, which would hurt financials—a major weight in this market. Italy, too, is in the process of executing a full rotation, having exited the Weakening quadrant and moved into the Lagging one. Italian stocks have tried to punch their way into the Improving zone but have failed to do so. They will require higher yields to move out into the Improving zone durably because of the heavy financials weighting of Italian stocks. European Industrials
Chart 7
Within European industrials, a rotational pattern is also evident (Chart 7). Swiss industrials have moved out of the Leading quadrant into the Lagging one as the Swiss franc continues to appreciate against the euro. The rising CHF imparts deflationary pressures into Switzerland and the SNB continues to build up its reserves. As a result, EUR/CHF will appreciate once EUR/USD finds a firmer footing. Thus, while it is too early to overweight Swiss industrials relative to those of the Eurozone, their oversold nature suggests that a rotation in favour of Swiss manufacturing businesses will soon take place. At the current juncture, Spanish industrials look appealing. They have moved out of the Lagging quadrant into the Improving one as the momentum of their relative performance improves. Additionally, they are close to moving into the leading territory. This picture is consistent with a narrowing of the discount embedded in all Spanish sectors since the pandemic broke out. Swedish industrials are also trying to exit the Lagging territory; their elevated RoE, and heavy sensitivity to the DM capex cycle indicate that they should move into the Leading quadrant in the coming weeks. UK industrials have remained in the Leading zone for the past three months, but their relative momentum is softening, which risks them being placed in the Weakening zone. The recent deterioration in GBP/EUR could provide a breath of fresh air, as it will improve the competitiveness of UK industrials compared to continental firms. Even then, for now, rotational dynamics do not flag an imminent problem for UK industrials. European Financials
Chart 8
The clearest rotational pattern within European financials may be found in Sweden and the UK (Chart 8). Over the past three months, Swedish financials have fallen out of the Leading quadrant into the Weakening one, and they are inching closer toward the Lagging zone. This suggests that they could soon begin to underperform. Meanwhile, UK financials offer a mirror image as they exited the Lagging quadrant and moved into the improving one. They have yet to enter Leading territory, but seem close to doing so. The pessimism toward the UK is overdone right now. BCA’s Global Fixed-Income Strategy team expects the UK yield curve to steepen anew. UK financials would be prime beneficiaries of this dynamic. Italian and Spanish financials are also exhibiting some concerning moves lately. Both were in the Leading quadrant, but they have since shifted to the lagging one as peripheral spreads widened. Meanwhile, money seems to be moving into German financials, which have advanced from the Lagging quadrant to the Improving quadrant. While they are not as close to the Leading quadrant as their UK competitors, this shift warrants monitoring. European Consumer Discretionary
Chart 9
Within the consumer discretionary space, most European countries have remained in their quadrant (Chart 9). Nonetheless, Spanish CD stocks have moved out of the Lagging zone into the Leading quadrant, while their Italian counterparts have recently entered the Weakening quadrant where they have joined French CDs. While both these countries’ consumer discretionary firms are witnessing weakening momentum, they remain in an upward trend against their European competitors. It is therefore too early to sell these countries within this industry. German Consumer discretionary equities are still in the Lagging quadrant, but they are trying to move into the Improving one, where UK CD names have remained for the past three months. European Tech
Chart 10
The European tech sector is very much a story about The Netherlands versus the rest, due to the large size of the Dutch tech sector (Chart 10). For now, rotational patterns remain in favour of Dutch names; they have exited the Leading quadrant, but, while their momentum is weakening somewhat, they remain in a pronounced relative uptrend. A few small markets offer some promise. Over the past three months, both Spanish and German tech names have shifted from the Lagging quadrant into the Improving one. Their elevated momentum measures suggest that a shift into the Leading quadrant is imminent. As such, investors should consider switching some of their tech holdings into these two countries to diversify away from the Dutch behemoth. Mathieu Savary, Chief European Strategist Mathieu@bcaresearch.com