Emerging Markets

In lieu of next week’s report, I will be presenting the quarterly Counterpoint webcast titled ‘Where Is The Groupthink Wrong? (Part 2)’. I do hope you can join. Highlights If a continued surge in the oil price – or other commodity or goods prices – started driving up the 30-year T-bond yield, the markets and the economy would feel the pain. We reiterate that the pain point at which the Fed would be forced to volte-face is only around 30 bps away on the 30-year T-bond, equal to a yield of around 2.4-2.5 percent. That would be a great buying opportunity for bonds. Given the proximity of this pain point, it is too late to short bonds, or for equity investors to rotate into value and cyclical equity sectors. That tactical opportunity has almost played out. On a 6-month and longer horizon, equity investors should prefer long-duration defensive sectors such as healthcare. Chinese long-duration bond yields are on a structural downtrend. Fractal analysis: The Korean won is oversold. Feature Many people have noticed the suspicious proximity of oil price surges to subsequent economic downturns – most recently, the 1999-2000 trebling of crude and the subsequent 2000-01 downturn, and the 2007-2008 trebling of crude and the subsequent 2008-09 global recession. Begging the question, should we be concerned about the trebling of the crude oil price since March 2020? Of course, we know that the root cause of both the 2000-01 downturn and the 2008-09 recession was not the oil price surge that preceded them. As their names make crystal clear, the 2001-01 downturn was the dot com bust and the 2008-09 recession was the global financial crisis. And yet, and yet… while the oil price surge was not the culprit, it was certainly the accessory to both murders, by driving up the bond yield and tipping an already fragile market and economy over the brink. Today, could oil become the accessory to another murder? (Chart I-1) Chart I-1AOil Was The Accessory To The Murder In 2008...
Oil Was The Accessory To The Murder In 2008...
Oil Was The Accessory To The Murder In 2008...
Chart I-1B...Could It Become The Accessory To Another Murder?
...Could It Become The Accessory To Another Murder?
...Could It Become The Accessory To Another Murder?
Oil Is The Accessory To Many Murders Turn the clock back to the 1970s, and it might seem more straightforward that the recession of 1974 was the direct result of the oil shock that preceded it. Yet even in this case, we can argue that oil was the accessory, rather than the true culprit of that murder. It is correct that the specific timing, magnitude, and nature of OPEC supply cutbacks were closely related to geopolitical events – especially the US support for Israel in the Arab-Israeli war of October 1973. Yet as neat and popular as this explanation is, it ignores a bigger economic story: the collapse in August 1971 of the Bretton Woods ‘pseudo gold standard’, which severed the fixed link between the US dollar and quantities of commodities. To maintain the real value of oil, the OPEC countries were raising the price of crude oil well before October 1973. Meaning that while geopolitical events may have influenced the precise timing and magnitude of price hikes, OPEC countries were just ‘staying even’ with the collapsing real value of the US dollar, in which oil was priced. Seen in this light, the true culprit of the recession was the collapse of the Bretton Woods system, and the oil price surge through 1973-74 was just the accessory to the murder (Chart I-2). Chart I-2In 1973-74, OPEC Was Just 'Staying Even' With A Collapsing Real Value Of The Dollar
In 1973-74, OPEC Was Just 'Staying Even' With A Collapsing Real Value Of The Dollar
In 1973-74, OPEC Was Just 'Staying Even' With A Collapsing Real Value Of The Dollar
A quarter of a century later in 1999, the oil price again trebled within a short time span – and by the turn of the millennium, the ensuing inflationary fears had pushed up the 10-year T-bond yield from 4.5 percent to almost 7 percent (Chart I-3). With stocks already looking expensive versus bonds, it was this increase in the bond yield – rather than a decline in the equity earnings yield – that inflated the equity bubble to its bursting point in early 2000 (Chart I-4). Chart I-3In 1999, As Oil Surged, So Did The Bond Yield...
In 1999, As Oil Surged, So Did The Bond Yield...
In 1999, As Oil Surged, So Did The Bond Yield...
Chart I-4...Making Expensive Equities Even More Expensive
...Making Expensive Equities Even More Expensive
...Making Expensive Equities Even More Expensive
To repeat, for the broader equity market, the last stage of the bubble was not so much that stocks became more expensive in absolute terms (the earnings yield was just moving sideways). Rather, stock valuations worsened markedly relative to sharply higher bond yields. Seen in this light, the oil price surge through 1999 was once again the accessory to the murder. Eight years later in 2007-08, the oil price once again trebled with Brent crude reaching an all-time high of $146 per barrel in July 2008. Again, the inflationary fears forced the 10-year T-bond yield to increase, from 3.25 percent to 4.25 percent during the early summer of 2008 (Chart I-5) – even though the Federal Reserve was slashing the Fed funds rate in the face of an escalating financial crisis (Chart I-6). Chart I-5In 2008, As Oil Surged, So Did The Bond Yield...
In 2008, As Oil Surged, So Did The Bond Yield...
In 2008, As Oil Surged, So Did The Bond Yield...
Chart I-6...Even Though The Fed Was Slashing Rates In The Face Of A Financial Crisis
...Even Though The Fed Was Slashing Rates In The Face Of A Financial Crisis
...Even Though The Fed Was Slashing Rates In The Face Of A Financial Crisis
Suffice to say, driving up bond yields in the summer of 2008 – in the face of the Fed’s aggressive rate cuts and a global financial system teetering on the brink – was not the smartest thing that the bond market could do. On the other hand, neither could it override its Pavlovian fears of the oil price trebling. Seen in this light, the oil price surge through 2007-08 was once again the accessory to the murder. Inflationary Fears May Once Again Lead To Murder Fast forward to today, and the danger of the recent trebling of the oil price comes not from the oil price per se. Instead, just as in 2000 and 2008, the danger comes from its potential to drive up bond yields, which can tip more systemically important economic and financial fragilities over the brink. One such fragility is the extreme sensitivity of highly-valued growth stocks to the 30-year T-bond yield, as explained in The Fed’s ‘Pain Point’ Is Only 30 Basis Points Away. On this note, one encouragement is that while shorter duration yields have risen sharply through October, the much more important 30-year T-bond yield has just gone sideways. A much bigger systemic fragility lies in the $300 trillion global real estate market, as explained in The Real Risk Is Real Estate (Part 2). Specifically, the global real estate market has undergone an unprecedented ten-year boom in which prices have doubled in every corner of the world. Over the same period, rents have risen by just 30 percent, which has depressed the global rental yield to an all-time low of 2.5 percent. Structurally depressed rental yields are justified by structurally depressed 30-year bond yields. Therefore, any sustained rise in 30-year bond yields risks undermining the foundations of the $300 trillion global real estate market (Chart I-7). Chart I-7Structurally Depressed Rental Yields Are Justified By Structurally Depressed 30-Year Bond Yields
Structurally Depressed Rental Yields Are Justified By Structurally Depressed 30-Year Bond Yields
Structurally Depressed Rental Yields Are Justified By Structurally Depressed 30-Year Bond Yields
Nowhere is this truer than in China, where prime real estate yields in the major cities are at a paltry 1 percent. In this context, the recent woes of real estate developer Evergrande are just the ‘canary in the coalmine’ warning of an extremely fragile Chinese real estate sector. This will put downward pressure on China’s long-duration bond yields. As my colleague, BCA China strategist, Jing Sima, points out, “Chinese long-duration bond yields are on a structural downtrend…yields are likely to move structurally to a lower bound.” But it is not just in China. Real estate is at record high valuations everywhere and contingent on no major rise in long-duration bond yields. In the US, there is a tight relationship between the (inverted) 30-year bond yield and mortgage applications for home purchase (Chart I-8), and a tight relationship between mortgage applications for home purchase and building permits (Chart I-9). Thereby, higher bond yields threaten not only real estate prices. They also threaten the act of building itself, an important swing factor in economic activity. Chart I-8The Bond Yield Drives Mortgage Applications...
The Bond Yield Drives Mortgage Applications...
The Bond Yield Drives Mortgage Applications...
Chart I-9...And Mortgage Applications Drive Building Permits
...And Mortgage Applications Drive Building Permits
...And Mortgage Applications Drive Building Permits
To repeat, focus on the 30-year T-bond yield – as this is the most significant driver for both growth stock valuations, and for real estate valuations and activity. To repeat also, the 30-year T-bond yield has been generally well-behaved over the past few months. But if a continued surge in the oil price – or other commodity or goods prices – started driving up the 30-year T-bond yield, the markets and the economy would feel pain. And at some point, this pain would force the Fed to volte-face. We reiterate that this pain point is only around 30 bps away, equal to a yield on 30-year T-bond of around 2.4-2.5 percent – a level that would be a great buying opportunity for bonds. Given the proximity of this pain point, it is too late to short bonds or for equity investors to rotate into value and cyclical equity sectors. That tactical opportunity has almost played out. On a 6-month and longer horizon, equity investors should prefer long-duration defensive sectors such as healthcare. The Korean Won Is Oversold Finally, in this week’s fractal analysis, we note that the Korean won is oversold – specifically versus the Chinese yuan on the 130-day fractal structure of that cross (Chart I-10). Chart I-10The Korean Won Is Oversold
The Korean Won Is Oversold
The Korean Won Is Oversold
Given that previous instances of such fragility have reliably indicated trend changes, this week’s recommended trade is long KRW/CNY, setting the profit target and symmetrical stop-loss at 2 percent. Dhaval Joshi Chief Strategist dhaval@bcaresearch.com Fractal Trading System Fractal Trades 6-Month Recommendations Structural Recommendations Closed Fractal Trades Indicators To Watch - Bond Yields Chart II-1Indicators To Watch - Bond Yields ##br##- Euro Area
Indicators To Watch - Bond Yields - Euro Area
Indicators To Watch - Bond Yields - Euro Area
Chart II-2Indicators To Watch - Bond Yields ##br##- Europe Ex Euro Area
Indicators To Watch - Bond Yields - Europe Ex Euro Area
Indicators To Watch - Bond Yields - Europe Ex Euro Area
Chart II-3Indicators To Watch - Bond Yields ##br##- Asia
Indicators To Watch - Bond Yields - Asia
Indicators To Watch - Bond Yields - Asia
Chart II-4Indicators To Watch - Bond Yields ##br##- Other Developed
Indicators To Watch - Bond Yields - Other Developed
Indicators To Watch - Bond Yields - Other Developed
Indicators To Watch - Interest Rate Expectations Chart II-5Indicators To Watch - Interest Rate Expectations
Indicators To Watch - Interest Rate Expectations
Indicators To Watch - Interest Rate Expectations
Chart II-6Indicators To Watch - Interest Rate Expectations
Indicators To Watch - Interest Rate Expectations
Indicators To Watch - Interest Rate Expectations
Chart II-7Indicators To Watch - Interest Rate Expectations
Indicators To Watch - Interest Rate Expectations
Indicators To Watch - Interest Rate Expectations
Chart II-8Indicators To Watch - Interest Rate Expectations
Indicators To Watch - Interest Rate Expectations
Indicators To Watch - Interest Rate Expectations

Over the weekend, China’s National People’s Congress announced that the State Council is preparing to expand property tax trials to more urban locations. Trials are already in place in Shanghai and Chongqing since 2011 – targeting second homes and high-end…
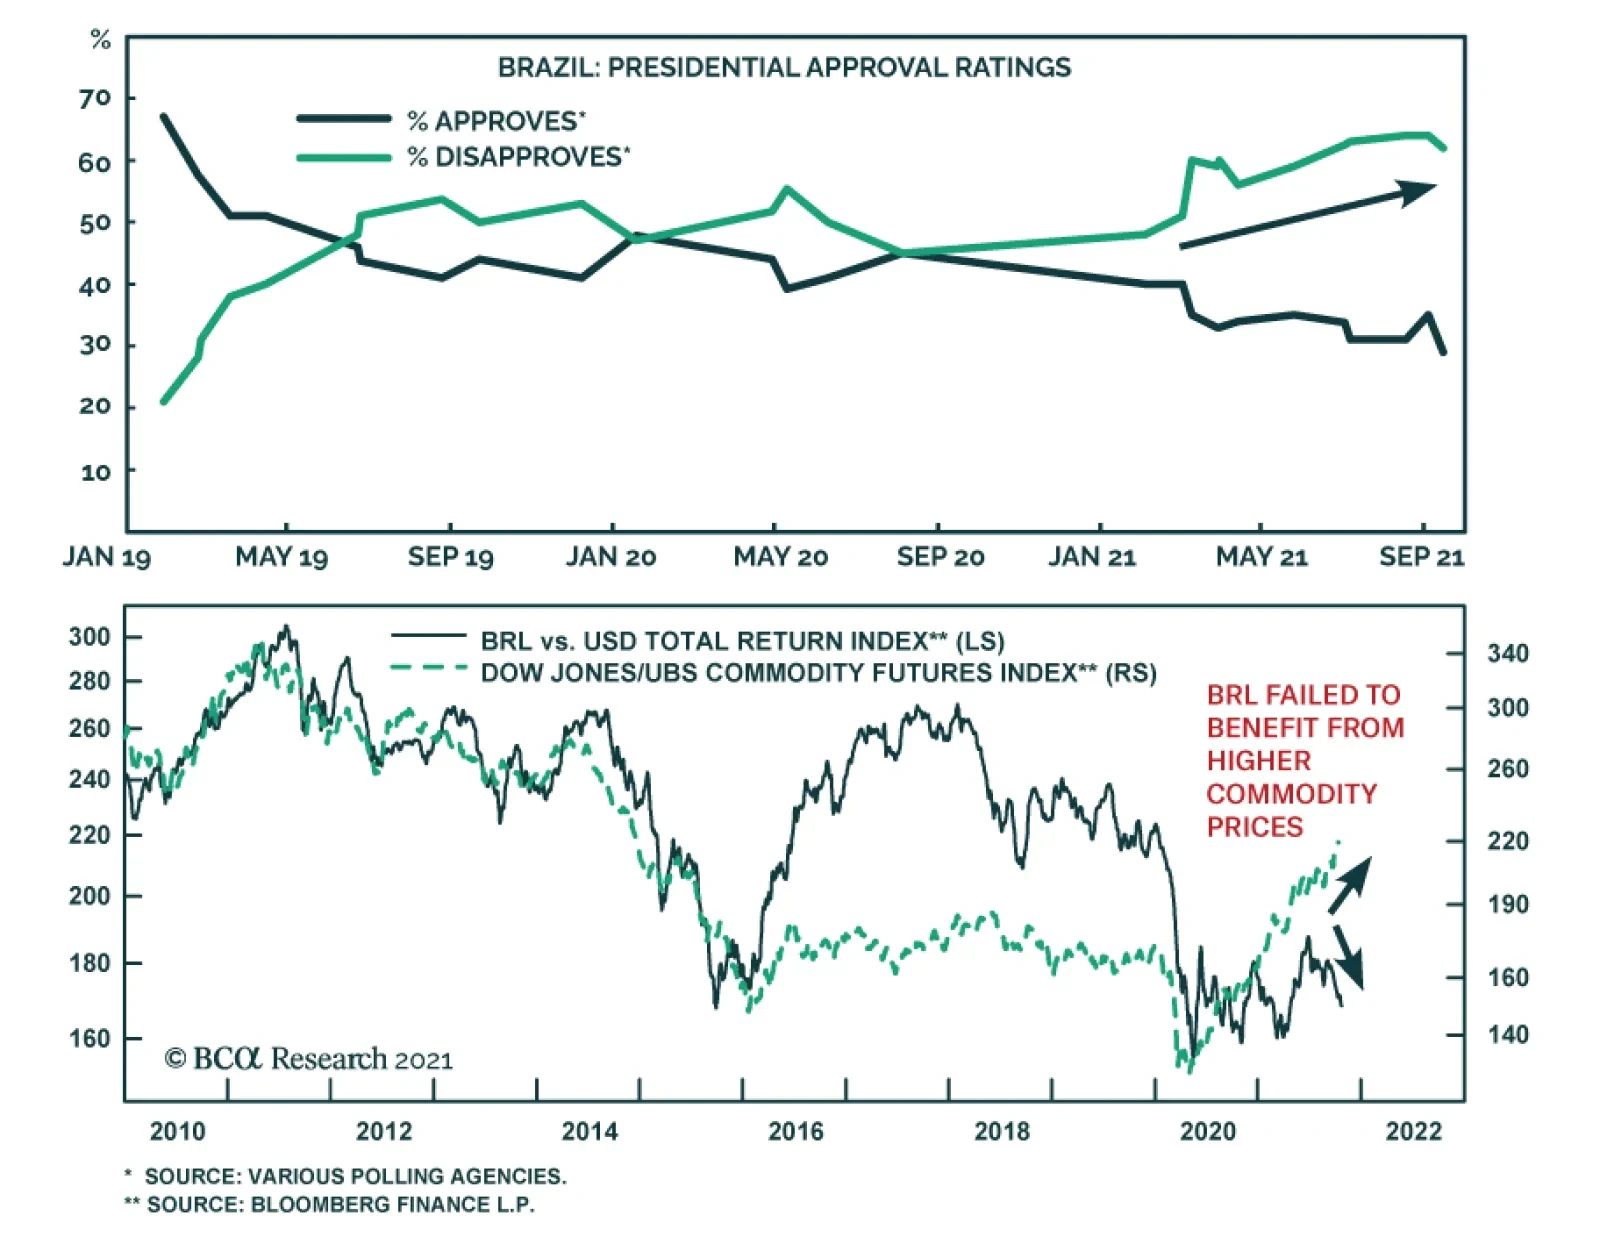
The Brazilian real has been among the worst performing EM currencies over the past few months, second only to the Turkish lira. Similarly, Brazilian equities peaked in mid-June and have been on a downtrend since. The latest source of turbulence is news of a…
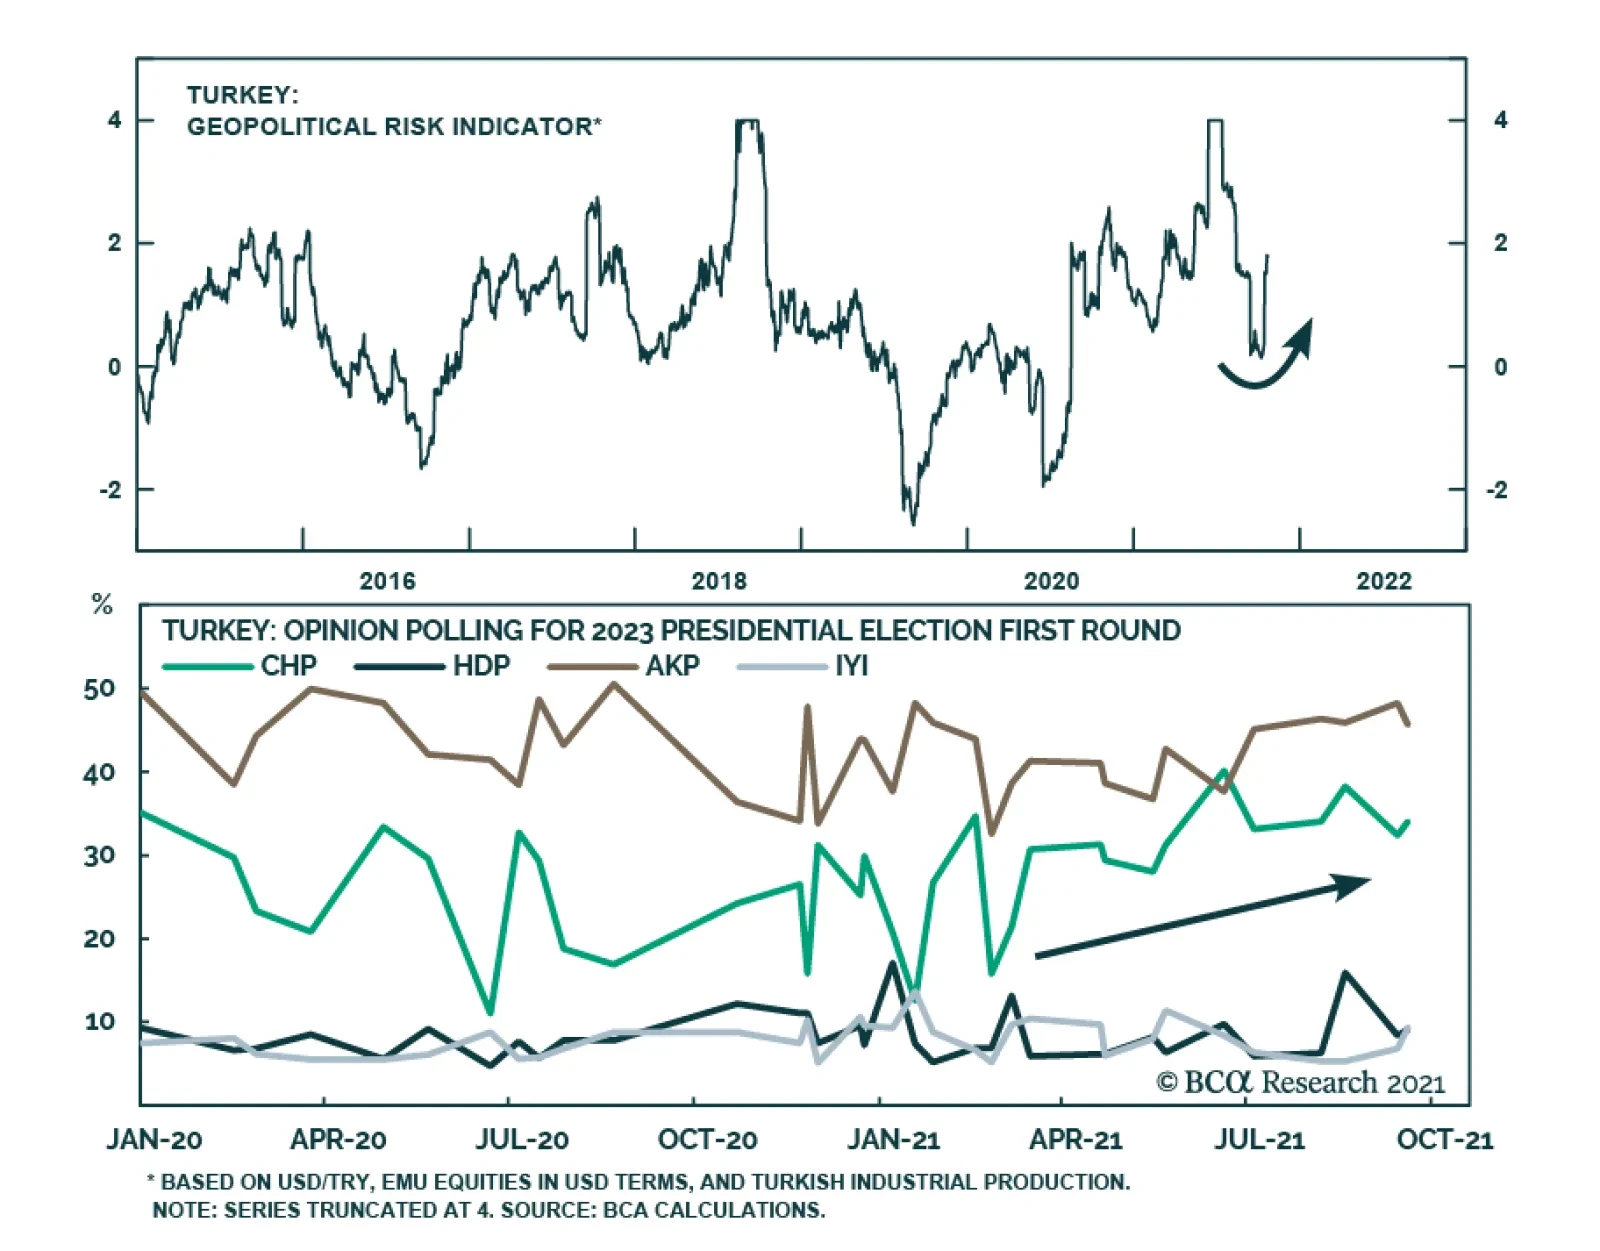
Political and geopolitical forces are joining domestic economic policy in damaging the outlook for the Turkish lira. On Saturday, President Recep Tayyip Erdogan risked inflaming tensions with the West by ordering that 10 ambassadors – including the US,…
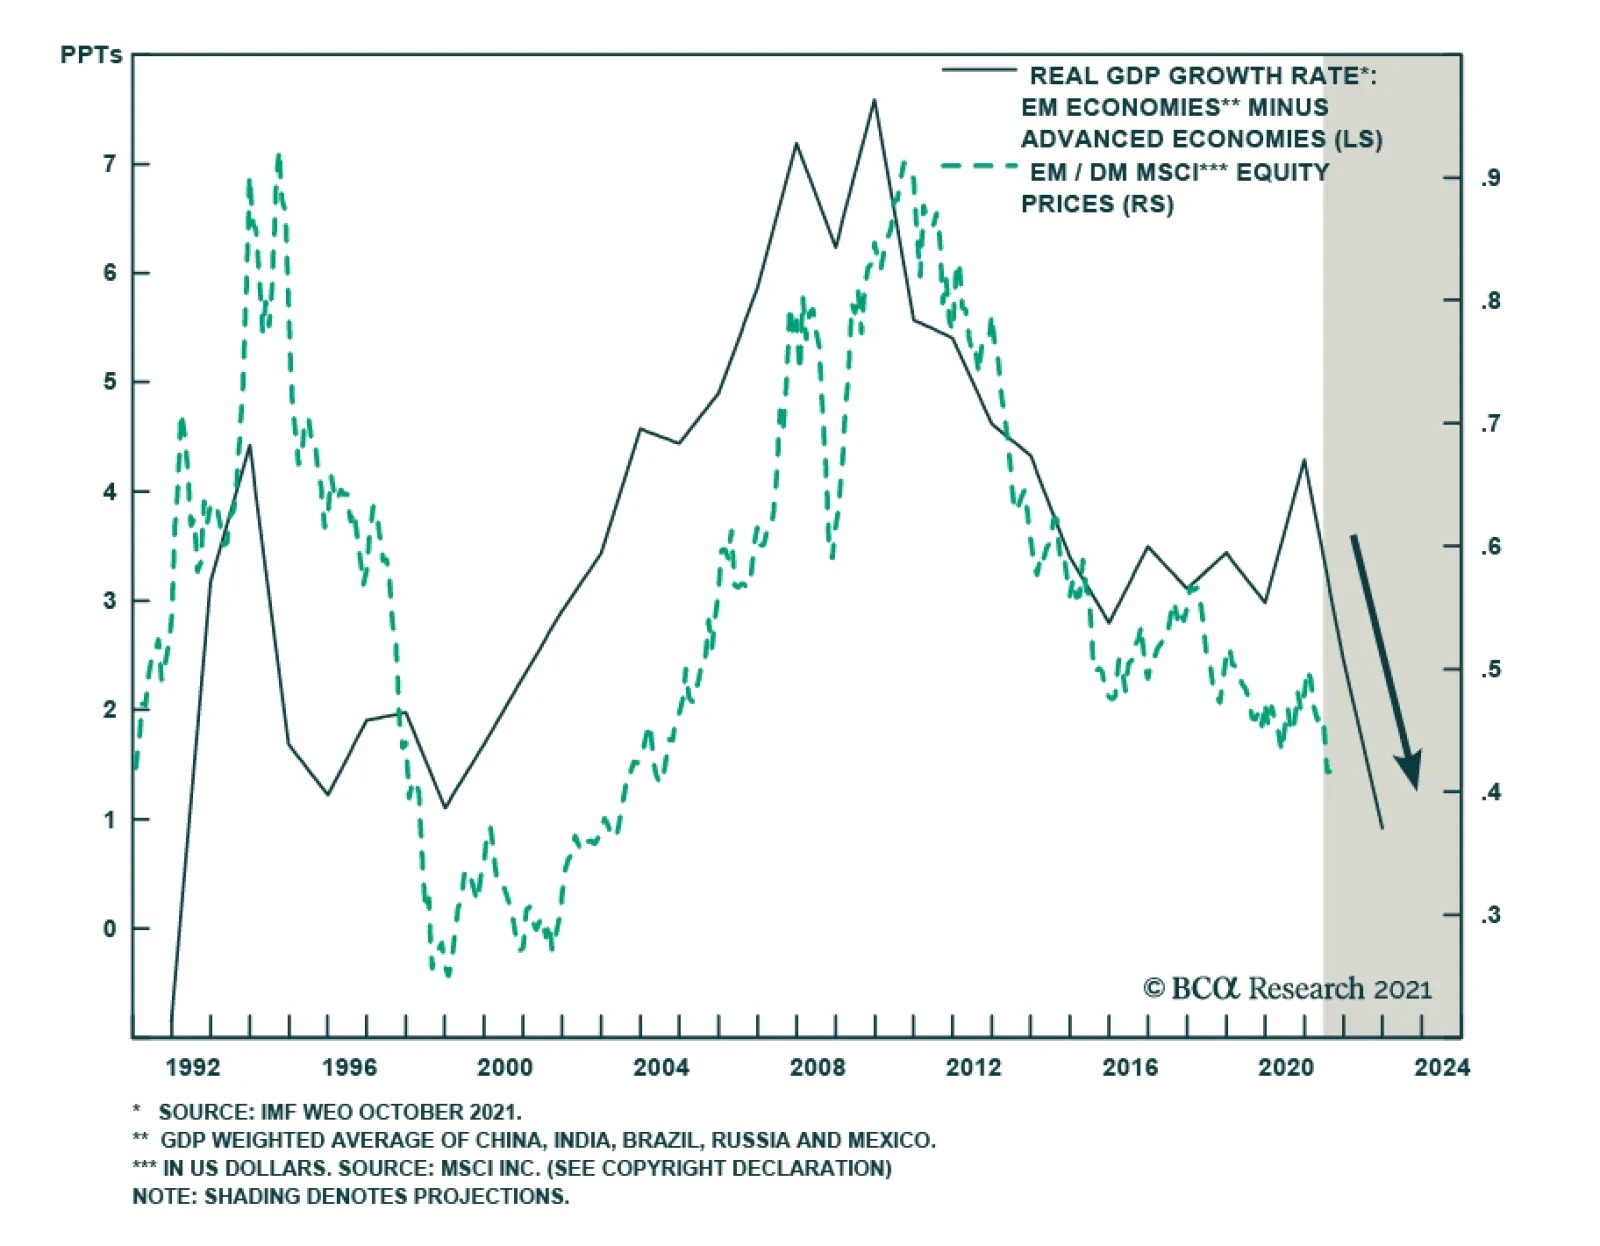
The IMF maintained its global growth outlook for 2022 unchanged in its October WEO, forecasting a 4.9% increase in real GDP. However, there were some changes beneath the surface. The real GDP projection for Advanced Economies increased slightly from 4.4% to…
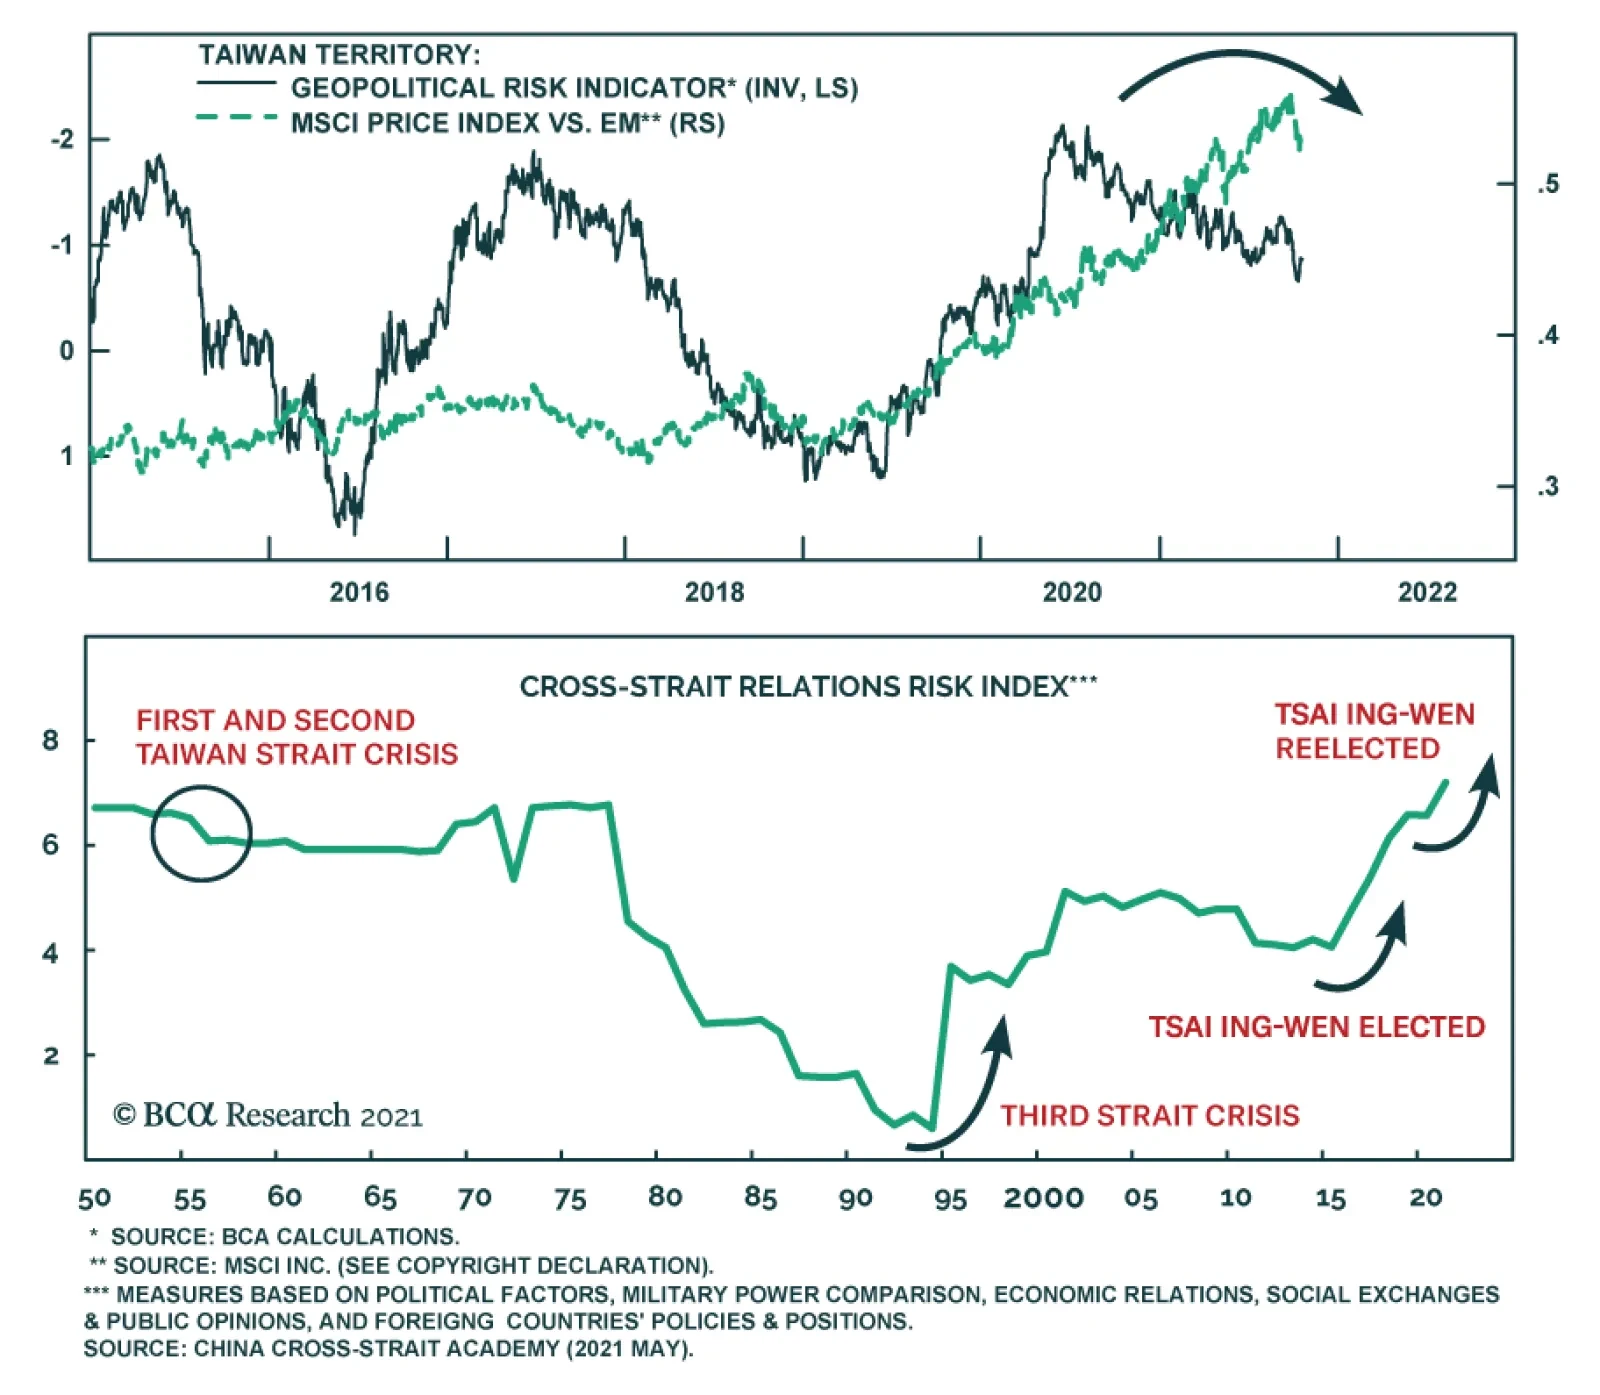
At a CNN town hall on Thursday President Biden stated that the US is committed to defending Taiwan[1] if China tried to attack it. The White House later clarified that there was no change in US policy towards Taiwan. Although the US supports Taiwan through…
Highlights The ruling African National Congress will be difficult to displace in upcoming elections given the large economic role it plays in the public sector and in low-income households. Low growth outcomes will continue as the government navigates allocating state funds more efficiently, amid rising public debt, weak macroeconomic fundamentals and a fresh undertaking of fiscal austerity. The African National Congress is primed to claw back some lost voter support with President Ramaphosa at the helm. But Ramaphosa will also put a stop to fiscal austerity ahead of the 2024 general election. Our new South Africa Geopolitical Risk Indicator captures moments of significant political risk in the past and currently signals that the country is facing a geopolitical and political risk level last seen in 2016. The political status quo will remain for now, which is positive for investors. But China’s economic troubles and South Africa’s eventual need to inflate away its debt pose long-term risks for investors. Feature In the wake of COVID-19, South Africa has witnessed an increase of civil unrest. Severe looting in July 2021 only lasted a couple of days and was mostly contained to the central and eastern parts of the country but it nearly brought the country to a stand-still. The imprisonment of former President Jacob Zuma and a harsh lockdown amid resurging COVID-19 cases at the time fanned flames already lit by long-standing structural economic issues. The country has been stuck in a low growth trap for several years and government is facing constraints from rising debt levels. Yet the ruling party (the African National Congress, or ANC) will be difficult to displace in upcoming municipal elections and future general elections. It plays a large role in the public sector and low-income households depend heavily on government grants. Moreover, the ruling party also enjoys a “liberator” status, with voters pledging support to the ANC based on the party’s historical achievement of playing a major role in ending the apartheid regime. Unless the party implodes from within – possible but unlikely – the ANC will continue to rule, which is also the best outcome for investors at the current juncture. Low Growth Continues Amid High Debt The South African economy was straining before the pandemic and will continue to underperform going forward. Plagued by rampant corruption, misused state funds, and a lack of political leadership, the public sector has dragged on growth for several years now. Coupled with poor productivity in the primary and secondary sectors, South Africa’s economy faces headwinds which will affect future growth outcomes for years to come (Chart 1A).
Chart 1
In the mining sector, the country’s top foreign exchange earner, output has been in a structural decline since 1980 even as the country has benefited from several commodity price booms (Chart 1B). More recently, Ramaphosa’s 2018 investment drive to rebuild South African industries has failed to galvanize a turnaround.1 Manufacturing is much of the same story as mining. Output has been in decline from 1990 and has reached its lowest level since mid-1960 (Chart 1C). The National Union of Metal Workers have recently undertaken a protracted strike that has lasted three weeks already – with many industry bodies citing the dangers of irreparable harm to production and severe job losses should the strike continue for much longer. Other factors such as intermittent electricity outages across the country will subtract from productivity going forward. Chart 1BPrimary Sector Productivity In Structural Downfall...
Primary Sector Productivity In Structural Downfall...
Primary Sector Productivity In Structural Downfall...
Chart 1C...Followed By The Secondary Sector
...Followed By The Secondary Sector
...Followed By The Secondary Sector
Chart 2Public Debt Is Ballooning Fast
Public Debt Is Ballooning Fast
Public Debt Is Ballooning Fast
From longstanding misuse of public funds comes the ballooning public government debt (Chart 2). Our colleagues over at the BCA Emerging Markets Strategy team have assessed the state of fiscal policy and debt in South Africa and the outlook is bleak. The government is currently pursuing fiscal austerity measures to rein in debt. However, these measures are unlikely to be enough and will become politically untenable over time. Otherwise, to stabilize debt, policy makers will have to inflate their way out of debt servicing costs or increase fiscal spending to boost nominal GDP growth. According to the 2021 budget speech, real spending is projected to contract each year over the next three years. This marks the first cut to nominal noninterest government expenditure in at least 20 years. Other items such as health care will see spending cuts over the next three years and remain lower than 2013 levels. Social protection and job creation initiatives will also see spending cuts. Another large budgetary item that will see spending cuts is the public sector wage bill. The government has reiterated its commitment to curb this growing expense. Recent negotiations with civil servants saw only a 1.5% wage increase over the next year compared to an average growth rate of 7% over the last five years. Chart 3Government Spending Important To Demand
Government Spending Important To Demand
Government Spending Important To Demand
Austerity measures will lower public sector demand and ultimately growth. However, if successful, they will bolster both potential economic growth and the ruling party’s support. The problem is the timing of the general election in 2024. The economic backdrop in the country remains weak. Assuming more civil unrest takes place, government finances will be burdened with picking up the cost again and appeasing the masses through higher social spending. Austerity measures will presumably be relaxed ahead of the 2024 vote. Government debt needs to be curtailed considering that debt servicing costs are the second largest expenditure item of the country’s national economic budget. But given how large the public sector contributes to local demand (Chart 3), the ANC will see pushback by trade unions and those that have been in its growing employ. However, pushback will not necessarily translate into an irreversible breakdown of political support. Trade unions have been part and parcel of the ANC since the party’s inception. The party will have to strike a balance to keep the unions on its side. Bottom Line: Under Ramaphosa’s leadership, government austerity measures will continue at least over the short to medium term but will most likely be balanced to ensure the ANC maintains control through the 2024 elections. Ramaphosa Strengthens The ANC Civil unrest is nothing new in South Africa. There have been various displays of civil unrest and riots in recent years. The most recent civil unrest led to over 300 civilian casualties, the deadliest since the apartheid era. However, casualties were mostly a result of public stampeding civilian-on-civilian violence. The government did not play a major role in these deaths compared to the Marikana massacre of 2012.2 Even then, despite the ANC facing backlash from the immediate community, the party suffered no major fallout nationally. Recent unrest was more widely spread this time around and serves as an early warning signal to the ANC that social risks are high and not abating. But as things stand, these events will not displace the ANC from power. Such events would need to occur more regularly across the entire country, for them to pose a real threat to ANC rule. Since taking the helm of the ruling party in late 2017, Ramaphosa is viewed a lot more favorably than his predecessor, Zuma, by most South Africans. Ramaphosa is more business friendly, transparent, and is at least trying to weed out corruption in government. The public view of Ramaphosa’s handing of COVID-19 has been improving. Even supporters of the Democratic Alliance, the official opposition, and the Economic Freedom Fighters, a radical far-left party, have shown a large improvement in their approval of Ramaphosa’s handling of the pandemic (Chart 4). The Economic Freedom Fighter’s growth has largely been driven by disgruntled ANC supporters in recent years. Seeing supporters of the Economic Freedom Fighters improve their approval of Ramaphosa is positive for the ANC in upcoming elections.
Chart 4
The ANC has two significant backstops to any deep erosion of their voter base: feudalism and social grants. Feudalism is defined as a socioeconomic structure in which people work for a leader of a community or tribe who in return, give them protection and use of land. It still runs deep in South Africa and across its cultures and tribes. It gives life to the ANC, a strong base that the Economic Freedom Fighters will always have a tough time chipping away at. Rural voters matter most to the ANC and mostly live under feudal rule. Tribal leaders and village chiefs play a major part in everyday life for rural people. There is overwhelming support among these leaders for the ANC because the ruling party provides them with access to land, among other things. By contrast, the Democratic Alliance and the Economic Freedom Fighters have had little success in penetrating these barriers. Support for both of these parties is driven by urban dwellers. The overarching royal Zulu family is the biggest factor contributing to feudalism. The Zulu family will always support the ANC and ensure their people do too. The Zulus are the largest tribe of black South Africans and have significant interests in the ANC maintaining power, such as access to land and financial resources. Obviously they have historic ties to the founding of the ANC and past leaders of the ANC, including Zuma (but not Ramaphosa). Additionally, the tripartite alliance of trade unions, the South African Communist Party, and the ANC has always ensured that workers represented in labor unions across the country voted for the ANC. The candidate elected president of the ANC, and ultimately the country, has always had the backing of trade unions, represented by the largest, the Congress of South African Trade Unions.3 The Congress of South African Trade Unions has never waived their support of the ANC in any elections and have shown no interest in supporting any other parties. The social grants system is the second backstop. The ANC provides social payments to 22% of the population, of which approximately 76% of recipients vote for the ANC (Chart 5, top panel). That’s a significant amount of the population that will forego a large part of their economic livelihoods if they vote for the Economic Freedom Fighters or another party to rule the country. In the current climate of COVID-19, foregoing government grants in order to vote for another party will not happen. Voters are increasingly worried about losing their social grants if another party comes into power (Chart 5, bottom panel). While other parties like the Economic Freedom Fighters have promised to more than double the going social grant rate if they come to power, social grant recipients and ANC voters at large have not budged on this “promise.” A sure thing today is better than a gamble tomorrow. But, if the fiscal standing of the country teeters into a position whereby the ANC fails to meet its growing social grant liabilities, then the Economic Freedom Fighters will gain the most, even if its promises will be extremely difficult to back up. Upcoming municipal elections in November 2021 will put to the test whether the ANC will shed support like it did in the 2016 election (Chart 6, top panel). Under Zuma, the ANC’s losses were the Economic Freedom Fighter’s gains. In the 2019 general election this transfer of votes lost some momentum because of Ramaphosa’s ability to galvanize support for the ANC (Chart 6, bottom panel). The Economic Freedom Fighter’s rise has been driven by the party’s ability to berate the ANC on its systemic corruption, embodied in Zuma. With Zuma in jail and Ramaphosa cleaning up the party and government, the Economic Freedom Fighters will lose momentum in forthcoming elections.4
Chart 5
Chart 6
To the ANC’s benefit, opposition parties that won some significant metros in the 2016 municipal elections subsequently formed coalitions that have largely failed to govern well. Specifically, in the economic capital of Johannesburg, the ANC reclaimed a majority to govern the city through coalitions with smaller parties, after the Democratic Alliance and Economic Freedom Fighters governed the city following the 2016 election. While the ANC has only reclaimed one of three metros lost in the 2016 municipal elections, they have benefited from lackluster service delivery by opposition parties which has shown that there is no realistic alternative to the ANC right now.5 Bottom Line: As Ramaphosa cleans up the ANC and government, the ANC will shed less support to the EFF and look to claw back lost voters in forthcoming elections. Introducing Our South Africa GeoRisk Indicator Recent civil unrest in South Africa presents an ideal backdrop to introduce a new GeoRisk Indicator to our existing suite of thirteen indicators. Our newly devised South Africa GeoRisk Indicator captures moments of significant political risk in the past, including this year’s civil unrest, and currently signals that the country is facing a geopolitical and political risk level last seen in 2016, when President Zuma was on his way out of office (Chart 7). Chart 7South Africa Geopolitical Risk Indicator
South Africa Geopolitical Risk Indicator
South Africa Geopolitical Risk Indicator
The South Africa indicator is based on the rand and US dollar exchange rate (ZAR/USD) and its deviation from four underlying macro variables that should otherwise explain its economic trend. These variables are: gold prices, emerging market equities, industrial production, and retail sales. The four variables cover South Africa’s commodity dependency, financial sector, and the supply and demand side of the domestic economy. All four variables exhibit sufficient correlation with the ZAR/USD for use in this indicator. If the ZAR/USD weakens relative to these variables, then a South Africa-specific risk premium is apparent. As with previous indicators, we ascribe that premium to politics and geopolitics, although this is a generalization, and a qualitative assessment must always be made. The indicator is effective in tracking the country’s recent history too. Events such as ex-President Zuma’s general election win in 2009, and his controversial firing of several finance ministers in late 2015, signal an increase in risk. Meanwhile, lower risk was implied when current president, Ramaphosa, was elected president of the ANC in late 2017, and later, in 2019, as president of the country. Some additional events worth highlighting include: (1) In late 2001 to mid-2002, the local currency lost significant value relative to the US dollar for several reasons. First, the 1998 Asia financial crisis continued to send aftershocks throughout the emerging markets. The ZAR was put through the ringer in forward markets by speculators on a frequent basis, buying cheaper in the spot and driving speculation in the forward market, making easy returns. This speculation was only compounded by the South African Reserve Bank’s intervention in the local currency market to curtail speculation through regulatory action. Second, money supply grew substantially from mid-2001 to early 2002, which is associated with exchange rate undershooting.6 Thirdly, adding to these factors, contagion risk from neighboring Zimbabwe, which was dealing with land seizures and food shortages at the time, played into risk aversion toward regional and South African assets. (2) Eskom, South Africa’s state-owned power utility company, implements more regular power outages amid struggles to supply rising demand. (3) Despite allegations of corruption, former President Zuma wins the ANC presidential nomination. Zuma becomes party president. (4) Former President Zuma wins the general election (5) Former President Zuma fires well-respected then finance minister Nhlanhla Nene (6) Former President Zuma fires well-respected then finance minister Pravin Gordhan (7) President Ramaphosa wins the ANC presidential nomination. Ramaphosa becomes party president. (8) Former President Zuma resigns from the presidency (9) Former US President Donald Trump tweets on white farm murders in South Africa7 (10) President Ramaphosa wins the general election (11) First COVID-19 case is reported (12) Civil unrest and looting In terms of South African assets, when geopolitical and political risk rises, investors favor alternative emerging market assets (Chart 8). In 2021, South African equities have climbed to levels last seen in 2018 on the back of an improving global growth outlook and swelling commodity prices. But recent civil unrest has seen local equities pull back a notch. If risks escalate further, local assets will continue to retreat. Chart 8Geopolitical Risk Signals Move To Alternative Bourses
Geopolitical Risk Signals Move To Alternative Bourses
Geopolitical Risk Signals Move To Alternative Bourses
Investment Takeaways Table 1 provides a snapshot of equity performance, volatility, and relative valuations and momentum in South Africa compared to frontier markets, including African frontier markets, and emerging markets. Table 1South Africa And African Frontier Markets: Valuations, Momentum, Volatility
South Africa: Ruling Party Will Stay
South Africa: Ruling Party Will Stay
Chart 9Wait And See On Frontier Markets
Wait And See On Frontier Markets
Wait And See On Frontier Markets
Equity returns in South Africa have notched good gains as global growth picks up alongside rising commodity prices. On a risk-adjusted basis, however, Nigeria and Kenya are more attractive. The general aggregates of Frontier and African frontier markets are more attractive on the same basis. Price and timing wise, Table 1 shows valuations and momentum relative to other markets. South Africa is cheap but Nigeria is cheaper. On a cyclical basis, South Africa has more to offer than Nigeria. African countries such as Nigeria and Ghana are all prepped to move higher in the wake of cheaper currencies. But a widening financial crisis in China is a risk to these countries given how they have trended closely with Chinese total social financing (Chart 9). Meanwhile, Kenyan equities have outperformed. South African equities in US dollar terms have retreated somewhat following recent civil unrest and some contagion linked to China’s Evergrande crisis (Chart 9, second panel). If China secures its economic recovery, then higher commodity prices will boost miners and industrial stocks going forward. But this is not guaranteed. Upcoming municipal elections will aid investors in determining what to expect from the policy backdrop. We expect that the ANC will stabilize, i.e. not lose control of more cities, and this should throw some impetus back into local equities. Conclusion This year’s civil unrest was stark and disruptive but does not spell fundamental political destabilization or the end of ANC rule in upcoming elections. The South African economy is structurally weak and, aside from a bounceback on the post-pandemic recovery, will continue to lag its peers until the ANC and Ramaphosa get a solid grip on allocating state funds more efficiently, promoting a more friendly and stable business environment, and fighting corruption. Undertaking fiscal austerity now is not a bad thing for the ANC, but it will become an increasing political liability leading up to the next general election. Ramaphosa will have to pull the plug on fiscal cost cutting as soon as 2023, so as to allow demand to recover before voters head to the polls again in 2024. But this has longer term economic implications. Public debt will continue to rise in this case and add to debt default risk and debt servicing costs. If austerity is reinstated after elections, the South African economy will remain in a low growth trap. For now, tightening the fiscal belt is doable because of the dynamic created by the downfall of Zuma, giving support to austerity as a means of cutting back corruption, and the pandemic, which reinforces the ANC as the institutional ruling party during a time of national crisis. Guy Russell Research Analyst GuyR@bcaresearch.com Appendix The market is the greatest machine ever created for gauging the wisdom of the crowd and as such our Geopolitical Risk Indicators were not designed to predict political risk but to answer the question of whether and to what extent markets have priced that risk. Our South African GeoRisk Indicator (see Chart 8 above) makes use of the same methodology used for all thirteen of our other indicators. The methodology avoids the pitfall of regression-based models. We begin with a financial asset that has a daily frequency in price, in this case the ZAR/USD, and compare its movement against several fundamental factors. These factors are the price of gold in US dollars, emerging market equities in US dollar terms, South African industrial production, and South African retail sales. Like our recently added Australia GeoRisk Indicator, South Africa is a commodity exporting country. South Africa is the largest producer of platinum in the world, and was the seventh largest gold producer by volume in 2019. Gold is South Africa’s largest export and the ZAR has a strong historic correlation to gold prices.8 Hence we use gold prices instead of platinum, which is less well correlated. South Africa also has a deep financial market, with lose capital controls and easy flow of funds. When sentiment toward EM equities is high, the ZAR benefits, and hence our inclusion of emerging market equities. On the supply and demand side of the economy, both industrial production and retail sales show a strong relationship with the ZAR. We include these as the last two variables measured in our indicator. All four variables exhibit strong correlation with the local currency. If the currency sharply underperforms them, then it must be weighed down by some risk premium, which we ascribe to domestic political and policy developments or the general geopolitical environment. Footnotes 1 In 2018, President Cyril Ramaphosa laid out a target of $100 billion in new investments over the next five years, primarily targeting primary and secondary industries. According to The United Nations Conference on Trade and Development, foreign direct investment flows into South Africa in 2020 almost halved to $2.5 billion from $4.6 billion in 2019, which was a 15% decline from around $5.4 billion in 2018. 2 The Marikana massacre was the killing of 34 miners by the South African Police Service. It took place on 16 August 2012 and was the most lethal use of force by South African security forces against civilians since 1976. 3 According to the International Labour Organization, South Africa’s union density rate was 28.1% in 2016. Strikingly, the public sector union density rate was approximately 70.1% compared to 29.1% in the private sector. 4 In June 2021, ex-President Jacob Zuma was sentenced to 15 months imprisonment for contempt of court, by failing to legally attend a tribunal on corruption in South Africa. Zuma has recently been released on medical parole. 5 In the 2016 municipal elections, the ANC lost control of three major metros. Pretoria (political capital), Johannesburg (economic capital) and (Port Elizabeth, or Nelson Mandela Bay). The official opposition (the Democratic Alliance) and the Economic Freedom Fighters formed governing coalitions in all three of the lost ANC metros. Opposition coalitions have struggled to govern more effectively than what the ANC did, given how far apart they are ideologically. In Pretoria and Nelson Mandela Bay, service delivery has been poor since, in line with ANC rule prior to 2016. In Johannesburg, the ANC won back the metro by forming a coalition with several smaller parties. Opposition coalitions are still in force in Pretoria and Nelson Mandela Bay. 6 Bhundia, A.J. and Ricci, L.A., 2005. The Rand Crises of 1998 and 2001: What have we learned. Post-apartheid South Africa: The first ten years, pp.156-173. 7 Donald Trump tweets "I have asked Secretary of State @SecPompeo to closely study the South Africa land and farm seizures and expropriations and the large scale killing of farmers." The South African government have not seized any farms nor have there been any recordings of large-scale farm killings. The tweet caused a minor sell-off in local assets at the time. 8 Arezki, Rabah & Dumitrescu, Elena-Ivona & Freytag, Andreas & Quintyn, Marc. (2012). Commodity Prices and Exchange Rate Volatility: Lessons from South Africa’s Capital Account Liberalization. Emerging Markets Review. 19. Jordaan, F. Y., & Van Rooyen, J. H. (2011). An empirical investigation into the correlation between rand currency indices and changing gold prices. Corporate Ownership & Control, 9(1-1), 172-183.
Dear client, In addition to this week’s brief report, we presented at our annual BCA conference on the challenges to the US dollar’s reserve status. If you missed the session, please contact your account representative for a replay. Kind regards, Chester Highlights The gold/silver ratio is relapsing anew. This has historically been a bearish omen for the dollar. Many petrocurrencies have lagged the rise in oil prices, and offer a very attractive carry. Go long a basket of oil producers (NOK, RUB, MXN and COP) versus the euro. Currency volatility is too low, and is bound to rise. Stay long CHF/NZD on this basis. Remain tactically long EUR/GBP as a play on slight policy convergence between the UK and the euro area. Feature Chart I-1Being Short The Dollar Has Hurt This Year
Being Short The Dollar Has Hurt This Year
Being Short The Dollar Has Hurt This Year
Investing in currencies is tough. One of the reasons is that the currency market is the melting pot of a confluence of catalysts. These range from relative growth dynamics, policy divergences, sector biases that dictate portfolio flows and politics, among many other factors. Our bias has always been that acting on perfect information is a highly improbable feat because we are not insiders. As such, in April 2020, we designed a rules-based model to see if, over time, currencies could be traded purely based on publicly available information. Our results, grounded on the fundamental basis that has defined the BCA approach, was a positive surprise (Chart I-1). Armed with this conviction, this week’s bulletin is focused on a few themes we have held and trading opportunities around these. In a nutshell, a positive bias on any currency can be calibrated on a good macro catalyst, a valuation cushion, and going against the consensus. An Inflation Hedge On A Reflationary Boom It is becoming more evident that inflation might prove stickier than most policymakers expect. This is bad news for real interest rates. Negative real rates have been historically positive for gold and other precious metals. Within this sphere, our preference has been silver. First, silver is a reflationary metal and tends to do well when global growth is strong and the dollar is falling (Chart I-2). Since the onset of the COVID-19 crisis, silver has had a near-perfect negative correlation with the dollar (Chart I-3). Chart I-2Gold, Silver, And the Dollar
Gold, Silver, And the Dollar
Gold, Silver, And the Dollar
Chart I-3Silver Is A Good Reflation Play
Silver Is A Good Reflation Play
Silver Is A Good Reflation Play
There are also an economic and valuation cases to be made for silver. Economically, silver is a byproduct of both copper and zinc mining, which have had supply-side disruptions. Meanwhile, a boom in goods demand has boosted the demand for silver, which mainly goes into electronics production. The combination is leading to a deficit in the silver demand/supply balance (Chart I-4). On the valuation side, the fair value for the gold/silver ratio is near 50, which has been the mean since the 18th century (Chart I-5) Chart I-4Silver Has A Supply Deficit
Silver Has A Supply Deficit
Silver Has A Supply Deficit
Chart I-5Gold Is Expensive Relative To Silver
Gold Is Expensive Relative To Silver
Gold Is Expensive Relative To Silver
Fundamentally, both silver and gold are precious metals. Just like gold, silver benefits from low interest rates, plentiful liquidity, and the incentive for currency wars and fiat money debasement. However, the gold/silver ratio tends to peak when the environment migrates from reflationary to inflationary (Chart I-6). As such, silver is a good inflationary hedge amidst a reflationary boom. This brings us to the sweet spot for silver. Even if global growth remains tepid over the next few months, a lot of the bad news is already reflected in silver prices, especially vis-à-vis gold. Relative speculative positioning hit a low of -25% as a percent of open interest. Relative sentiment on gold is 10% higher relative to silver. This is bullish from a contrarian perspective (Chart I-7). Chart I-6Silver Does Well With Rising Inflation
Silver Does Well With Rising Inflation
Silver Does Well With Rising Inflation
Chart I-7Silver Has Been Shunned Relative To Gold
Silver Has Been Shunned Relative To Gold
Silver Has Been Shunned Relative To Gold
Higher Currency Volatility Currency volatility is likely to rise in the coming months. Options markets offer many opportunities to trade this theme, but being long CHF/NZD is an attractive bet as well (Chart I-8). The kiwi is backed by a very hawkish central bank that will likely dial back its rhetoric amid much uncertainty about the growth outlook. Meanwhile, the kiwi is expensive according to most of our models. As such, we expect the kiwi to rise vis-à-vis the greenback over a cyclical horizon, but we feel it is at risk on a tactical basis. Chart I-8CHF/NZD Tracks Dollar Volatility
CHF/NZD Tracks Dollar Volatility
CHF/NZD Tracks Dollar Volatility
The RBNZ has decided to introduce house price considerations into its mandate. While this is politically palatable, it is economically unviable as rising real estate prices are a global phenomenon. The risk is that a hawkish RBNZ tilts the economy over, especially if the current environment is stagflationary. As such, we are short the NZD at the crosses. Our long AUD/NZD position is based on policy convergence between Australia and New Zealand and our long CHF/NZD is based on rising currency volatility. We were stopped out of our long CHF/NZD position and are reinitiating the trade today. A Play On Higher Oil Prices Oil prices are likely to stay elevated in the coming months. But even if they relapse, a bet on being long oil producers versus consumers could still prove profitable. Petrocurrencies have lagged the performance of oil tremendously (Chart I-9). This is especially the case when looking at oil-producing countries versus oil-consuming ones. RUB, COP, and MXN are trading well below their implied levels relative to the USD, EUR, and RMB. Chart I-9Petrocurrencies Will Catch Up With Oil Price
Petrocurrencies Will Catch Up With Oil Price
Petrocurrencies Will Catch Up With Oil Price
A lot of oil players are seeing a rebound in their economies, as their populations get vaccinated. Russia, Mexico, Brazil, and Colombia all have lower new COVID-19 incidences, compared to earlier this year and versus the US (Chart I-10). As a result, economic activity is rebounding in these countries relative to the US (Chart I-11). Our bias is that the dollar will resume its cyclical bear market in the coming months. This will push up many petrocurrencies, as the path of the dollar usually dictates the performance of many developed and emerging market currencies (Chart I-12). Chart I-10A Drop In Infections Outside The US...
A Drop In Infections Outside The US...
A Drop In Infections Outside The US...
Chart I-11...Leading To A Recovery In Growth
...Leading To A Recovery In Growth
...Leading To A Recovery In Growth
Chart I-12Petrocurrencies Track The Dollar
Petrocurrencies Track The Dollar
Petrocurrencies Track The Dollar
The big risk is a slowdown in China, which will have a meaningful impact on oil demand. The Chinese credit impulse correlates quite well with commodity and oil currencies, and therefore, should the impulse slow further, this will meaningfully impact import demand (Chart I-13). Our bias is that there is little downside to the credit impulse in China, while the imperative to stimulate the economy could be rising. So far, the authorities have been able to ringfire the crisis with no meaningful capital outflows (Chart I-14). Chart I-13China Slowdown A Risk...
China Slowdown A Risk...
China Slowdown A Risk...
Chart I-14...But No Systemic Risk Yet
...But No Systemic Risk Yet
...But No Systemic Risk Yet
On the sentiment and valuation fronts, the case for petrocurrencies is more compelling. Starting with valuation, all of our models show many petrocurrencies as deeply undervalued. On a real effective exchange rate basis, the MXN, COP, and BRL are trading well below historical averages (Chart I-15). On the sentiment front, it is true that many petrocurrencies have lagged the increase in oil prices amid domestic demand concerns. This is bound to change as populations get vaccinated and their economies reopen. More importantly, many petrocurrencies sport very attractive real rates (Chart I-16). If our bias on a dollar decline proves correct, then the carry will be an added bonus. As such, we recommend going long a basket of RUB, COP, and MXN against the euro Chart I-15Most Petrocurrencies Are Cheap
Most Petrocurrencies Are Cheap
Most Petrocurrencies Are Cheap
Chart I-16Petrocurrencies Have An Attractive Carry
Petrocurrencies Have An Attractive Carry
Petrocurrencies Have An Attractive Carry
Chester Ntonifor Foreign Exchange Strategist chestern@bcaresearch.com Currencies U.S. Dollar Chart II-1USD Technicals 1
USD Technicals 1
USD Technicals 1
Chart II-2USD Technicals 2
USD Technicals 2
USD Technicals 2
The US economy remains relatively robust: Retail sales came in at 1.8% month-on-month in September, well above consensus of an 0.8% increase. Sentiment in the US is drifting lower, according to the Michigan survey. The current conditions component of the index slipped from 80.1 to 77.9 in October. The sentiment component also fell from 72.8 to 71.4. Portfolio flows into the US remained strong with net TIC inflows of $US 126bn. Both housing starts and building permits rose in September. Ditto for existing home sales, that increased from 5.88mn to 6.29mn. The US dollar DXY index fell this week. The general tone to markets has been risk on, which has led to less demand for the safe-haven dollar. Meanwhile, according to CFTC data, speculators are very long the dollar which is bearish from a contrarian perspective. Report Links: Arbitrating Between Dollar Bulls And Bears - March 19, 2021 The Dollar Bull Case Will Soon Fade - March 5, 2021 Are Rising Bond Yields Bullish For The Dollar? - February 19, 2021 The Euro Chart II-3EUR Technicals 1
EUR Technicals 1
EUR Technicals 1
Chart II-4EUR Technicals 2
EUR Technicals 2
EUR Technicals 2
Euro area data was mixed this week: New car registrations fell by 23% year-on-year in September. The trade balance came in at €11.1bn, a robust number but below expectations of a €14.2bn surplus. Consumer confidence keeps deteriorating in the euro area amidst the energy crisis. The euro was up 0.2% this week. EUR/USD has had a wild ride in recent weeks, having breached below 1.16. That said, the tides are turning in favor of the euro. Speculators are short the currency, and interest rate expectations for the euro area are bombed out relative to other developed markets. This provides room for positive surprises. Report Links: Relative Growth, The Euro, And The Loonie - April 16, 2021 The Euro Dance: One Step Back, Two Steps Forward - April 2, 2021 On Japanese Inflation And The Yen - January 29, 2021 The Japanese Yen Chart II-5JPY Technicals 1
JPY Technicals 1
JPY Technicals 1
Chart II-6JPY Technicals 2
JPY Technicals 2
JPY Technicals 2
Recent Japanese data has been mixed: Condominium sales fell be 6.7% year-on-year in September. Trade remains robust. Exports rose by 15% year-on-year, while imports surged by 38.6% year-on-year. Supermarket sales increased 3.2% year-on-year in September. The yen rose 20bps this week. We were bullish the yen around 109, and even more bullish at current levels. The two things that have thrown this view offside are 1) an abrupt rise in US yields, that has attracted Treasury bids from Japanese investors and 2) profit taking by foreign investors who did catch the Japan outperformance in August. On the other side of the coin, the yen is now one of the most shorted G10 currencies, and Japanese data has been so poor relative to the rest of the G10 that some measure of catchup is due. Report Links: The Case For Japan - June 11, 2021 The Dollar Bull Case Will Soon Fade - March 5, 2021 On Japanese Inflation And The Yen - January 29, 2021 British Pound Chart II-7GBP Technicals 1
GBP Technicals 1
GBP Technicals 1
Chart II-8GBP Technicals 2
GBP Technicals 2
GBP Technicals 2
The key data release out of the UK this week was the inflation report: Headline CPI came in at 3.1% year-on-year in September, in line with expectations. Core CPI came in at 2.9% year-on-year in September, in line with expectations. RPI an PPI came in at 4.9% and 11.4% respectively. The pound rose by 0.3% this week. The UK is dealing with and energy and inflation crisis, similar to the rest of the world. This is bringing forward expectations of a rate hike by the BoE, which we believe would be the wrong approach should inflation subside. We are bullish sterling on a cyclical horizon, but are also long EUR/GBP tactically as a play on a policy convergence between the BoE and the ECB. Report Links: Why Are UK Interest Rates Still So Low? - March 10, 2021 Portfolio And Model Review - February 5, 2021 Thoughts On The British Pound - December 18, 2020 Australian Dollar Chart II-9AUD Technicals 1
AUD Technicals 1
AUD Technicals 1
Chart II-10AUD Technicals 2
AUD Technicals 2
AUD Technicals 2
The was scant data out of Australia this week: The services PMI rebounded strongly in September, from 45.5 to 52. The manufacturing PMI remained robust, rising from 56.8 to 57.3 in October. As a result, the composite PMI improved from 46 to 52.2. The AUD rose 0.6% this week. The AUD is sitting on a coiled spring and ripe for a rebound. First, the energy crisis is bullish for Australia as it is one of the largest coal and natural gas exporters. Second the AUD is cheap, especially on a terms of trade basis. At the crosses, we are long AUD/NZD as a play on these trends. Report Links: The Dollar Bull Case Will Soon Fade - March 5, 2021 Portfolio And Model Review - February 5, 2021 Australia: Regime Change For Bond Yields & The Currency? - January 20, 2021 New Zealand Dollar Chart II-11NZD Technicals 1
NZD Technicals 1
NZD Technicals 1
Chart II-12NZD Technicals 2
NZD Technicals 2
NZD Technicals 2
The was scant data out of New Zealand this week: CPI exploded higher, rising 4.9% in the third quarter. Credit card spending was down 12.9% year-on-year in September. The NZD rose by 1.2% week. The inflation report out of New Zealand unsettled markets, pushing up bond yields significantly and propping the currency. Given the RBNZ has a mandate to consider house prices in policy settings, this has led to bets of more aggressive policy tightening in New Zealand. We continue to believe the NZD will fare well cyclically, but hawkish expectations from the RBNZ are already priced. This provides room for disappointment. We are long AUD/NZD on this basis. Report Links: How High Can The Kiwi Rise? - April 30, 2021 Portfolio And Model Review - February 5, 2021 Currencies And The Value-Versus-Growth Debate - July 10, 2020 Canadian Dollar Chart II-13CAD Technicals 1
CAD Technicals 1
CAD Technicals 1
Chart II-14CAD Technicals 2
CAD Technicals 2
CAD Technicals 2
Data out of Canada this week has been robust: The CPI report was buoyant. Headline came in a 4.4%, core-trim came in at 3.4%, core-median was 2.8% and core-common was 1.8% year-on-year. Foreigners continue to favor Canadian securities. Inflows for August rose to C$26.3bn, well above a prior print of C$14.2bn. The Business outlook survey from the Bank of Canada was robust in the third quarter, but thew future sales outlook did fall from 47 to 9, a sharp deterioration. The CAD was flat this week. On a cyclical basis, the CAD is backed by robust oil prices, and orthodox central bank that will raise rates to curb high inflation and real estate speculation, and an economy that remains on a recovery path. As such, our bias is that the path of least resistance for the CAD is up. Report Links: Relative Growth, The Euro, And The Loonie - April 16, 2021 Will The Canadian Recovery Lead Or Lag The Global Cycle? - February 12, 2021 The Outlook For The Canadian Dollar - October 9, 2020 Swiss Franc Chart II-15CHF Technicals 1
CHF Technicals 1
CHF Technicals 1
Chart II-16CHF Technicals 2
CHF Technicals 2
CHF Technicals 2
The Swiss economy is on the mend: Total sight deposits were flat at CHF 714bn in the week ended October 15. Exports rose 0.4% month-on-month in September, while imports fell 0.8% month-on-month. The money supply rose 3.2% in September, in line with the August print. CHF rose by 0.5% this week. CHF remains a good hedged against rising currency volatility, which we believe will materialize on a cyclical horizon. That said, the swiss franc will lag the euro and other European currencies, if our view of a pickup in growth next year proves correct. Report Links: An Update On The Swiss Franc - April 9, 2021 Portfolio And Model Review - February 5, 2021 The Dollar Conundrum And Protection - November 6, 2020 Norwegian Krone Chart II-17NOK Technicals 1
NOK Technicals 1
NOK Technicals 1
Chart II-18NOK Technicals 2
NOK Technicals 2
NOK Technicals 2
There was scant data out of Norway this week: The trade balance improved from NOK 42.6bn to NOK 53.7bn in September. The NOK was up 0.7% this week. High oil prices are a boost for the NOK, especially with the opening of the energy pipeline with the UK. We also favor the NOK on valuation grounds. Stay short EUR/NOK and USD/NOK. Report Links: The Norwegian Method - June 4, 2021 Portfolio And Model Review - February 5, 2021 Revisiting Our High-Conviction Trades - September 11, 2020 Swedish Krona Chart II-19SEK Technicals 1
SEK Technicals 1
SEK Technicals 1
Chart II-20SEK Technicals 2
SEK Technicals 2
SEK Technicals 2
There was scant data out of Sweden this week: The unemployment rate fell from 8.5% to 8.2% in September. The SEK rose 15 bps this week. We are short both EUR/SEK and USD/SEK as reflation plays. The SEK will rise very quickly should the Chinese credit impulse bottom, a likely event in our view. Meanwhile, the central bank will end QE this year and could bring forward expectations of a rate hike. Report Links: Revisiting Our High-Conviction Trades - September 11, 2020 More On Competitive Devaluations, The CAD And The SEK - May 1, 2020 Sweden Beyond The Pandemic: Poised To Re-leverage - March 19, 2020 Trades & Forecasts Strategic View Cyclical Holdings (6-18 months) Tactical Holdings (0-6 months) Limit Orders Forecast Summary
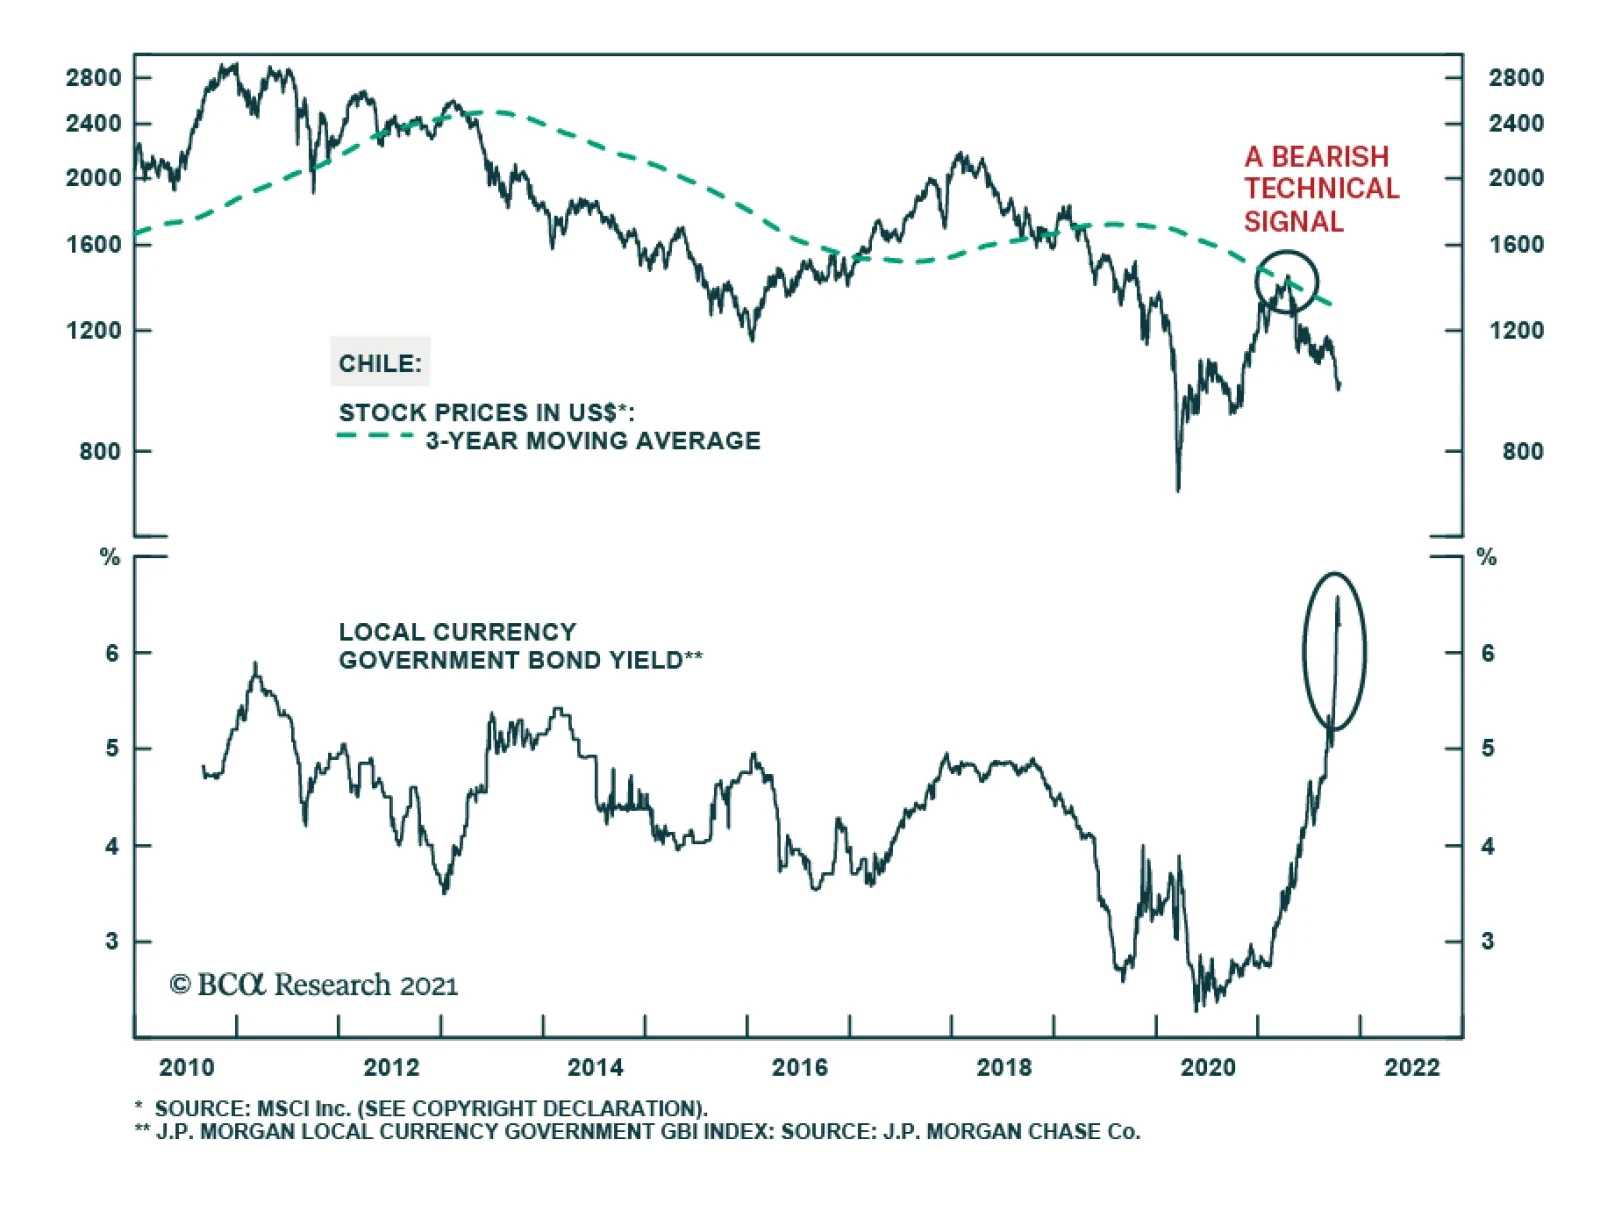
Chilean assets are set to endure a period of turbulence over the next few months. The rising odds of the victory of popular left-wing presidential candidate Gabriel Boric will continue to alarm markets and place upward pressure on local yields. The BCA…
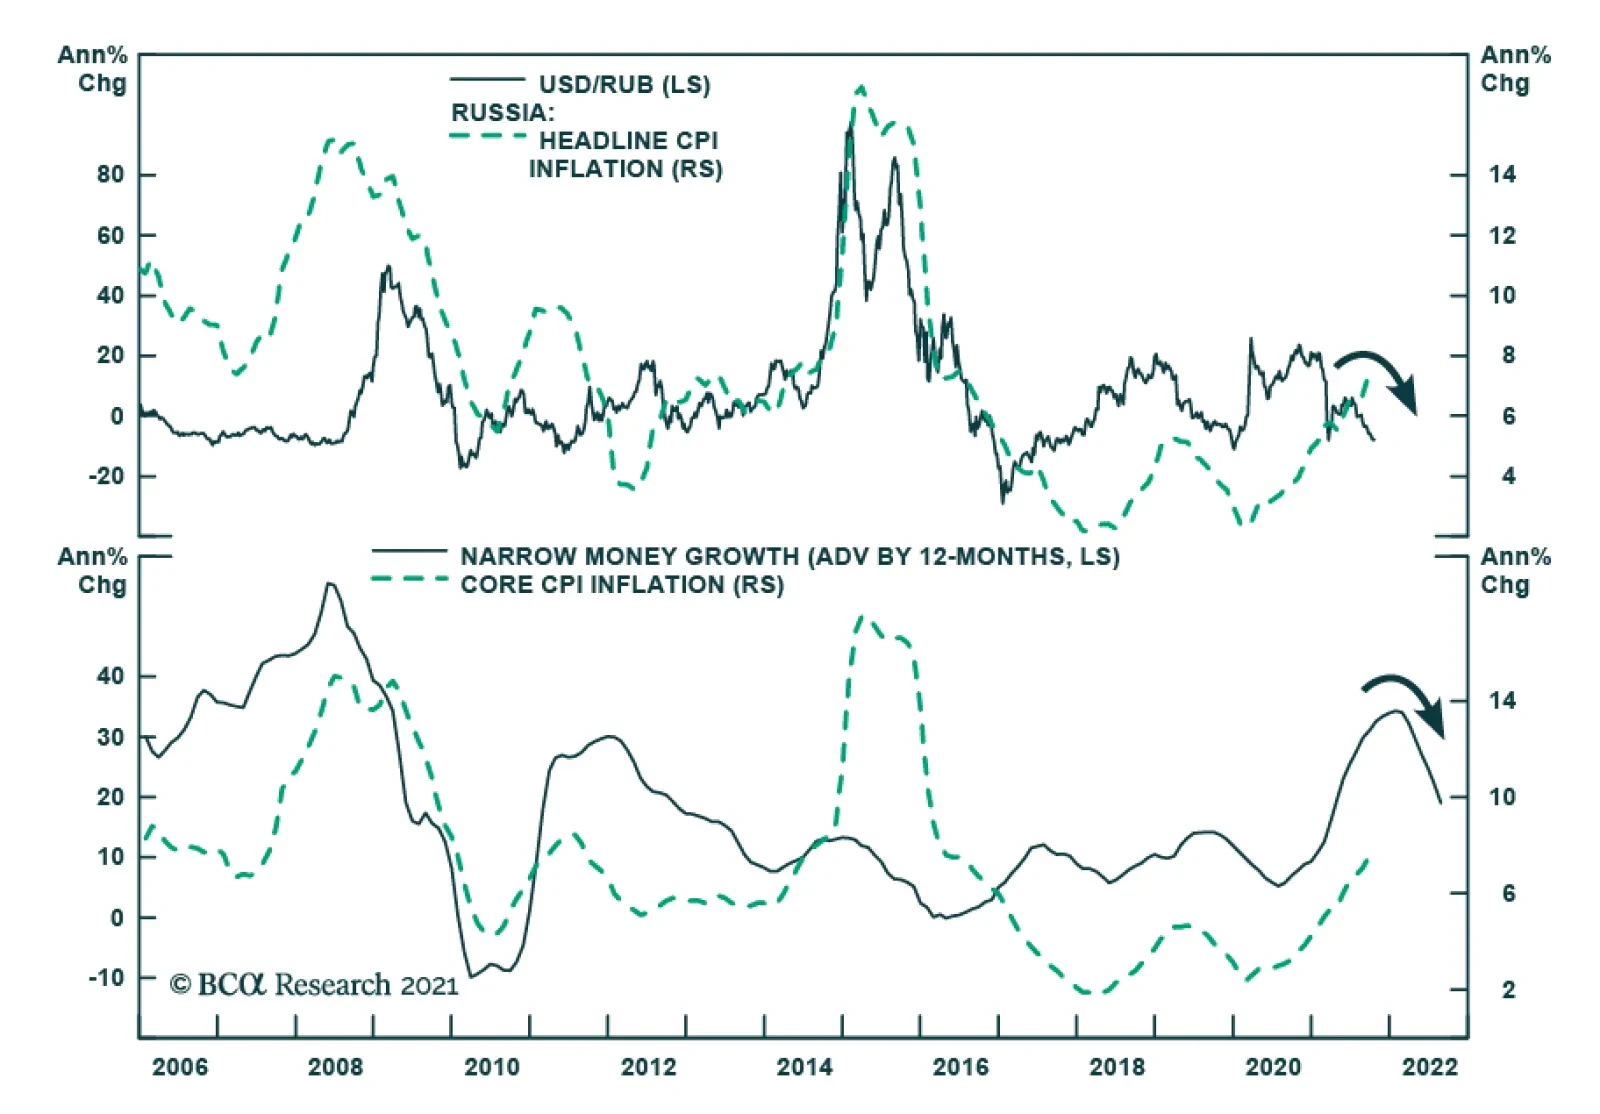
The Central Bank of Russia (CBR) is expected to raise its policy rate by another 50 bps at its Friday meeting, bringing the cumulative rates hikes since the beginning of the year to 250 bps. Given that headline and core consumer price inflation are both well…