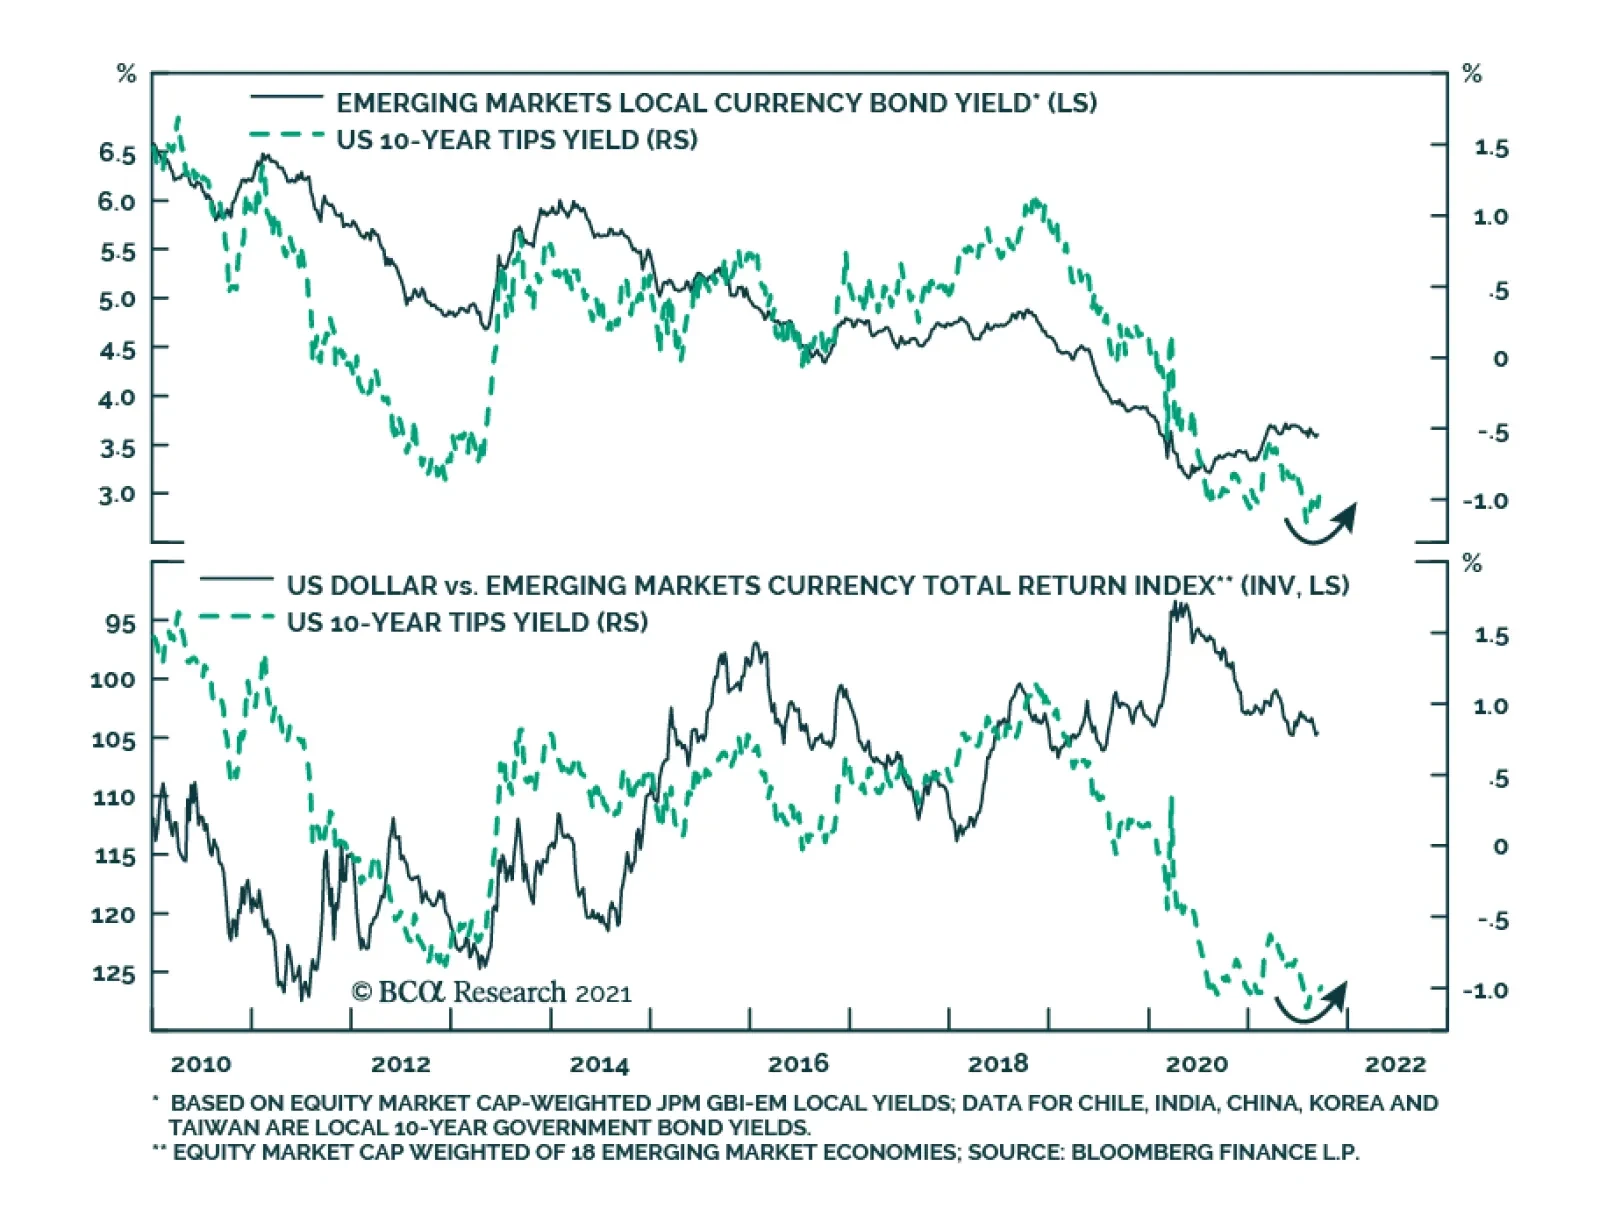
Emerging Markets
The Fed’s policy normalization process is likely to produce a slight hawkish surprise. The central bank will probably raise interest rates earlier and faster than current market expectations (see Country Focus). We do not expect this process to be a source of…
The performance of global risk assets improved somewhat on Tuesday following Monday’s tumble on the back of concerns about the potential implications of an Evergrande default. Nevertheless, risks remain elevated. A key unknown facing investors going forward…
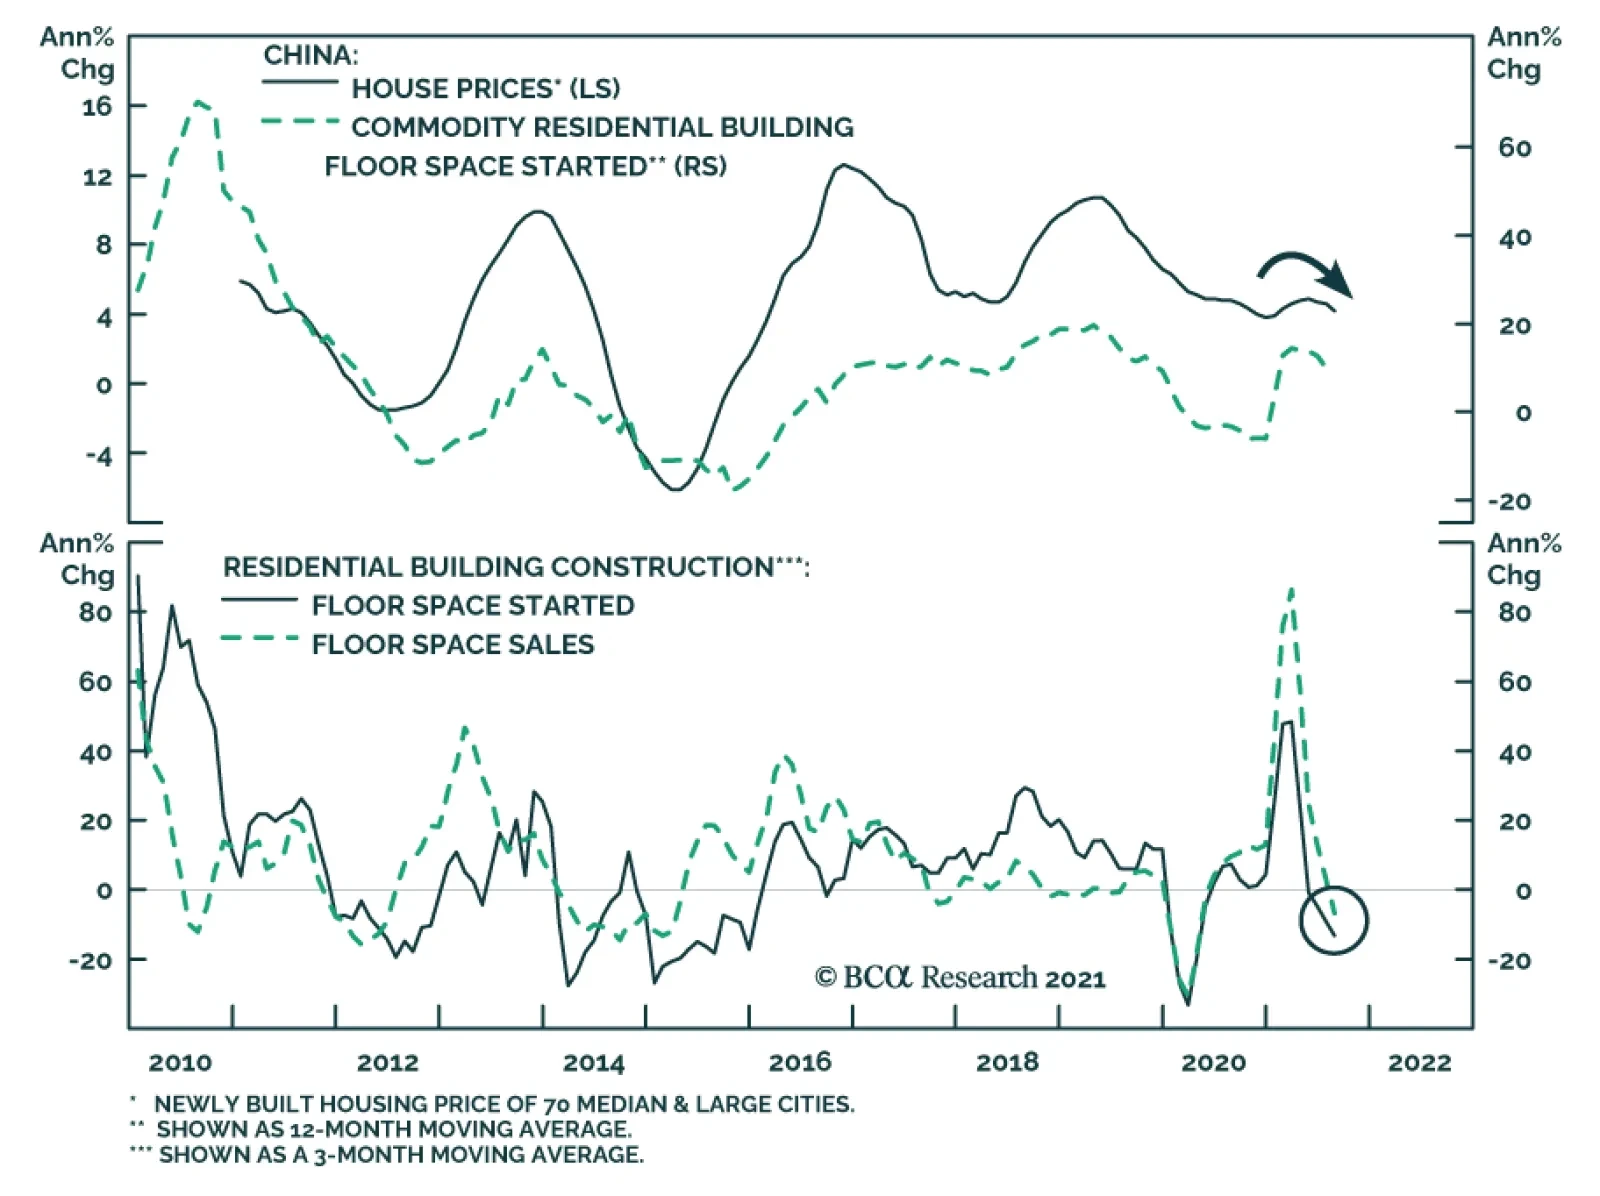
Chinese residential building starts and sales have been contracting since April and July, respectively. Similarly, the level of aggregate building construction activity appears to be rolling over. The Evergrande debacle presents an added downside risk to this…

Highlights We cannot predict how China will manage Evergrande precisely but we have a high conviction that it will do whatever it takes to prevent contagion across the property sector. However, China’s stimulus tools are losing their effectiveness over time. The country is due for a prolonged struggle with financial and economic instability regardless of whether Evergrande defaults. A messy default would obviously exacerbate the problem. China’s regulatory crackdowns target private companies and will continue to weigh on animal spirits in the private sector. The government will be forced to use fiscal policy to compensate. The US’s and China’s switch from engagement to confrontation poses a persistent headwind for investor sentiment toward China. The new consensus that investors should buy into China’s “strategic sectors” to avoid arbitrary regulatory crackdowns is vulnerable to its own logic and to sanctions by the US and its allies. Feature China poses a unique confluence of domestic and foreign political risks and global markets are now pricing them. Property giant Evergrande could default on $120 million in onshore and offshore interest payments as early as September 23, or next month, prompting investors to run for cover. Is this crisis fleeting or part of a larger systemic failure? It is a larger systemic failure. We expect a slow-motion, Japanese-style crisis over the coming decade, marked with periodic bailouts and stimulus packages. We recommend investors stay the course: steer clear of China and stay short the renminbi and Taiwanese dollar. Tactically, stick with large caps, defensive sectors, and developed markets within the global equity universe. Strategically, prefer emerging markets that benefit from forthcoming Chinese (and American) stimulus. 1. A “Minsky Moment” Cannot Be Ruled Out The chief fear is whether the approaching default of Evergrande marks China’s “Minsky Moment.” Hyman Minsky’s financial instability hypothesis held that long periods of stable revenues lead to risky financial deals and large accumulations of systemic risk that are underpriced. When revenues cannot cover interest payments, a crash ensues followed by deleveraging. Minsky’s hypothesis speaks to debt crises in an entire economy, yet nobody knows for sure whether China’s economy has reached such a breaking point. China’s national savings rate stands at 45.7% of GDP and nominal growth exceeds the long-term government bond yield. However, a sharp drop in asset prices, especially in the property sector, could change everything, as it could lead to balance sheet recession among corporates and a fall in national income. Evergrande is supposed to make an $84 million interest payment on offshore debt and a $36 million payment on onshore debt this week, and after 30 days it would default. It owes $37 billion in debt payments over the next 12 months but only has $13 billion cash on hand (as of June 30, 2021). Authorities can opt for a full bailout or a partial bailout, in which the company defaults on offshore bonds but not onshore. They could even let the company fail categorically, though that would produce exactly the kind of precipitous drop in property asset prices that would lead to wider financial contagion. State intervention to smooth the crisis is more likely – and the government can easily pressure other companies into acquiring Evergrande’s assets and business divisions. Chart 1Yes, This Could Be China's Minsky Moment
Yes, This Could Be China's Minsky Moment
Yes, This Could Be China's Minsky Moment
Chart 1 shows that China’s corporate debt-to-GDP ratio stands head and shoulders above other countries that experienced financial crises in recent decades, courtesy of our Emerging Markets Strategy. While China can undoubtedly bear large debts due to its savings, the implication is that China has large enough financial imbalances to suffer a full-fledged financial crisis, even if the timing is hard to predict. Household credit is also elevated at 61.7% of GDP, and the household debt-to-disposable-income ratio is now higher than in the United States. About two-thirds of China’s corporate debt is held by state-owned or state-controlled entities, prompting some investors to dismiss the gravity of the risk. However, financial crises often involve the transfer of debt from the state to private sector or vice versa. 59% of bond defaults in H1 2021 have involved state companies. Total debt is the main concern. Don’t take our word for it: China’s Communist Party has warned for the past decade about the danger of “implicit guarantees” and “moral hazard” that encourage financial excesses in the corporate sector. The Xi Jinping administration has tried to induce a deleveraging process since it came to power in 2012-13. Xi’s “three red lines” for the property sector precipitated the current turmoil. Even if Evergrande’s troubles are managed, China’s systemic risks will continue to boil over as its potential growth rate slows and the government continues trying to wring out financial excesses. Chart 2Policy Uncertainty, Financial Stress Can Rise Higher
Policy Uncertainty, Financial Stress Can Rise Higher
Policy Uncertainty, Financial Stress Can Rise Higher
More broadly China is experiencing an unprecedented overlap of economic and political crises: The population is aging and labor force is shrinking; The economic model since 2009 has been changing from export-manufacturing to domestic-oriented, investment-driven growth; Indebtedness is spreading from corporates to households and ultimately the government; The governance model is shifting from “single-party rule” to “single-person rule” or autocracy; The population is reaching middle class status and demanding better quality of life; The international trade environment is turning from hyper-globalization to hypo-globalization; The geopolitical backdrop is darkening with the US and its allies attempting to contain China’s ambitions of regional supremacy. Almost all of these changes bring more risks than opportunities to China over the long haul. The need for rapid policy shifts provides the ostensible reasoning for President Xi Jinping’s decision not to step down but to remain president for the foreseeable future. He will clinch this position at the twentieth national party congress in fall 2022. The implication is that policy uncertainty will continue climbing up to at least 2019 peaks while offshore equity markets will continue to trend lower, as they have done since the onset of the US trade war (Chart 2). Credit default swap rates have so far been subdued but they are showing signs of life. A sharp rise in policy uncertainty and property sector stress would pull them up. Domestic equities (A-shares) have rallied since 2019 but we would expect them to fall back given China’s historic confluence of structural and cyclical challenges, which will create further negative surprises (Chart 2, bottom panel). 2. Beijing Will Provide Bailouts And Stimulus Ad Nauseum Evergrande’s future may be in doubt but Beijing will throw all its power at stopping nationwide financial contagion. True, a policy miscalculation is possible. A tardy or failed intervention cannot be ruled out. However, investors should remember that a clear pattern of bailouts and stimulus has emerged over the course of the Xi Jinping administration whenever a “hard landing” or financial collapse loomed. The government tightens controls on bloated sectors until the financial fallout threatens to undermine general economic and social stability, at which point the government eases policy. It is often forced to stimulate the economy aggressively. Chart 3 shows these cycles in two ways: China’s control of credit through the state-controlled banks, and the frequency of news stories mentioning important terms associated with financial and economic distress: defaults, layoffs, and bankruptcies. These three terms used to be unheard of among China watchers. Under the Xi administration, a higher tolerance of creative destruction has served as the way to push forward reform. The current rise in distress is not extended, suggesting that more bad news is coming, but it also shows that the government has repeatedly been forced to provide stimulus even under the Xi administration. Chart 3Xi Jinping Has Bailed Out System Three Times Already
Xi Jinping Has Bailed Out System Three Times Already
Xi Jinping Has Bailed Out System Three Times Already
Could this time be different? Not likely. The American experience and the pandemic will also force China’s government to ease policy: China learns from US mistakes. The US lurched from Lehman’s failure into a financial crisis, an impaired credit channel, a sluggish economic recovery, a spike in polarization, policy paralysis, a near-default on the national debt, a surge in right- and left-wing populism, the tumultuous Trump presidency, widespread social unrest, a contested leadership succession, and a mob storming the nation’s capitol (Chart 4). This is obviously the nightmare of any Chinese leader and a trajectory that the Xi administration will avoid at any cost. Chart 4Lehman Brothers A Powerful Disincentive For China To Let Evergrande Fail
Lehman Brothers A Powerful Disincentive For China To Let Evergrande Fail
Lehman Brothers A Powerful Disincentive For China To Let Evergrande Fail
Chinese households store their wealth in the property sector, so any attempt at policy restraint or austerity faces a massive constraint. Only a few countries are comparable to China with respect to the share of non-financial household wealth (property and land) within total household wealth. All of them are hosts of property sector bubbles, including the bubbles in Spain and Ireland back in 2007 (Chart 5). A property collapse would destroy the savings of the Chinese people over four decades of prosperity. Chart 5Property Is The Bedrock Of Chinese Households
Five Points On China’s Crisis
Five Points On China’s Crisis
Social instability is already flaring up. Almost all China experts agree that “social stability” is the Communist Party’s bottom line. But note that the Evergrande saga has already led to protests, not only at the company’s headquarters in Shenzhen but also in other cities such as Shenyang, Guangzhou, Chongqing. Protests were filmed and shown on social media (posts have been censored). Protesters demanded repayment for wealth management products gone sour and properties they are owed that have not been built. This is only a taste of the cross-regional protests that would emerge if the broader property sector suffered. The lingering COVID-19 pandemic is still relevant. Investors should not underrate the potential threat that the pandemic poses to the regime. Severe epidemics have occurred about 11% of the time over the course of China’s history and they often have major ramifications. Disease has played a role in the downfall of six out of ten dynasties – and in four cases it played a major role. It would be suicidal for any regime to add self-inflicted economic collapse to a lingering pandemic (Table 1). Table 1Disease Threatens Chinese Dynasties – Not A Time To Self-Inflict A Recession
Five Points On China’s Crisis
Five Points On China’s Crisis
Easing policy does not necessarily mean bringing out the “bazooka” and splurging on money and credit growth, though that is increasingly likely as the crisis intensifies. Notably the July Politburo statement specifically removed language that said China would “avoid sharp turns in policy.” In other words, sharp turns might be necessary. That can only mean sharp reflationary turns, as there is very little chance of doubling down on policy tightening. A counterargument holds that the Chinese government is now exclusively focused on power consolidation to the neglect of financial and economic stability. Perhaps the leadership is misinformed, overconfident, or thinks a financial collapse will better purge its enemies – along the lines of the various political purges under Chairman Mao Zedong. Wealthy tech magnates and property owners could conceivably challenge the return of autocracy. After all, the US political establishment almost “fell” to a rich property baron – why couldn’t China’s Communist Party? Political purges should certainly be expected ahead of next year’s party congress. But not to the point of killing the economy. The government would not be trying to balance policy tightening and loosening so carefully if it sought to induce chaos. It must be admitted, however, that the change to autocracy means that the odds of irrational or idiosyncratic policy have gone up substantially and permanently. Of course, the high likelihood that Beijing will provide bailouts and stimulus should not be read as a bullish investment thesis, even though it would create a pop in oversold assets. The Chinese system is saturated with money and credit, which have been losing their effectiveness in driving growth. Financial imbalances get worse, not better, with each wave of credit stimulus. Beijing is caught between a rock and a hard place. Hence stimulus comes only reluctantly and reactively. But it does come in the end because a financial crash would threaten the life of the regime and preclude all other policy priorities, domestic and foreign. 3. Yes, China’s Regulatory Crackdown Targets The Private Sector Global growth and other emerging economies will get most of the benefit once China stimulates, since China’s own firms will still face a negative domestic political backdrop. Bullish investors argue that the government’s regulatory tightening is misunderstood and overblown. The claim is that China is not targeting the private sector generally but only isolated sectors causing social problems. Costs need to be reduced in property, education, and health to improve quality of life. China shares the US’s and EU’s desire to rein in tech giants that monopolize their markets, abuse consumer data and privacy, and benefit from distorted tax systems. Most of these arguments are misleading. China does not have a strong record on data privacy, equality, social safety nets, rule of law, or “sustainable” growth (as opposed to “unsustainable,” high-debt, high-polluting growth). China actively encourages state champions that monopolize key sectors. Many developed markets have better records in these areas, notably in Europe, yet China is eschewing these regulatory models in preference for an approach that is arbitrary and absolutist, i.e. negative for governance. As for the private sector, animal spirits have been in a long decline throughout the past decade. This is true whether judging by money velocity – i.e. the pace of economic activity relative to the increase in money supply – or by households’ and businesses’ marginal propensity to save (Chart 6). The 2015-16 period shows that even periodic bouts of government stimulus have not reversed the general trend. Regulatory whack-a-mole and financial turmoil will not improve the situation. Chart 6Private Sector Animal Spirits Depressed Throughout Xi Era
Private Sector Animal Spirits Depressed Throughout Xi Era
Private Sector Animal Spirits Depressed Throughout Xi Era
Chart 7Even Official Data Shows Consumer Confidence Flagging
Even Official Data Shows Consumer Confidence Flagging
Even Official Data Shows Consumer Confidence Flagging
Surveys of sentiment confirm that the latest developments will have a negative effect (Chart 7). Cumulatively, the changes in China’s domestic and international policy context are being interpreted as negative for business, entrepreneurship, and economic freedom – notwithstanding the government’s claims to expand opportunity in its “common prosperity” plan. 4. The Withdrawal Of US Friendship Is A Headwind For China Chart 8Other Asians Sought US Friendship, Not Conflict, When Export Models Expired
Other Asians Sought US Friendship, Not Conflict, When Export Models Expired
Other Asians Sought US Friendship, Not Conflict, When Export Models Expired
All of the successful Asian economies – including China for most of the past forty years of prosperity – have tried to stay on the good side of the United States. By contrast, China and the US today are shifting from engagement to confrontation and breaking up their economic ties (Chart 8). This is a problem for China because the US and to some extent its allies will seek to undermine China’s economy and its autocratic model as part of this great power competition. The rise in geopolitical risk is underscored by the Australia-UK-US (AUKUS) agreement, by which the US will provide Australia with nuclear submarines over the next decade. This was a clear demonstration of the US’s “pivot to Asia” and the fact that the US and China are preparing for war – if only to deter it. China’s return to autocracy and clash with the US and Asian neighbors is also leading to a deterioration of its global image, particularly over issues of transparency and information sharing. The dispute over the origins of COVID-19 is a major source of division with the US and other countries. Transparency is important for investors. The World Bank has discontinued its “Ease of Doing Business” rankings after a scandal was revealed in which China’s ranking was artificially bumped up. The last-published trend is still downward (Chart 9). Most recently China has stepped up censorship of its financial news media amid the current market turmoil, which makes it harder for investors to assess the full extent of property and financial risks.1 The US political factions agree on China-bashing if nothing else. The Biden administration has little political impetus to eschew tariffs and export controls. One important penalty will come from the Securities and Exchange Commission, which is likely to ban Chinese firms from US stock exchanges unless they conform to common accounting standards. Hence the dramatic fall in the share prices of Chinese companies listed via American Depository Receipts (ADRs), in both absolute and relative terms (Chart 10, top panel). This threat prompted China’s recent crackdown on its own firms that were attempting to hold initial public offerings on US exchanges. Chart 9US Conflict Exposes China’s Global Influence Campaign
Five Points On China’s Crisis
Five Points On China’s Crisis
The Quadrilateral Forum – the US, Japan, Australia, and India – has agreed to link the semiconductor supply chain to human rights standards, foreclosing China’s participation in that supply chain. US semiconductor firms are among the most exposed to China but they have not suffered over the course of the US-China tech war, suggesting that US vulnerabilities are limited (Chart 10, bottom panel). Chart 10US Regulators Will Kick Chinese Firms While They Are Down
US Regulators Will Kick Chinese Firms While They Are Down
US Regulators Will Kick Chinese Firms While They Are Down
The point is not to exaggerate the strength of the US and its allies but rather the costs to China of actively opposing them. The US has a difficult enough time cobbling together a coalition of states to impose sanctions on Iran over its nuclear program, not to mention forming any coalition that would totally exclude and isolate China. China is far more important to US allies than Iran – it is irreplaceable in the global economy (Chart 11). The EU and China’s Asian neighbors will typically restrain the US’s more aggressive impulses so as not to upset the global recovery or end up on the front lines of a war.2 Chart 11No Substitute For China In Global Economy
Five Points On China’s Crisis
Five Points On China’s Crisis
This diplomatic constraint on the US is probably positive for global growth but not for China per se. American allies are still able to increase the costs on China for pursuing its own state-backed development path and geopolitical sphere of influence. Japan, Australia, and others are likely to veto China’s application to join the Comprehensive and Progressive Trans-Pacific Partnership (CPTPP), while the UK and eventually the US are likely to join it. Investors should view US-China ties as a headwind at least until the two powers manage to negotiate a diplomatic thaw, i.e. substantial de-escalation of tensions. A thaw is unlikely in the lead-up to Xi Jinping’s consolidation of power and the US midterm elections in fall 2022. Presidents Biden and Xi are still working on a bilateral summit, not to mention a more substantial improvement in ties. We doubt a diplomatic thaw would be durable anyway but the important point is that until it happens China will face periodic bouts of negative sentiment from the emerging cold war. Other Asian economies thrived under US auspices – China is sailing in uncharted waters. 5. Global Investors Cannot Separate Civilian From State And Military Investments The word on Wall Street is that investors should align their strategies with those of China’s leaders so as not to run afoul of arbitrary and draconian regulators. For example, instead of “soft tech” or consumer-oriented companies – like those that give people rides, deliver food, or make creative video games – investors should invest in “hard tech” or strategic companies like those that make computer chips, renewable energy, biotechnologies, pharmaceuticals, and capital equipment. There is no question that the trend in China – and elsewhere – is for governments to become more active in picking winners and losers. Industrial policy is back. Investors have no choice but to include policy analysis in their toolbox. However, for global investors, an investment strategy of buying whatever the government says is far from convincing. The most basic investment strategy in keeping with the Xi administration’s goals would be to invest in state-owned enterprises in domestic equity markets. So SOEs should have outperformed the market, right? Wrong. They were in a downtrend prior to the 2015 bubble, the burst of which caused a further downtrend (Chart 12, top panel). Similarly, the preference for “hard tech” over “soft tech” is promising in theory but complicated in practice: hard tech is flat-to-down over the decade and down since COVID-19 (Chart 12, middle panel). It has underperformed its global peers (Chart 12, bottom panel). China’s policy disposition should be beneficial for industrials, health care, and renewable energy. First, China is doubling down on its manufacturing economy. Second, the population is aging and health care is a critical part of the common prosperity plan. Third, green energy is a way of diversifying from dependency on imported oil and natural gas. However, the profile of these sectors relative to their global counterparts is only unambiguously attractive in the case of industrials, which began to outperform even during the trade war (Chart 13). Chart 12State Approved' Trades Still Bring Risks
State Approved' Trades Still Bring Risks
State Approved' Trades Still Bring Risks
Chart 13Beware 'State Approved' Trades
Beware 'State Approved' Trades
Beware 'State Approved' Trades
In Table 2 we outline the valuations and political risks of onshore equity sectors. Valuations are not cheap. Domestic and foreign risks are not fully priced. Table 2China Onshore Equities, Valuations, And (Geo)Political Risks
Five Points On China’s Crisis
Five Points On China’s Crisis
There is a bigger problem for global investors, especially Americans: investing in China’s strategic sectors directly implicates investors in the Communist Party’s domestic human rights practices, state-owned enterprises, and national security goals. “Civil-military fusion” is a well-established doctrine that calls for the People’s Liberation Army to have access to the cutting-edge technology developed by civilians and vice versa. These investments will eventually be subject to punitive measures since the US policy establishment believes it can no longer afford to let US wealth buttress China’s military and technological rise. Investment Takeaways China may or may not work out a partial bailout for Evergrande but it will definitely provide state assistance and fiscal stimulus to try to prevent contagion across the property sector and financial system. Bad news in the coming weeks and months will be replaced by good news in this sense. However, the fact that China will eventually be forced to undertake traditional stimulus yet again will increase its systemic financial risks, in a well-established pattern. The best equity opportunities will lie outside of China, where companies will benefit from global recovery yet avoid suffering from China’s unique confluence of domestic and foreign political risks. We prefer developed markets and select emerging markets in Latin America and Asia-ex-China. Chinese households and businesses are downbeat. This behavior cannot be separated from the historic changes in the economy, domestic politics, and foreign policy. It is hard to see an improvement until the government boosts growth and the 2022 political reshuffle is over. American opposition is a bigger problem for China than global investors realize. Not only are the two economies divorcing but other democracies will distance themselves from China as well – not because of US demands but because their own manufacturing, national security, and ideological space is threatened by China’s reversion to autocracy and assertive foreign policy. Investing in China’s “hard tech” and strategic sectors with government approval is not a simple solution. This approach will directly funnel capital into China’s state-owned enterprises, domestic security forces, and military. As such the US and West will eventually impose controls. Investments may not be liquid since China would suffer if capital ever fled these kinds of projects. Both American and Chinese stimulus is looming this winter but the short run will see more volatility. We are closing our long JPY-KRW tactical trade for a gain of 4.4% Matt Gertken Vice President Geopolitical Strategy mattg@bcaresearch.com Footnotes 1 We have often noted in these pages over the past decade that multilateral organizations overrated improvements in China’s governance based on policy pronouncements rather than structural changes. 2 Still, tensions among the allies should not be overrated since they share a fundamental concern over China’s increasing challenge to the current global order. The EU is pursuing trade talks with Taiwan, and there are ways that the US can compensate France over the nullification of its submarine sales to Australia (most of which are detrimental to China’s security).
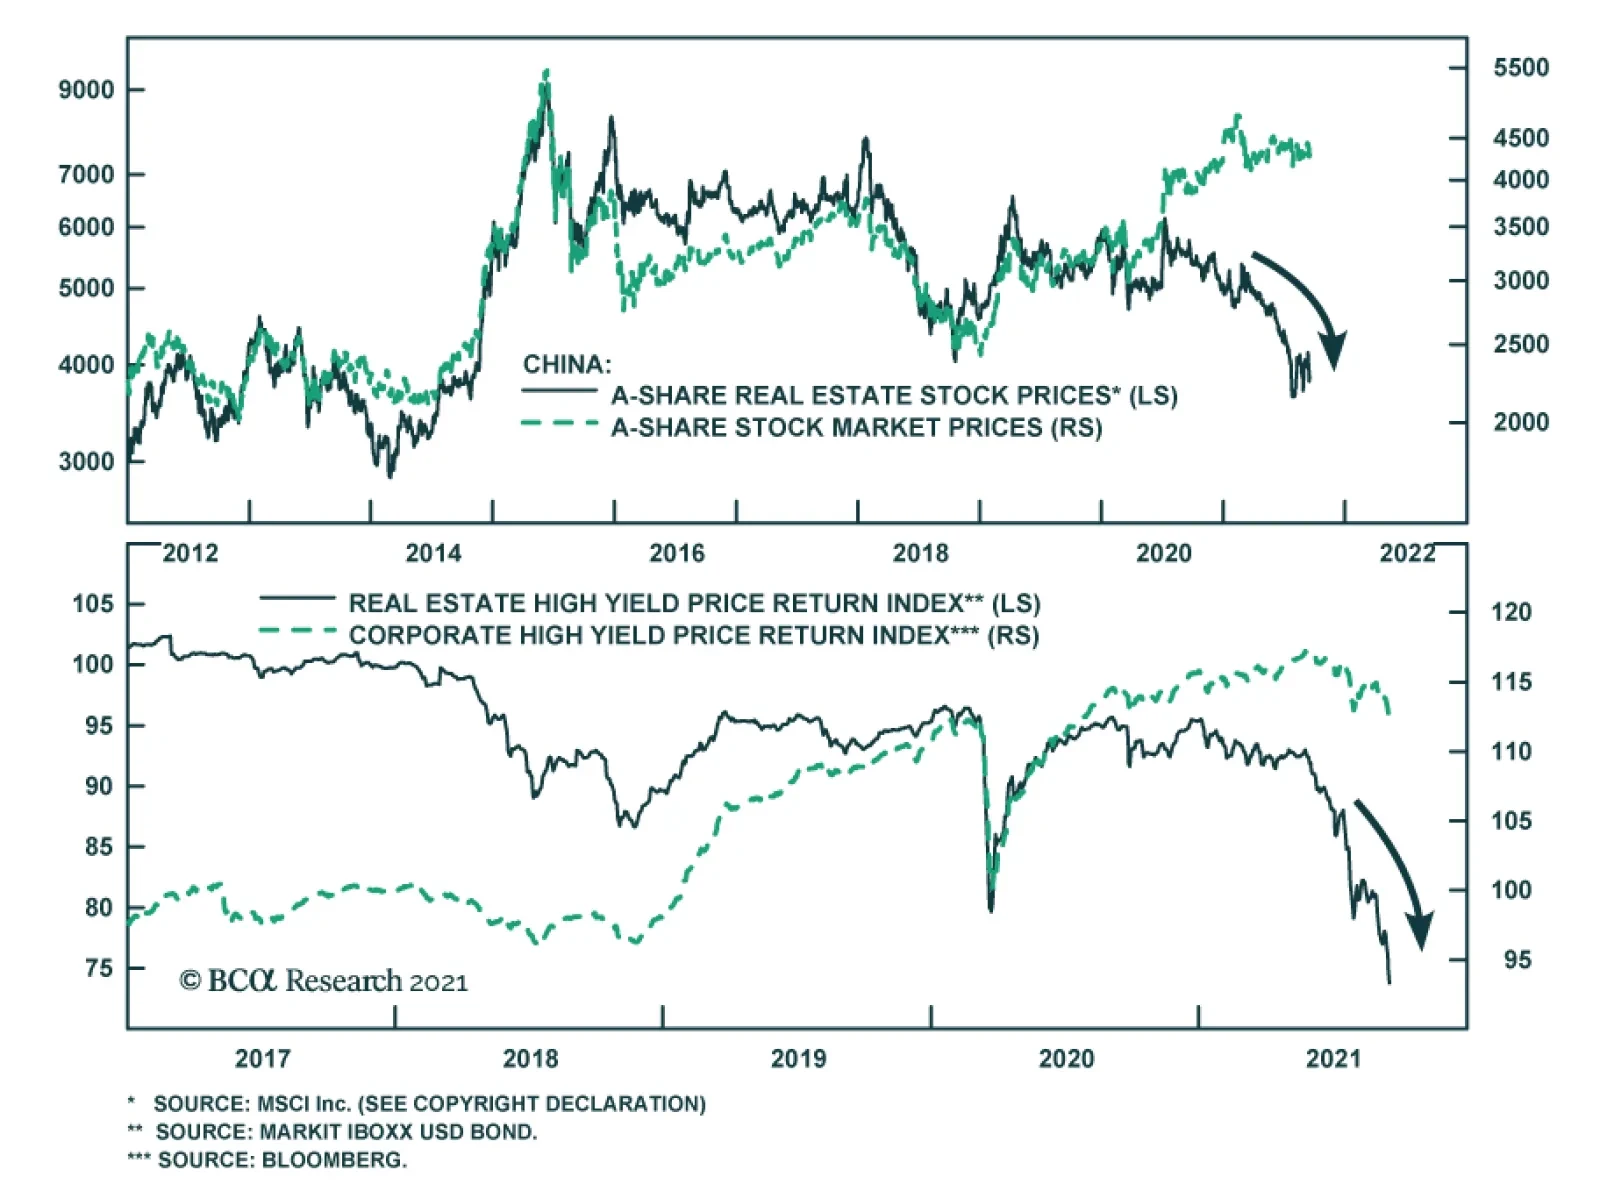
The possibility of Chinese real estate developer Evergrande’s collapse threatens the stability of the country’s economy and financial markets through multiple facets. The company accounts for an outsized share of outstanding high-yield dollar bonds and is…

BCA Research's US Investment Strategy service does not expect the fall of an overextended Chinese property developer to push the US out of Goldilocks and into too-cold territory. Reports that Evergrande will fail to make scheduled interest and principal…
BCA Research’s Global Investment Strategy service upgraded its rating on EM equities and currencies to strong overweight After lagging the global indices, EM stocks are set to outperform during the remainder of this year and into 2022. Five factors will…
Dear Client, I will be holding a webcast next Friday, September 24th at 10:00 AM EDT (3:00 PM BST, 4:00 PM CEST, 11:00 PM HKT) with BCA Research’s Chief Emerging Markets Strategist Arthur Budaghyan where we will debate the outlook for EM stocks. As this week’s report conveys, I am bullish, while Arthur is in the bearish camp. Please join us for what is sure to be a fiery debate. Also, instead of our regular report next week, we will be sending you a Special Report written by Matt Gertken, BCA Research’s Chief Geopolitical Strategist, discussing the stability of the American political system. I hope you will find it insightful. We will be back the following week with the GIS Quarterly Strategy Outlook, where we will explore the major trends that are set to drive financial markets in the rest of 2021 and beyond. As always, I will hold a webcast discussing the outlook the week after, on Thursday, October 7th. Best regards, Peter Berezin Chief Global Strategist Highlights After lagging the global indices, EM stocks are set to outperform during the remainder of this year and into 2022. Go long the EM FTSE index versus the global benchmark (ETF proxy: VWO versus VT). Five factors will support EM assets over the coming months: 1) The vaccination campaign in emerging markets is in full swing; 2) Domestic EM inflation will crest; 3) China will stimulate its economy; 4) The US dollar will weaken; and 5) EM valuations have discounted a lot of bad news. Contrary to popular perception, the Chinese government has not launched an indiscriminate attack on tech companies. If anything, heightened geopolitical tensions have made it more important than ever for China to buttress its tech sector. Investors wanting to gain exposure to Chinese tech while still limiting risk should consider writing cash-covered puts. For example, a strategy of selling puts on Alibaba could generate a 9% annualized yield while giving investors access to the stock at a forward PE ratio of only 12.5. Go long an equally-weighted basket consisting of the Russian ruble and Brazilian real against the US dollar. Both currencies enjoy favorable interest rate differentials and will benefit from continued strength in commodity markets. Debating The EM Outlook BCA Research has some of the brightest, most creative strategists in the world. While we often agree on many issues, we sometimes disagree. The near-term outlook for emerging markets is a case in point. My colleague, Chief EM Strategist Arthur Budaghyan, is bearish on emerging markets over a 3-to-6 month horizon. In contrast, I am bullish. In this note, I explain why. I see five reasons why EM assets will do very well during the remainder of the year and into 2022: 1) The vaccination campaign in emerging markets is in full swing; 2) Domestic EM inflation will crest; 3) China will stimulate its economy; 4) The US dollar will weaken; and 5) EM valuations have discounted a lot of bad news. Let’s examine all five reasons in turn. Vaccine Access In Emerging Markets Is Improving The proportion of EM populations which have been vaccinated is rising rapidly (Chart 1). India is now vaccinating 10 million people per day, a number that would have seemed unimaginable just a few months ago. Chart 1EM Vaccination Rates Have Been Ramping Up Rapidly
The Best Trade For The Rest Of 2021: Long EM Equities And Currencies
The Best Trade For The Rest Of 2021: Long EM Equities And Currencies
Globally, about 10 billion doses of vaccine will be produced this year (Chart 2). This does not include potential new mRNA vaccines that China is developing. China-based Walvax Biotechnology is conducting late-stage trials in Nepal, with mass production of the vaccine expected to start in October. Sinopharm is also working on its own mRNA vaccine. Meanwhile, the number of new Covid cases in most EM economies has peaked, permitting a relaxation of lockdown measures (Chart 3). Goldman’s Effective Lockdown Index for China has eased significantly since mid-August, although this week’s outbreak in Fujian province could partially reverse that trend. Chart 2At Least 10 Billion Doses Of Vaccine Will Be Produced This Year
The Best Trade For The Rest Of 2021: Long EM Equities And Currencies
The Best Trade For The Rest Of 2021: Long EM Equities And Currencies
Chart 3EM Lockdown Measures Have Eased As The Number Of New Cases Has Peaked
The Best Trade For The Rest Of 2021: Long EM Equities And Currencies
The Best Trade For The Rest Of 2021: Long EM Equities And Currencies
It is true, as Arthur has pointed out, that vaccine hesitancy is a problem in some emerging markets. However, this may not be as significant an issue as previously believed. The huge spike in cases in highly vaccinated countries such as Israel and the UK shows that herd immunity is a pipe dream. Given this reality, as long as everyone who wants a vaccine is able to receive it, the political pressure to maintain lockdowns will dissipate. Pandemic-Induced Spike In Inflation Is Fading As in most developed economies, many emerging markets have experienced a post-pandemic rise in inflation (Chart 4). Whereas DM central banks generally looked through the inflation spike, many EMs did not have that luxury. Chart 4Inflation Across The EM Universe
The Best Trade For The Rest Of 2021: Long EM Equities And Currencies
The Best Trade For The Rest Of 2021: Long EM Equities And Currencies
Worried about an unmooring of inflation expectations and currency depreciation, central banks in such countries as Brazil, Mexico, Chile, Colombia, Peru, Russia, and Turkey have all raised rates this year. Higher rates have weighed on EM growth and financial markets. The good news is that inflationary pressures are starting to abate. This week’s US CPI report for August showed an absolute decline in prices in pandemic-related categories such as airfares, hotels, admissions, and vehicles (Chart 5). Things are even improving on the semiconductor front. Chart 6 shows that memory chip prices are in a clear downtrend. Chart 5Pandemic-Driven Inflation Is Cresting
The Best Trade For The Rest Of 2021: Long EM Equities And Currencies
The Best Trade For The Rest Of 2021: Long EM Equities And Currencies
Chart 6Chip Prices Are Off Their Highs
Chip Prices Are Off Their Highs
Chip Prices Are Off Their Highs
Chart 7Agricultural Prices Have Stabilized, Which Will Help Cool EM Inflation
Agricultural Prices Have Stabilized, Which Will Help Cool EM Inflation
Agricultural Prices Have Stabilized, Which Will Help Cool EM Inflation
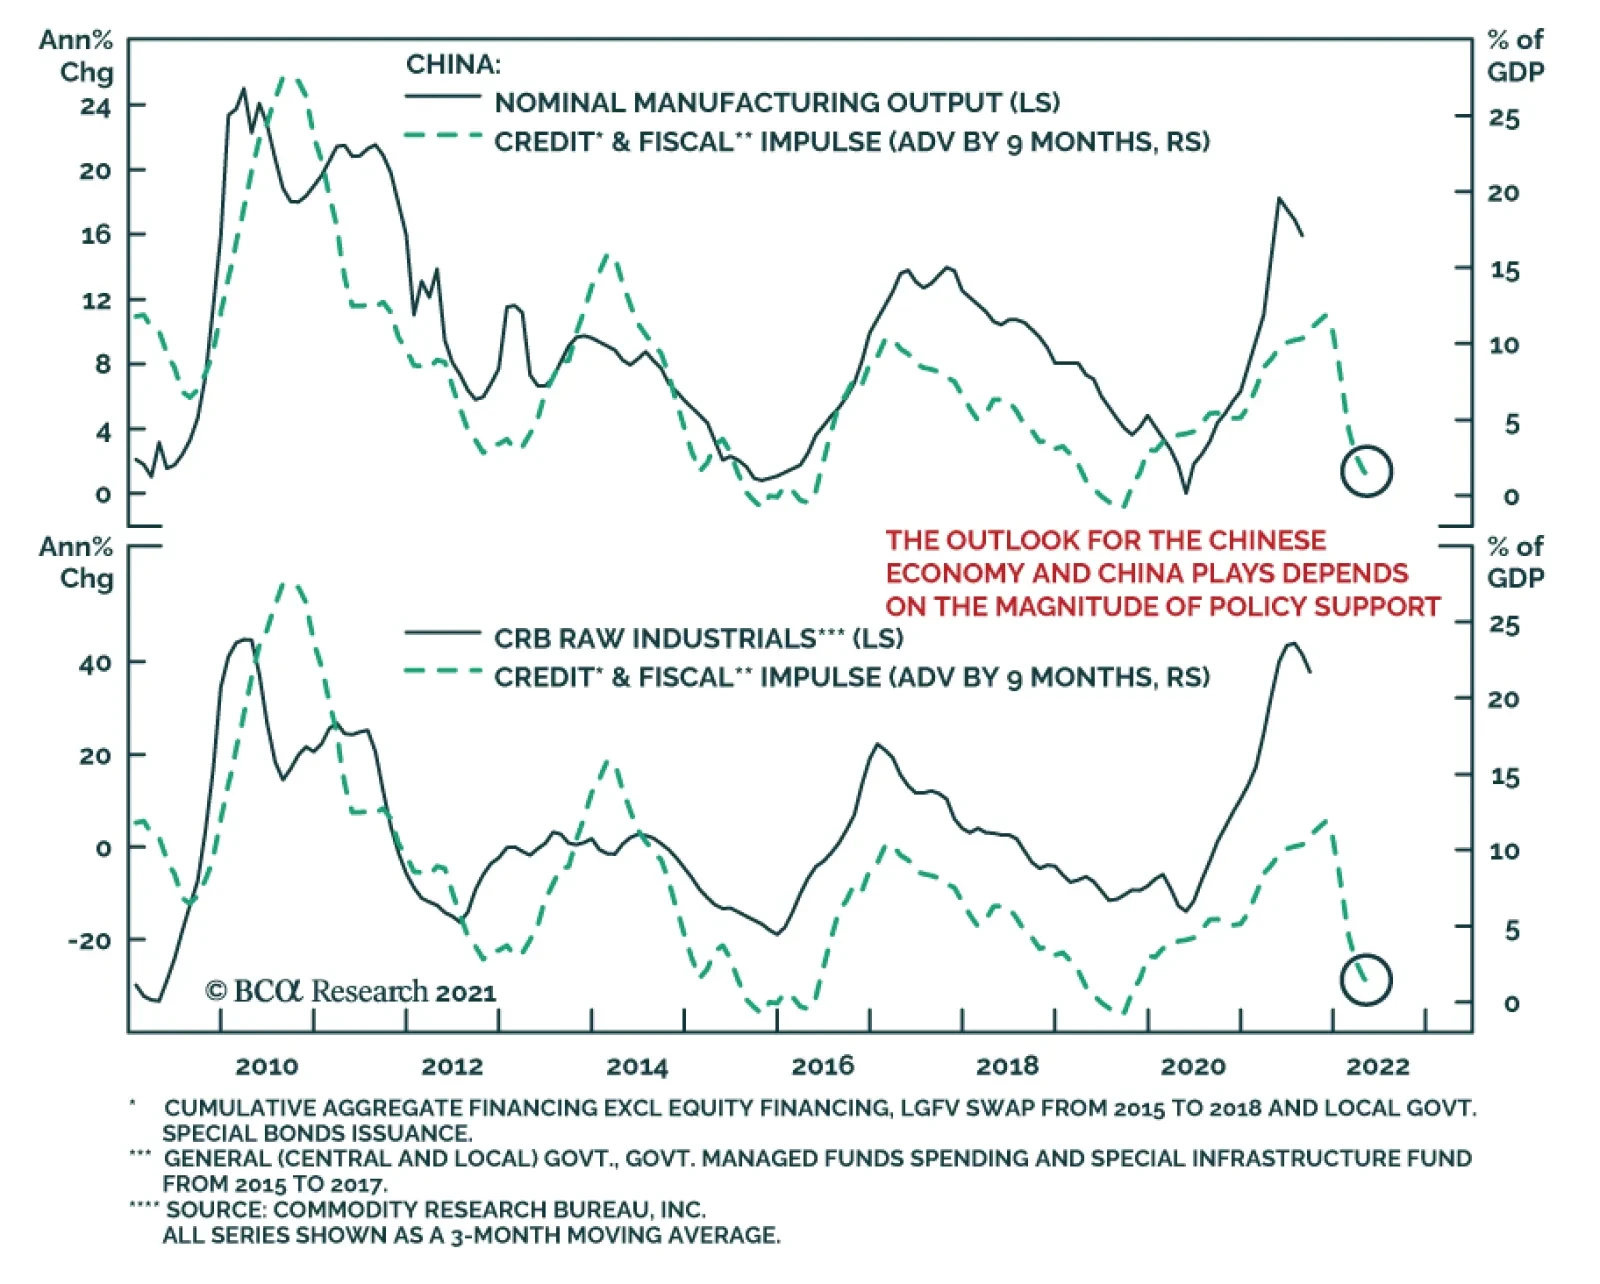
Critically for emerging markets, agricultural prices have stabilized (Chart 7). Historically, food inflation has been a major driver of EM inflation. Chinese Stimulus On The Way Growth in China was quite weak in the first half of the year, averaging only 3.5% on a sequential annualized basis (Chart 8). The Bloomberg consensus estimate is for Q3 growth to hit 4.3%, reflecting the negative impact of lockdown measures and the lagged effect from policy tightening. Growth in the fourth quarter is expected to rebound to only 5.7%. This seems too low to us. Barring a major spike in Covid cases, Chinese industry will be saddled with fewer social distancing restrictions in the fourth quarter. Policy is also turning more stimulative. The PBOC cut bank reserve requirements in July. In the past, cuts in reserve requirements have been a reliable predictor of faster credit growth (Chart 9). Chart 8Chinese Growth Should Accelerate After A Disappointing First Half Of 2021
Chinese Growth Should Accelerate After A Disappointing First Half Of 2021
Chinese Growth Should Accelerate After A Disappointing First Half Of 2021
Chart 9Chinese Stimulus Is On The Way
Chinese Stimulus Is On The Way
Chinese Stimulus Is On The Way
With credit growth back to its 2018 lows, there is little need for further actions to reduce lending. On the contrary, the PBOC’s meeting with financial institutions on August 23rd revealed a desire to increase credit availability. Partly reflecting this development, new bank loans rose to RMB 1.22 trillion in August, up from RMB 1.08 trillion in the prior month. Chart 10EM Stocks Have Done Well When Global Industrial Stocks Have Outperformed
EM Stocks Have Done Well When Global Industrial Stocks Have Outperformed
EM Stocks Have Done Well When Global Industrial Stocks Have Outperformed
On the fiscal side, the Ministry of Finance stated on August 27th its intention to ramp up fiscal spending by increasing local government bond issuance. As of the end of August, local governments had used up only 50% of their annual debt issuance quota, compared to 77% at the same time last year and 93% in 2019. To reinforce the need for more stimulus, the authorities announced an additional RMB 300 billion in credit support for SMEs during the latest State Council meeting held on September 1st. Local Chinese government spending has typically flowed into infrastructure. Increased infrastructure spending should buttress metals prices while providing a tailwind for global industrial stocks. I agree with Arthur’s assessment that industrials will be a winning equity sector over the coming years. EM stocks have usually beaten the global benchmark during periods when global industrial stocks were outperforming (Chart 10). A Weaker US Dollar Will Benefit Emerging Markets EM stocks tend to perform best when the US dollar is on the back foot (Chart 11). We expect the greenback to weaken over the next 12 months. As a countercyclical currency, the dollar is likely to struggle in an environment of above-trend global growth (Chart 12). Chart 11EM Stocks Tend To Outperform The Global Benchmark When The Dollar Is Weakening
EM Stocks Tend To Outperform The Global Benchmark When The Dollar Is Weakening
EM Stocks Tend To Outperform The Global Benchmark When The Dollar Is Weakening
Chart 12The Dollar Is A Countercyclical Currency
The Dollar Is A Countercyclical Currency
The Dollar Is A Countercyclical Currency
Interest rate differentials have moved sharply against the dollar (Chart 13). The US trade deficit has surged over the past 16 months. The way the US has been financing its trade deficit – relying heavily on fickle equity inflows – also leaves the dollar in a vulnerable position (Chart 14). Chart 13Interest Rate Differentials Have Moved Against The Dollar
Interest Rate Differentials Have Moved Against The Dollar
Interest Rate Differentials Have Moved Against The Dollar
Chart 14Volatile Equity Inflows Have Been Financing The US Trade Deficit, Putting The Dollar In A Vulnerable Position
Volatile Equity Inflows Have Been Financing The US Trade Deficit, Putting The Dollar In A Vulnerable Position
Volatile Equity Inflows Have Been Financing The US Trade Deficit, Putting The Dollar In A Vulnerable Position
Go Long BRL And RUB Against a backdrop of broad-based dollar weakness, EM currencies will strengthen. Currently, the 12-month interest rate differential between Brazil and the US stands at 8.7%, up from a low of 2.1% last year. Russian rates have also risen rapidly relative to US rates (Chart 15). The Russian ruble will benefit from the cyclical recovery in oil prices. Bob Ryan and BCA’s commodity team project that the price of Brent will rise 5% to $80/bbl in 2023, whereas market expectations are for a 12% decline (Chart 16). Likewise, Brazil will gain from both higher oil prices and rising Chinese demand for metals. Chart 15Interest Rate Differentials Favor The RUB And BRL Versus The USD
Interest Rate Differentials Favor The RUB And BRL Versus The USD
Interest Rate Differentials Favor The RUB And BRL Versus The USD
Chart 16Oil Prices Have More Upside
Oil Prices Have More Upside
Oil Prices Have More Upside
Accordingly, we are initiating a new trade going long an equally-weighted basket consisting of BRL/USD and RUB/USD. Are EMs A Value Trap? Emerging market stocks currently trade at a Shiller PE ratio of 14.7, compared to 36.8 for the US, 22.2 for Europe, and 24.1 for Japan. The EM discount to the global index is as large now as it was during the late 1990s. Other valuation measures tell a similar story (Chart 17). Chart 17AEM Equities Are Trading At A Large Discount (I)
The Best Trade For The Rest Of 2021: Long EM Equities And Currencies
The Best Trade For The Rest Of 2021: Long EM Equities And Currencies
Chart 17BEM Equities Are Trading At A Large Discount (II)
The Best Trade For The Rest Of 2021: Long EM Equities And Currencies
The Best Trade For The Rest Of 2021: Long EM Equities And Currencies
A low PE ratio for EM stocks could be justified based on weak expected earnings growth. However, it is far from clear that such an expectation is warranted. While EM earnings growth has lagged the US since 2011, this follows a decade when EM earnings grew much faster than in the US (Chart 18). Chart 18AEM Earnings Have Moved Sideways Since 2011 After Blazing Higher Over The Preceding Decade (I)
EM Earnings Have Moved Sideways Since 2011 After Blazing Higher Over The Preceding Decade (I)
EM Earnings Have Moved Sideways Since 2011 After Blazing Higher Over The Preceding Decade (I)
Chart 18BEM Earnings Have Moved Sideways Since 2011 After Blazing Higher Over The Preceding Decade (II)
EM Earnings Have Moved Sideways Since 2011 After Blazing Higher Over The Preceding Decade (II)
EM Earnings Have Moved Sideways Since 2011 After Blazing Higher Over The Preceding Decade (II)
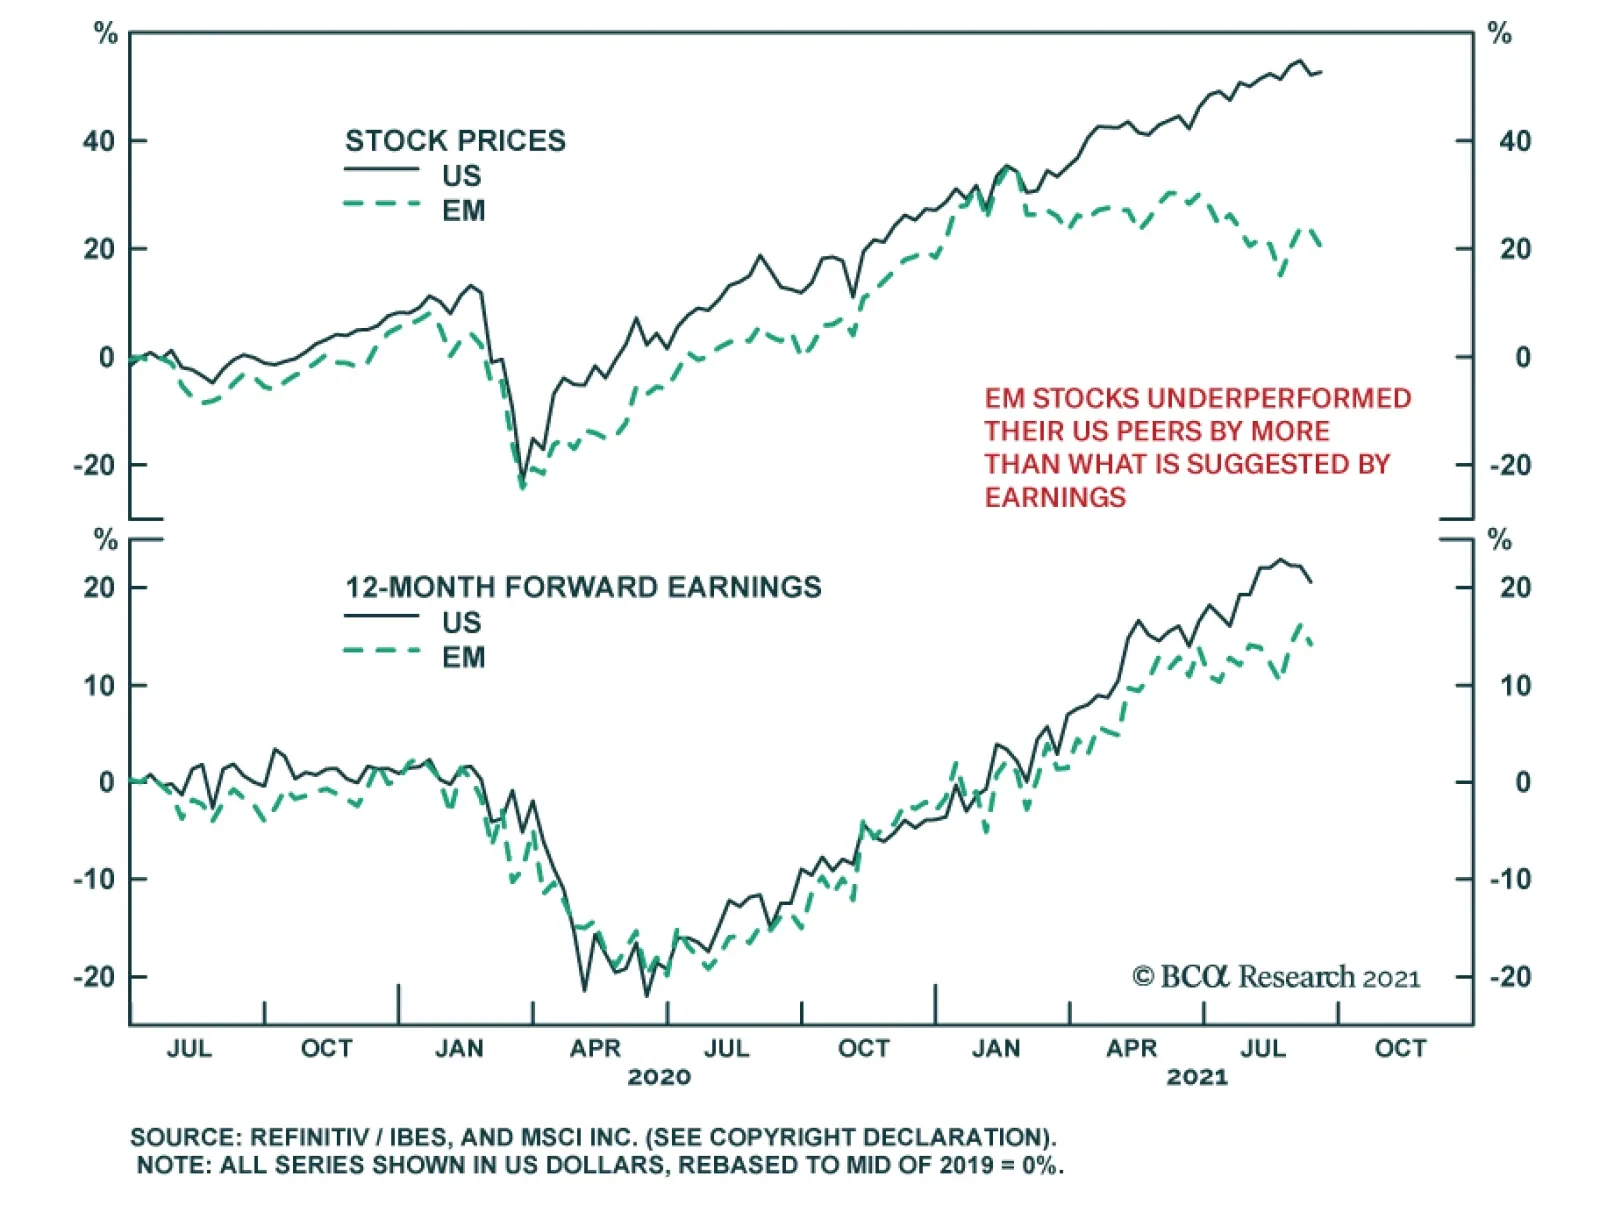
Chart 19EM Stocks Underperformed Their US Peers By More Than What Is Suggested By Earnings
EM Stocks Underperformed Their US Peers By More Than What Is Suggested By Earnings
EM Stocks Underperformed Their US Peers By More Than What Is Suggested By Earnings
On that note, it is worth mentioning that US earnings have risen by only 6 percentage points more than EM earnings since mid 2019 (20% versus 14%), even as EM stocks have underperformed their US peers by 29% over this period (52% versus 23%) (Chart 19). China’s Regulatory Crackdown The regulatory crackdown on Chinese tech companies has weighed on the sector. Chinese tech stocks have underperformed their global tech peers by 48% since February (Chart 20). Chart 20Chinese Tech Stocks Have Been Underperforming Their Global Tech Peers
Chinese Tech Stocks Have Been Underperforming Their Global Tech Peers
Chinese Tech Stocks Have Been Underperforming Their Global Tech Peers
Chinese tech is 44% of the China investable index and 15% of the MSCI EM index. Thus, the outlook for Chinese stocks is relevant not just for China-focused investors, but for EM investors more broadly (especially those who invest in index products). The current crackdown bears some resemblance to the one in 2018, which saw Tencent lose $20 billion in market capitalization in a single day. Like other Chinese tech names, Tencent shares quickly recovered from that incident. Contrary to popular perception, the Chinese government has not launched an indiscriminate attack on tech companies. If anything, heightened geopolitical tensions have made it more important than ever for China to buttress its tech sector. Rather, what the government has done is restrain companies that it either perceives as working against the national interest (i.e., addictive video game makers and expensive after-school tutoring companies) or that have too much sway over the public. Private tech companies in sectors such as semiconductors or clean energy continue to receive government support. A plausible outcome is that China’s leading consumer-oriented internet companies will go out of their way to pledge allegiance to the Communist Party just as US companies have pledged allegiance to woke ideology. If that were to happen, the Chinese government may allow them to operate normally, cognizant of the fact that it is easier to monitor a few large internet companies than many small ones. While such an outcome is far from assured, current valuations offer enough cushion to prospective investors. As we go to press, Alibaba is trading at 16.4-times earnings, Baidu is trading at 17.9-times earnings, and Tencent is trading at 26.7-times current year earnings. In comparison, the NASDAQ 100 trades at nearly 30-times earnings. Investment Conclusions Sentiment towards EM stocks is very bearish (Chart 21). Investor angst towards China is especially elevated, with the media replete with stories about the tech crackdown and problems at Evergrande, the country’s largest property developer. Chart 21Sentiment Towards EM Stocks Is Highly Bearish
Sentiment Towards EM Stocks Is Highly Bearish
Sentiment Towards EM Stocks Is Highly Bearish
All these downside risks to EM assets are well known. What are less well known are the upside risks stemming from higher vaccination rates, an easing of domestic inflationary pressures, Chinese stimulus, a weaker US dollar, and favorable valuations. With that in mind, we are upgrading our rating on EM equities and currencies to strong overweight in the view matrix at the back of this report. We are also reinstating a long EM/Global equity trade (ETF proxy: VWO versus VT). The risk-reward of buying Chinese internet stocks is reasonably appealing. Investors who want to mitigate risk should consider writing cash-covered puts. For example, a BABA put with a strike price of $130 expiring on December 16th 2022 trades for about $16. If the price of BABA does not fall below $130, you will pocket the premium, realizing an annualized yield of 9%. If the price does fall to $130, you get the stock at an attractive PE ratio of 12.5 based on current forward earnings estimates. Peter Berezin Chief Global Strategist pberezin@bcaresearch.com Global Investment Strategy View Matrix
The Best Trade For The Rest Of 2021: Long EM Equities And Currencies
The Best Trade For The Rest Of 2021: Long EM Equities And Currencies
Special Trade Recommendations
The Best Trade For The Rest Of 2021: Long EM Equities And Currencies
The Best Trade For The Rest Of 2021: Long EM Equities And Currencies
Current MacroQuant Model Scores
The Best Trade For The Rest Of 2021: Long EM Equities And Currencies
The Best Trade For The Rest Of 2021: Long EM Equities And Currencies
Highlights Global growth is peaking, but US growth is losing momentum relative to its peers. This has historically been negative for the greenback. Chinese monetary policy is no longer on a tightening path, and might ease going forward. As discounting mechanisms, cyclical currencies should outperform. Our bias is that non-US growth will outperform growth in the US over the next 12-18 months. This will lead to capital reallocation away from the US dollar. While US bond yields could rise towards 2%, real interest rates will remain low compared to history. Our recommendations remain the same: the DXY will struggle to punch above the 94-95 level, but will ultimately touch 80. Feature Chart I-1US Growth Momentum And The Dollar
US Growth Momentum And The Dollar
US Growth Momentum And The Dollar
The DXY index is up for the year, but has twice failed to punch the 94 level. The first leg of the rally from January to March occurred within a context of rising global yields, led by the US. The second leg, starting in June was triggered by a perceived hawkish shift from the Federal Reserve. The common denominator for both legs of the rally was that US growth was outperforming growth in the rest of the world. But that is beginning to change. Bloomberg consensus forecasts show a sharp reversal in US growth momentum, relative to its peers (Chart I-1). Historically, this has put a firm ceiling on the greenback. Cycles And The US Dollar The dollar tends to fare worse early in the cycle when growth is rising but inflation is falling (Chart I-2). Admittedly, inflation prints in some developed markets like the US and Canada have been rather strong. But to the extent that these prints reflect transitory factors, it should allow global central banks to remain accommodative, supporting growth. The remarkable thing about Chart I-1 is that the rotation in growth from the US towards other countries has been broad based. Countries such as Canada, New Zealand, Brazil and Mexico are seeing a bottoming in growth momentum relative to the US (Chart I-3). Chart I-2The Dollar Fares Poorly Early In The Cycle
Why The Ultimate Low In The Dollar Is Nigh
Why The Ultimate Low In The Dollar Is Nigh
Chart I-3A Rotation Of Growth From The US
A Rotation Of Growth From The US
A Rotation Of Growth From The US
This bottoming in growth momentum is occurring at the same time as local central banks are becoming more orthodox about monetary policy. The Reserve Bank of New Zealand has ended quantitative easing. The Bank of Canada has cut asset purchases in half. Brazil, Mexico and Russia, among other emerging market countries are hiking interest rates. While it is true that inflation in some developed and emerging markets like Canada, the UK, Brazil and Russia is perking up, for most developed markets as a whole, inflation is actually surprising to the upside in the US (Chart I-4). China has been tightening policy amidst very low inflation. Currencies tend to be driven by real rates. A growth rotation away from the US, in addition to more orthodox monetary policies outside the US, will be negative for the greenback. Chart I-4US Relative Inflation And The Dollar
US Relative Inflation And The Dollar
US Relative Inflation And The Dollar
What About Chinese Growth? Chinese growth expectations are still cratering relative to the US. The fiasco around the China Evergrande Group has also led to speculation that this could become a systemic event. For developed market currencies, especially those linked to China like the Australian dollar, this is a market-relevant event. Admittedly, offshore markets have started discounting a bigger depreciation in the RMB (Chart I-5). That said, the RMB has been rather resilient against the dollar suggesting that the risk of this becoming a systemic event is rather low (Chart I-6). Chart I-5The Evergrande Risk Is Not Yet Systemic
The Evergrande Risk Is Not Yet Systemic
The Evergrande Risk Is Not Yet Systemic
Chart I-6Chinese Equities And The RMB Have Decoupled.
Chinese Equities And The RMB Have Decoupled.
Chinese Equities And The RMB Have Decoupled.
We believe currency markets are sending the right signal. For one, the Evergrande debacle is occurring at a time when China is no longer tightening monetary policy. Chart I-7 shows that cyclical currencies in developed markets tend to be coincident with the Chinese credit impulse. As such, any easing in monetary policy will put a bottom in these currencies. Over the years, the Chinese bond market has become more and more liberalized. This two-way risk implies that zombies companies should be allowed to fail while unicorns flourish. It is true that regulatory control has been front and center in the current Chinese equity market malaise. That said, our bias is that liberalization is a reason why portfolio inflows into China continue to accelerate, as the economy moves closer to market-determined prices (Chart I-8). This has supported the RMB, a big weight in the Fed trade-weighted dollar. Chart I-7Chinese Policy And DM Currencies
Chinese Policy And DM Currencies
Chinese Policy And DM Currencies
Chart I-8An Unrelenting Increase In Chinese Inflows
An Unrelenting Increase In Chinese Inflows
An Unrelenting Increase In Chinese Inflows
A lot of EM debt is denominated in US dollars, which could be reprised for default risk. But on this basis, the Fed is ahead of the curve. This was the very reason the Federal Reserve introduced swap lines in 2020 with foreign emerging market central banks and made swapping FX reserves for dollars a permanent facility in its toolkit for monetary policy this year. Non-US domestic authorities have ample ability to decide which entities they allow to fail, and which they bail out from their USD obligations. Cross-currency basis swaps, a proxy for the cost of obtaining dollars offshore, remain well behaved (Chart I-9). Chart I-9No USD Funding Stress So Far In Developed Markets
No USD Funding Stress So Far In Developed Markets
No USD Funding Stress So Far In Developed Markets
For developed market currencies, the implication is that China risks are currently overstated, while any upside surprise has not been meaningfully discounted. Gauging Investor Positioning The dollar tends to be a momentum currency. But at turning points, it pays to be a contrarian. Let’s begin with what is priced in. First, the overnight index swap curve (OIS) suggests that markets expect the Fed to hike interest rates faster than other G10 central banks (Chart I-10). This will not occur in a world where growth is stronger outside the US, and other central banks are well ahead in their tapering of asset purchases, pursuing much more orthodox monetary policy. Chart I-10The Market Remains Bullish On Fed Rate Hikes
The Market Remains Bullish On Fed Rate Hikes
The Market Remains Bullish On Fed Rate Hikes
Chart I-11Speculators Are Bullish On ##br##The Dollar
Speculators Are Bullish On The Dollar
Speculators Are Bullish On The Dollar
Second, at the beginning of this report, we highlighted the fact that the dollar is up this year. Part of the reason has been a pilling in of speculators into long greenback positions (Chart I-11). As a trading rule, it has usually been profitable to wait for net speculative positioning and moving averages to roll over before entering fresh dollar short positions (Chart I-12). On this basis, tactical investors might be a bit early, but its is also the case that the macroeconomic environment is moving against the dollar. Once markets start paying attention to the fact that global growth will rotate from the US, pinning the Fed into a more dovish stance, the dollar will quickly depreciate. Chart I-12A Sentiment Trading Rule Will Wait For The Dollar To Roll Over More Broadly
A Sentiment Trading Rule Will Wait For The Dollar To Roll Over More Broadly
A Sentiment Trading Rule Will Wait For The Dollar To Roll Over More Broadly
Often forgotten is that the dollar has tended to move in long cycles, usually 10 years between bull and bear markets. The US trade deficit (excluding oil) is hitting new fresh highs this year. These deficits need to be financed by foreign purchases of US securities, either by debt issued or equity raised. Investors could demand a discount to keep financing these deficits. Should the Congressional Budget Office estimates of the current trajectory of US deficits hold true, the dollar has about 10-15% downside from current levels (Chart I-13). Chart I-13Balance Of Payments Bode Negatively For The Greenback
Balance Of Payments Bode Negatively For The Greenback
Balance Of Payments Bode Negatively For The Greenback
Our geopolitical strategists assign 80% odds to the passage of a bipartisan infrastructure bill, and 65% odds to the passage of a reconciliation bill. Either way, the US fiscal picture is set to deteriorate at a time when the Fed is comtemplating scaling back Treasury purchases. Interestingly, 10-15% downside in the US dollar is exactly what is needed to realign the currency competitively (Chart I-14). Consumer prices have been rising globally, but this has been especially pronounced in the US. To the extent that we live in a globalized world with flexible exchange rates, this should allow more competitive countries to see an increase in their trade balances. This is exactly what is occurring, with the US trade deficit hitting new lows. Chart I-14The Dollar Is Expensive On A PPP Basis
The Dollar Is Expensive On A PPP Basis
The Dollar Is Expensive On A PPP Basis
Risks To The View Currency forecasts are obviously fraught with risks. The biggest risk to the view is a broad-based equity market correction, that reinvigorates inflows into US safe-haven bonds. We are cognizant that this is a risk worth monitoring. For example, investors are preferring to park cash in US Treasurys over gold, two competing safe-haven assets (Chart I-15). This has usually been positive for the greenback. But it also suggests investors view the Fed is going to be orthodox in monetary settings, tightening policy faster than the market expects. This boils down to a judgment call. The US market is much more vulnerable to rate changes than other markets (Chart I-16). As such, a hawkish shift by the Federal Reserve could significantly tighten financial conditions (through a stock market correction), setting the stage for an ultimate low in the dollar equity outflows. Chart I-15Safe-Haven Dollar Flows Face Technical Resistance
Safe-Haven Dollar Flows Face Technical Resistance
Safe-Haven Dollar Flows Face Technical Resistance
Chart I-16Higher Bond Yields Will Be Negative For The US Market.
Higher Bond Yields Will Be Negative For The US Market.
Higher Bond Yields Will Be Negative For The US Market.
Given this two-way risk, we are reintroducing our long CHF/NZD position that correlates well with currency volatility (Chart I-17). We are also long the yen on this basis. In terms of housekeeping, our long AUD/NZD trade was stopped out for a loss. As we iterated in our Aussie report, a lot of pessimism is embedded in the AUD, making it a potent candidate for a powerful mean-reversion rally. We recommend reinstating this position at current levels (a nudge above our stop loss). Chart I-17Buy CHF/NZD As A Hedge
Buy CHF/NZD As A Hedge
Buy CHF/NZD As A Hedge
Chester Ntonifor Foreign Exchange Strategist chestern@bcaresearch.com Currencies U.S. Dollar Chart II-1USD Technicals 1
USD Technicals 1
USD Technicals 1
Chart II-2USD Technicals 2
USD Technicals 2
USD Technicals 2
Data out of the US this week was strong: PPI continues to accelerate in the US, rising 8.3% year on year in August while CPI also remains strong at 5.3% on the headline print. Pricing pressures remain acute in the US. The empire manufacturing survey surprised to the upside in September. The headline number was 34.2 versus expectations of a 17.9 reading. Admittedly, this was driven by an increase in selling prices. Retail sales were surprisingly strong in August, with the control group rising 2.5% month on month versus expectations of a flat number. The US dollar DXY index was relatively flat this week. The markets are at a crossroads, gauging whether strong US data will maintain momentum or revert to a lower equilibrium. Our bias is towards the latter, but admittedly, there are two-way risks to this view. Report Links: Arbitrating Between Dollar Bulls And Bears - March 19, 2021 The Dollar Bull Case Will Soon Fade - March 5, 2021 Are Rising Bond Yields Bullish For The Dollar? - February 19, 2021 The Euro Chart II-3EUR Technicals 1
EUR Technicals 1
EUR Technicals 1
Chart II-4EUR Technicals 2
EUR Technicals 2
EUR Technicals 2
Euro area data remains robust: Industrial production printed a solid 7.7% year-on-year growth in July. The trade surplus for July rose to €20.7 bn. The euro fell by 0.6% this week. The ECB has engineered a dovish tapering of asset purchases, but it remains the case as the interest rate expectations between the euro area and the US are at bombed out levels. This should support positive euro area surprises. Report Links: Relative Growth, The Euro, And The Loonie - April 16, 2021 The Euro Dance: One Step Back, Two Steps Forward - April 2, 2021 On Japanese Inflation And The Yen - January 29, 2021 The Japanese Yen Chart II-5JPY Technicals 1
JPY Technicals 1
JPY Technicals 1
Chart II-6JPY Technicals 2
JPY Technicals 2
JPY Technicals 2
Recent Japanese data has been on the weak side: Core machinery orders rose 11.1% year on year in July. Exports were strong in August, rising 34% while imports rose 40%. The yen was flat against the dollar this week. Currency volatility is currently depressed, and Japan has been performing poorly economically. To the extent that this is pandemic related, it sets the JPY up for a playable coil spring rebound. Report Links: The Case For Japan - June 11, 2021 The Dollar Bull Case Will Soon Fade - March 5, 2021 On Japanese Inflation And The Yen - January 29, 2021 British Pound Chart II-7GBP Technicals 1
GBP Technicals 1
GBP Technicals 1
Chart II-8GBP Technicals 2
GBP Technicals 2
GBP Technicals 2
UK data remains on the mend: Industrial production came in at 3.8% year on year, above expectations. Average weekly earnings, including bonus payments, are rising 8.3% year on year as of July. Job gains continue. The July report pushed the unemployment rate from 4.7% to 4.6%. CPI and RPI remain rather sticky around the 3-5% level. House prices rose 8% year on year in July. The pound fell by 0.4% this week. The broad trend in the pound will now be dictated by what happens to both the dollar and the euro. The BoE is more hawkish than the Fed and the ECB should support gilt yields and the pound. A slowing in US economic momentum is also bullish for the sterling. Report Links: Why Are UK Interest Rates Still So Low? - March 10, 2021 Portfolio And Model Review - February 5, 2021 Thoughts On The British Pound - December 18, 2020 Australian Dollar Chart II-9AUD Technicals 1
AUD Technicals 1
AUD Technicals 1
Chart II-10AUD Technicals 2
AUD Technicals 2
AUD Technicals 2
Australian data was slated to slow as we expected, and recent numbers highlight this: There were 146K job losses in August. This was well split between part time and full time. NAB business confidence and current conditions moderately improved in August. House price inflation is tracking the global wave, rising 16.8% year on year in Q2. The AUD fell 1% this week. We discussed the AUD at length in our report two weeks ago and believe current weakness is unwarranted. We are reinstating our long AUD/NZD trade this week. Report Links: The Dollar Bull Case Will Soon Fade - March 5, 2021 Portfolio And Model Review - February 5, 2021 Australia: Regime Change For Bond Yields & The Currency? - January 20, 2021 New Zealand Dollar Chart II-11NZD Technicals 1
NZD Technicals 1
NZD Technicals 1
Chart II-12NZD Technicals 2
NZD Technicals 2
NZD Technicals 2
The was scant data out of New Zealand this week: The current account deficit widened in Q2 to -3.3% of GDP. Q2 GDP was an upside surprise but will likely be torpedoed in Q3 by COVID-19. The NZD was down 0.25% this week. We continue to believe the NZD will fare well cyclically, likely touching 75 cents, but our bias remains that hawkish expectations from the RBNZ are already well priced. This will make the kiwi lag other commodity currencies like the Aussie. We are reinstating our long AUD/NZD trade. Report Links: How High Can The Kiwi Rise? - April 30, 2021 Portfolio And Model Review - February 5, 2021 Currencies And The Value-Versus-Growth Debate - July 10, 2020 Canadian Dollar Chart II-13CAD Technicals 1
CAD Technicals 1
CAD Technicals 1
Chart II-14CAD Technicals 2
CAD Technicals 2
CAD Technicals 2
Data out of Canada this week has been robust: The labor report was strong. Hiring came in at 90K, with a favorable tilt towards full-time work. The unemployment rate fell from 7.5% to 7.1%. The CPI report was equally robust. Core CPI was at 3.5% year on year with most measures of the BoC’s underlying gauge inching higher. Housing starts remained strong in August at 260K, a slight dip from July’s 271K. The CAD was up by 0.44% this week. Last week’s currency report was dedicated to the loonie. With strong oil prices, a relatively hawkish central bank, and easing on tightening pressures from China, the loonie should remain well bid. A minority government will also be bullish for the loonie, as we highlighted last week. Report Links: Relative Growth, The Euro, And The Loonie - April 16, 2021 Will The Canadian Recovery Lead Or Lag The Global Cycle? - February 12, 2021 The Outlook For The Canadian Dollar - October 9, 2020 Swiss Franc Chart II-15CHF Technicals 1
CHF Technicals 1
CHF Technicals 1
Chart II-16CHF Technicals 2
CHF Technicals 2
CHF Technicals 2
There was scant data out of Switzerland this week: PPI came in at 4.4% in August, an increase from July. The Swiss franc was down 0.22% this week. We are going long CHF/NZD as a hedge against rising currency volatility. Being long the yen also makes sense in this environment. However, given our view that risk sentiment will stay ebullient, the franc will lag the bounce in other cyclical currencies on a longer-term horizon. Report Links: An Update On The Swiss Franc - April 9, 2021 Portfolio And Model Review - February 5, 2021 The Dollar Conundrum And Protection - November 6, 2020 Norwegian Krone Chart II-17NOK Technicals 1
NOK Technicals 1
NOK Technicals 1
Chart II-18NOK Technicals 2
NOK Technicals 2
NOK Technicals 2
Norwegian data is surprising to the upside: CPI was 3.4% year on year in August, above expectations. PPI rose 50% year on year in August. The trade balance posted a healthy surplus of NOK 42.6bn in August. The NOK was up 0.5% this week. We continue to be bullish Scandinavian currencies as a cyclical play on a lower US dollar. The NOK benefits from bombed-out valuations and a more orthodox central bank. Report Links: The Norwegian Method - June 4, 2021 Portfolio And Model Review - February 5, 2021 Revisiting Our High-Conviction Trades - September 11, 2020 Swedish Krona Chart II-19SEK Technicals 1
SEK Technicals 1
SEK Technicals 1
Chart II-20SEK Technicals 2
SEK Technicals 2
SEK Technicals 2
The most important data from Sweden this week was the CPI report: CPI rose from 1.7% to 2.1% in August. CPIF, the Riksbank’s preferred measure, accelerated to 2.4%. The SEK was flat this week. A bottoming in the Chinese credit impulse will be a positive impact on growth-sensitive Sweden. Meanwhile, this week’s positive CPI report should pare back expectations of more stimulus from the Riksbank. We are short both EUR/SEK and USD/SEK as reflation plays. Report Links: Revisiting Our High-Conviction Trades - September 11, 2020 More On Competitive Devaluations, The CAD And The SEK - May 1, 2020 Sweden Beyond The Pandemic: Poised To Re-leverage - March 19, 2020 Trades & Forecasts Forecast Summary Strategic Holdings Tactical Holdings Limit Orders Closed Trades
BCA Research's Emerging Markets Strategy service expects Evergrande’s partial default to reinforce credit tightening in China. Evergrande will likely default on some of its liabilities but there will be a bailout or roll-over of its other debt. This raises…