Emerging Markets

Highlights Stocks tend to perform worse when unemployment is low. Since 1950, the S&P 500 has risen at an annualized pace of 12% when the unemployment rate was above its historic average compared to 6% when the unemployment rate was below its average. Three reasons help explain this relationship: 1) The unemployment rate has historically been mean-reverting; 2) Low unemployment often leads to monetary tightening; and 3) Valuations are usually more stretched when unemployment is low. In the spring of 2020, stocks benefited from what turned out to be a very auspicious environment: A steady decline in the unemployment rate from very high levels, assisted by a massive dose of monetary and fiscal stimulus. Today, the situation is less clear-cut. The labor market has improved dramatically, while both monetary and fiscal policy are turning less accommodative. Nevertheless, the Fed is unlikely to hike rates for at least 12 months, and it will take much longer than that for monetary policy to turn restrictive. This suggests that we are still in the middle-to-late stages of a business cycle expansion that began following the Great Recession (and was only briefly interrupted by the pandemic). Historically, cyclical stocks have done well during this phase of the business cycle. To the extent that cyclicals are overrepresented in overseas indices, investors should favor non-US stock markets. Non-US stocks also trade at a substantial valuation discount to their US peers. A Surprising Relationship One of the best pieces of advice I received when I was starting my research career was to get to the punchline as soon as possible. As a strategist, you are not writing a detective novel where the answers are shrouded in mystery until the very end. You are providing conclusions to readers with supporting evidence. Chart 1Stocks Do Best When Unemployment Is High
Is Low Unemployment Good Or Bad For Stocks?
Is Low Unemployment Good Or Bad For Stocks?
With that in mind, let me answer the question posed in the title of this report: Is low unemployment good or bad for stocks? As Chart 1 shows, the answer is bad. The interesting issues are why it is bad and what this may mean for investors today. There are three key reasons why low unemployment has typically corresponded with paltry equity returns: The unemployment rate has historically been mean-reverting: Low unemployment is often followed by high unemployment. And, when the unemployment rate starts rising, it keeps rising. There has never been a case in the post-war era where the unemployment rate has risen by more than one-third of a percentage point without a recession occurring (Chart 2). Chart 2When Unemployment Starts Rising, It Usually Keeps Rising
When Unemployment Starts Rising, It Usually Keeps Rising
When Unemployment Starts Rising, It Usually Keeps Rising
Low unemployment often leads to monetary tightening: An economy can only grow at an above-trend pace if there is labor market slack. Once the slack runs out, growth is liable to weaken as supply-side constraints kick in. Worse yet, labor market overheating has historically prompted central banks to raise rates (Chart 3). Higher rates in the context of slowing growth is toxic for stocks. Valuations are usually more stretched when unemployment is low: During the post-war period, the S&P 500 has traded at an average Shiller P/E ratio of 22.5 when the unemployment rate was below its historic average compared to 16.3 when the unemployment rate was above its average. Implications For The Present Day Stocks fare best when unemployment is high but falling. In contrast, stocks fare the worst when unemployment is low and rising (Chart 4). My colleague Doug Peta, BCA’s Chief US Investment Strategist, reached a similar conclusion in his August report entitled Level Or Direction? Chart 3Low Unemployment Often Leads To Monetary Tightening
Low Unemployment Often Leads To Monetary Tightening
Low Unemployment Often Leads To Monetary Tightening
Chart 4Stocks Do Best When Unemployment Is Falling From High Levels
Is Low Unemployment Good Or Bad For Stocks?
Is Low Unemployment Good Or Bad For Stocks?
In the spring of 2020, stocks benefited from what turned out to be a very auspicious environment: A steady decline in the unemployment rate from very high levels, assisted by a massive dose of monetary and fiscal stimulus. Controversially at the time, this led us to argue that the pandemic could lead to much higher stock prices. Chart 5There Is Still Slack
There Is Still Slack
There Is Still Slack
Today, the situation is less clear-cut. On the one hand, the unemployment rate has fallen dramatically, while monetary and fiscal policy are turning less accommodative. This week, the ECB reduced the pace of net asset purchases under the PEPP. The Fed will start paring back asset purchases by the end of this year. Governments are also withdrawing fiscal policy support. In the US, emergency federal unemployment benefits expired, somewhat ironically, on Labor Day. On the other hand, the unemployment rate in most economies is still above pre-pandemic levels. In the US, the unemployment rate for prime-age workers is 1.7 percentage points higher than in February 2020, while the employment-to-population ratio is 2.4 points lower (Chart 5). The presence of labor market slack ensures that policy support will be withdrawn only gradually. Granted, core CPI inflation in the US is running above 4%. Standard Taylor Rule equations suggest that the Fed funds rate should be well above zero (Chart 6). That said, these equations use realized inflation, which may be misleading given that both market participants and Fed officials expect inflation to fall rapidly (Chart 7). Indeed, the widely followed 5-year/5-year forward TIPS breakeven rate is below the Fed’s comfort zone (Chart 8).1 With long-term inflation expectations still subdued, there is no urgency for the Fed to sound more hawkish. Chart 6What Rate Does The Taylor Rule Prescribe?
Is Low Unemployment Good Or Bad For Stocks?
Is Low Unemployment Good Or Bad For Stocks?
Chart 7Investors Expect Inflation To Fall Rapidly From Current Levels
Is Low Unemployment Good Or Bad For Stocks?
Is Low Unemployment Good Or Bad For Stocks?
Chart 8Long-Term Inflation Expectations Are Muted
Long-Term Inflation Expectations Are Muted
Long-Term Inflation Expectations Are Muted
Cyclical Stocks Usually Do Best In The Latter Innings Of The Business Cycle Expansion Monetary policy is unlikely to become restrictive in any major economy during the next 18 months, which should allow global growth to remain at an above-trend pace. Hence, it is too early to turn bearish on stocks. Nevertheless, given that the unemployment rate in most countries is closer to a trough than to a peak, it is reasonable to conclude that we are somewhere in the middle-to-late stages of a business cycle expansion that began following the Great Recession (and was only briefly interrupted by the pandemic). As Chart 9 shows, cyclical equity sectors, such as industrials, energy, and materials, typically do best in the latter innings of business cycle expansions. Such was the environment that prevailed in 2005-08, and such will be the environment that prevails over the coming quarters as the unemployment rate falls further, capital spending increases, and commodity prices rise further. Chart 9The Business Cycle And Equity Sectors
Is Low Unemployment Good Or Bad For Stocks?
Is Low Unemployment Good Or Bad For Stocks?
Increased government infrastructure spending should help cyclical sectors. The US Congress is set to pass a 10-year $500 billion package. The EU’s €750 billion Next Generation fund is finally up and running. Chinese local government infrastructure spending is poised to accelerate over the remainder of the year. Chart 10The Dollar Is A Countercyclical Currency
The Dollar Is A Countercyclical Currency
The Dollar Is A Countercyclical Currency
Chart 11Past Another Covid Wave
Is Low Unemployment Good Or Bad For Stocks?
Is Low Unemployment Good Or Bad For Stocks?
A weaker US dollar should also buoy cyclical stocks (Chart 10). As a countercyclical currency, the greenback usually weakens when global growth is strong. A cresting in the Delta variant wave should help jumpstart global growth over the coming months (Chart 11). Meanwhile, interest rate differentials have moved sharply against the US dollar, while the US trade deficit has widened noticeably (Charts 12A & B). Chart 12AInterest Rate Differentials Have Moved Against The Dollar
Interest Rate Differentials Have Moved Against The Dollar
Interest Rate Differentials Have Moved Against The Dollar
Chart 12BThe US Trade Deficit Has Widened Noticeably
The US Trade Deficit Has Widened Noticeably
The US Trade Deficit Has Widened Noticeably
Cyclical sectors are overrepresented outside the US (Table 1). Although not a classically cyclical sector, financials are also overrepresented in overseas indices. BCA’s global fixed-income strategists recommend a moderately underweight duration stance. As bond yields rise, bank shares should outperform (Chart 13). In contrast, tech stocks often lag in a rising yield environment. Table 1Cyclicals Are Overrepresented Outside The US
Is Low Unemployment Good Or Bad For Stocks?
Is Low Unemployment Good Or Bad For Stocks?
Chart 13Higher Rates: A Boon For Banks And A Bane For Tech
Higher Rates: A Boon For Banks And A Bane For Tech
Higher Rates: A Boon For Banks And A Bane For Tech
How Expensive Are Stocks? A high Shiller P/E predicts low future returns (Chart 14). Today, the Shiller P/E stands at 37 in the US. This is consistent with an expected 10-year total real return of close to zero for the S&P 500. Thus, the long-term outlook for US stocks is poor. We stress the words “long term.” As the bottom panel of Chart 14 shows, no matter what the starting point of valuations is, the average return over short-term horizons is very low relative to realized volatility. This is another way of saying that valuations provide a great deal of information about the long-term outlook for stocks, but little information about their near-term direction. Over horizons of about 12 months, the business cycle drives the stock market, as a simple comparison between purchasing manager indices and stock returns illustrates (Chart 15). Chart 14Valuation Is The Single Best Predictor Of Long-Term Equity Returns
Is Low Unemployment Good Or Bad For Stocks?
Is Low Unemployment Good Or Bad For Stocks?
Chart 15AThe Business Cycle Drives Cyclical Swings In Stocks
The Business Cycle Drives Cyclical Swings In Stocks
The Business Cycle Drives Cyclical Swings In Stocks
Chart 15BThe Business Cycle Drives Cyclical Swings In Stocks
The Business Cycle Drives Cyclical Swings In Stocks
The Business Cycle Drives Cyclical Swings In Stocks
Outside the US, the Shiller P/E stands at 20. In emerging markets, it is only 16 (Chart 16). This is significantly below US levels, implying that the long-term prospect for equities is much more attractive abroad. Thus, both medium-term cyclical factors and long-term valuation considerations favor non-US stocks. Peter Berezin Chief Global Strategist pberezin@bcaresearch.com Chart 16US Stocks Are Pricey
US Stocks Are Pricey
US Stocks Are Pricey
Footnotes 1 The Federal Reserve targets an average inflation rate of 2% for the personal consumption expenditures (PCE) index. The TIPS breakeven is based on the CPI index. Due to compositional differences between the two indices, CPI inflation has historically averaged 30-to-50 basis points higher than PCE inflation. This is why the Fed effectively targets a CPI inflation rate of about 2.3%-to-2.5%. Global Investment Strategy View Matrix
Is Low Unemployment Good Or Bad For Stocks?
Is Low Unemployment Good Or Bad For Stocks?
Special Trade Recommendations
Is Low Unemployment Good Or Bad For Stocks?
Is Low Unemployment Good Or Bad For Stocks?
Current MacroQuant Model Scores
Is Low Unemployment Good Or Bad For Stocks?
Is Low Unemployment Good Or Bad For Stocks?
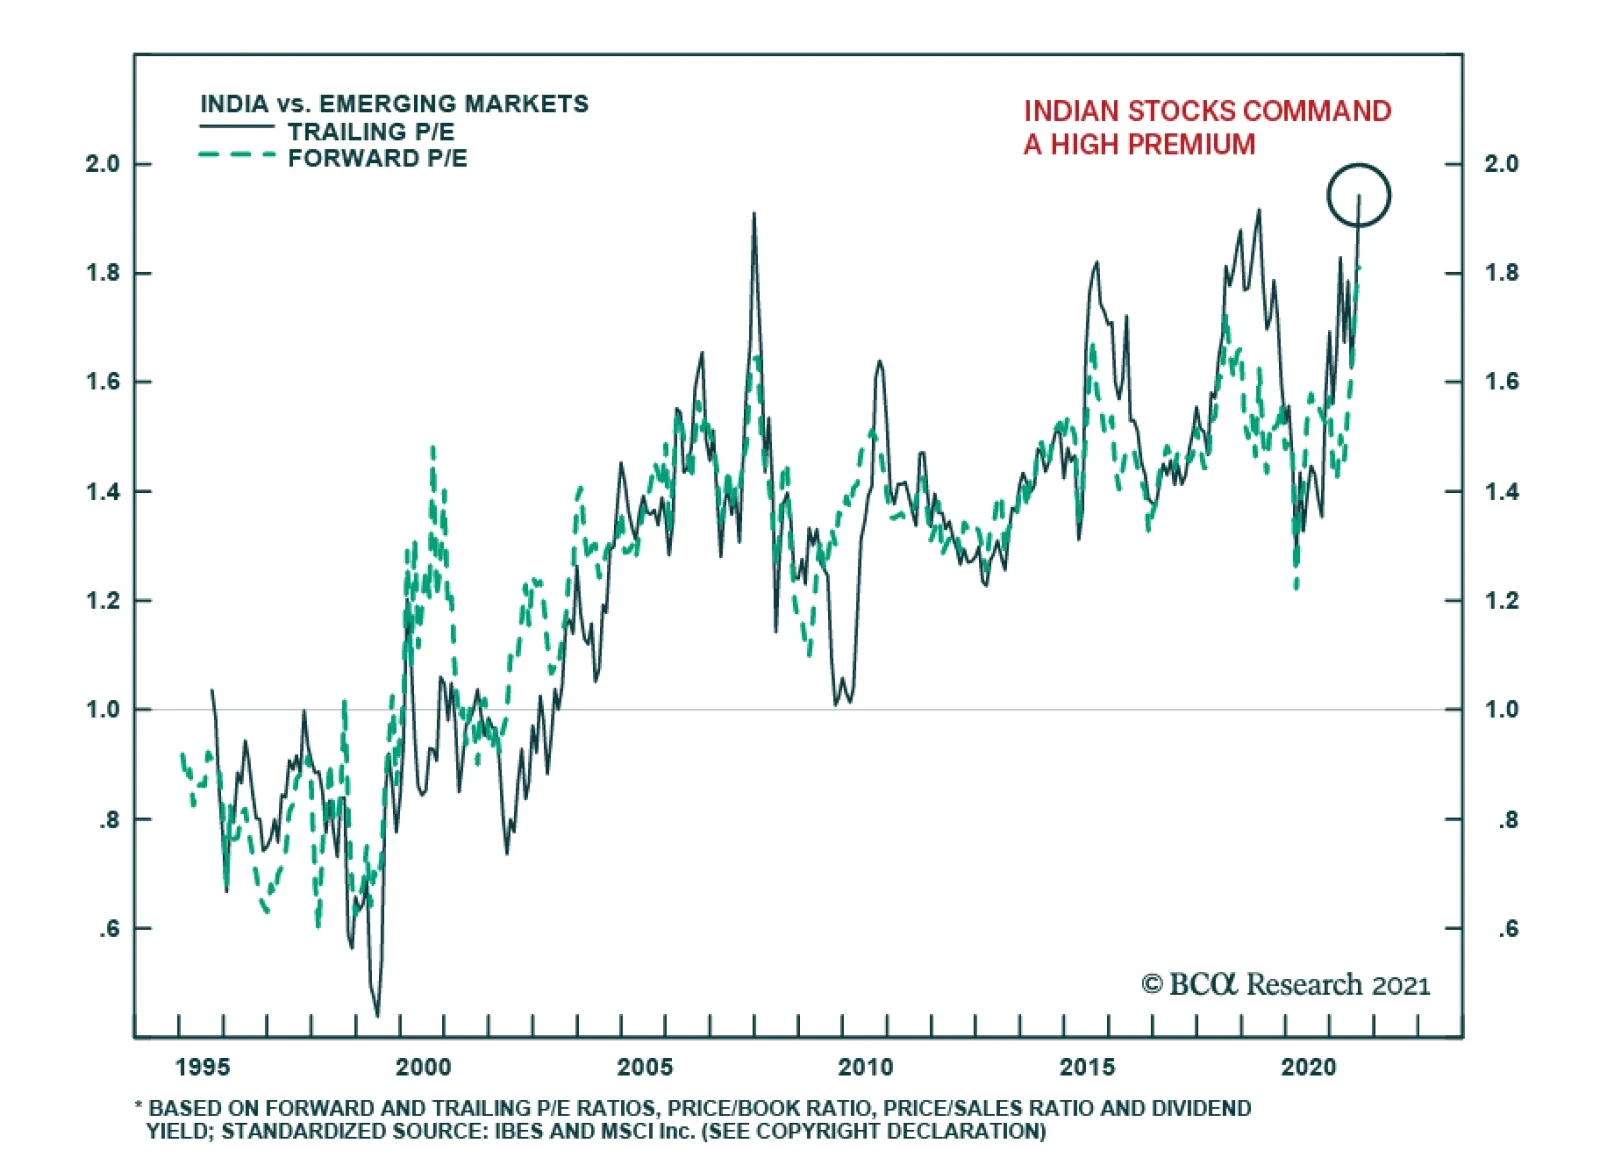
BCA Research's Emerging Market Strategy service concludes that the Indian bourse's structurally high premium relative to EM will likely continue. With a trailing P/E of 31, and P/Book of 3.9, there is no doubt that Indian stocks are expensive. In terms of…
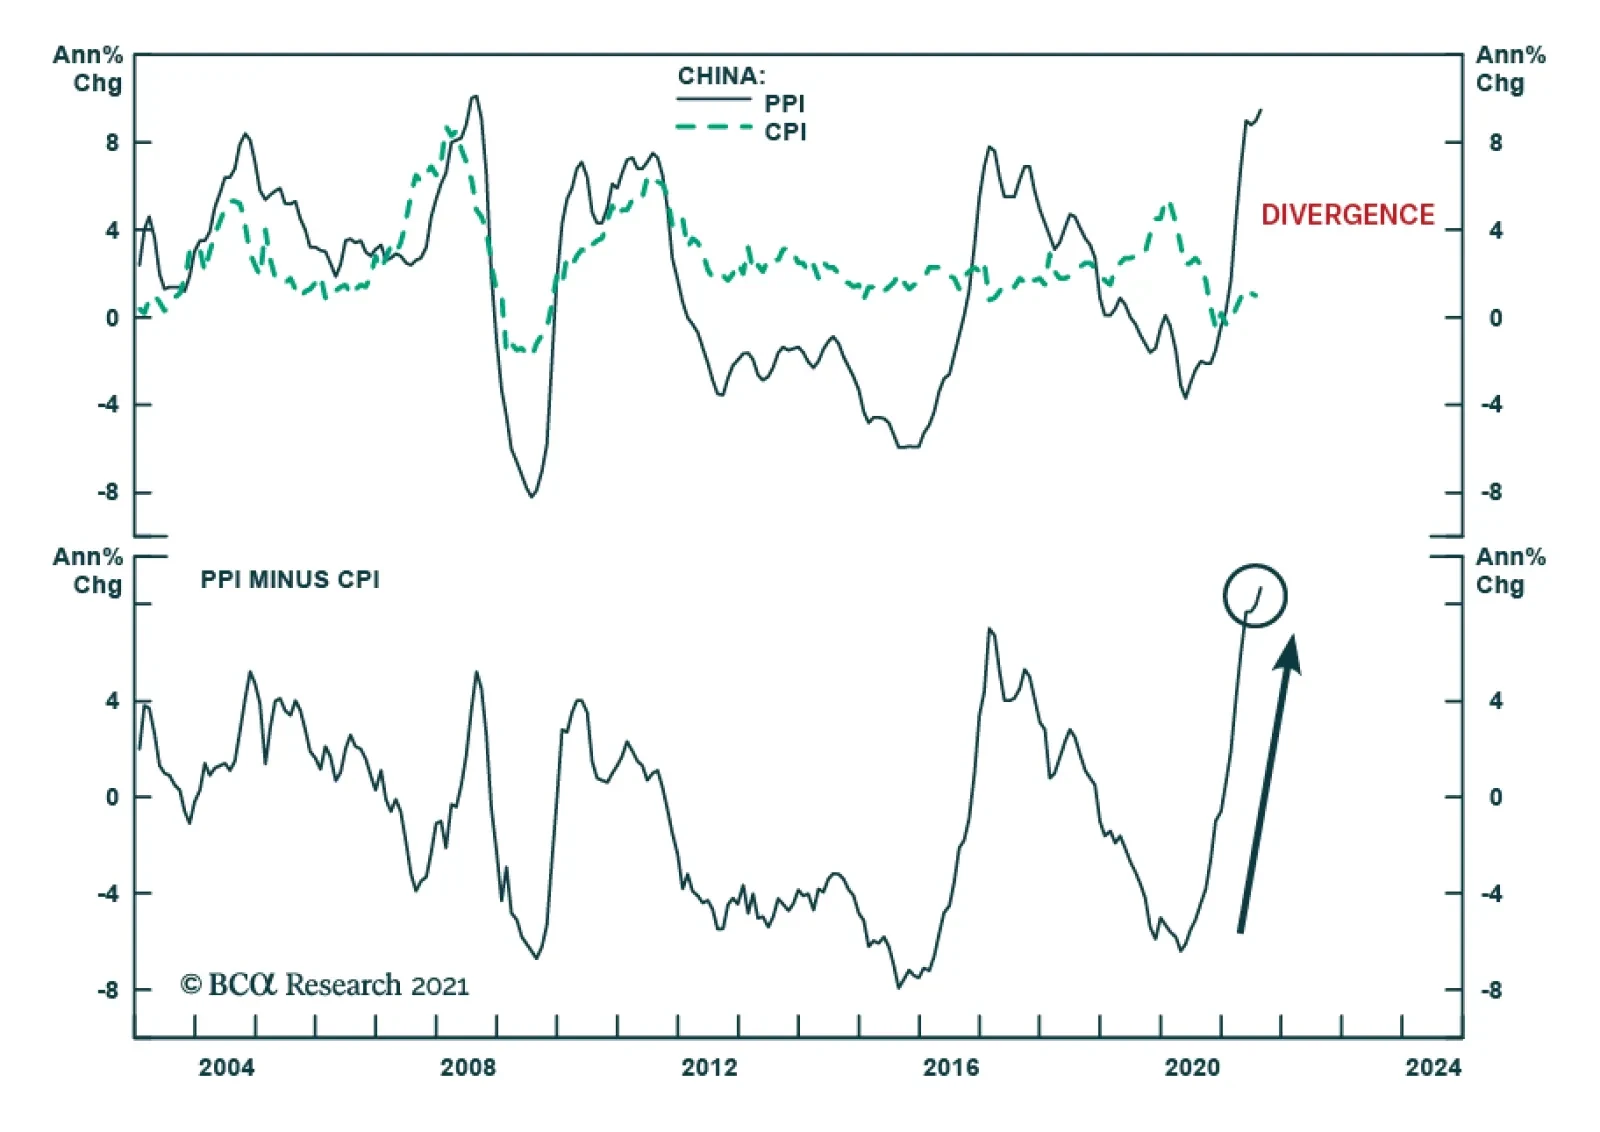
The gap between Chinese producer prices and consumer prices widened to a 31-year high in August. CPI inflation slowed to 0.8% y/y and fell below expectations it would remain unchanged at July's 1.0%. Meanwhile, PPI accelerated to a 13-year high of 9.5%…
Highlights The US Climate Prediction Center gives ~ 70% odds another La Niña will form in the August – October interval and will continue through winter 2021-22. This will be a second-year La Niña if it forms, and will raise the odds of a repeat of last winter's cold weather in the Northern Hemisphere.1 Europe's natural-gas inventory build ahead of the coming winter remains erratic, particularly as Russian flows via Ukraine to the EU have been reduced this year. Russia's Nord Stream 2 could be online by November, but inventories will still be low. China, Japan, South Korea and India – the four top LNG consumers in Asia – took in 155 Bcf of the fuel in June. A colder-than-normal winter would boost demand. Higher prices are likely in Europe and Asia (Chart of the Week). US storage levels will be lower going into winter, as power generation demand remains stout, and the lingering effects from Hurricane Ida reduce supplies available for inventory injections. Despite spot prices trading ~ $1.30/MMBtu above last winter's highs – currently ~ $4.60/MMBtu – we are going long 1Q22 NYMEX $5.00/MMBtu natgas calls vs short NYMEX $5.50/MMBtu natgas calls expecting even higher prices. Feature Last winter's La Niña was a doozy. It brought extreme cold to Asia, North America and Europe, which pulled natural gas storage levels sharply lower and drove prices sharply higher as the Chart of the Week shows. Natgas storage in the US and Europe will be tight going into this winter (Chart 2). Europe's La Niña lingered a while into Spring, keeping temps low and space-heating demand high, which delayed the start of re-building inventory for the coming winter. In the US, cold temps in the Midwest hampered production, boosted demand and caused inventory to draw hard. Chart of the WeekA Return Of La Niña Could Boost Global Natgas Prices
A Return Of La Niña Could Boost Global Natgas Prices
A Return Of La Niña Could Boost Global Natgas Prices
Chart 2Europe, US Gas Stocks Will Be Tight This Winter
NatGas: Winter Is Coming
NatGas: Winter Is Coming
Summer in the US also produced strong natgas demand, particularly out West, as power generators eschewed coal in favor of gas to meet stronger air-conditioning demand. This is partly due to the closing of coal-fired units, leaving more of the load to be picked up by gas-fired generation (Chart 3). The EIA estimates natgas consumption in July was up ~ 4 Bcf/d to just under 76 Bcf/d. Hurricane Ida took ~ 1 bcf/d of demand out of the market, which was less than the ~ 2 Bcf/d hit to US Gulf supply resulting from the storm. As a result, prices were pushed higher at the margin. Chart 3Generators Prefer Gas To Coal
NatGas: Winter Is Coming
NatGas: Winter Is Coming
US natgas exports (pipeline and LNG) also were strong, at 18.2 Bcf/d in July (Chart 4). We expect US LNG exports, in particular, to resume growth as the world recovers from the COVID-19 pandemic (Chart 5). This strong demand and exports, coupled with slightly lower supply from the Lower 48 states – estimated at ~ 98 Bcf/d by the EIA for July (Chart 6) – pushed prices up by 18% from June to July, "the largest month-on-month percentage change for June to July since 2012, when the price increased 20.3%" according to the EIA. Chart 4US Natgas Exports Remain Strong
US Natgas Exports Remain Strong
US Natgas Exports Remain Strong
Chart 5US LNG Exports Will Resume Growth
NatGas: Winter Is Coming
NatGas: Winter Is Coming
Chart 6US Lower 48 Natgas Production Recovering
US Lower 48 Natgas Production Recovering
US Lower 48 Natgas Production Recovering
Elsewhere in the Americas, Brazil has been a strong bid for US LNG – accounting for 32.3 Bcf of demand in June – as hydroelectric generation flags due to the prolonged drought in the country. In Asia, demand for LNG remains strong, with the four top consumers – China, Japan, South Korea, and India – taking in 155 Bcf in June, according to the EIA. Gas Infrastructure Ex-US Remains Challenged A combination of extreme cold weather in Northeast Asia, and a lack of gas storage infrastructure in Asia generally, along with shipping constraints and supply issues at LNG export facilities, led to the Asian natural gas price spike in mid-January.2 Very cold weather in Northeast Asia, drove up LNG demand during the winter months. In China, LNG imports for the month of January rose by ~ 53% y-o-y (Chart 7).3 The increase in imports from Asia coincided with issues at major export plants in Australia, Norway and Qatar during that period. Chart 7China's US LNG Exports Surged Last Winter, And Remain Stout Over The Summer
NatGas: Winter Is Coming
NatGas: Winter Is Coming
Substantially higher JKM (Japan-Korea Marker) prices incentivized US exporters to divert LNG cargoes from Europe to Asia last winter. The longer roundtrip times to deliver LNG from the US to Asia – instead of Europe – resulted in a reduction of shipping capacity, which ended up compounding market tightness in Europe. Europe dealt with the switch by drawing ~ 18 bcm more from their storage vs. the previous year, across the November to January period. Countries in Asia - most notably Japan – however, do not have robust natural gas storage facilities, further contributing to price volatility, especially in extreme weather events. These storage constraints remain in place going into the coming winter. In addition, there is a high probability the global weather pattern responsible for the cold spells around the globe that triggered price spikes in key markets globally – i.e., a second La Niña event – will return. A Second-Year La Niña Event The price spikes and logistical challenges of last winter were the result of atmospheric circulation anomalies that were bolstered by a La Niña event that began in mid-2020.4 The La Niña is characterized by colder sea-surface temperatures that develops over the Pacific equator, which displaces atmospheric and wind circulation and leads to colder temperatures in the Northern Hemisphere (Map 1). Map 1La Niña Raises The Odds Of Colder Temps
NatGas: Winter Is Coming
NatGas: Winter Is Coming
The IEA notes last winter started off without any exceptional deviations from an average early winter, but as the new year opened "natural gas markets experienced severe supply-demand tensions in the opening weeks of 2021, with extremely cold temperature episodes sending spot prices to record levels."5 In its most recent ENSO update, the US Climate Prediction Center raised the odds of another La Niña event for this winter to 70% this month. If similar conditions to those of the 2020-21 winter emerge, US and European inventories could be stretched even thinner than last year, as space-heating demand competes with industrial and commercial demand resulting from the economic recovery. Global Natgas Supplies Will Stay Tight JKM prices and TTF (Dutch Title Transfer Facility) prices are likely to remain elevated going into winter, as seen in the Chart of the Week. Fundamentals have kept markets tight so far. Uncertain Russian supply to Europe will raise the price of the European gas index (TTF). This, along with strong Asian demand, particularly from China, will keep JKM prices high (Chart 8). The global economic recovery is the main short-term driver of higher natgas demand, with China leading the way. For the longer-term, natural gas is considered as the ideal transition fuel to green energy, as it emits less carbon than other fossil fuels. For this reason, demand is expected to grow by 3.4% per annum until 2035, and reach peak consumption later than other fossil fuels, according to McKinsey.6 Chart 8BCAs Brent Forecast Points To Higher JKM Prices
BCAs Brent Forecast Points To Higher JKM Prices
BCAs Brent Forecast Points To Higher JKM Prices
Spillovers from the European natural gas market impact Asian markets, as was demonstrated last winter. Russian supply to Europe – where inventories are at their lowest level in a decade – has dropped over the last few months. This could either be the result of Russia's attempts to support its case for finishing Nord Stream 2 and getting it running as soon as possible, or because it is physically unable to supply natural gas.7 A fire at a condensate plant in Siberia at the beginning of August supports the latter conjecture. The reduced supply from Russia, comes at a time when EU carbon permit prices have been consistently breaking records, making the cost of natural gas competitive compared to more heavy carbon emitting fossil fuels – e.g., coal and oil – despite record breaking prices. With Europe beginning the winter season with significantly lower stock levels vs. previous years, TTF prices will remain volatile. This, and strong demand from China, will support JKM prices. Investment Implications Natural gas prices are elevated, with spot NYMEX futures trading ~ $1.30/MMBtu above last winter's highs – currently ~ $4.60/MMBtu. Our analysis indicates prices are justifiably high, and could – with the slightest unexpected news – move sharply higher. Because natgas is, at the end of the day, a weather market, we favor low-cost/low-risk exposures. In the current market, we recommend going long 1Q22 NYMEX $5.00/MMBtu natgas calls vs short NYMEX $5.50/MMBtu natgas calls expecting even higher prices. This is the trade we recommended on 8 April 2021, at a lower level, which was stopped out on 12 August 2021 with a gain of 188%. Robert P. Ryan Chief Commodity & Energy Strategist rryan@bcaresearch.com Ashwin Shyam Research Associate Commodity & Energy Strategy ashwin.shyam@bcaresearch.com Commodities Round-Up Energy: Bullish Earlier this week, Saudi Aramco lowered its official selling price (OSP) by more than was expected – lowering its premium to the regional benchmark to $1.30/bbl from $1.70/bbl – in what media reports based on interviews with oil traders suggest is an attempt to win back customers electing not to take volumes under long-term contracts. This is a marginal adjustment by Aramco, but still significant, as it shows the company will continue to defend its market share. Pricing to Northwest Europe and the US markets is unchanged. Aramco's majority shareholder, the Kingdom of Saudi Arabia (KSA), is the putative leader of OPEC 2.0 (aka, OPEC+) along with Russia. The producer coalition is in the process of returning 400k b/d to the market every month until it has restored the 5.8mm b/d of production it took off the market to support prices during the COVID-19 pandemic. We expect Brent crude oil prices to average $70/bbl in 2H21, $73/bbl in 2022 and $80/bbl in 2023. Base Metals: Bullish Political uncertainty in Guinea caused aluminum prices to rise to more than a 10-year high this week (Chart 9). A coup in the world’s second largest exporter of bauxite – the main ore source for aluminum – began on Sunday, rattling aluminum markets. While iron ore prices rebounded primarily on the record value of Chinese imports in August, the coup in Guinea – which has the highest level of iron ore reserves – could have also raised questions about supply certainty. This will contribute to iron-ore price volatility. However, we do not believe the coup will impact the supply of commodities as much as markets are factoring, as coup leaders in commodity-exporting countries typically want to keep their source of income intact and functioning. Precious Metals: Bullish Gold settled at a one-month high last Friday, when the US Bureau of Labor Statistics released the August jobs report. The rise in payrolls data was well below analysts’ estimates, and was the lowest gain in seven months. The yellow metal rose on this news as the weak employment data eased fears about Fed tapering, and refocused markets on COVID-19 and the delta variant. Since then, however, the yellow metal has not been able to consolidate gains. After falling to a more than one-month low on Friday, the US dollar rose on Tuesday, weighing on gold prices (Chart 10). Chart 9
Aluminum Prices Recovering
Aluminum Prices Recovering
Chart 10
Weaker USD Supports Gold
Weaker USD Supports Gold
Footnotes 1 Please see the US Climate Prediction Center's ENSO: Recent Evolution, Current Status and Predictions report published on September 6, 2021. 2 Please see Asia LNG Price Spike: Perfect Storm or Structural Failure? Published by Oxford Institute for Energy Studies. 3 Since China LNG import data were reported as a combined January and February value in 2020, we halved the combined value to get the January 2020 amount. 4 Please see The 2020/21 Extremely Cold Winter in China Influenced by the Synergistic Effect of La Niña and Warm Arctic by Zheng, F., and Coauthors (2021), published in Advances in Atmospheric Sciences. 5 Please see the IEA's Gas Market Report, Q2-2021 published in April 2021. 6 Please see Global gas outlook to 2050 | McKinsey on February 26, 2021. 7 Please see ICIS Analyst View: Gazprom’s inability to supply or unwillingness to deliver? published on August 13, 2021. Investment Views and Themes Recommendations Strategic Recommendations Tactical Trades Commodity Prices and Plays Reference Table Trades Closed in 2021 Summary of Closed Trades
9 September 2021 at 10:00 EDT Emerging Markets Strategy/Webcast EM/China: See The Forest For The Trees 9 September 2021 at 21:00 EDT Emerging Markets Strategy/Webcast Emerging Asia: See The Forest For The Trees Highlights Structural inflation in India has abated noticeably since the mid-2010s. The cyclical inflation outlook is also benign (Chart 1). As such, the specter of inflation does not pose a material threat to this stock market. Indian stocks’ high valuation is a risk; yet this bourse’s structurally high premium relative to EM will likely continue as India’s earnings growth will stay strong and its volatility low. Investors should stay overweight Indian stocks in an EM equity portfolio, and local currency bonds in an EM domestic bond portfolio. Feature Chart 1India's Cyclical Inflation Outlook Is Benign
Can Inflation Upset The Indian Applecart?
Can Inflation Upset The Indian Applecart?
In a recent Emerging Markets Strategy report we showed that India stands out as the only country in Asia with rather high inflation. Indeed, core CPI in India, at about 6%, is higher than all other major EM and DM countries, save Turkey and Russia. The question is, with the economy re-opening, will Indian inflation rise further and thus derail the rally in Indian equities? Our research indicates that both the structural and cyclical inflation outlook for India remains benign. Our models for headline and core CPI both point to lower inflation in the coming months (Chart 1). As such, inflation is unlikely to pose any major threat to Indian assets in the foreseeable future. Investors should remain overweight Indian stocks in an EM equity portfolio. Fixed-income investors should also continue to overweight Indian local bonds in an EM domestic bond portfolio. Currency traders should favor the rupee versus its EM peers. Inflation Outlook: Structural … The first of the two principal drivers of India’s structural inflation trend is the country’s productivity. The stronger the productivity gains, the more contained has been its structural inflation. The second major driver is broad money supply. The higher the money growth, the steeper have been inflationary pressures – especially during those periods when productivity gains were timid. Top panel of Chart 2 shows that up until the early-2000s, India’s average productivity gains used to be rather low: of the order of 3% annually. That period was also marked by very strong broad money growth: at times, the latter would rise to 20% annually (Chart 2, bottom panel). This growth was due to chronically high fiscal deficits that were monetized, coupled with intermittent surges in bank credit. Chart 2Slower Money Supply Amid Decent Productivity Led To A Structural Decline In Inflation
Can Inflation Upset The Indian Applecart?
Can Inflation Upset The Indian Applecart?
The consequence of persistently low productivity gains amid strong money supply was structurally high inflation, with occasional flare-ups well into double digits (Chart 2). Chart 3Steady Fall In Budget Deficits In Post-GFC Era
Can Inflation Upset The Indian Applecart?
Can Inflation Upset The Indian Applecart?
From the early 2000s, however, that dynamic began to change. A surge in capital spending in infrastructure and other productive capacity propelled India’s productivity trend up by several notches. In the past 15 years, the productivity growth rate has averaged around 6% a year; even though more recently that rate has slowed. In the post-GFC period, both major sources of money creation were stymied. First, successive Indian governments, regardless of political affiliation, adopted a rather tight fiscal policy. They reined in fiscal outlays substantially. Non-interest expenditures of the central government fell from 14% of GDP in 2010 down to 9% by 2019, just before the pandemic (Chart 3, top panel). As a result, during that period, fiscal and primary deficits narrowed significantly: from almost 7% of GDP to 3%, and from almost 4% of GDP to nearly zero, respectively (Chart 3, bottom panel). In addition, a myriad of reasons1 caused commercial bank credit to decelerate materially – from as high as 30% before the GFC to a mere 6% by 2019. The upshot of all this was a secular decline in broad money growth. That eventually led India’s inflationary pressures to decline structurally since the mid-2010s (Chart 2, bottom panel, above). Going forward, those major drivers (both productivity and money growth) will warrant a benign inflation outlook. The country has been continuing its high capital spending for over a decade now (around 30% to 35% of GDP, a rate second only to China). This year, India’s capital spending has already revived. Other corroborating indicators such as imports of capital goods have also recovered robustly. This indicates a new capex cycle is unfolding. Therefore, odds are that the productivity growth rate will stay decent. Prudent fiscal policy, on the other hand, will keep the money growth in check. Chart 4Low Wages Will Help Keep Inflation Subdued
Can Inflation Upset The Indian Applecart?
Can Inflation Upset The Indian Applecart?
Finally, wage pressures in India will also stay muted. In rural areas, both farm and non-farm nominal wages have been growing at a very slow pace; and are now flirting with outright contraction (Chart 4, top panel). Industrial wage expectations have also been tepid over the past several years (Chart 4, bottom panel). The broader picture is unlikely to change in the future as tens of millions of young people continue to join the work force every year. Taken together, these factors point to subdued structural inflation ahead. … And Cyclical The chance that inflation in India will flare up over a cyclical horizon (12 months) is also low: First, one of the major cyclical drivers of inflation in India, the government’s food procurement prices (called Minimum Support Price or MSP) have stayed low for the past several years. The announced MSPs for some of the crops for the 2021-22 agriculture season (July-June) have also shown no marked increase. This will surely help keep the wholesale prices for food in check, which, in turn, will keep a lid on consumer inflation expectations and ultimately on both headline and core consumer inflation (Chart 5). Second, the country’s money growth is also unlikely to witness an immediate, major boom. While the budget deficit has swelled over the past year or so, odds are that the government will revert to the tighter fiscal stance that prevailed over the past decade – as soon as the pandemic is brought under control. Chart 6 shows that government non-interest spending leads core CPI. Reduced expenditure growth will cap inflation. Chart 5Low Food Prices Will Keep A Lid On Inflation Expectations
Can Inflation Upset The Indian Applecart?
Can Inflation Upset The Indian Applecart?
Chart 6Slowing Fiscal Spending Will Cap Core Inflation
Can Inflation Upset The Indian Applecart?
Can Inflation Upset The Indian Applecart?
Chart 7Fuel Price Inflation Is Set To Decelerate
Can Inflation Upset The Indian Applecart?
Can Inflation Upset The Indian Applecart?
The other contributor to money growth, bank credit, is expected to accelerate; but its expansion will not be rapid as banks are still suffering from elevated NPLs. Third, fuel price inflation has likely peaked in India. Last year authorities imposed substantial new taxes on local gasoline and diesel prices, which artificially raised consumer inflation (Chart 7). Since there is little chance of new fuel levies this year and given that crude prices are unlikely to rise much from the current levels (which is EMS’s view), fuel inflation will subside materially next year. And as fuel costs often eventually spill into core inflation, this deceleration will help check the latter as well. Finally, given the massive negative output gap that opened up in the economy during the pandemic-related lockdowns, it will take a while before the economy overheats again. Odds are therefore low that India’s inflation will accelerate much in the coming months. Notably, our cyclical inflation models for both headline and core CPI – built using the drivers discussed above – also vouch for a modest decline in inflation (Chart 1, on page 1). Does Inflation Hurt Stocks? Currently, the Indian economy is not plagued by any major excesses and therefore has no major macro vulnerability. The only potential vulnerability that the economy and stock markets face stem from any possible rise in inflation. Notably, the primary driver of Indian stocks is economic growth and corporate profits. Historically, inflation (CPI) in low- and mid-single digits did not hurt Indian stocks. However, once inflation approached a high-single digit mark (usually 8%), a sell-off in stocks typically occurred. Chart 8 shows that, during India’s high-inflation era (from 1994 to 2013), every time CPI breached the 8% mark (the dotted line in the chart), stocks fell in absolute USD terms, or at the minimum, were weak. Chart 8Indian Stocks Faced Major Headwinds When Headline CPI Approached 8%
Can Inflation Upset The Indian Applecart?
Can Inflation Upset The Indian Applecart?
Chart 9In Recent Years Inflation Has Ceased To Be A Headwind For Indian Stocks
Can Inflation Upset The Indian Applecart?
Can Inflation Upset The Indian Applecart?
Interestingly, the above correlations have changed dramatically since 2014. The top panel of Chart 9 shows that core CPI does not have any steady correlation with stock prices anymore. And core PPI, in fact, has developed a strong positive correlation with stocks (Chart 9, bottom panel) – in complete reversal of the dynamics that prevailed in the previous two decades. The adverse impact of inflation on stock prices is via multiple compression, as rising interest rates lead to equity de-rating. What’s notable is that the multiple compressions do not begin as soon as a rate hike cycle commences. Rather, it takes a meaningful rise in interest rates before it starts to hurt multiples (Chart 10). Given the above, one can expect a material multiple compression only if inflation rises a few notches above the central bank’s target (Chart 11). The odds of that happening now are low. Therefore, policy rates will remain lower for longer, and stock valuations will remain at a higher level than usual. Chart 10Interest Rates Usually Needed To Rise Several Points Before Stock Multiple Compression Began
Can Inflation Upset The Indian Applecart?
Can Inflation Upset The Indian Applecart?
Chart 11India's Inflation Remains Within RBI Target Bands
Can Inflation Upset The Indian Applecart?
Can Inflation Upset The Indian Applecart?
Incidentally, thanks to material rate cuts, real interest rates paid by Indian firms – deflated by both core producer and core consumer prices – have plummeted. Lower real rates benefit the borrowers (i.e., non-financial listed companies) (Chart 12). The bottom line is that, with India’s inflation now being both structurally low (by Indian history) and cyclically tame, it is unlikely to be a cause of any major equity sell-off. Are Indian Equity Valuations Justified? With a trailing P/E of 31, and P/Book of 3.9, there is no doubt that Indian stocks are expensive. Yet, part of the multiple expansion in India, like most other DM countries, has been a direct outcome of a sharply lower policy rate, as discussed above. Incidentally, if one were to look at the cyclically adjusted valuation measures (CAPE), Indian markets appear to be only moderately expensive (Chart 13, top panel). Chart 12Lower Real Rates Boost Firms' Profits And Warrant Higher Stock Prices
Can Inflation Upset The Indian Applecart?
Can Inflation Upset The Indian Applecart?
Chart 13Cyclically-Adjuted P/E Ratio
Can Inflation Upset The Indian Applecart?
Can Inflation Upset The Indian Applecart?
Chart 14Relative Equity Multiples: India vs. EM
Can Inflation Upset The Indian Applecart?
Can Inflation Upset The Indian Applecart?
In terms of relative valuation vis-à-vis the rest of the EM, Indian stocks continue to command a high premium: around 90% in the case of P/E and P/Book multiples. (Chart 14). In terms of cyclically adjusted valuation (CAPE) relative to the EM, India also appears to be quite pricey (Chart 13, bottom panel). The bottom line is that Indian stocks are expensive; and that is a risk to this bourse. A pertinent question here is whether India still merits the structurally high premium that it has enjoyed over the years relative to its peers. Our answer is in the affirmative. One reason this bourse has continued to enjoy a high premium, especially since the mid-2000s, is because the growth of Indian corporate earnings has been superior to those of most other EM countries. But more importantly, the volatility of those earnings has been much lower than its peers. These strong, yet less volatile earnings are what investors have been willing to pay a premium for. Going forward, we see both traits remaining intact. Long-term growth in India will likely stay as one of the highest in the EM world. Earnings volatility is also unlikely to change anytime soon. The reason is, first, lower inflation going forward will entail relatively lower interest rate volatility, and therefore, lower business cycle / earnings volatility. Second, India’s currency volatility will also likely stay lower. Part of the reason is the near absence of foreign investors on government bonds in India. This has precluded India from suffering a major currency sell-off during global risk-off episodes – as few bond investors head for the exit. We discussed this and several other issues related to Indian bond markets and the rupee in much greater detail in our last report on India. Taken together, lower volatility in both local currency earnings and the exchange rate entails lower overall volatility for US dollar-denominated earnings. That will help Indian stocks’ premium to stay elevated beyond any short-term fluctuations. Inflation And The Rupee Chart 15The Rupee Strengthens When Relative Inflation In India Versus US Decelerates
Can Inflation Upset The Indian Applecart?
Can Inflation Upset The Indian Applecart?
The impact of inflation on the rupee is nuanced. It’s not the absolute level of India’s CPI or PPI that affects the rupee-dollar exchange rate; it’s the relative inflation between these two economies that does so. Chart 15 shows that the rupee usually strengthens versus the dollar when inflation in India falls relative to that of US (shown in inverted scale in the chart). These relative inflation dynamics could also provide insight into the exchange rate outlook. Chart 16 shows that the rupee is currently 10% cheaper when measured against what would be its “fair value” (Chart 16, bottom panel). The fair value has been derived from a regression analysis of the exchange rate on the manufacturers’ relative producer prices of the two countries. Investment Recommendations Indian stocks have decisively broken out both in absolute terms and relative to their EM counterparts (Chart 17). Notably, the outperformance is not just due to a sell-off in Chinese TMT stocks. It is even more impressive relative to the ‘mainstream EM’ bourses (i.e., EM excluding China, Taiwan and Korea). Given India’s relatively superior structural and cyclical backdrops, this outperformance should continue for a while (Chart 17, bottom two panels). Investors should stay overweight this bourse in an EM equity portfolio. Chart 16The Indian Rupee Is Now About 10% Below Its Fair Value Versus The US Dollar
Can Inflation Upset The Indian Applecart?
Can Inflation Upset The Indian Applecart?
Chart 17Indian Stocks' Breakout Is Decisive And The Relative Outperformance Is Broad-based
Can Inflation Upset The Indian Applecart?
Can Inflation Upset The Indian Applecart?
Chart 18Higher Carry And A Better Currency Outlook Will Lead To Indian Domestic Bonds' Outperformance
Can Inflation Upset The Indian Applecart?
Can Inflation Upset The Indian Applecart?
The medium-term outlook for the rupee is also positive. The currency is cheap and competitive –an added incentive for both foreign direct investors and portfolio investors. Finally, Indian domestic bonds offer value – both relative to their EM peers and the US treasuries. 10-year government bonds yields, at 6.2%, offer an enticing 480 basis points over similar duration US Treasuries. Given the sanguine rupee and inflation outlooks, Indian bonds will likely continue to outperform EM local bonds (Chart 18). Investors should stay on with our recommendation of overweighting India in an EM local currency bond portfolio. Rajeeb Pramanik Senior EM Strategist rajeeb.pramanik@bcaresearch.com Footnotes 1 The reasons include a surge in bank NPLs, lack of bankable projects, a kind of policy paralysis resulting in delay in various regulatory clearances for capital projects etc.
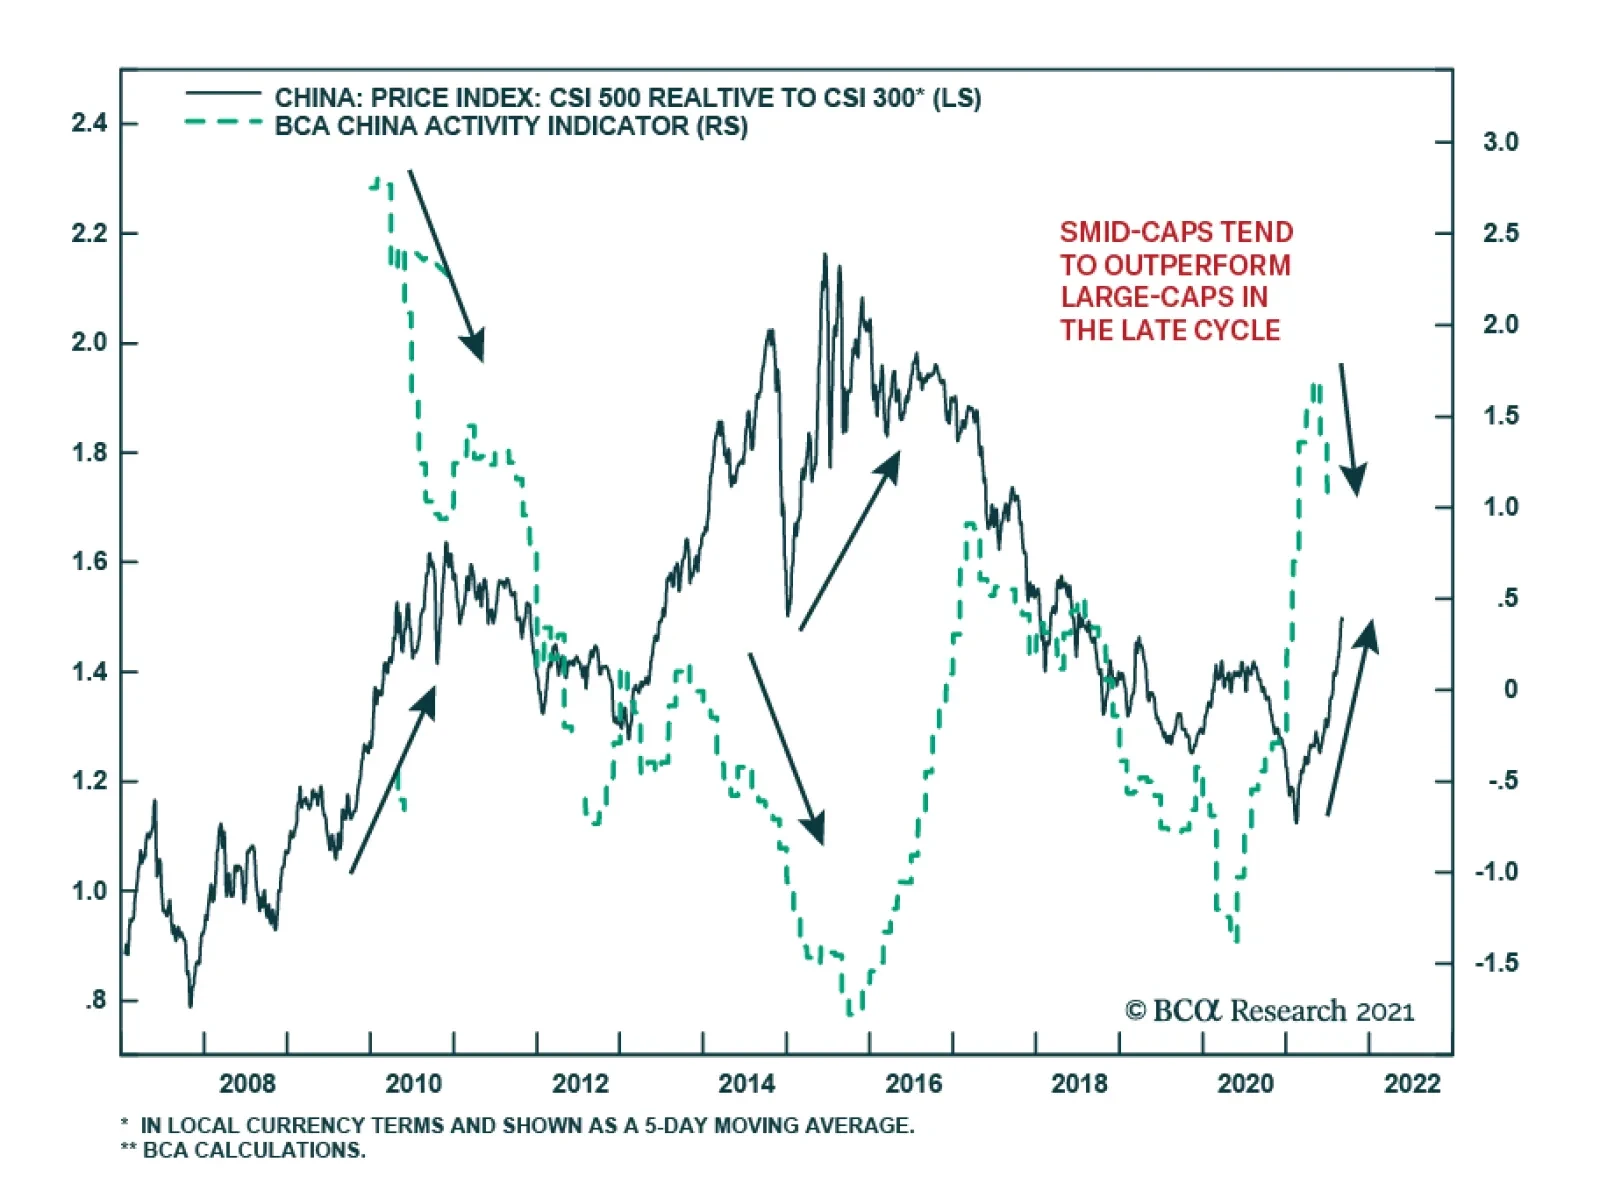
BCA Research's China Investment Strategy service concludes that small and medium caps will likely continue to outperform large-cap stocks this year. Chinese small and medium-cap (SMID-cap) stocks have outperformed large-caps since February and the recent…
Feature Chart 1Chinese Offshore Stocks Tumbled Amid Regulatory Crackdowns
Chinese Offshore Stocks Tumbled Amid Regulatory Crackdowns
Chinese Offshore Stocks Tumbled Amid Regulatory Crackdowns
Relative to the global equity index, onshore and offshore Chinese stocks have fallen by 18% and 32%, respectively, since their peaks in mid-February (Chart 1). The panic sell-off in the offshore market, which saw greater losses due to its high concentration in internet stocks, appears to be overdone and may technically rebound in the near term. However, any short-term bounce in Chinese stocks from oversold levels will likely be short-lived (Chart 2). The crackdown on new economy companies reflects socio-political and economic shifts in China, which raises the odds that the restrictions will continue with further actions focused on social welfare and healthcare. August’s official PMIs and economic data indicate a broad-based softening in China’s domestic demand and production. However, compared with 2018/19 when the US-China trade war exacerbated the deterioration in an already slowing economy, the economy now remains well supported by strong exports. Moreover, the magnitude of the slowdown has not exceeded policymakers’ pain thresholds (Chart 3). Chart 2Tactical Bounce Was Short-Lived In Previous Downturns
Tactical Bounce Was Short-Lived In Previous Downturns
Tactical Bounce Was Short-Lived In Previous Downturns
Chart 3China's Economic Recovery Losing Steam, But From An Elevated Level
China's Economic Recovery Losing Steam, But From An Elevated Level
China's Economic Recovery Losing Steam, But From An Elevated Level
In 2018/19, stimulus was measured and the authorities did not meaningfully relax limits on bank lending standards and shadow banking. Furthermore, China recently reiterated its cross-cycle macro policy setting, which means that policymakers will not use significant stimulus to achieve high and short-term economic growth. Given financial stability measures that aim to contain risks associated with the housing market and hidden local government debt, any monetary and fiscal easing will likely help to stabilize credit growth instead of substantially boosting it this year. For the time being, China’s financial assets continue to face downside risks stemming from a confluence of a weakening business cycle and ongoing regulatory tightening. Thus, we recommend investors maintain an underweight allocation to Chinese equities within a global equity portfolio. Qingyun Xu, CFA Associate Editor qingyunx@bcaresearch.com A Shining Moment For Chinese Small And Medium Caps Small and medium-cap (SMID-cap) stocks have outperformed large-caps since February and the recent regulatory restrictions have intensified the situation. The CSI500 index, which comprises 500 SMID-cap companies, has outperformed the large-cap CSI300 by 34% since mid-February (Chart 4, top panel). Uncertainties surrounding the pandemic and corporate earnings growth have fueled extreme dislocations between large-cap and SMID-cap stocks last year. Large-cap stocks were the main contributors to China’s stock rallies in the second half of last year, while the valuation premia in small cap stocks was compressed to near decade lows (Chart 4, bottom panel). Chart 4A Low Valuation Premia And More Policy Support May Further Lift Prices Of SMID-Caps
A Low Valuation Premia And More Policy Support May Further Lift Prices Of SMID-Caps
A Low Valuation Premia And More Policy Support May Further Lift Prices Of SMID-Caps
Chart 5SMID-Caps Tend To Outperform Large-Caps In Late Business Cycle
SMID-Caps Tend To Outperform Large-Caps In Late Business Cycle
SMID-Caps Tend To Outperform Large-Caps In Late Business Cycle
Historically, SMID-caps tend to outperform large-caps in the late cycle of an economic recovery (Chart 5). The spate of regulatory changes aimed at monopolistic behaviors in various sectors has curbed investors’ appetite for the industry leaders. In addition, the government’s increasing efforts to support small and medium corporates (SMEs) will help to shore up confidence in those companies. Therefore, small and medium caps will likely continue to outperform large-cap stocks this year. Fiscal Support: How Much Room In 2H? The July Politburo meeting pledged more fiscal support for the economy later in 2021 and into 2022. We expect local government bond (LGB) issuance to accelerate: a 4.47 trillion RMB new local government bond issuance quota was approved for 2021, including 820 billion in general bonds and 3.65 trillion in special purpose bonds (SPBs). By end-August, 2.37 trillion new local government bonds had been issued, which was only 53% of the entire year’s goal. However, there are some constraints that will likely reduce the reflationary effects on the economy. First, the quota for LGB issuance approved by the National People’s Congress is 16% lower than last year, but the amount of LGBs maturing this year is 30% higher. Therefore, even though this year’s gross LGB issuance has kept pace with that of last year, more than half of the LGBs issued from January to August was used for debt repayment (Chart 6). The move by local governments to use a large portion of their bond issuance quota to pay off existing debt resembles the situation in 2018 when a financial de-risking campaign encouraged local governments to reduce the stockpile of their leverage. As noted in last week’s report, infrastructure investment and the economy did not rebound in 2H2018, even though LGB issuance picked up (Chart 7). Chart 6More Than Half Of LGBs Issued This Year Has Been Used For Debt Repayment
Chinese Small And Medium Caps Are Finding Their Shining Moment
Chinese Small And Medium Caps Are Finding Their Shining Moment
Chart 7Improvement In Infrastructure Investment Was Short-Lived In 2019
Improvement In Infrastructure Investment Was Short-Lived In 2019
Improvement In Infrastructure Investment Was Short-Lived In 2019
Even if we assume that local governments will use all of their remaining bond quota by year end, the gross monthly average in local government bond issuance will be around 580 billion, only slightly higher than in 2H 2020. Secondly, infrastructure investment is discouraged by stringent regulations to approve projects (including project assessment and debt repayment ability) and the accountability of local officials for project failures. Approvals for infrastructure projects remain at the lowest level since March last year (Chart 8). Finally, SPBs made up only about 15% of overall infrastructure spending in the past three years, while the majority came from public-private partnerships (PPP) financing, revenues from government-managed funds, government budgets and bank loans. Falling proceeds from land transfers have dragged down government-managed funds (Chart 9). In addition, government expenditures show no signs of a material increase (Chart 9, bottom panel). Chart 8Infrastructure Investment Will Remain Subdued
Infrastructure Investment Will Remain Subdued
Infrastructure Investment Will Remain Subdued
Chart 9Government Expenditures Remain Muted
Government Expenditures Remain Muted
Government Expenditures Remain Muted
As discussed in previous reports, local government bonds issuance only accounts for 12% of total social financing. As such, without a sizeable acceleration in bank loans, enhanced LGB issuance would not be enough to prompt a substantial increase in infrastructure investment growth. Our argument is underscored by the structural downshift in infrastructure investment since 2017 (Chart 7, top panel). Therefore, additional local government bond issuance this year will help to stabilize but not boost credit growth. August PMIs Confirm Slowing Economic Activity China's official PMIs eased further in August. The non-manufacturing index fell to contractionary territory of 47.5, below the expectation of a more muted 1.3-point decline to 52.0. Similarly, the manufacturing PMI eased by 0.3 points to 50.1, which is a hair above the 50 boom-bust line. Together, weakness in both sectors pushed down the composite index to 48.9 (Chart 10). Stringent restrictions designed to halt rising rates in COVID-19 infections explain much of the deterioration in China’s service-sector activity. The sector will likely rebound in September with the easing in infection levels (Chart 11). Chart 10PMIs Show Slowing Economic Activity
PMIs Show Slowing Economic Activity
PMIs Show Slowing Economic Activity
Chart 11Lingering COVID Effects Curb Service-Sector Recovery In 2H21
Lingering COVID Effects Curb Service-Sector Recovery In 2H21
Lingering COVID Effects Curb Service-Sector Recovery In 2H21
Meanwhile, the construction PMI surprisedly rebounded sharply in August (Chart 10, bottom panel). However, investors should be cautious not to read too much into the idiosyncratic month-on-month moves suggested by the construction PMI. Instead, construction activity has moderated significantly and is set to slow further, hinting at plunged excavator sales and real estate investment in construction (Chart 12). Chart 12Construction Activity Is Unlikely To Pick Up Meaningfully This Year
Construction Activity Is Unlikely To Pick Up Meaningfully This Year
Construction Activity Is Unlikely To Pick Up Meaningfully This Year
It is clear that China’s economy is losing momentum, but greater economic weakness will be needed for policymakers to stimulate meaningfully. Export Sector Remains A Bright Spot China’s exports remain robust. Export growth picked up in August from July on a year-over-year basis. Although the improvement in August reflects a base effect, exports in level reached a new high (Chart 13). Both skyrocketed exports container freight index and strong Korean exports suggest that global demand for Chinese manufacturing goods remains resilient (Chart 14). Even though manufacturing PMIs from developed markets have rolled over, they remain elevated and should continue to support China’s exports (Chart 15). Chart 13Chinese August Exports In Level Reached A New High
Chinese Small And Medium Caps Are Finding Their Shining Moment
Chinese Small And Medium Caps Are Finding Their Shining Moment
Chart 14Exports Will Remain Robust In The Rest Of The Year...
Exports Will Remain Robust In The Rest Of The Year...
Exports Will Remain Robust In The Rest Of The Year...
In contrast to resilient exports, China’s official PMI export new orders subindex has declined for five consecutive months. Even though falling PMI new export orders subindex heralds a slowing in exports growth, a reading of below the 50 boom-bust threshold in the former does not suggest a contraction in the growth rate of the latter. Furthermore, the month-over-month nature of PMI new export orders subindex tends to overstate the volatility in exports. The divergence between the PMI new export orders subindex and real export growth also occurred in 2018/19 during the height of the US-China trade war when export orders were volatile (Chart 16). Chart 15...And Will Continue To Benefit From Strong Global Demand
...And Will Continue To Benefit From Strong Global Demand
...And Will Continue To Benefit From Strong Global Demand
Chart 16A Divergence Between PMI New Export Orders And Export Growth
A Divergence Between PMI New Export Orders And Export Growth
A Divergence Between PMI New Export Orders And Export Growth
Regulatory Tightening In Real Estate Sector Stringent regulations in housing since the beginning of the year have started to cool the sector (Chart 17). However, home prices inflation in tier-one cities is still elevated (Chart 18). Thus, we expect the controls on housing and among property developers will remain in place for the next 6 to 12 months. Chart 17Housing Sector Is Cooling...
Housing Sector Is Cooling...
Housing Sector Is Cooling...
Chart 18...But Housing Prices In First-Tier Cities Keep Rising At A Faster Rate
...But Housing Prices In First-Tier Cities Keep Rising At A Faster Rate
...But Housing Prices In First-Tier Cities Keep Rising At A Faster Rate
Industrial Profits: Rising Prices, Falling Production China’s industrial profit growth remained solid in July despite the waning low base effect. Manufacturing producer prices continued to rise, offsetting weaker production growth (Chart 19). In addition, a low interest-rate environment helped to lift profits in the manufacturing sector by reducing debt servicing costs. While we expect weakening domestic demand and peaking producer prices to weigh on corporate profits in the rest of this year, profit growth is rolling over from a lofty height and will not likely drop sharply in the coming months (Chart 20). In addition, producer prices will likely remain at a historically high level in the next six months given robust global demand for raw materials and persistent global supply shortages. Chart 19Rising Prices And Low Interest Rates Helped To Offset Falling Industrial Production
Rising Prices And Low Interest Rates Helped To Offset Falling Industrial Production
Rising Prices And Low Interest Rates Helped To Offset Falling Industrial Production
Chart 20Peaking Producer Prices Will Weigh On Corporate Profits
Peaking Producer Prices Will Weigh On Corporate Profits
Peaking Producer Prices Will Weigh On Corporate Profits
Meanwhile, there is a large gap between the prices for producer goods and consumer goods, suggesting that manufacturers in mid-to-downstream industries have not been able to fully pass on rising input costs to domestic consumers (Chart 21). Profit growth continues to be disproportionally stronger in the upstream industrial producers than in the downstream industries, while the profit margin in the manufacturing sector remains much more muted (Chart 22). Chart 21Inflation Passthrough From Manufacturers To Domestic Consumers Remains Limited
Inflation Passthrough From Manufacturers To Domestic Consumers Remains Limited
Inflation Passthrough From Manufacturers To Domestic Consumers Remains Limited
Chart 22Profit Growth In Upstream Industries Still Outpaces Manufacturing Sector
Profit Growth In Upstream Industries Still Outpaces Manufacturing Sector
Profit Growth In Upstream Industries Still Outpaces Manufacturing Sector
Table 1
Chinese Small And Medium Caps Are Finding Their Shining Moment
Chinese Small And Medium Caps Are Finding Their Shining Moment
Table 2
Chinese Small And Medium Caps Are Finding Their Shining Moment
Chinese Small And Medium Caps Are Finding Their Shining Moment
Footnotes Market/Sector Recommendations Cyclical Investment Stance
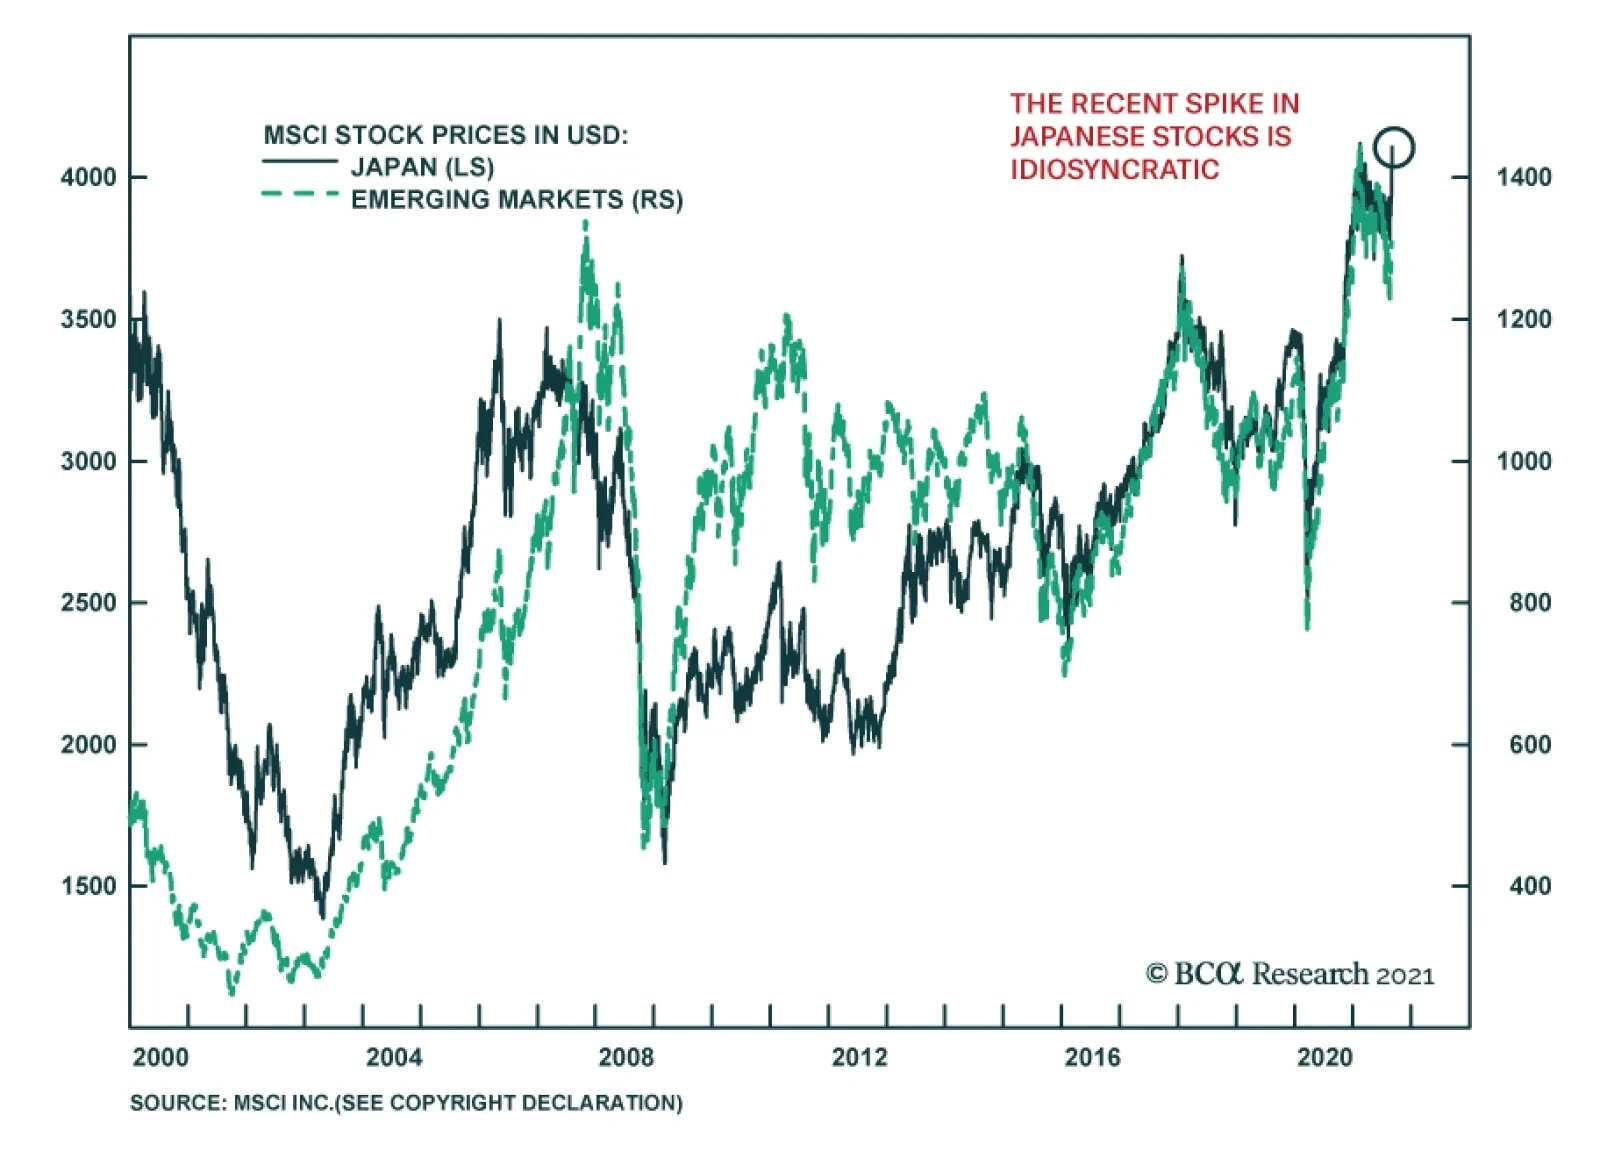
Japanese stocks have been enjoying a sharp rally in recent days with the MSCI Japan index up 6% in USD terms in just under a week and a half. The Japanese bourse is dominated by highly cyclical sectors with industrials, consumer discretionary, IT, financials,…
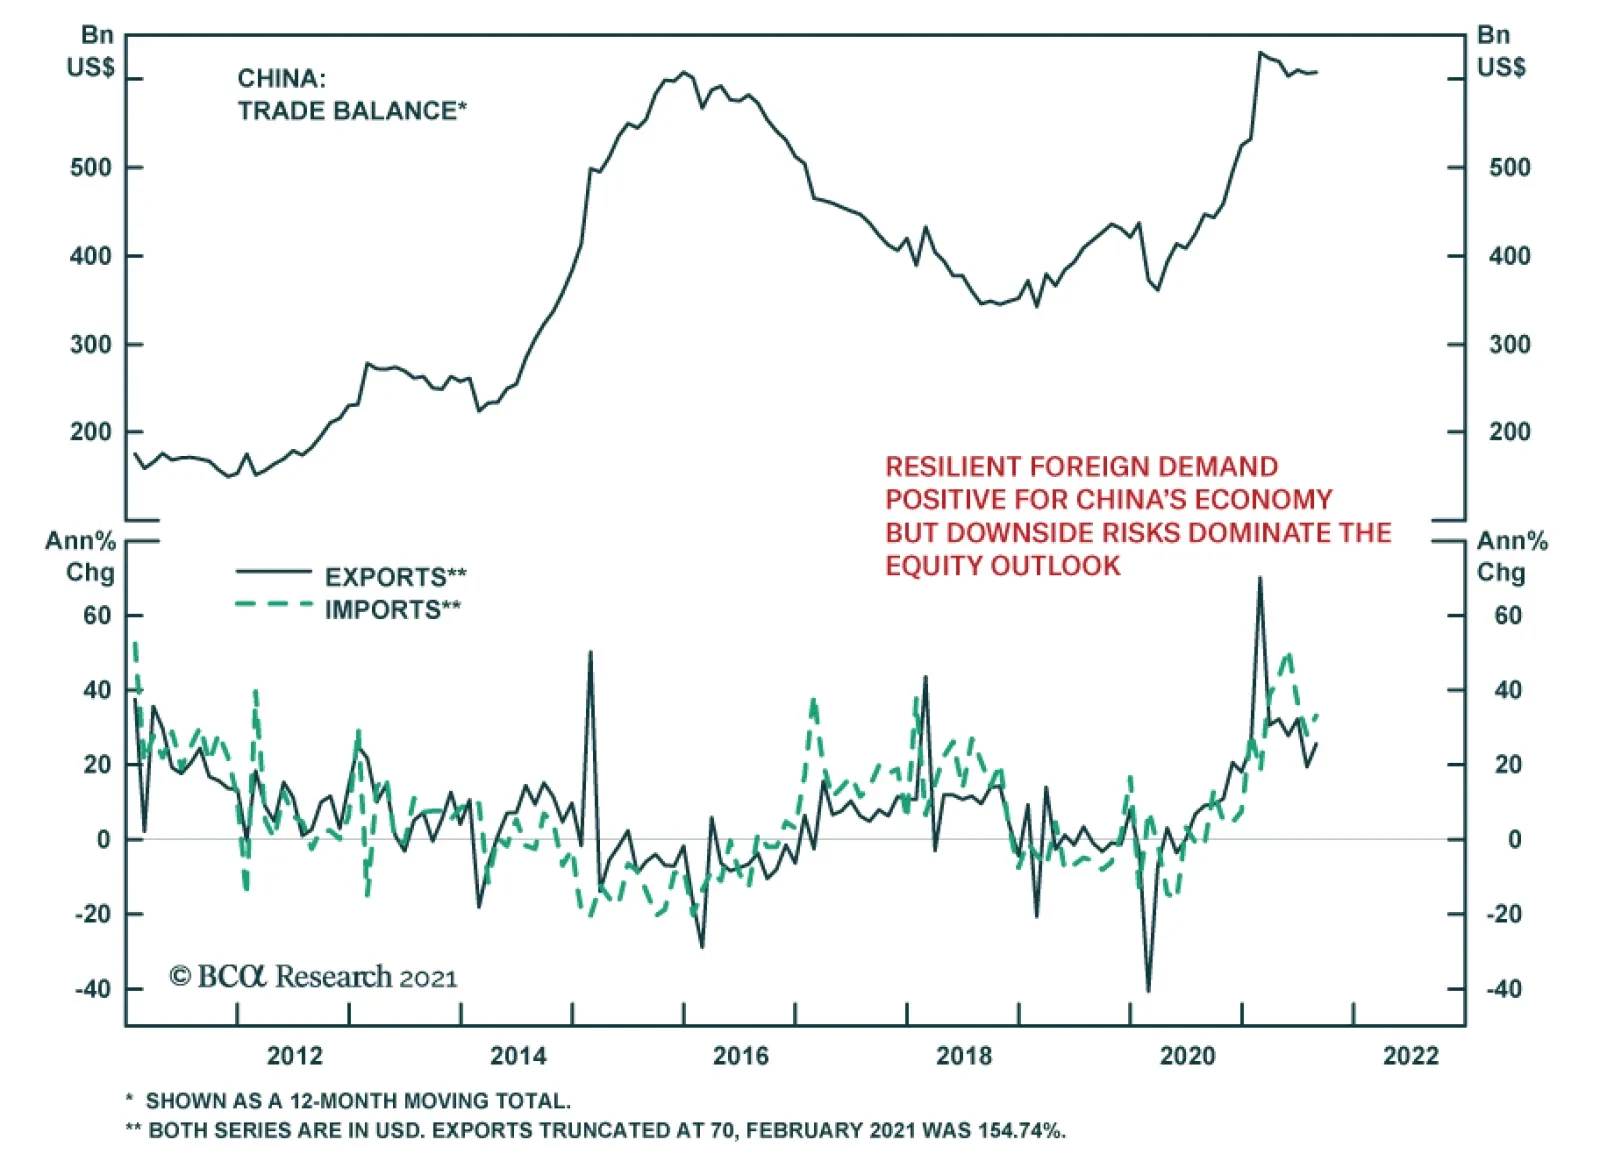
China's trade balance widened unexpectedly in August, rising to USD 58.3 billion from July's USD 56.6 billion. Both exports and imports surprised to the upside and reached all-time highs. Exports accelerated to 25.6% y/y versus an anticipated slowdown to…
Highlights An Iran crisis is imminent. We still think a US-Iran détente is possible but our conviction is lower until Biden makes a successful show of force. Oil prices will be volatile. Fiscal drag is a risk to the cyclical global macro view. But developed markets are more fiscally proactive than they were after the global financial crisis. Elections will reinforce that, starting in Germany, Canada, and Japan. The Chinese and Russian spheres are still brimming with political and geopolitical risk. But China will ease monetary and fiscal policy on the margin over the coming 12 months. Afghanistan will not upset our outlook on the German and French elections, which is positive for the euro and European stocks. Feature Chart 1Bull Market In Iran Tensions
Biden's Show Of Force (GeoRisk Update)
Biden's Show Of Force (GeoRisk Update)
Iran is now the most pressing geopolitical risk in the short term (Chart 1). The Biden administration has been chastened by the messy withdrawal from Afghanistan and will be exceedingly reactive if it is provoked by foreign powers. Nuclear weapons improve regime survivability. Survival is what the Islamic Republic wants. Iran is surrounded by enemies in its region and under constant pressure from the United States. Hence Iran will never ultimately give up its nuclear program, as we have maintained. Chart 2Biden Unlikely To Lift Iran Sanctions Unilaterally
Biden's Show Of Force (GeoRisk Update)
Biden's Show Of Force (GeoRisk Update)
However, Supreme Leader Ali Khamenei could still agree to a deal in which the US reduces economic sanctions while Iran allows some restrictions on uranium enrichment for a limited period of time (the 2015 nuclear deal’s key provisions expire from 2023 through 2030). This would be a stopgap measure to delay the march into war. The problem is that rejoining the 2015 deal requires the US to ease sanctions first, since the US walked away from the deal in 2018. Iran would need domestic political cover to rejoin it. Biden has the executive authority to ease sanctions unilaterally but after Afghanistan he lacks the political capital to do so (Chart 2). So Biden cannot ease sanctions until Iran pares back its nuclear activities. But Iran has no reason to pare back if the US does not ease sanctions. Iran is now enriching some uranium to a purity of 60%. Israeli Defense Minister Benny Gantz says it will reach “nuclear breakout” capability – enough fissile material to build a bomb – within 10 weeks, i.e. mid-October. Anonymous officials from the Biden administration told the Associated Press it will be “months or less,” which could mean September, October, or November (Table 1). Table 1Iran Nearing "Breakout" Nuclear Capability
Biden's Show Of Force (GeoRisk Update)
Biden's Show Of Force (GeoRisk Update)
Meanwhile the new Iranian government of President Ebrahim Raisi, a hardliner who is tipped to take over as Supreme Leader once Ali Khamenei steps down, is implying that it will not rejoin negotiations until November. All of these timelines are blurry but the implication is that Iran will not resume talks until it has achieved nuclear breakout. Israel will continue its campaign of sabotage against the regime. It may be pressed to the point of launching air strikes, as it did against nuclear facilities in Iraq in 1981 and Syria in 2007 under what is known as the “Begin Doctrine.” Chart 3Israel Cannot Risk Losing US Security Guarantee
Biden's Show Of Force (GeoRisk Update)
Biden's Show Of Force (GeoRisk Update)
The constraint on Israel is that it cannot afford to lose America’s public support and defense alliance since it would find itself isolated and vulnerable in its region (Chart 3). But if Israeli intelligence concludes that the Iranians truly stand on the verge of achieving a deliverable nuclear weapon, the country will likely be driven to launch air strikes. Once the Iranians test and display a viable nuclear deterrent it will be too late. Four US presidents, including Biden, have declared that Iran will not be allowed to get nuclear weapons. Biden and the Democrats favor diplomacy, as Biden made clear in his bilateral summit with Israeli Prime Minister Naftali Bennett last week. But Biden also admitted that if diplomacy fails there are “other options.” The Israelis currently have a weak government but it is unified against a nuclear-armed Iran. At very least Bennett will underscore red lines to indicate that Israel’s vigilance has not declined despite hawkish Benjamin Netanyahu’s fall from power. Still, Iran may decide it has an historic opportunity to make a dash for the bomb if it thinks that the US will fail to support an Israeli attack. The US has lost leverage in negotiations since 2015. It no longer has troops stationed on Iran’s east and west flanks. It no longer has the same degree of Chinese and Russian cooperation. It is even more internally divided. Iran has no guarantee that the US will not undergo another paroxysm of nationalism in 2024 and try to attack it. The faction that opposed the deal all along is now in power and may believe it has the best chance in its lifetime to achieve nuclear breakout. The only reason a short-term deal is possible is because Khamenei may believe the Israelis will attack with full American support. He agreed to the 2015 deal. He also fears that the combination of economic sanctions and simmering social unrest will create a rift when he dies or passes the leadership to his successor. Iran has survived the Trump administration’s “maximum pressure” sanctions but it is still vulnerable (Chart 4). Chart 4Supreme Leader Focuses On Regime Survival
Supreme Leader Focuses On Regime Survival
Supreme Leader Focuses On Regime Survival
Moreover Biden is offering Khamenei a deal that does not require abandoning the nuclear program and does not prevent Iran from enhancing its missile capabilities. By taking the deal he might prevent his enemies from unifying, forestall immediate war, and pave the way for a smooth succession, while still pursuing the ultimate goal of nuclear weaponization. Bringing it all together, the world today stands at a critical juncture with regard to Iran and the unfinished business of the US wars in the Middle East. Unless the US and Israel stage a unified and convincing show of force, whether preemptively or in response to Iranian provocations, the Iranians will be justified in concluding that they have a once-in-a-generation opportunity to pursue the bomb. They could sneak past the global powers and obtain a nuclear deterrent and regime security, like North Korea did. This could easily precipitate a war. Biden will probably continue to be reactive rather than proactive. If the Iranians are silent then it will be clear that Khamenei still sees the value in a short-term deal. But if they continue their march toward nuclear breakout, as is the case as we go to press, then Biden will have to make a massive show of force. The goal would be to underscore the US’s red lines and drive Iran back to negotiating table. If Biden blinks, he will incentivize Iran to make a dash for the bomb. Either way a crisis is imminent. Israel will continue to use sabotage and underscore red lines while the Iranians will continue to escalate their attacks on Israel via militant proxies and attacks on tankers (Map 1). Map 1Secret War Escalates In Middle East
Biden's Show Of Force (GeoRisk Update)
Biden's Show Of Force (GeoRisk Update)
Bottom Line: After a crisis, either diplomacy will be restored, or the Middle East will be on a new war path. The war path points to a drastically different geopolitical backdrop for the global economy. If the US and Iran strike a short-term deal, Iranian oil will flow and the US will shift its strategic focus to pressuring China, which is negative for global growth and positive for the dollar. If the US and Iran start down the war path, oil supply disruptions will rise and the dollar will fall. Implications For Oil Prices And OPEC 2.0 The probability of a near-term conflict is clear from our decision tree, which remains the same as in June 2019 (Diagram 1). Diagram 1US-Iran Conflict: Critical Juncture In Our Decision Tree
Biden's Show Of Force (GeoRisk Update)
Biden's Show Of Force (GeoRisk Update)
Shows of force and an escalation in the secret war will cause temporary but possibly sharp spikes in oil prices in the short term. OPEC 2.0 remains intact so far this year, as expected. The likelihood that the global economic recovery will continue should encourage the Saudis, Russians, Emiratis and others to maintain production discipline to drain inventories and keep Brent crude prices above $60 per barrel. OPEC 2.0 is a weak link in oil prices, however, because Russians are less oil-dependent than the Gulf Arab states and do not need as high of oil prices for their government budget to break even (Chart 5). Periodically this dynamic leads the cartel to break down. None of the petro-states want to push oil prices up so high that they hasten the global green energy transition. Chart 5OPEC 2.0 Keeps Price Within Fiscal Breakeven Oil Price
Biden's Show Of Force (GeoRisk Update)
Biden's Show Of Force (GeoRisk Update)
Chart 6Oil Price Risks Lie To Upside Until US-Iran Deal Occurs
Oil Price Risks Lie To Upside Until US-Iran Deal Occurs
Oil Price Risks Lie To Upside Until US-Iran Deal Occurs
As long as OPEC 2.0 remains disciplined, average Brent crude oil prices will gradually rise to $80 barrels per day by the end of 2024, according to our Commodity & Energy Strategy (Chart 6). Imminent firefights will cause prices to spike at least temporarily when large amounts of capacity are taken offline. Global spare capacity is probably sufficient to handle one-off disruptions but an open-ended military conflict in the Persian Gulf or Strait of Hormuz would be a different story. After the next crisis, everything depends on whether the US and Israel establish a credible threat and thus restore diplomacy. Any US-Iran strategic détente would unleash Iranian production and could well motivate the Gulf Arabs to pump more oil and deny Iran market share. Bottom Line: Given that any US-Iran deal would also be short-term in nature, and may not even stabilize the region, some of the downside risks are fading at the moment. The US and China are also sucking in more commodities as they gear up for great power struggle. The geopolitical outlook is positive for oil prices in these respects. But OPEC 2.0 is the weak link in this expectation so we expect volatility. Global Fiscal Taps Will Stay Open Markets have wavered in recent months over softness in the global economic recovery, COVID-19 variants, and China’s policy tightening. The world faces a substantial fiscal drag in the coming years as government budgets correct from the giant deficits witnessed during the crisis. Nevertheless policymakers are still able to deliver some positive fiscal surprises on the margin. Developed markets have turned fiscally proactive over the past decade. They rejected austerity because it was seen as fueling populist political outcomes that threatened the established parties. Note that this change began with conservative governments (e.g. Japan, UK, US, Germany), implying that left-leaning governments will open the fiscal taps further whenever they come to power (e.g. Canada, the US, Italy, and likely Germany next). Chart 7Global Fiscal Taps Will Stay Open
Biden's Show Of Force (GeoRisk Update)
Biden's Show Of Force (GeoRisk Update)
Chart 7 updates the pandemic-era fiscal stimulus of major economies, with light-shaded bars highlighting new fiscal measures that are in development but have not yet been included in the IMF’s data set. The US remains at the top followed by Italy, which also saw populist electoral outcomes over the past decade. Chart 8US Fiscal Taps Open At Least Until 2023
US Fiscal Taps Open At Least Until 2023
US Fiscal Taps Open At Least Until 2023
The Biden administration is on the verge of passing a $550 billion bipartisan infrastructure bill. We maintain 80% subjective odds of passage – despite the messy pullout from Afghanistan. Assuming it passes, Democrats will proceed to their $3.5 trillion social welfare bill. This bill will inevitably be watered down – we expect a net deficit impact of around $1-$1.5 trillion for both bills – but it can pass via the partisan “budget reconciliation” process. We give 50% subjective odds today but will upgrade to 65% after infrastructure passes. The need to suspend the debt ceiling will raise volatility this fall but ultimately neither party has an interest in a national debt default. The US is expanding social spending even as geopolitical challenges prevent it from cutting defense spending, which might otherwise be expected after Afghanistan and Iraq. The US budget balance will contract after the crisis but then it will remain elevated, having taken a permanent step up as a result of populism. The impact should be a flat or falling dollar on a cyclical basis, even though we think geopolitical conflict will sustain the dollar as the leading reserve currency over the long run (Chart 8). So the dollar view remains neutral for now. Bottom Line: The US is facing a 5.9% contraction in the budget deficit in 2022 but the blow will be cushioned somewhat by two large spending bills, which will put budget deficits on a rising trajectory over the course of the decade. Big government is back. Developed Market Fiscal Moves (Outside The US) Chart 9German Opinion Favors New Left-Wing Coalition
Biden's Show Of Force (GeoRisk Update)
Biden's Show Of Force (GeoRisk Update)
Fiscal drag is also a risk for other developed markets – but here too a substantial shift away from prudence has taken place, which is likely to be signaled to investors by the outperformance of left-wing parties in Germany’s upcoming election. Germany is only scheduled to add EUR 2.4 billion to the 25.6 billion it will receive under the EU’s pandemic recovery fund, but Berlin is likely to bring positive fiscal surprises due to the federal election on September 26. Germany will likely see a left-wing coalition replace Chancellor Angela Merkel and her long-ruling Christian Democrats (Chart 9). The platforms of the different parties can be viewed in Table 2. Our GeoRisk Indicator for Germany confirms that political risk is elevated but in this case the risk brings upside to risk assets (Appendix). Table 2German Party Platforms
Biden's Show Of Force (GeoRisk Update)
Biden's Show Of Force (GeoRisk Update)
While we expected the Greens to perform better than they are in current polling, the point is the high probability of a shift to a new left-wing government. The Social Democrats are reviving under the leadership of Olaf Scholz (Chart 10). Tellingly, Scholz led the charge for Germany to loosen its fiscal belt back in 2019, prior to the global pandemic. Chart 10Germany: Online Markets Betting On Scholz
Biden's Show Of Force (GeoRisk Update)
Biden's Show Of Force (GeoRisk Update)
Chart 11Canada: Trudeau Takes A Calculated Risk
Biden's Show Of Force (GeoRisk Update)
Biden's Show Of Force (GeoRisk Update)
In June, the cabinet approved a draft 2022 budget plan supported by Scholz that would contain new borrowing worth EUR 99.7 bn ($119 billion). This amount is not included in the chart above but it should be seen as the minimum to be passed under the new government. If a left-wing coalition is formed, as we expect, the amount will be larger, given that both the Social Democrats and the Greens have been restrained by Merkel’s party. Canada turned fiscally proactive in 2015, when the institutional ruling party, the Liberals, outflanked the more progressive New Democrats by calling for budget deficits instead of a balanced budget. The Liberals saw a drop in support in 2019 but are now calling a snap election. Prime Minister Trudeau is not as popular in general opinion as he is in the news media but his party still leads the polls (Chart 11). The Conservatives are geographically isolated and, more importantly, are out of step with the median voter on the key issues (Table 3). Table 3Canada: Liberal Agenda Lines Up With Top Voter Priorities
Biden's Show Of Force (GeoRisk Update)
Biden's Show Of Force (GeoRisk Update)
Nevertheless it is a risky time to call an election – our GeoRisk Indicator for Canada is soaring (Appendix). Granting that the Liberals are very unlikely to fall from power, whatever their strength in parliament, the key point is that parliament already approved of CAD 100 billion in new spending over the coming three years. Any upside surprise would give Trudeau the ability to push for still more deficit spending, likely focused on climate change. Chart 12Japan: Suga Will Go, LDP Will Stimulate
Japan: Suga Will Go, LDP Will Stimulate
Japan: Suga Will Go, LDP Will Stimulate
Japanese politics are heating up ahead of the Liberal Democrats’ leadership election on September 29 and the general election, due by November 28. Prime Minister Yoshihide Suga’s sole purpose in life was to stand in for Shinzo Abe in overseeing the Tokyo Olympics. Now they are done and Suga will likely be axed – if he somehow survives the election, he will not last long after, as his approval rating is in freefall. The Liberal Democrats are still the only game in town. They will try to minimize the downside risks they face in the general election by passing a new stimulus package (Chart 12). Rumor has it that the new package will nominally be worth JPY 10-15 trillion, though we expect the party to go bigger, and LDP heavyweight Toshihiro Nikai has proposed a 30 trillion headline number. It is extremely unlikely that the election will cause a hung parliament or any political shift that jeopardizes passage of the bill. Abenomics remains the policy setting – and consumption tax hikes are no longer on the horizon to impede the second arrow of Abenomics: fiscal policy. Not all countries are projecting new spending. A stronger-than-expected showing by the Christian Democrats would result in gridlock in Germany. Meanwhile the UK may signal belt-tightening in October. Bottom Line: Germany, Canada, and Japan are likely to take some of the edge off of expected fiscal drag next year. Emerging Market Fiscal Moves (And China Regulatory Update) Among the emerging markets, Russia and China are notable in Chart 7 above for having such a small fiscal stimulus during this crisis. Russia has announced some fiscal measures ahead of the September 19 Duma election but they are small: $5.2 billion in social spending, $10 billion in strategic goals over three years, and a possible $6.8 billion increase in payments to pensioners. Fiscal austerity in Russia is one reason we expect domestic political risk to remain elevated and hence for President Putin to stoke conflicts in his near abroad (see our Russian risk indicator in the Appendix). There are plenty of signs that Belarussian tensions with the Baltic states and Poland can escalate in the near term, as can fighting in Ukraine in the wake of Biden’s new defense agreement and second package of military aid. China’s actual stimulus was much larger than shown in Chart 7 above because it mostly consisted of a surge in state-controlled bank lending. China is likely to ease monetary and fiscal policy on the margin over the coming 12 months to secure the recovery in time for the national party congress in 2022. But China’s regulatory crackdown will continue during that time and our GeoRisk Indicator clearly shows the uptick in risk this year (Appendix). Chart 13China Expands Unionization?
China Expands Unionization?
China Expands Unionization?
The regulatory crackdown is part of a cyclical consolidation of Xi Jinping’s power as well as a broader, secular trend of reasserting Communist Party and centralization in China. The latest developments underscore our view that investors should not play any technical rebound in Chinese equities. The increase in censorship of financial media is especially troubling. Just as the government struggles to deal with systemic financial problems (e.g. the failing property giant Evergrande, a possible “Lehman moment”), the lack of transparency and information asymmetry will get worse. The media is focusing on the government’s interventions into public morality, setting a “correct beauty standard” for entertainers and limiting kids to three hours of video games per week. But for investors what matters is that the regulatory crackdown is proceeding to the medical sector. High health costs (like high housing and education costs) are another target of the Xi administration in trying to increase popular support and legitimacy. Central government-mandated unionization in tech companies will hurt the tech sector without promoting social stability. Chinese unions do not operate like those in the West and are unlikely ever to do so. If they did, it would compound the preexisting structural problem of rising wages (Chart 13). Wages are forcing an economic transition onto Beijing, which raises systemic risks permanently across all sectors. Bottom Line: Political and geopolitical risk are still elevated in China and Russia. China will ease monetary and fiscal policy gradually over the coming year but the regulatory crackdown will persist at least until the 2022 political reshuffle. Afghanistan: The Refugee Fallout September 2021 will officially mark the beginning of Taliban’s second bout of power in Afghanistan. Will Afghanistan be the only country to spawn an outflux of refugees? Will the Taliban wresting power in Afghanistan trigger another refugee crisis for Europe? How is the rise of the Taliban likely to affect geopolitics in South Asia? Will Afghanistan Be The Last Major Country To Spawn Refugees? Absolutely not. We expect regime failures to affect the global economy over the next few years. The global growth engine functions asymmetrically and is powered only by a fistful of countries. As economic growth in poor countries fails to keep pace with that of top performers, institutional turmoil is bound to follow. This trend will only add to the growing problem of refugees that the world has seen in the post-WWII era. History suggests that the number of refugees in the world at any point in time is a function of economic prosperity (or the lack thereof) in poorer continents (Chart 14). For instance, the periods spanning 1980-90 and 2015-20 saw the world’s poorer continents lose their share in global GDP. Unsurprisingly these phases also saw a marked increase in the number of refugees. With the world’s poorer continents expected to lose share in global GDP again going forward, the number of refugees in the world will only rise. Chart 14Refugee Flows Rise When Growth Weak In Poor Continents
Biden's Show Of Force (GeoRisk Update)
Biden's Show Of Force (GeoRisk Update)
Citizens of Syria, Venezuela, Afghanistan, South Sudan, and Myanmar today account for two-thirds of all refugees globally. To start with, these five countries’ share in global GDP was low at 0.8% in the 1980s. Now their share in global GDP is set to fall to 0.2% over the next five years (Chart 15). Chart 15Refugee Exporters Hit All-Time Low In Global GDP Share
Biden's Show Of Force (GeoRisk Update)
Biden's Show Of Force (GeoRisk Update)
Per capita incomes in top refugee source countries tend to be very low. Whilst regime fractures appear to be the proximate cause of refugee outflux, an economic collapse is probably the root cause of the civil strife and waves of refugee movement seen out of the top refugee source countries. Another factor that could have a bearing is the rise of multipolarity. Shifting power structures in the global economy affect the stability of regimes with weak institutions. Instability in Afghanistan has been a direct result of the rise and the fall of the British and Russian empires. American imperial overreach is just the latest episode. If another Middle Eastern war erupts, the implications are obvious. But so too are the implications of US-China proxy wars in Southeast Asia or Russia-West proxy wars in eastern Europe. Bottom Line: With poorer continents’ economic prospects likely to remain weak and with multipolarity here to stay, the world’s refugee problem is here to stay too. Is A Repeat Of 2015 Refugee Crisis Likely In 2021? No. 2021 will not be a replica of 2015. This is owing to two key reasons. First, Afghanistan has long witnessed a steady outflow of refugees – especially at the end of the twentieth century but also throughout the US’s 20-year war there. The magnitude of the refugee problem in 2021 will be significantly smaller than that in 2015. Secondly, voters are now differentiating between immigrants and refugees with the latter entity gaining greater acceptance (Chart 16). Chart 16DM Attitudes Permissive Toward Refugees
Biden's Show Of Force (GeoRisk Update)
Biden's Show Of Force (GeoRisk Update)
Chart 17Refugees Will Not Change Game In German/French Elections
Biden's Show Of Force (GeoRisk Update)
Biden's Show Of Force (GeoRisk Update)
Concerns about refugees will gain some political traction but it will reinforce rather than upset the current trajectory in the most important upcoming elections, in Germany in September and France next April. True, these countries feature in the list of top countries to which Afghan refugees flee and will see some political backlash (Chart 17). But the outcome may be counterintuitive. In the German election, any boost to the far-right will underscore the likely underperformance of the ruling Christian Democrats. So the German elections will produce a left-wing surprise – and yet, even if the Greens won the chancellorship (the true surprise scenario, looking much less likely now), investors will cheer the pro-Europe and pro-fiscal result. The French election is overcrowded with right-wing candidates, both center-right and far-right, giving President Macron the ability to pivot to the left to reinforce his incumbent advantage next spring. Again, the euro and the equity market will rise on the status quo despite the political risk shown in our indicator (Appendix). Of course, immigration and refugees will cause shocks to European politics in future, especially as more regime failures in the third world take place to add to Afghanistan and Ethiopia. But in the short run they are likely to reinforce the fact that European politics are an oasis of stability given what is happening in the US, China, Brazil, and even Russia and India. Bottom Line: 2021 will not see a repeat of the 2015 refugee crisis. Ironically Afghan refugees could reinforce European integration in both German and French elections. The magnitude of the Afghan crisis is smaller than in the past and most Afghan refugees are likely to migrate to Pakistan and Iran (Chart 17). But more regime failures will ensure that the flow of people becomes a political risk again sometime in the future. What Does The Rise Of Taliban Mean For India? The Taliban first held power in Afghanistan from 1996-2001. This was one of the most fraught geopolitical periods in South Asia since the 1970s. Now optimists argue that Taliban 2.0 is different. Taliban leaders are engaging in discussions with an ex-president who was backed by America and making positive overtures towards India. So, will this time be different? It is worth noting that Taliban 2.0 will have to function within two major constraints. First, Afghanistan is deeply divided and diverse. Afghanistan’s national anthem refers to fourteen ethnic groups. Running a stable government is inherently challenging in this mountainous country. With Taliban being dominated by one ethnic group and with limited financial resources at hand, the Taliban will continue to use brute force to keep competing political groups at bay. Chart 18Taliban In Line With Afghanis On Sharia
Biden's Show Of Force (GeoRisk Update)
Biden's Show Of Force (GeoRisk Update)
At the same time, to maintain legitimacy and power, the Taliban will have to support aligned political groups operating in Afghanistan and neighboring Pakistan. Second, an overwhelming majority of Afghani citizens want Sharia law, i.e. a legal code based on Islamic scripture as the official law of the land (Chart 18). Hence if the Taliban enforces a Sharia-based legal system in Afghanistan then it will fall in line with what the broader population demands. It is against this backdrop that Taliban 2.0 is bound to have several similarities with the version that ruled from 1996-2001. Additionally, US withdrawal from Afghanistan will revive a range of latent terrorist movements in the region. This poses risks for outside countries, not least India, which has a long history of being targeted by Afghani terrorist groups. The US will remain engaged in counter-terrorism operations. To complicate matters, India’s North has an even more unfavorable view of Pakistan than the rest of India. With the northern voter’s importance rising, India’s administration may be forced to respond more aggressively to a terrorist event than would have been the case about a decade ago. It is also possible that terrorism will strike at China over time given its treatment of Uighur Muslims in Xinjiang. China’s economic footprint in Afghanistan could precipitate such a shift. Bottom Line: US withdrawal from Afghanistan is bound to add to geopolitical risks as latent terrorist forces will be activated. India has a long history of being targeted by Afghani terrorist movements. Incidentally, it will take time for transnational terrorism based in Afghanistan to mount successful attacks at the West once again, given that western intelligence services are more aware of the problem than they were in 2000. But non-state actors may regain the element of surprise over time, given that the western powers are increasingly focused on state-to-state struggle in a new era of great power competition. Matt Gertken Vice President Geopolitical Strategy mattg@bcaresearch.com Ritika Mankar, CFA Editor/Strategist ritika.mankar@bcaresearch.com Section II: GeoRisk Indicator China
China: GeoRisk Indicator
China: GeoRisk Indicator
Russia
Russia: GeoRisk Indicator
Russia: GeoRisk Indicator
United Kingdom
UK: GeoRisk Indicator
UK: GeoRisk Indicator
Germany
Germany: GeoRisk Indicator
Germany: GeoRisk Indicator
France
France: GeoRisk Indicator
France: GeoRisk Indicator
Italy
Italy: GeoRisk Indicator
Italy: GeoRisk Indicator
Canada
Canada: GeoRisk Indicator
Canada: GeoRisk Indicator
Spain
Spain: GeoRisk Indicator
Spain: GeoRisk Indicator
Taiwan
Taiwan: GeoRisk Indicator
Taiwan: GeoRisk Indicator
Korea
Korea: GeoRisk Indicator
Korea: GeoRisk Indicator
Turkey
Turkey: GeoRisk Indicator
Turkey: GeoRisk Indicator
Brazil
Brazil: GeoRisk Indicator
Brazil: GeoRisk Indicator
Australia
Australia: GeoRisk Indicator
Australia: GeoRisk Indicator
Section III: Geopolitical Calendar