Emerging Markets
According to BCA Research's Emerging Markets Strategy service, any near-term bounce in Chinese platform companies from oversold levels is likely to be short-lived. The Chinese government's approach toward platform companies is a structural regime shift.…

Highlights The US government issued its first-ever water-shortage declaration for the Colorado River basin in August, due to historically low water levels at the major reservoirs fed by the river (Chart of the Week). The drought producing the water shortage was connected to climate change by US officials.1 Globally, climate-change remediation efforts – e.g., carbon taxes – likely will create exogenous shocks similar to the oil-price shock of the 1970s. Remedial efforts will compete with redressing chronic underfunding of infrastructure. The US water supply infrastructure, for example, faces an investment shortfall of ~ $3.3 trillion over the next 20 years to replace aging plants and equipment, based on an analysis by the American Society of Civil Engineers (ASCE). This will translate to a $6,000 per-capita cost by 2039 if the current funding gap persists. Fluctuating weather and the increasing prevalence of droughts and floods will increase volatility in markets such as agriculture which rely on stable climate and precipitation patterns.We are getting long the FIW ETF at tonight's close. The ETF tracks the performance of equities in the ISE Clean Edge Water Index, which covers firms providing potable water and wastewater treatment technologies and services. This is a strategic recommendation. Feature A decades-long drought in the US Southwest linked by US officials to climate change will result in further water rationing in the region. The drought has reduced total Colorado River system water-storage levels to 40% of capacity – vs. 49% at the same time last year. It has drawn attention to the impact of climate change on daily life, and the acute need for remediation efforts. The US Southwest is a desert. Droughts and low water availability are facts of life in the region. The current drought began in 2012, and is forcing federal, state, and local governments to take unprecedented conservation measures. The first-ever water-shortage declaration by the US Bureau of Reclamation sets in motion remedial measures that will reduce water availability in the Lower Colorado basin starting in October (Map 1). Chart 1Drought Hits Colorado River Especially Hard
Drought Hits Colorado River Especially Hard
Drought Hits Colorado River Especially Hard
Map 1Colorado River Basin
Investing In Water Supply
Investing In Water Supply
The two largest reservoirs in the US – Lake Powell and Lake Meade, part of the massive engineering projects along the Colorado – began in the 1930s and now supply water to 40mm people in the US Southwest. Half of those people get their water from Lake Powell. Emergency rationing began in August, primarily affecting Arizona, but will be extended to the region later in the year. Lake Powell is used to hold run-off from the upper basin of the Colorado River from Colorado, New Mexico, Utah and Wyoming. Water from Powell is sent south to supply the lower-basin states of California, Arizona, and Nevada. Reduced snowpack due to weather shifts caused by climate change has reduced water levels in Powell, while falling soil-moisture levels and higher evaporation rates, contribute to the acceleration of droughts and their persistence down-river. Chart 2Southwests Exceptionally Hard Drought
Southwests Exceptionally Hard Drought
Southwests Exceptionally Hard Drought
Steadily increasing demand for water from agriculture, energy production and human activity brought on by population growth and holiday-makers have made the current drought exceptional (Chart 2). Most of the Southwest has been "abnormally dry or even drier" during 2002-05 and from 2012-20, according to the US EPA. According to data from the National Oceanic and Atmospheric Administration, most of the US Southwest was also warmer than the 1981 – 2010 average temperature during July (Map 2). The Colorado River Compact of 1922 governing the water-sharing rights of the river expires in 2026. Negotiations on the new treaties already have begun, as the seven states in the Colorado basin sort out their rights alongside huge agricultural interest, native American tribes, Mexico, and fast-growing urban centers like Las Vegas. Map 2Most Of The US Southwest Is Warmer Than Average
Investing In Water Supply
Investing In Water Supply
Global Water Emergency States around the globe are dealing with water crises as a result of climate change. "From Yemen to India, and parts of Central America to the African Sahel, about a quarter of the world's people face extreme water shortages that are fueling conflict, social unrest and migration," according to the World Economic Forum. Droughts, and more generally, changing weather patterns will make agricultural markets more volatile. Food production shortages due to unpredictable weather are compounding lingering pandemic related supply chain disruptions, leading to higher food prices (Chart 3). This could also fuel social unrest and political uncertainty. Floods in China’s Henan province - a key agriculture and pork region - inundated farms. Drought and extreme heat in North America are destroying crops in parts of Canada and the US. While flooding in July damaged Europe’s crops, the continent’s main medium-term risk, will be water scarcity.2 Droughts and extreme weather in Brazil have deep implications for agricultural markets, given the variety and quantity of products it exports. Water scarcity and an unusual succession of polar air masses caused coffee prices to rise earlier this year (Chart 4). The country is suffering from what national government agencies consider the worst drought in nearly a century. According to data from the NASA Earth Observatory, many of the agricultural states in Brazil saw more water evaporate from the ground and plants’ leaves than during normal conditions (Map 3). Chart 3The Pandemic and Changing Weather Patterns Will Keep Food Prices High
The Pandemic and Changing Weather Patterns Will Keep Food Prices High
The Pandemic and Changing Weather Patterns Will Keep Food Prices High
Chart 4Unpredictable Weather Will Increase Volatility In Markets For Agricultural Commodities
Unpredictable Weather Will Increase Volatility In Markets For Agricultural Commodities
Unpredictable Weather Will Increase Volatility In Markets For Agricultural Commodities
Map 3Brazil Is Suffering From Its Worst Drought In Nearly A Century
Investing In Water Supply
Investing In Water Supply
Agriculture itself could be part of a longer-term and irreversible problem – i.e. desertification. Irrigation required for modern day farming drains aquifers and leads to soil erosion. According to the EU, nearly a quarter of Spain’s aquifers are exploited, with agricultural states, such as Andalusia consuming 80% of the state’s total water. Irrigation intensive farming, the possibility of higher global temperatures and the increased prevalence of droughts and forest fires are conducive to soil infertility and subsequent desertification. This is a global phenomenon, with the crisis graver still in north Africa, Mozambique and Palestinian regions. Changing weather patterns could also impact the production of non-agricultural goods and services. One such instance is semiconductors, which are used in machines and devices spanning cars to mobile phones. Taiwan, home to the Taiwan Semiconductor Manufacturing Company – the world’s largest contract chipmaker - suffered from a severe drought earlier this year (Chart 5). While the drought did not seriously disrupt chipmaking, in an already tight market, the event did bring the issue of the impact of water shortages on semiconductor manufacturing to the fore. According to Sustainalytics, a typical chipmaking plant uses 2 to 4 million gallons of water per day to clean semiconductors. While wet weather has returned to Taiwan, relying on rainfall and typhoons to satisfy the chipmaking sector’s water needs going forward could lead to volatility in these markets. Chart 5Taiwan Faced Its Worst Drought In History Earlier This Year
Investing In Water Supply
Investing In Water Supply
Climate Change As A Macro Factor The scale of remediating existing environmental damage to the planet and the cost of investing in the technology required to sustain development and growth will be daunting. Unfortunately, there is not a great deal of research looking into how much of a cost households, firms and governments will incur on these fronts. Estimates of the actual price of CO2 – the policy variable most governments and policymakers focus on – range from as little as $1.30/ton to as much as $13/ton, according to the Peterson Institute for International Economics.3 PIIE's Jean Pisani-Ferry estimates the true cost is around $10/ton presently, after accounting for a lack of full reporting on costs and subsidies that reduce carbon costs. The cost of carbon likely will have to increase by an order of magnitude – to $130/ton or more over the next decade – to incentivize the necessary investment in technology required to deal with climate change and to sufficiently induce, via prices, behavioral adaptations by consumers at all levels. The PIIE notes, "… the accelerated pace of climate change and the magnitude of the effort involved in decarbonizing the economy, while at the same time investing in adaptation, the transition to net zero is likely to involve, over a 30-year period, major shifts in growth patterns." These are early days for assessing the costs and global macro effects of decarbonization. However, PIIE notes, these costs can be expected to "include a significant negative supply shock, an investment surge sizable enough to affect the global equilibrium interest rate, large adverse consumer welfare effects, distributional shifts, and substantial pressure on public finances." Much of the investment required to address climate change will be concentrated on commodity markets. Underlying structural issues, such as lack of investment in expanding supplies of metals and hydrocarbons required during the transition to net-zero CO2 emissions, will impart an upward bias to base metals, oil and natural gas prices over the next decade. We remain bullish industrial commodities broadly, as a result. Investment Implications Massive investment in infrastructure will be needed to address emerging water crises around the world. The American Society of Civil Engineers (ASCE) projects an investment shortfall of ~ $3.3 trillion over the next 20 years to replace aging water infrastructure in the US alone. This will translate to a $6,000 per-capita cost by 2039 if the current funding gap persists.4 At tonight's close we will be getting long the FIW ETF, which is focused on US-based firms providing potable water and wastewater treatment services. This ETF provides direct investment exposure to water remediation efforts and needed infrastructure modernization in the US. We also remain long commodity index exposure – the S&P GSCI and the COMT ETF – as a way to retain exposure to the higher commodity-price volatility that climate change will create in grain and food markets. This volatility will keep the balance of price risks to the upside. Robert P. Ryan Chief Commodity & Energy Strategist rryan@bcaresearch.com Ashwin Shyam Research Associate Commodity & Energy Strategy ashwin.shyam@bcaresearch.com Commodities Round-Up Energy: Bullish Hurricane Ida shut in ~ 96% of total US Gulf of Mexico (GoM) oil production. Colonial Pipeline, a major refined product artery for the US South and East coast closed a few of its lines due to the hurricane but has restarted operations since then. Since the share of US crude oil from this region has fallen, WTI and RBOB gasoline prices have only marginally increased, despite virtually zero crude oil production from the GoM (Chart 6). Prices are, however, likely to remain volatile, as energy producers in the region check for damage to infrastructure. Power outages and a pause in refining activity in the region will also feed price volatility over the coming weeks. Despite raising the 2022 demand forecast and pressure from the US, OPEC 2.0 stuck to its 400k b/d per month production hike in its meeting on Wednesday. Base Metals: Bullish A bill to increase the amount of royalties payable by copper miners in Chile was passed in the senate mining committee on Tuesday. As per the bill, taxes will be commensurate with the value of the red metal. If the bill is passed in its current format, it will disincentivize further private mining investments in the nation, warned Diego Hernandez, President of the National Society of Mining (SONAMI). Amid a prolonged drought in Chile during July, the government has outlined a plan for miners to cut water consumption from natural sources by 2050. Increased union bargaining power - due to higher copper prices -, a bill that will increase mining royalties, and environmental regulation, are putting pressure on miners in the world’s largest copper producing nation. Precious Metals: Bullish Jay Powell’s dovish remarks at the Jackson Hole Symposium were bullish for gold prices. The chairman of the US Central Bank stated the possibility of tapering asset purchases before the end of 2021 but did not provide a timeline. Powell reiterated the absence of a mechanical relationship between tapering and an interest rate hike. Raising interest rates is contingent on factors, such as the prevalence of COVID, inflation and employment levels in the US. The fact that the US economy is not close to reaching the maximum employment level, according to Powell, could keep interest rates lower for longer, supporting gold prices (Chart 7). Ags/Softs: Neutral The USDA crop Progress Report for the week ending August 29th reported 60% of the corn crop was good to excellent quality, marginally down by 2% vs comparable dates in 2020. Soybean crop quality on the other hand was down 11% from a year ago and was recorded at 56%. Chart 6
Investing In Water Supply
Investing In Water Supply
Chart 7
Weaker Real Rates Bullish For Gold
Weaker Real Rates Bullish For Gold
Footnotes 1 Please see Reclamation announces 2022 operating conditions for Lake Powell and Lake Mead; Historic Drought Impacting Entire Colorado River Basin. Released by the US Bureau of Reclamation on August 16, 2021. 2 Please refer to Water stress is the main medium-term climate risk for Europe’s biggest economies, S&P Global, published on August 13, 2021. 3 Please see 21-20 Climate Policy is Macroeconomic Policy, and the Implications Will Be Significant by Jean Pisani-Ferry, which was published in August 2021. 4 Please see The Economic Benefits of Investing in Water Infrastructure, published by the ASCE and The Value of Water Campaign on August 26, 2020. Investment Views and Themes Recommendations Strategic Recommendations Commodity Prices and Plays Reference Table Trades Closed in 2021 Summary of Closed Trades
Highlights Regulatory changes affecting Chinese platform companies are structural – rather than transitory – in nature. These companies might become quasi-SOEs and could be used by the government to achieve its national and geopolitical objectives. China’s regulatory clampdown will produce structurally lower corporate profitability and, thereby, reduce equity valuations for Chinese TMT companies. Chinese policymakers have begun easing monetary and fiscal policies. Money and credit growth will likely bottom in December or so. However, as in H2 2018 and H1 2019, policy will be eased only gradually. During this period EM ex-TMT stocks and industrial metal prices performed poorly. Mainstream EM (countries outside North Asia) will continue suffering from weak growth and rising political volatility, warranting a higher risk premium. The risk-reward tradeoff for EM financial markets is poor. Feature Over the past several days, I have held calls and roundtables with clients located in the EMEA region. In this report, we will share our answers to the most common client questions. Many clients were asking if the selloff in Chinese platform companies is nearing its end or whether much more weakness is to be expected. It is not surprising that with the Hang Seng Tech index down 35% from its February highs, there is great temptation to engage in bottom fishing. So, we start with questions relating to this topic. Chart 1Is This Time Different For Chinese TMT Stocks?
Is This Time Different For Chinese TMT Stocks?
Is This Time Different For Chinese TMT Stocks?
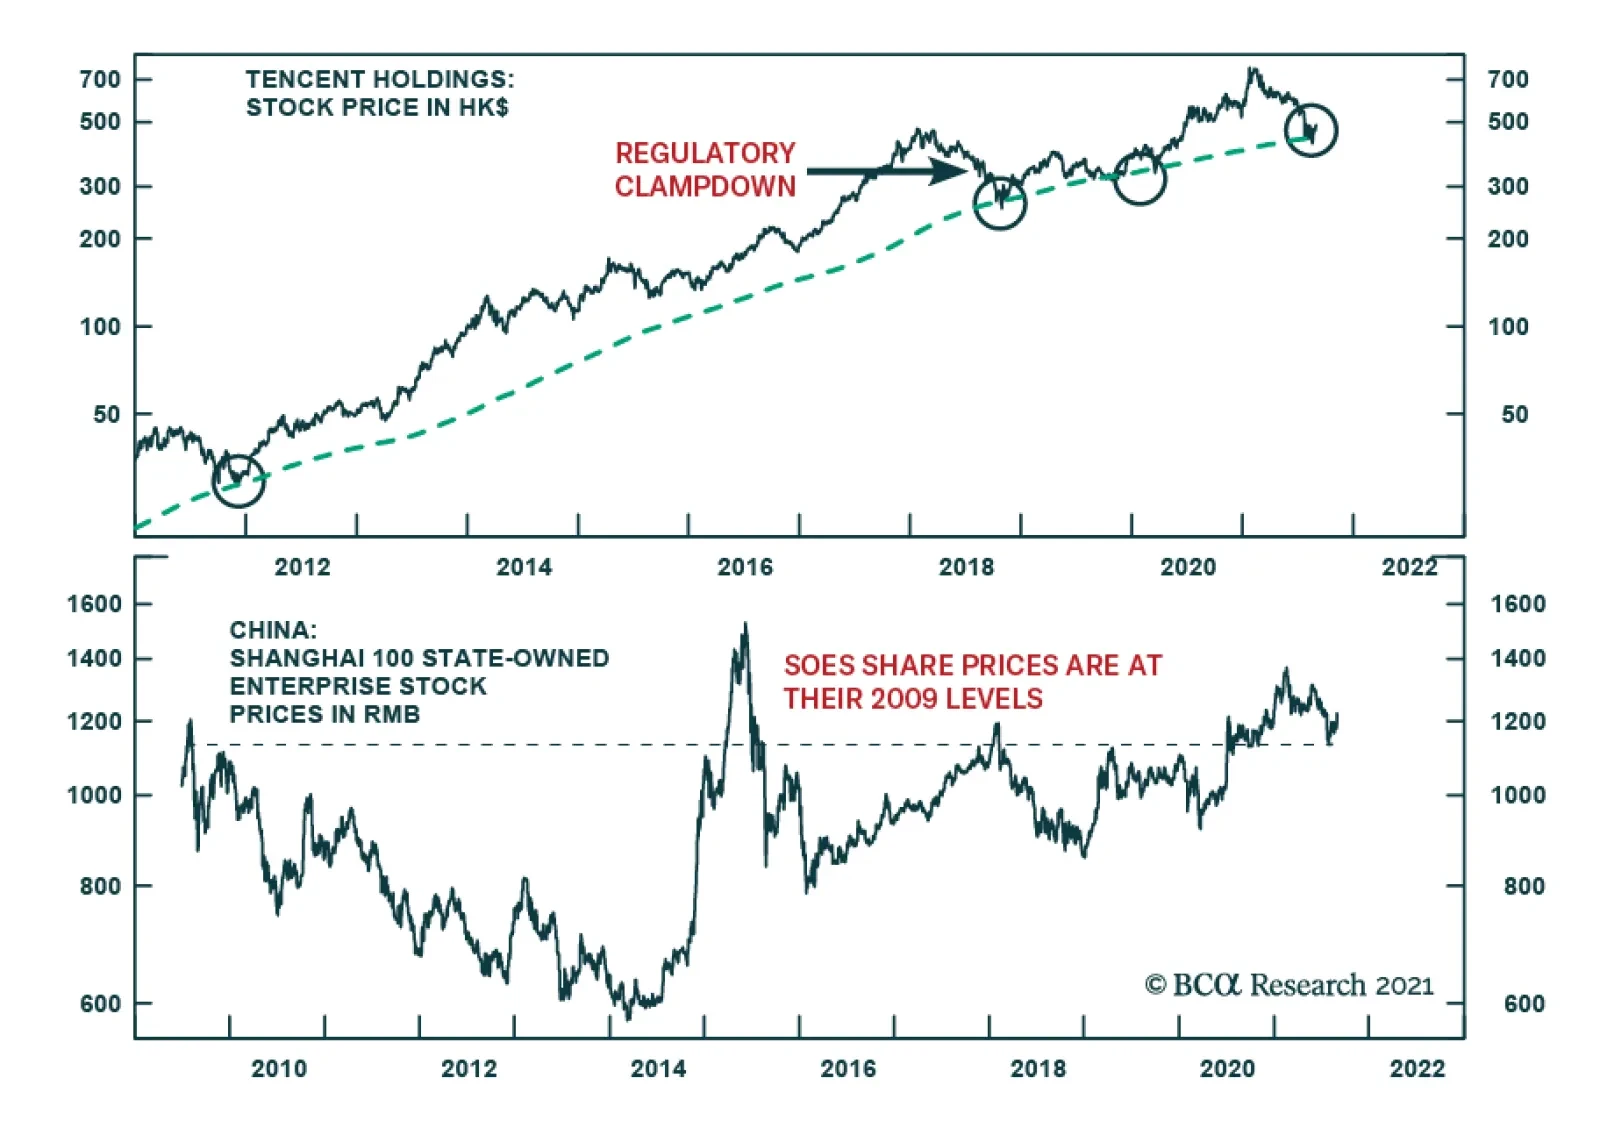
Question: In 2018, the regulatory clampdown on Tencent and other video game companies lasted several months and created a major pullback in their share prices (Chart 1). However, authorities ultimately removed restrictions and these stocks rallied to new highs. Do you expect the same dynamics to emerge this time around? And if not, why? We are witnessing a structural regime shift in the Chinese government’s approach toward platform companies. These changes are much more profound and long lasting than those in 2018. They herald structurally lower corporate profitability and equity multiples for Chinese TMT companies. For these stocks, a bounce from oversold levels is possible over the near term and it could be sharp. However, the rebound will be short-lived, i.e., a cyclical or secular rally is unlikely. Investors – who have not sold – should use this rebound to pare back exposure to Chinese TMT stocks. Chart 2Chinese SOEs: Lackluster Share Price Performance
Chinese SOEs: Lackluster Share Price Performance
Chinese SOEs: Lackluster Share Price Performance
Going forward, these platform companies will be managed in a similar fashion to Chinese state-owned enterprises (SOEs): with the interest of the entire nation in mind, and shareholder interests will take a back seat. China’s SOEs trade at very low multiples and their share prices have been treading water since 2009 (Chart 2). The secular bull market in Chinese TMT share prices is over and more de-rating is likely for the following reasons: Chinese platform/new economy companies possess unique big data that are important to the country’s development. Protecting big data becomes a priority in an era of US-China geopolitical confrontation and amid the elevated risk of cyber attacks. As a result, it is essential for the Chinese government to control companies that possesses big data. Limiting foreign shareholders’ access and decision making in regard to big data is also imperative. We do not believe that Chinese authorities will ever allow these new economy companies to operate as freely as they have in the past. Given platform company importance to both the domestic economy and geopolitical confrontation with the US, we will not be surprised if the government eventually establishes effective control over these platform companies – probably via its affiliated entities. Many of these platform companies are natural monopolies or oligopolies and their profitability should be regulated by authorities according to free market economic textbooks. We discussed this point in the recent report titled Chinese TMT Stocks: A Bad Dream Or A New Reality? Please click on the link to open the report. Going forward, return on equity will be lower than in the past for these stocks, heralding lower valuation multiples. Stocks of many Chinese platform companies trade in the US and are largely owned by US/international (non-Chinese) investors. Neither US nor Chinese authorities want to see shares of Chinese TMT companies trade in the US, albeit for completely different reasons. Chinese authorities want these companies to release little information to their foreign shareholders, especially regarding big data. In turn, the US securities regulator is keen for US investors not to be exposed to the risks of owning Chinese stocks for two main reasons: (1) these companies do not disclose full information and (2) China’s government meddles with the management of these enterprises. Given that authorities from both countries do not support the trading of Chinese stocks in the US, odds are high that the trading of Chinese TMT companies will move from the US to Hong Kong. Moreover, US authorities may recommend US funds avoid owing Chinese stocks. In short, increased government control over Chinese TMT companies and rising geopolitical tensions between the US and the Middle Kingdom may prompt many foreign investors to reduce their exposure to these stocks. This will have negative ramifications on their share prices. Chart 3Little Volatility Spillover From Offshore Into China's Onshore Markets
Little Volatility Spillover From Offshore Into China's Onshore Markets
Little Volatility Spillover From Offshore Into China's Onshore Markets
Question: Don’t you think Chinese authorities may reverse their regulatory clampdown given that Chinese share prices have already dropped a great deal and further weakness could hurt investor and business sentiment? Chinese authorities will not reverse regulatory tightening on platform companies. If investor and business confidence on the mainland is hurt materially, regulators will reduce the intensity of their reforms but will not reverse them. Importantly, the carnage has so far been limited to Chinese offshore financial markets (Chart 3). Neither the onshore equity indexes, nor onshore corporate bonds have sold off much (Chart 3). The majority of platform companies are listed offshore and plunging share prices hurt foreign shareholders more than domestic retail and institutional investors. There is little reason for Chinese policymakers to worry about losses among foreign investors so long as the carnage does not spread to onshore markets. Question: Why would Chinese authorities damage their largest and most successful companies in the new economy sectors? Are they not critical amidst the US-China confrontation? Chinese policymakers understand the importance of platform companies to the country’s domestic growth outlook as well as its geopolitical ambitions. This explains why Chinese authorities seek to establish effective control over decision making in these companies. We elaborated on the strategic importance of big data above. Also, the largest platform companies, such as Alibaba, Tencent and Meituan, have in recent years been acquiring stakes in numerous businesses in Southeast Asia. Beijing might be thinking of using these platform companies to raise its geopolitical influence over other Asian nations and beyond. Many Asian nations will play a prominent role in the US-China confrontation. Whether they side with China or the US will affect the balance of geopolitical power in the region. In this context, having control over soft infrastructure (payment and data systems, among others) in these Asian economies will give Beijing a chance to influence their geopolitical choices, thereby giving China an advantage over the US. Therefore, the Chinese central government might be aiming to establish an effective control over these companies’ strategic decisions. In such a case, shareholder interests will take a back seat in these companies. Question: What about common prosperity initiatives and policies that the Chinese leadership has unveiled in recent weeks? Why now? President Xi will be elected for his third term in the fall of 2022. This constitutes a major political precedent in the Middle Kingdom’s modern history. President Xi wants to secure his support from the bulk of the population. Common prosperity policies entail income and wealth distribution from high-income to middle- and low-income households. Chart 4 and Chart 5 illustrate that there has so far been no equalization of income and wealth distribution. Chart 4China: Income Disparity Has Not Been Narrowing
What Clients Are Asking
What Clients Are Asking
Chart 5Wealth Concentration Remains High In China
Wealth Concentration Remains High In China
Wealth Concentration Remains High In China
It is imperative for President Xi to achieve a meaningful change in income and wealth distribution in the next 12 months before his third term. President Xi’s power stems not from the top 10% of the population but from the remaining (and less wealthy) 90%. Hence, there will be little easing in the push toward common prosperity. If anything, the pace of these initiatives could escalate going forward. As a part of the common prosperity initiatives, companies with excess profitability will be compelled to perform a national duty in the form of financing social programs or providing donations. Large platform companies have already begun making large donations. This trend will intensify in the months ahead. In brief, profits will be distributed away from shareholders of these companies in favor of the general well-being of society. The positive is that low- and middle-income consumer spending in China will be supported by income transfer from companies and wealthy individuals. As a result, investors should favor the companies that sell to low- and middle-income households. Chart 6Chinese Growth Stocks Are Not Yet Cheap
Chinese Growth Stocks Are Not Yet Cheap
Chinese Growth Stocks Are Not Yet Cheap
Going forward, the model of SOEs in China or Russia will be applicable to Chinese platform companies. SOEs in China, Russia and other EM countries often perform national duties at the expense of shareholders. Not surprisingly, their stocks have been trading at much lower multiples than private companies. Presently, Chinese TMT/growth stocks trade at a trailing P/E ratio of 33.5 (Chart 6). We do not expect platform companies’ P/E ratio to drop to the level of SOEs. However, a trailing P/E ratio of 33.5 for China’s TMT companies is still high given: the uncertainty around future business models; a lack of clarity around (still evolving) new regulation; government involvement in their management; the prioritization of national and geopolitical objectives over shareholder interest. Chart 7Mind These Gaps
Mind These Gaps
Mind These Gaps
Question: Isn’t the slowdown in China’s business cycle already well known and priced in related financial markets? Yes, it is well known but we do not think it has been priced in China-exposed plays. There are several market relationships and indicators that lead us to believe so. Both panels in Chart 7 illustrate that industrial metals prices have diverged from the Chinese manufacturing PMI and onshore government bond yields. The latter two variables project the Chinese business cycle. Such a decoupling is unsustainable given that China accounts for 55% of global industrial metal consumption. We continue to expect meaningful downside in industrial metals prices which would hurt EM countries exporting commodities. China’s credit and fiscal spending impulse leads its business cycle by nine months and suggests that economic data will be weakening until Q2 2022 (Chart 8). Finally, net EPS revisions for EM-listed companies remain elevated (Chart 9). Chart 8China's Business Cycle Will Continue Decelerating Well Into Q1 2022
China's Business Cycle Will Continue Decelerating Well Into Q1 2022
China's Business Cycle Will Continue Decelerating Well Into Q1 2022
Chart 9EM EPS Growth Expectations Have Not Yet Been Downgraded
EM EPS Growth Expectations Have Not Yet Been Downgraded
EM EPS Growth Expectations Have Not Yet Been Downgraded
That said, one sentiment indicator that has dropped significantly and is now near its level during previous EM equity lows is the Sentix European investor sentiment index on EM equities (Chart 10). Chart 10European Investor Sentiment On EM Stocks Is Back To Its Previous Lows
European Investor Sentiment On EM Stocks Is Back To Its Previous Lows
European Investor Sentiment On EM Stocks Is Back To Its Previous Lows
Net-net, the risk-reward tradeoff for EM equities and credit markets is not yet attractive. Chinese TMT stocks are vulnerable for reasons discussed above while EM financial markets exposed to China’s old economy are at risk due to decelerating Chinese economic growth. Question: When will authorities in China ease policy? What does it imply for Chinese and EM financial markets? Shouldn’t investors buy China/EM assets now in anticipation of macro policy easing in China? Yes, China has already started easing credit and fiscal policy and will ease more in the coming months. Chart 11 reveals that banks’ excess reserves at the PBOC have turned up and they lead the credit impulse by six months. In turn, the Chinese credit impulse in turn leads EM share price cycles by nine months (Chart 12). Chart 11China's Credit Impulse Will Bottom In Late 2021
China's Credit Impulse Will Bottom In Late 2021
China's Credit Impulse Will Bottom In Late 2021
Chart 12EM Equities Are Not Yet Out Of The Woods
EM Equities Are Not Yet Out Of The Woods
EM Equities Are Not Yet Out Of The Woods
All in all, even though Chinese policymakers have begun easing credit and fiscal policy, financial markets leveraged to the mainland’s old economy could still suffer as growth continues to disappoint in the months to come. Chart 13Chinese Easing In H2 2018 And H1 2019 Did Not Help Much EM Stocks And Metal Prices
Chinese Easing In H2 2018 and H1 2019 Did Not Help Much EM Stocks And Metal Prices
Chinese Easing In H2 2018 and H1 2019 Did Not Help Much EM Stocks And Metal Prices
Importantly, policy easing will be implemented gradually, as in H2 2018 and H1 2019. During this period EM ex-TMT stocks and industrial metal prices performed poorly despite policy easing in China (Chart 13). Question: Given improvements in vaccine availability worldwide, will EM countries close their vaccination gap with developed countries in the coming months? If yes, wouldn’t it allow their economies to catch up, and their financial markets to outperform their DM peers? EM vaccination rates will rise as vaccines become available to developing countries. However, mainstream EM vaccination rates will still remain below those of advanced economies. This gap is due to higher levels of mistrust toward governments in developing countries than in advanced ones. Therefore, the pandemic will continue capping economic activity in mainstream EM. Importantly, the lack of fiscal stimulus, monetary policy tightening and weak banking systems in mainstream EM (i.e., excluding China, Korea and Taiwan) herald weak income and domestic demand growth in these economies. Years of poor income growth and lasting pandemic damage have caused political volatility to flare-up in some countries such as Colombia, Peru, Brazil, South Africa and Malaysia. This trend will likely continue foreshowing a higher risk premium in EM financial markets. Question: What is your inflation outlook for mainstream EM (excluding North Asia)? Will inflation continue to surprise to the upside and will their central banks hike rates enough so that their currencies do not depreciate? We discussed the inflation dynamics and the outlook for local rates for EM in the August 12 report. While commodity price inflation will subside, renewed currency deprecation is the key risk to the inflation outlook in mainstream EM. EM currencies will depreciate because China’s continued slowdown is bearish for EM currencies but bullish for the greenback. The basis is that the US sells little to China while EM are exposed to the Chinese business cycle. Also, domestic demand in mainstream EM will disappoint. That, along with rising political volatility, is negative for their currencies. Finally, high local rates in mainstream EM have often coincided with currency depreciation rather than appreciation. Question: What is the biggest risk in your view? The biggest risk to our view has been and remains TINA (There Is No Alternative). We have strong conviction on fundamentals but very little conviction on fund flows. Given that DM equity and credit markets are expensive and their government bond yields are very depressed, portfolio capital can go into EM financial markets that offer lower valuation than their DM counterparts even though they are not cheap in absolute terms. Our methodology is that fundamentals drive flows in the medium- to-long term. However, with the global financial system flush with liquidity, the importance of fundamentals has declined in recent years. Therefore, we are cognizant that EM markets might not sell off a lot and could bottom at a higher level than warranted by fundamentals. Still, we expect more downside in the coming months because fundamentals are much worse than most investors realize. Chart 14EM Credit Will Continue Underperforming Their US Peers
EM Credit Will Continue Underperforming Their US Peers
EM Credit Will Continue Underperforming Their US Peers
Question: What is your recommended strategy across EM equities, currencies, and fixed-income markets? Global equity portfolios should continue underweighting EM, a recommendation from March 25, 2021. Within the EM equity universe, our overweights are Korea, India, China (preferring onshore to offshore equities), Mexico and Chile. Our underweights are Brazil, Colombia, Peru, South Africa, Turkey, the Philippines and Indonesia. The risk-reward tradeoff for EM currencies remains poor. We continue shorting a basket of BRL, CLP, COP, PEN, ZAR, TRY, PHP, THB and KRW versus the US dollar. Within local markets we overweight Mexico, Russia, Korea, Malaysia, India, China and Chile. Regarding sovereign and corporate credit, we have downgraded EM credit versus US credit on March 25 and this strategy remains intact (Chart 14). The lists of our overweights, underweights and the ones warranting neutral allocation in EM equity, domestic bonds and credit portfolios are presented below and can always be found on the EMS website. Arthur Budaghyan Chief Emerging Markets Strategist arthurb@bcaresearch.com Equities Recommendations Currencies, Credit And Fixed-Income Recommendations
According to BCA Research's China Investment Strategy service, Chinese leaders' response during the 2018/19 Sino-US trade war may be a roadmap for policy direction in the next 12 months. China's policy shift to a cross-cyclical stance has gained more…
Highlights China’s credit tightening may have surpassed maximum strength. Monetary policy will remain accommodative and fiscal policy will become more supportive in the rest of the year. However, overall regulatory oversight is still restrictive, limiting the scope of reflationary effects on the economy. There were signs that the “cross-cyclical” approach – a new catchphrase from the July Politburo meeting - emerged even before the start of the pandemic. The current policy backdrop resembles the situation in 2H2018. China’s new “common prosperity” plan, which sets up guidance for long-term policy direction, will likely have cyclical implications. Chinese investable stocks are in oversold territory and will probably rebound in the near term. In the next 6 to 12 months, however, we remain cautious given the lack of a catalyst to revive investor sentiment. Feature Chart 1Chinese Stocks Are Oversold In Absolute Terms
Chinese Stocks Are Oversold In Absolute Terms
Chinese Stocks Are Oversold In Absolute Terms
China’s economic momentum has slowed, while regulatory crackdowns show no signs of dissipating. Meanwhile, Chinese investable stocks in absolute terms have slumped into technically oversold territory (Chart 1). Global investors are looking at fiscal and monetary policy easing for clues to what may be next. A shift in policy direction from restrictive to reflationary will help to shore up market sentiment and the outlook for the economy. Fiscal policy implementation in 1H21 was tighter than budgeted, leaving room for more support in 2H21. The PBoC’s unexpected reserve requirement ratio (RRR) cut in early July may have been a signal that policy tightening has ended. In short, China’s financial tightening has most likely passed its peak strength. Chart 2Valuations Are Almost Back To 2018 Lows
Valuations Are Almost Back To 2018 Lows
Valuations Are Almost Back To 2018 Lows
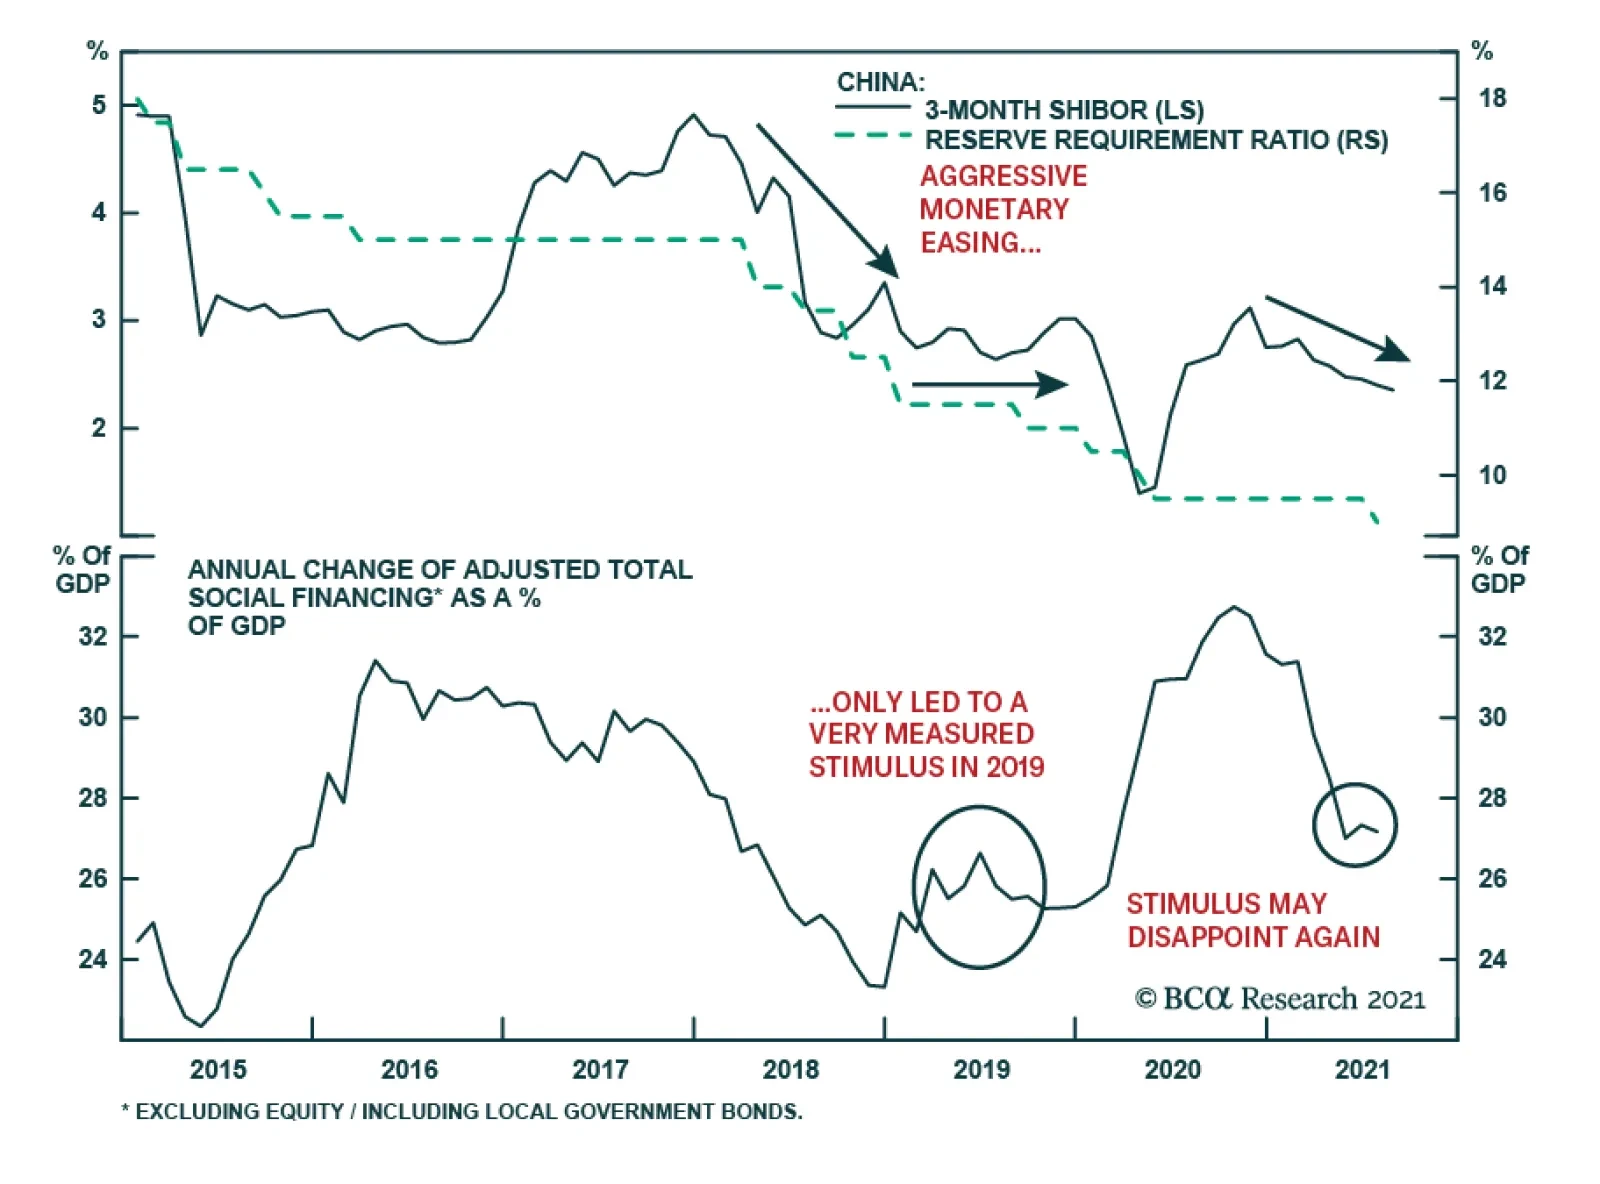
We have no doubt that China will announce some compensatory measures in the coming months in response to rising downward pressures on the domestic economy. However, we continue to hold the view that the bar for a fresh round of material stimulus is higher today than it was in the past. The policy focus pivoting from a countercyclical to cross-cyclical adjustment, the rising emphasis on common prosperity, and the ongoing regulatory clampdowns in an array of industries, all limit the extent to which authorities can deploy the expected magnitude in infrastructure spending and bank lending. Therefore, we continue to recommend investors remain underweight Chinese stocks versus their global peers – a stance we have maintained since earlier this year – despite cheapened relative valuations in Chinese equities (Chart 2). Shifting To A Cross-Cycle Approach China’s policy shift to a cross-cyclical stance has gained more market attention since the late-July Politburo meeting. However, there were signs that the cross-cyclical approach emerged even before the start of the pandemic. Chart 3Size Of Stimulus Was Already Getting Smaller
Size Of Stimulus Was Already Getting Smaller
Size Of Stimulus Was Already Getting Smaller
During the height of the 2018/19 US-China trade war, policymakers responded to the economic shocks from imposed import tariffs with much more measured stimulus than in previous cycles (Chart 3). President Xi repetitively used the “Long March” analogy during the trade war, warning Chinese citizens to prepare for protracted hardship stemming from conflict with the US.1 The metaphor had important market implications because the attitude was fundamental to how the government handled the cyclical slowdown in 2018/19. Despite aggressive RRR and policy rate cuts in the second half of 2018, authorities maintained tight restrictions on bank lending and local government spending. Consequentially, aggregate credit growth continued to slide through end-2018 (Chart 4). Furthermore, authorities became uneasy about the sharp rise in the rate of credit expansion in Q1 2019. Following a public spat between the Premier Li Keqiang and the central bank, bank lending slowed sharply in the rest of the year. As a result, the improvement in infrastructure investment growth was small and short-lived. Despite an acceleration in local government bond issuance in 2H18 and Q1 2019, infrastructure investment growth remained on a structural downward trend throughout most of 2018 and 2019 (Chart 5). Chart 4China: A Deja Vu Of 2018-2019?
China: A Deja Vu Of 2018-2019?
China: A Deja Vu Of 2018-2019?
Chart 5Improvement In Infrastructure Investment Was Short-Lived In 2019
Improvement In Infrastructure Investment Was Short-Lived In 2019
Improvement In Infrastructure Investment Was Short-Lived In 2019
Chart 6Financial De-Risking Mode Is Still On
Financial De-Risking Mode Is Still On
Financial De-Risking Mode Is Still On
The current policy backdrop resembles the situation in 2H2018: while the central bank has kept interest rates at historically low levels and preemptively cut the RRR rate in July, lending standards remain tight and shadow bank credit continues to shrink (Chart 6). In the past Chinese authorities stimulated substantially following exogenous shocks, but did not stimulate much when business cycle was slowing in an orderly manner. A resurgence of domestic COVID cases and the severe flood in central China in July and August represent exogenous shocks and occured when the economy was losing steam. Hence, there are higher odds authorities will provide some support in response to these exogenous shocks. However, the recurring battle against COVID and lingering tensions with the US have likely prompted Chinese top leadership to extend their cross-cycle strategy. Officials may feel that a modest easing in both monetary and fiscal policies will be sufficient to offset the current economic weakness without overstimulating the economy. Bottom Line: A cross-cycle policy approach means not only responding early to small shocks with piecemeal stimulus to stabilize growth but also limiting the scope of stimulus and preparing for “protracted battles”. The response from Chinese leaders during the trade war with the US in 2018/19 may be a roadmap for policy direction in the next 12 months. Cyclical Implications From “Common Prosperity” President Xi Jinping laid out a plan for “common prosperity”, a guideline for the country’s national policy in the coming decades, at the August 18th Central Committee for Financial and Economic Affairs. Most of the plan’s objectives have 2035 deadlines and will be achieved gradually in multiple phases.2 However, in the next 12 months and leading to the 20th National Party Congress in the fall of 2022, we expect the authorities to accelerate some reform agendas that are consistent with the 14th Five-Year Plan (2021-2025). A key area that may gain momentum is increasing labor income and household consumption share in national output. Both labor compensation and household consumption as a share of GDP improved from 2011 to 2016, but the progress stalled in recent years and further deteriorated last year in the wake of the pandemic (Chart 7). Policy decision makers can reverse the falling share by either boosting income/consumption or lowering the share of capital formation in the national output, or a combination of both. Regulatory tightening in the property market has reduced investment growth in the sector, which accounts for 66% of the country’s total fixed-asset formation (Chart 8). We expect policy restrictions to continue curbing real estate investment in the rest of the year and into 2022, further shrinking the share of capital formation in the aggregate output.3 Chart 7China's Economic Rebalancing Progress Has Stalled In The Past Five Years
China's Economic Rebalancing Progress Has Stalled In The Past Five Years
China's Economic Rebalancing Progress Has Stalled In The Past Five Years
Chart 8Policymakers Are Moving Away From The 'Old Economy' Pillars
Policymakers Are Moving Away From The 'Old Economy' Pillars
Policymakers Are Moving Away From The 'Old Economy' Pillars
Chart 9Recovery In Household Income And Consumption Has Significantly Lagged Other Sectors
Recovery In Household Income And Consumption Has Significantly Lagged Other Sectors
Recovery In Household Income And Consumption Has Significantly Lagged Other Sectors
Recovery in household income and consumption has significantly lagged other sectors in China’s recent economic rebound (Chart 9). In addition to short-term, pandemic-related factors, household consumption has been sluggish due to China’s long-standing imbalanced income distribution. Given that China will be under more pressure to deliver economic progress in 2022, boosting wage growth and consumption will help to facilitate both the nation’s cross-cyclical economic strategy and President Xi’s longer-term reform plan for income and wealth redistribution. If successfully implemented, a rebalancing of labor income and consumption as a share of the national aggregate will have long-term economic benefits. However, for investors with a cyclical time frame, the transition will likely have the following implications on the market: Policymakers will keep a large fiscal budget deficit and increase spending in public services and social welfare, but there will be more pressure on the central government to keep local government debt in check. The increased fiscal burden also means that while the government will provide subsidies for households and key new-economy industries, policy at margin may move away from boosting investment in traditional infrastructure and construction (Chart 10). Chart 10Traditional Infrastructure Investment Will Remain Subdued
Traditional Infrastructure Investment Will Remain Subdued
Traditional Infrastructure Investment Will Remain Subdued
Empirical research shows that lower-income households have a higher marginal propensity to consume.4 Last year China refrained from meaningful stimulus to incentivize consumption. In contrast, the statement from the August 18th meeting indicated the focus is on securing living standards and wages among lower-income households. Common prosperity related policies may boost consumption of staples and some durable goods but will likely discourage splurging in high-end luxury goods and services. Large corporations and high-net-worth individuals will be expected to share social responsibility and the cost of reducing income inequality, either through higher and stricter tax burdens, raising minimum wages for employees, and/or donations. Bottom Line: The “common prosperity” theme will mostly entail long-term policy initiatives, but it may also have some cyclical market repercussions. Investment Recommendations Chart 11Tactical Bounce Gave Way To Cyclical Downturn In Previous Cycles
Tactical Bounce Gave Way To Cyclical Downturn In Previous Cycles
Tactical Bounce Gave Way To Cyclical Downturn In Previous Cycles
We do not rule out the possibility of a tactical (within the next three months) / technical rebound in Chinese stocks. Our August 4th report discussed how prices managed to rebound strongly within 90 days of the policy-triggered market riots in both 2015 and 2018. However, the rallies quickly faded and stocks fell to new lows (Chart 11). Prices bottomed when policy decisively turned reflationary. For now, the risks to Chinese equities are largely to the downside. Although there are some remedial measures to ease monetary and fiscal policies, officials have not sent a clear signal to ease on the regulatory front. Conversely, there are two scenarios that could prompt us to upgrade Chinese stocks to either neutral or overweight in both absolute and relative terms. Chart 12No Clear Signal Chinese Policymakers Will Ease On The Regulatory Front
No Clear Signal Chinese Policymakers Will Ease On The Regulatory Front
No Clear Signal Chinese Policymakers Will Ease On The Regulatory Front
The first scenario is that the economy does not slow further and a modest policy easing is sufficient to stabilize the economic outlook. This may happen if strong global economic growth and demand continue to support China’s export and manufacturing sectors, while domestic household consumption improves. In this case, the downside risks on the overall economy would abate, but the gradual underlying downtrend in China's old economy would be intact. We would need an additional reflationary tailwind, such as a boost from fiscal spending or a reversal of industry policy tightening, to upgrade Chinese stocks to overweight. We have argued in the past that housing appears to be the best candidate; the catalyst is missing at the moment (Chart 12). In the second scenario, Chinese policymakers may determine that the downside risks to growth are unacceptably large given existing slowdowns in the industrial and service sectors, and decide to temporarily reverse course on structural reforms. We will watch for indications of a shift in attitude. For now, we think that China’s leadership has a higher pain threshold than in the past, suggesting that this outcome is not yet probable. Jing Sima China Strategist jings@bcaresearch.com Footnotes 1"Xi Jinping calls for ‘new Long March’ in dramatic sign that China is preparing for protracted trade war", South China Morning Post. 2"Xi stresses promoting common prosperity amid high-quality development, forestalling major financial risks", Xinhua, English.news.cn 3We use fixed-asset investment (FAI) as a proxy for gross fixed capital formation (GFCF) because the National Bureau of Statistics of China does not publish the GFCF breakdown by sectors. GFCF comprises FAI, less the purchase of existing fixed assets, land and some minor items. Historically, the two series have closely tracked each other. 4"The Stimulative Effect of Redistribution", Federal Reserve Bank of San Francisco Market/Sector Recommendations Cyclical Investment Stance
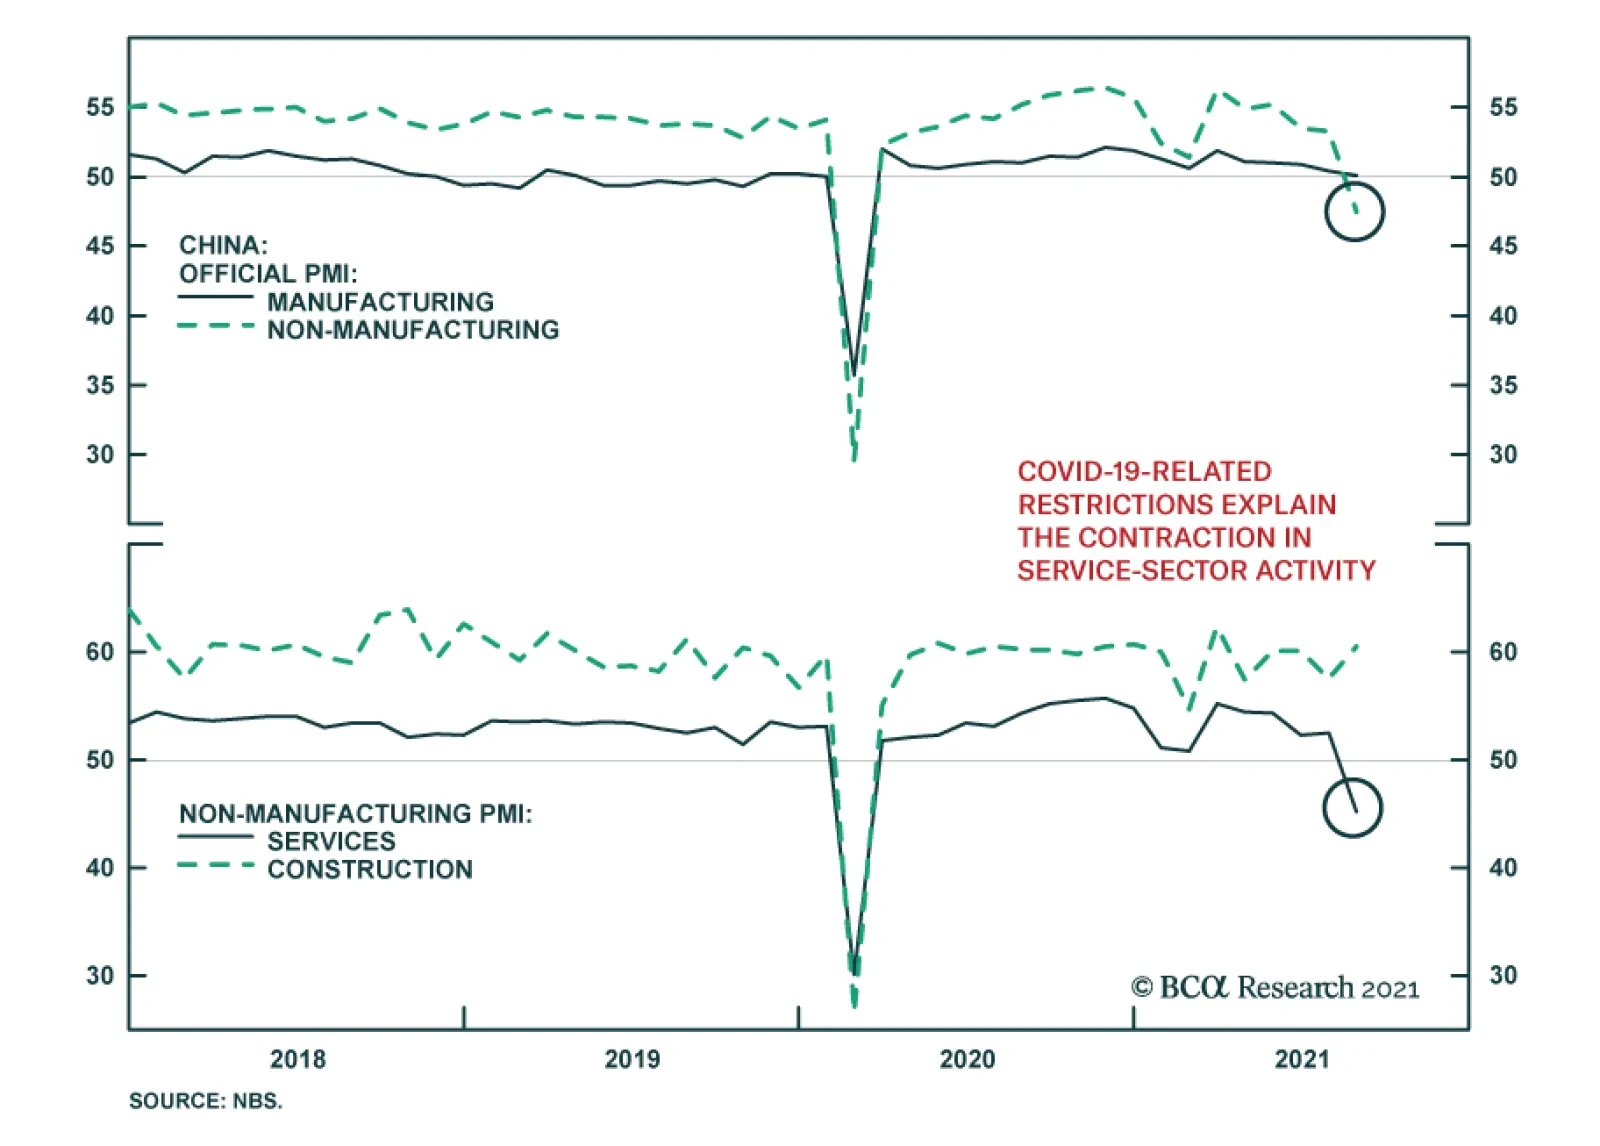
China's official PMIs disappointed in August. The non-manufacturing index fell to contractionary territory of 47.5, below expectations of a more muted 1.3-point decline to 52.0. Similarly, the manufacturing PMI eased by 0.3 points to 50.1 - a hair above…

US financial markets' muted reaction to Fed Chair Powell's Jackson Hole speech indicates that asset prices already reflect investors' expectation that the Fed will taper asset purchases before year-end (see Country Focus). However, emerging market…
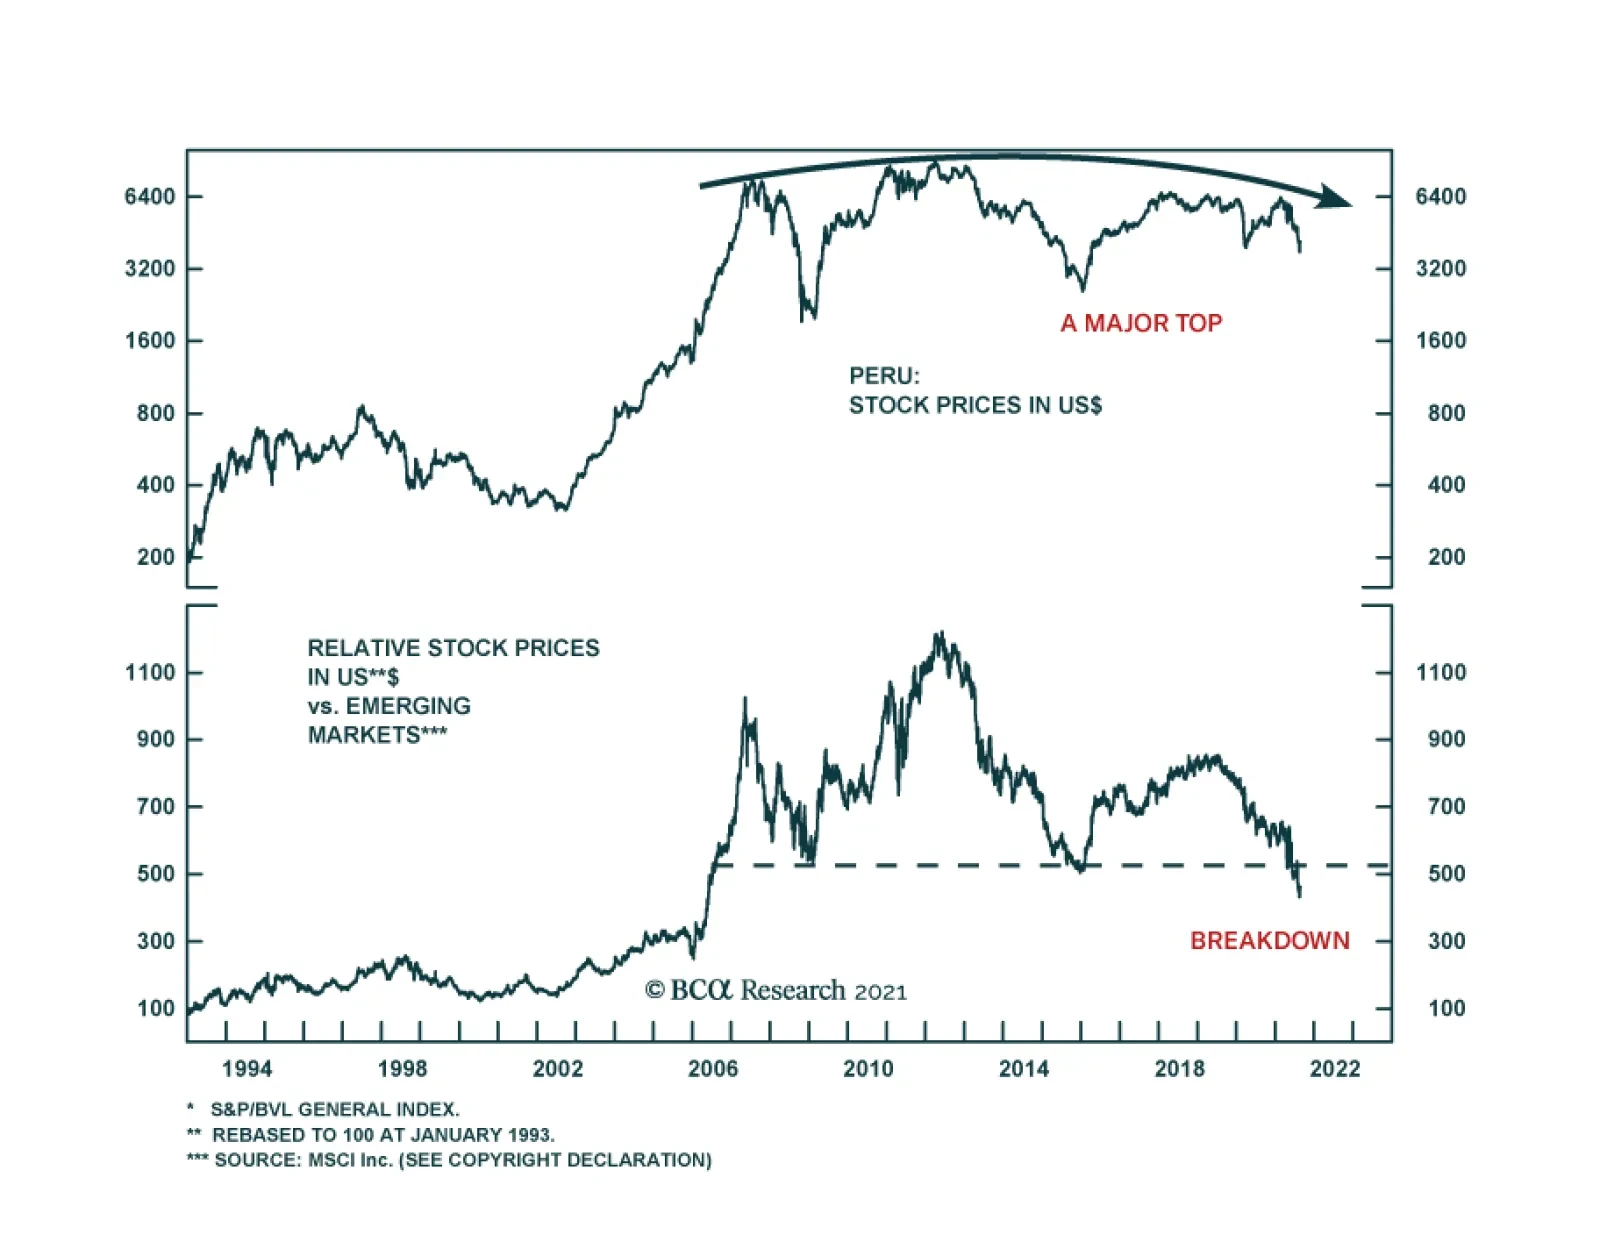
Peru's financial assets have plummeted due to the election of left-wing president Pedro Castillo. Some investors may be tempted to bottom fish in these markets due to their lower valuations and oversold conditions. However, political volatility has not yet…
Highlights The US dollar’s reserve status will remain intact for the foreseeable future. While this privilege is fraying at the edges, there are no viable alternatives just yet. There is an overarching incentive for any country to hold onto its currency’s power. For the US, it is still well within their ability to keep this “exorbitant privilege.” That said, there will be rolling doubts about the ability of the US to maintain its large currency sphere. This will create tidal waves in the currency’s path, providing plenty of trading opportunities for investors. China is on track to surpass the US in economic size, but it is far from dethroning the US in the military realm. However, it is gradually gaining the ability to deny the US access to its immediate offshore areas and may already be capable of winning a war over nearby islands like Taiwan. Watch the RMB over the next few decades. From a macro and cyclical perspective, the dollar is likely to decline as global growth picks up and the Fed lags market expectations in raising rates. From a geopolitical perspective, however, the backdrop is neutral-to-bullish for the dollar over the next three to five years. Feature Having the world’s reserve currency comes with a few advantages, which any governments would be loath to give up. The most important advantage is the ability to settle one’s balance of payments in one’s own currency. This not only facilitates trade for the reserve nation, it also reinforces the turnover of the reserve currency internationally. The value of this privilege is as much symbolic as economic. This “first mover advantage” or adoption of one’s currency internationally automatically ordains the resident central bank as the world’s bank. The primary advantage here is being able to dictate global financial conditions, expanding and contracting money supply to address domestic and global funding pressures. As compensation for this task, the world provides one with non-negligible seigniorage revenue. Being the world’s central bank also comes with another crucial advantage: being able to choose which international projects will be funded, while using cheaply issued local debt to finance these investments. Of course, any sensible society will earn more on its investments than it pays on the debt issued. There is a geopolitical angle to having the world’s reserve currency. A nation’s currency is widely held because of strategic depth—its ability to secure the people who trade in that currency and the property denominated in it. Deposits and transactions can be monitored, secured, or even halted at the behest of the sovereign. Holding the currency means one can maintain one’s purchasing power, given that it is backed by the most powerful country in the world. As the reserve currency becomes the de facto international medium of exchange, having stood the test of time through various crises, this allows the resident country to alter its purchasing power to achieve both national and international goals. Throughout history, having the world’s reserve currency has been the pursuit of many governments and kingdoms. In the current paradigm, the US enjoys this privilege. But could that change? And if so, how and when? Our goal in this report is threefold. First, why would any country want to maintain reserve status? Second, does the US still possess the apparatus to keep the dollar as a reserve asset over the next decade? And finally, are there any identifiable threats to the US dollar reserve status beyond a ten-year horizon? The Imperative To Maintain Status Quo Global trade is still largely conducted in US dollars. According to the BIS triennial central bank survey, 88.3% of transactions globally were in dollars just before the pandemic, a percentage that has been rather resilient over the last two decades (Chart I-1). It is true that currencies such as the Chinese renminbi have been gaining international acceptance, but displacing a currency that dominates almost 90% of global transactions is a herculean task. Surprisingly, the world has been transacting less often in euros and Japanese yen, currencies that also commanded international appeal in recent history. Chart I-1The US Dollar Still Dominates Global Transactions
Is The Dollar’s Reserve Status Under Threat?
Is The Dollar’s Reserve Status Under Threat?
The big benefit for the US comes from being able to settle its balance of payments in dollars. This not only lowers transaction costs (by lowering exchange rate risk), but it also provides the ability to cheaply borrow in your own currency to pay for imports. Having global trade largely denominated in US dollars also establishes a network of systems that make it much easier to settle trade in that currency. It is remarkable that, despite running a persistent current account deficit, the US dollar has tended to appreciate during crises, a privilege other deficit countries do not enjoy (Chart I-2). Strong network effects make the US dollar the currency of choice during crises. Chart I-2Despite Running A Current Account Deficit, The Dollar Tends To Rise During Crises
Is The Dollar’s Reserve Status Under Threat?
Is The Dollar’s Reserve Status Under Threat?
Chart I-3The US Generates Non-Negligible Seignorage Revenue
The US Generates Non-Negligible Seignorage Revenue
The US Generates Non-Negligible Seignorage Revenue
Being at the center of the global financial architecture comes with an important benefit beyond trade: the ability to dictate financial conditions both domestically and globally. Consider a scenario in which the US and the global economy are facing a downturn. In this scenario, the Federal Reserve can be instrumental in turning the tide: To stimulate the US economy, the Fed lowers interest rates and/or runs a wider fiscal deficit. The central bank helps finance this fiscal deficit by expanding the monetary base (benefitting from seigniorage revenue). As the Fed drops interest rates, the yield curve steepens. Banks use the positive term structure to borrow at the short end of the curve and lend at the longer end. This boosts the US money supply. As firms borrow to invest, this increases demand for imports (machinery, commodities, consumer goods), widening the US current account deficit. US trade is settled in dollars, increasing the international supply of the greenback. To maintain competitiveness, other central banks purchase these dollars from the private sector, in exchange for their local currency. As global USD reserves rise, they can be reinvested back into Treasuries and held in custody at the Fed. In essence, the US can finance its budget deficit through a strong capital account surplus. The seigniorage revenue that the US enjoys by easing both domestic and international financing conditions is about $100 billion a year or roughly 0.5% of GDP (Chart I-3). But the goodwill from being able to dictate both domestic and international financial conditions is far greater. At BCA, one of our favorite measures of global dollar liquidity is the sum of the Fed’s custody holdings together with the US monetary base. Every time this measure has severely contracted in the past, the shortage of dollars has triggered a financial crisis somewhere, typically among other countries running deficits (Chart I-4), a highlight of the importance of the US as a global financier. Chart I-4US Money Supply And Global Liquidity
US Money Supply And Global Liquidity
US Money Supply And Global Liquidity
Chart I-5Despite A Liability Shortfall, US Assets Generate A Net Profit
Despite A Liability Shortfall, US Assets Generate A Net Profit
Despite A Liability Shortfall, US Assets Generate A Net Profit
Beyond seigniorage revenue, the US enjoys another advantage—being able to earn much more on its international investments than it pays on its liabilities. The US generates an excess return of 1% of GDP from its external assets, despite having a net liability shortfall of 67% of GDP (Chart I-5). The ability to issue debt that will be gobbled up by foreigners, and in part use these proceeds to generate a higher overall return on investments made abroad, does indeed constitute an “exorbitant privilege.” In a nutshell, there is a very strong incentive for the US to keep the dollar as the world’s reserve currency. One short-term implication is that the Fed might only taper asset purchases and/or raise interest rates in an environment in which both global and US growth are strong, or it could otherwise trigger a global liquidity crisis. This will be particularly the case given the Delta variant of COVID-19 is still hemorrhaging global economic activity. An Overreach In The Dollar’s Influence There is a political advantage to the US dollar’s reserve status that is often overlooked: transactions conducted in US dollars anywhere in the world fall under US law. In simple terms, if a company in any country buys energy from Iran and the transaction is done in US dollars, the Treasury has powers to sanction the parties involved. Since most companies across the world cannot afford to be locked out of the US financial system, they will tend to comply with US sanctions. Even companies that operate under the umbrella of great powers, such as China and Russia, still tend to adhere to US sanctions, because they do not want to jeopardize their trade with US allies, such as the European Union. Of course, China, Russia, and Iran are actively seeking alternative transaction systems to bypass the dollar and US sanctions. But they do not yet trust each other’s currencies. Chart I-6A Deep And Liquid Pool Of Treasurys
A Deep And Liquid Pool Of Treasurys
A Deep And Liquid Pool Of Treasurys
The euro is the only viable alternative; however, the euro’s share of global transactions has fallen, despite the EU’s solidification as a monetary union over the past decade and despite the unprecedented deterioration of US relations with China and Russia. The EU could do great damage to the USD’s standing if it joined Russia’s and China’s efforts wholeheartedly, but the EU is still a major trading partner of the US and shares many of the same foreign policy aims. It is also chronically short of aggregate demand and runs trade and current account surpluses, depriving trade partners of euro savings or a debt market to recycle those savings (Chart I-6). Historically, having the world’s reserve currency allows the US to conduct international accords that serve both domestic and foreign interests. The Plaza Accord, signed in the 1980s to depreciate the US dollar, served both US interests in rebalancing the deficit and international interests in financing global trade. The 1980s were golden years for Japan and the Asian tigers on the back of a weak USD, allowing entities to borrow in greenbacks and profitably invest in Asian growth. Once the US dollar had depreciated by a fair amount, threatening its store of value, the US engineered the Louvre Accord to stabilize exchange rates. Ultimately, when various Asian bubbles popped, investors thought of nowhere better to flee than to the safety of the US dollar. The same thing happened after the emerging market boom of the 2000s and the eventual bust of the 2010s. Today, the US may not be able to organize an international intervention, if one should be necessary in the coming years. Past experience shows that countries act unilaterally and coordinated interventions lack staying power. Neither Europe nor Japan is in the position today to allow currency appreciation, as they were in the past. And the US has shown itself unable to combat its trading partners’ depreciation, as in the case of China, whose renminbi remains below 2014 levels. The bottom line is that there is nothing to stop the US from attempting to stretch its overreach too far, which would create a backlash that diminishes the dollar’s status. This is especially the case given trust in the US government is quite low by historical standards, which for now points to a lower dollar cyclically (Chart I-7). Chart I-7Trust In The US Government And The Dollar
Is The Dollar’s Reserve Status Under Threat?
Is The Dollar’s Reserve Status Under Threat?
This is not to say that other countries with reserve aspirations can tolerate sustained appreciation. China has recommitted to manufacturing supremacy in its latest five-year plan, as it fears the political consequences of rapid deindustrialization. As such, the renminbi will be periodically capped to maintain competitiveness. Can The US Maintain Status Quo? Chart I-8A Lifespan Of Reserve Currencies
Is The Dollar’s Reserve Status Under Threat?
Is The Dollar’s Reserve Status Under Threat?
Over the last few centuries, reserve currencies have tended to have a lifespan of about 100 years (Chart I-8). The reason is that global wars tend to knock the leading power off its geopolitical pedestal, devaluing its currency and giving rise to a new peace settlement with a new ascendant country whose currency then becomes the basis for international trade. Such was the case for Spain, France, the UK, and the United States in a pattern of war and peace since the sixteenth century. Granting that the US dollar took the baton from sterling in the 1920s and that the post-World War II peace settlement is eroding in the face of escalating geopolitical competition, it is reasonable to ask whether or not the US might lose its grip on this power. To assess this possibility, it is instructive to revisit the anatomy of a reserve currency: Typically, a reserve currency tends to be that of the “greatest” nation. For the same reason, the reserve nation tends to be the wealthiest, which ensures that its currency is a store of value and that it can act as a buyer of last resort during crisis (Chart I-9). This reasoning is straightforward when a global empire is recognizable and unopposed. But in the current context of multipolarity, or great power competition, the paradigm could start to shift. Global trade is slowing globally, but it is accelerating in Asia (Chart I-10). China is a larger trading partner than the US for many emerging markets and is slated to surpass the US economy over the next decade. The renminbi has a long way to go to rival the dollar, but it is gradually rising and its place within the global reserve currency basket is much smaller than its share of global trade or output, implying room for growth (Chart I-11). Chart I-9Wealth And Reserve Currency Status Go Hand-In-Hand
Is The Dollar’s Reserve Status Under Threat?
Is The Dollar’s Reserve Status Under Threat?
Chart I-10Trade In Asia Is Booming
Is The Dollar’s Reserve Status Under Threat?
Is The Dollar’s Reserve Status Under Threat?
Chart I-11Adoption Of The RMB Has Room To Grow
Adoption Of The RMB Has Room To Grow
Adoption Of The RMB Has Room To Grow
To maintain hegemonic power (especially controlling the vital supply routes of prosperity), the reserve nation needs military might above and beyond everyone else. It helps that US military spending remains the biggest in the world, in part financed by US liabilities (Chart I-12). China is far from dethroning the US in the military realm. But it is gradually gaining the ability to deny the US access to its immediate offshore areas and may already be capable of winning a war over nearby islands like Taiwan. Moreover, its naval power is set to grow substantially between now and 2030 (Table I-1). Already, over the past decade, the US stood helplessly by when Russia and China annexed Crimea and the reefs of the South China Sea. It is possible to imagine a series of events that erode US security guarantees in the region, even as the US loses economic primacy. Chart I-12The US Still Maintains Military Might
Is The Dollar’s Reserve Status Under Threat?
Is The Dollar’s Reserve Status Under Threat?
Table I-1China’s Economic And Naval Growth Slated To Reduce American Primacy In Asia Pacific
Is The Dollar’s Reserve Status Under Threat?
Is The Dollar’s Reserve Status Under Threat?
The reserve currency nation needs to run deficits to finance activity in the rest of the world. That requires having deep and liquid capital markets to absorb global savings. There is considerable trust or “goodwill” that makes the US Treasury market the most liquid debt exchange pool in the world. This remains the case today (previously mentioned Chart I-6). Even so, this trend is shifting. The growth in euro- and yen-denominated debt is exploding. This mirrors the gradual shift in the allocation of FX reserves away from dollars into other currencies. If the US began to use the dollar as a geopolitical weapon recklessly, foreign entities may have no other choice but to rally into other currency blocks, including the euro (and perhaps eventually the yuan). This will take years, but it is worth noting that global allocation to FX reserves have fallen from around 80% toward USDs in the 70s to around 60% today (Chart I-13). Chart I-13The Dollar Reserve Status Has Been Ebbing
The Dollar Reserve Status Has Been Ebbing
The Dollar Reserve Status Has Been Ebbing
On the political front, there is some evidence that public opinion on the dollar is fading, although it is far from damning. A Pew survey on the trust in the US government is near decade lows and has tracked the ebb and flow of changes in the dollar (previously shown Chart I-7). Trust in government will probably not get much worse in the coming years, as the pandemic will wane and stimulus will secure the economic recovery, but too much stimulus could conceivably ignite an inflation problem that weighs on trust. True, populism has driven the US government under two administrations into extreme deficit spending. With the pandemic as a catalyst, US deficits have reached WWII levels despite the absence of a war. However, the Biden administration’s $3.5 trillion spending bill will be watered down heavily – and the 2022 midterms will likely restore gridlock in Congress, freezing fiscal policy through at least 2025. In other words, fiscal policy is negative for the dollar in the very near term, but the fiscal outlook is not yet so extravagant as to suggest a loss of reserve currency status. After all, there is some positive news for the US. The US demonstrated its leadership in innovation with the COVID-19 vaccines; it survived its constitutional stress test in the 2020 election; it is now shifting from failed “nation building” abroad to nation building at home; and its companies remain the most innovative and efficient, judging by global equity market capitalization (Chart I-14). China, meanwhile, is facing the most severe test of its political and economic system since it marketized its economy in 1979. Investors should not lose sight of the fact that, since the rise of President Xi Jinping and Russia’s invasion of Ukraine, global policy uncertainty has tended to outpace US policy uncertainty, attracting flows into the dollar (Chart I-15). Given that China and Russia are both pursuing autocratic governments at the expense of the private economy, it would not be surprising to see global policy uncertainty take the lead once again, confirming the decade trend of global flows favoring the US when uncertainty rises. Chart I-14American Primacy Still Clear In Equity Market
American Primacy Still Clear In Equity Market
American Primacy Still Clear In Equity Market
Chart I-15Higher Policy Uncertainty Good For Dollar
Higher Policy Uncertainty Good For Dollar
Higher Policy Uncertainty Good For Dollar
The bottom line is that the US dollar is gradually declining as a share of the global currency reserve basket, just as the US economy and military are gradually declining as a share of global output and defense spending. Yet the US will remain the first or second largest economy and premier military power for a long time, and the dollar still lacks a viable single replacement. A major war or geopolitical crisis is probably necessary to precipitate a major breakdown. The Iranian Revolution and September 11 attacks both had this kind of effect (see 1979 and 2001 in Chart I-13 above). But COVID-19 is less clear. If China and Europe emerge as more stable than the US, then the post-pandemic aftermath will bring more bad news for the dollar. Investment Implications From a geopolitical perspective, the backdrop is neutral for the dollar beyond the next twelve to eighteen months. An escalating conflict with Iran—which is possible in the near term—would echo the early 2000s and weigh on the currency. But a deal with Iran and a strategic pivot to Asia would compound China’s domestic political problems and likely boost the greenback. Chart I-16US Twin Deficits And The Dollar
US Twin Deficits And The Dollar
US Twin Deficits And The Dollar
From a macro and cyclical perspective, however, the view is clearly negative for the dollar. Over the next five years, the U.S. Congressional Budget Office (CBO) estimates that the U.S. budget deficit will shrink and then begin expanding again to -5% of GDP. If one assumes that the current account deficit will widen somewhat, then stabilize, the twin deficits will be pinned at around -10% of GDP. Markets have typically punished the dollar on rising twin deficits (Chart I-16). This suggests near-term pressure on the dollar’s reserve status is to the downside. EM currencies may hold a key to the performance of the dollar. While most EM economies remain hostage to the virus, a coiled-spring rebound cannot be ruled out as populations become vaccinated. China’s Politburo signaled in July that it will no longer tighten monetary and fiscal policy. We would expect policy easing over the next twelve months to ensure the economy is stable in advance of the fall 2022 party congress. If the virus wanes and China’s economy is stimulated, global growth will improve and the dollar will fall. Chester Ntonifor Foreign Exchange Strategist chestern@bcaresearch.com Matt Gertken Geopolitical Strategist mattg@bcaresearch.com