Emerging Markets

Feature Since the end of the first quarter, the decline in Treasury yields has been the most important trend in global financial markets. It has contributed to the return of the outperformance of growth stocks relative to value stocks, the underperformance of Eurozone equities relative to the S&P 500, and the tepid results of cyclicals relative to defensive equities. This decline in yields is a temporary phenomenon, because the global economy continues to re-open and inventory levels remain so low that further restocking is in the cards. The cyclical picture is not without blemish; COVID-19 variants remain a concern. However, if these risks were to materialize into another delayed re-opening, then further reflationary efforts by both monetary and fiscal authorities would buoy financial markets. The greatest near-term worry for the global economy and markets comes from China. The Chinese credit impulse is slowing markedly and fiscal support has yet to come to the rescue. This phenomenon is the main reason why this publication maintains a cautious tactical stance on Eurozone cyclical stocks, even if we believe these sectors have ample scope to outperform over the remainder of the business cycle. As a corollary, we believe that yields will likely remain within range this summer and Eurozone benchmarks will lag behind the US. This week, we review key charts, organized by theme, highlighting some of these key concepts. As an aside, none covers inflation. Even if the balance of evidence suggests that any sharp increase in Eurozone inflation will be temporary, the proof will only become more visible by early 2022. The Opening Is On Track… The pace of vaccination across the major Eurozone economies has picked up meaningfully since the spring. Consequently, the number of doses distributed per capita is rapidly approaching that of the US, even as it still lags behind that of the UK (Chart 1). As a result of this improvement, the stringency of lockdown measures is declining, which is allowing European mobility to recover (Chart 2). While this phenomenon is evident around the world, EM still lag in terms of vaccination rates. However, the Global Health Innovation Center at Duke University expects 10 billion vaccine doses to be produced by the year’s end, which will be enough to inoculate most (if not all) the vulnerable people in the world by early 2022. Consequently, the re-opening of the economy will remain a potent tailwind behind global growth for three or four more quarters. Chart 1Vaccination Progress...
Vaccination Progress...
Vaccination Progress...
Chart 2...Leads To Greater Activity
...Leads To Greater Activity
...Leads To Greater Activity
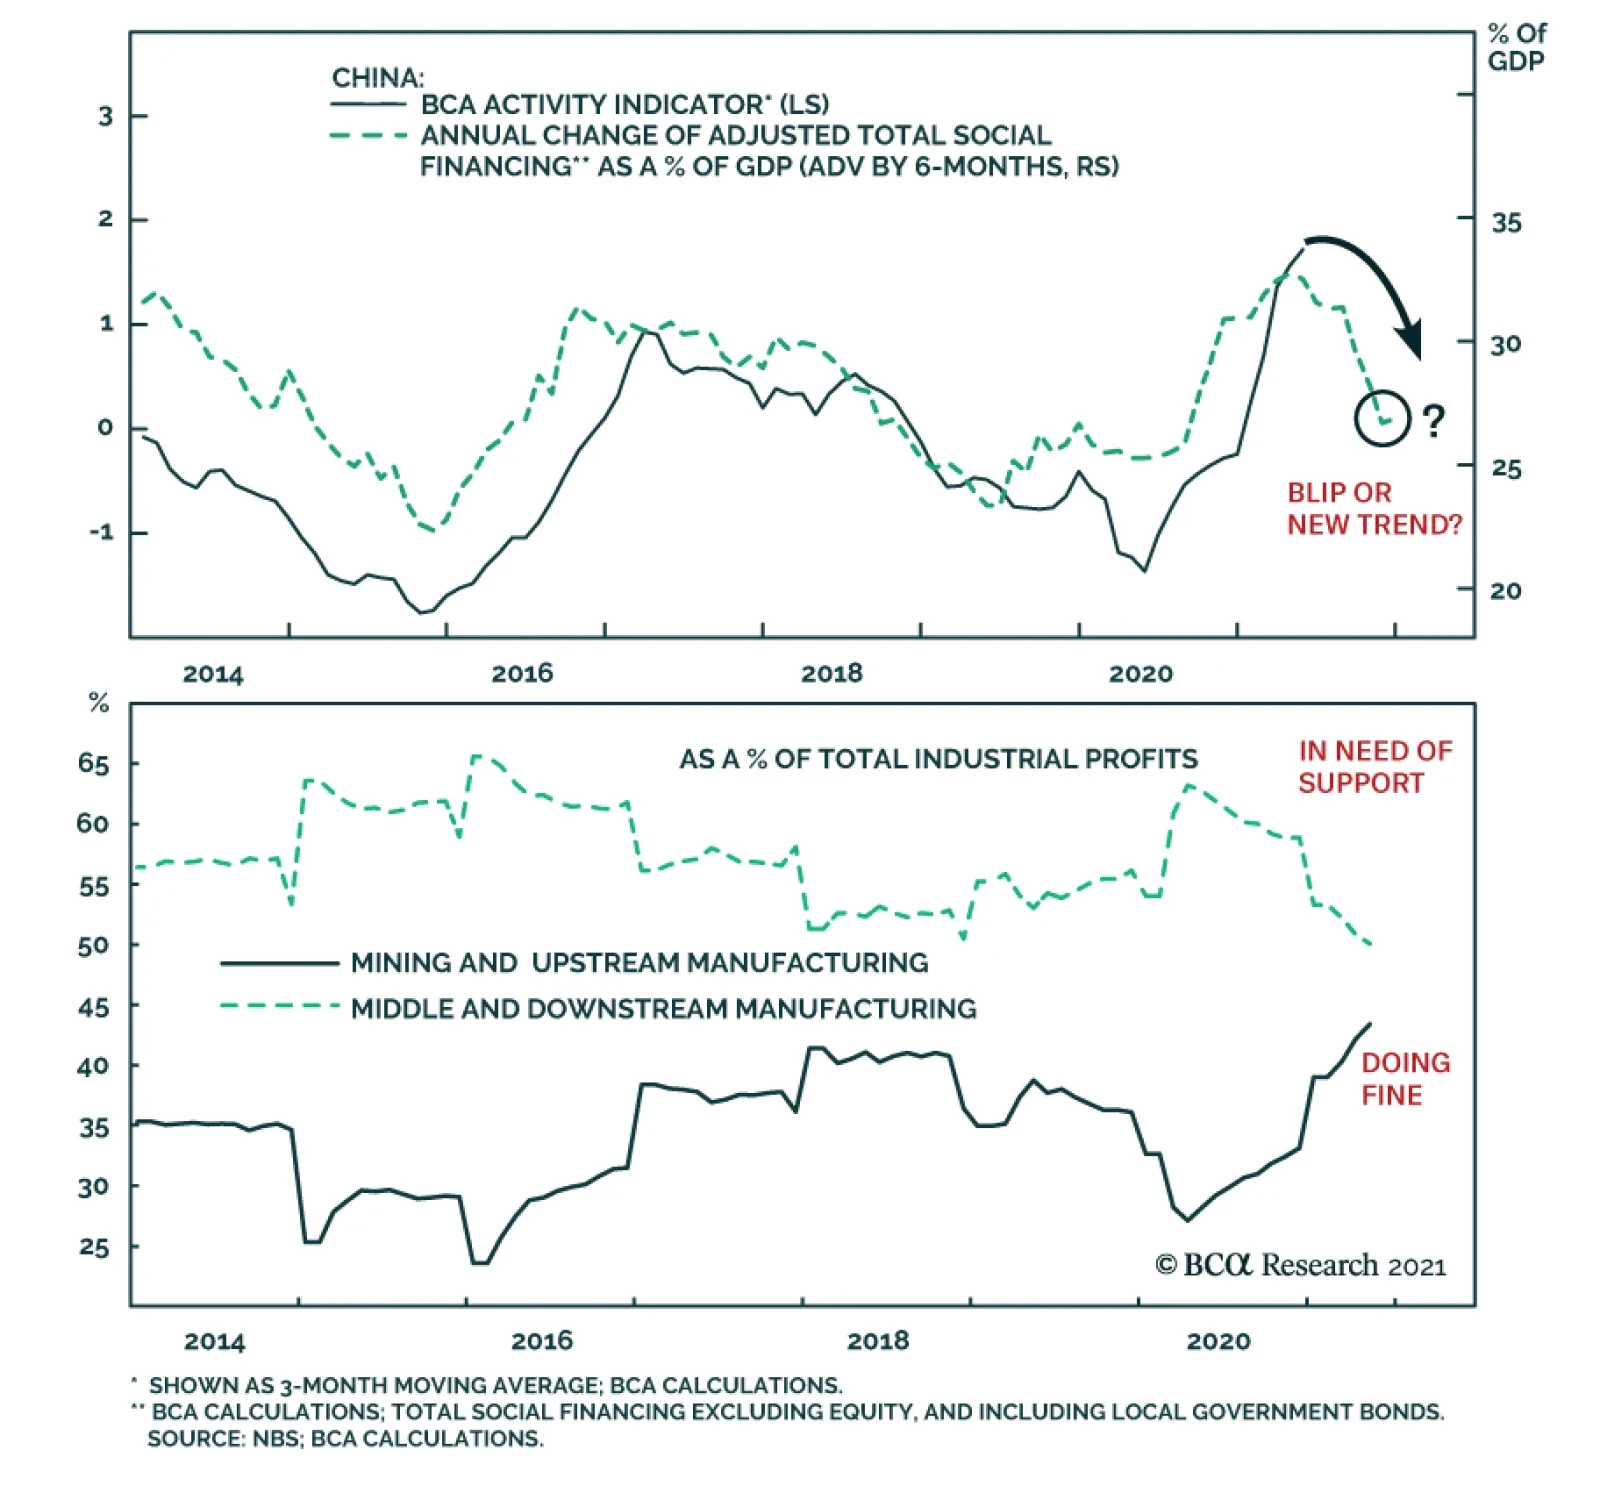
… But Near-Term Headwinds Remain The re-opening of the global economy will allow growth to stay well above trend for the upcoming 12 months, at least. Global industrial activity could nonetheless decelerate this summer. Input costs have risen. The two most important ones, oil and interest rates, are already consistent with a peak in the US ISM manufacturing and the global PMI (Chart 3). In this context, the decelerating Chinese credit impulse is concerning (Chart 4) because it portends a hit to global trade and industrial activity. The effect of this slowdown should be most evident in the third and fourth quarters of 2021. However, it will be temporary because Beijing only wants credit to grow in line with GDP, rather than an outright deleveraging. Thus, the credit impulse will stabilize before the year’s end, which will allow the positive effect of the global re-opening to be fully experienced once again. Chart 3Rising Input Costs...
Rising Input Costs...
Rising Input Costs...
Chart 4...And China's Credit Slowdown Matter
...And China's Credit Slowdown Matter
...And China's Credit Slowdown Matter
Domestic Tailwind In Europe Despite the extreme sensitivity of the European economy to the global business cycle, Europe should continue to produce positive surprises. The supports to the domestic economy are strong. The NGEU funds means that Europe will suffer one of the smallest fiscal drag among G-10 nations next year. Moreover, the re-opening will support household income and allow the positive effect of the increase in the money supply to buoy consumption (Chart 5). Finally, rising consumer confidence, and the ebbing propensity to save will reinforce the tailwinds behind consumption (Chart 6). Chart 5Europe's Domestic Activity
Europe's Domestic Activity
Europe's Domestic Activity
Chart 6...Will Improve Further
...Will Improve Further
...Will Improve Further
Higher Bond Yields Are Coming… The environment continues to support higher yields. Our BCA Pipeline Inflation Indicator is surging, which historically translates into higher global borrowing costs (Chart 7). Most importantly, our Nominal Cyclical Spending Proxy remains very robust, which normally leads to rising yields (Chart 8). While US inflation expectations at the short end of the curve already fully reflect current inflationary pressures, the 5-year/5-year forward inflation breakeven rates will have additional upside. Moreover, the term premium and real rates remain depressed, and policy normalization will cause these variables to climb higher over time. Chart 7Higher Yields Will Come...
Higher Yields Will Come...
Higher Yields Will Come...
Chart 8...Later This Year
...Later This Year
...Later This Year
… But Not This Summer It could take some time before the bearish backdrop for bonds results in higher bond yields. First, bonds have yet to purge fully their oversold status created by the 125 basis-point surge that took place between August 2020 and March 2021 (Chart 9). This vulnerability is even more salient in an environment in which the Chinese credit impulse is decelerating. As Chart 10 illustrates, a slowing total social financing number reliably leads to bond rallies. While the chart looks dire for bond bears, it must be placed in context, in which global fiscal policy remains accommodative considering the decline in the private sector savings rate and in which Advanced Economies’ capex will stay strong. Thus, instead of betting on a large swoon in yields in the coming quarters, we expect US yields to remain stuck between 1.20% and 1.70% for a few more months before they resume their upward path once the Chinese economy stabilizes. Chart 9But Bonds Are Still Oversold...
But Bonds Are Still Oversold...
But Bonds Are Still Oversold...
Chart 10...And Fundamentals Cap Yields For Now
...And Fundamentals Cap Yields For Now
...And Fundamentals Cap Yields For Now
A Positive Cyclical Backdrop For The Euro The near-term forces suggest that the euro will remain range bound over the summer, between 1.16 and 1.23. EUR/USD is a pro-cyclical pair, and so the near-term lack of upside to global growth will act as a temporary ceiling on this currency. Nonetheless, the 18-month outlook continues to favor the common currency. Investors have shed Eurozone exposure for more than 10 years and are structurally underweight this region (Chart 11). Hence, EUR/USD should benefit from any positive reassessment of the growth path in the Euro Area compared to that of the US. Additionally, the euro benefits from a structural current account surplus compared to the USD, which translates into a positive basic balance of payments (Chart 12). In an environment in which US real interest rates are low in relation to foreign ones and in which the Fed wants to maintain accommodative monetary conditions to achieve maximum employment, the capital account balance is unlikely to come to the rescue of the dollar. In this context, EUR/USD still possesses significant cyclical upside and is likely to move back above 1.30 by the year’s end of 2022. Chart 11Investors Underweight Eurozone Assets...
Investors Underweight Eurozone Assets...
Investors Underweight Eurozone Assets...
Chart 12...And The BoP Favors The Euro
...And The BoP Favors The Euro
...And The BoP Favors The Euro
The Bull Market In Global Stocks Is Not Over The cyclical outlook for equities remains supportive. To begin with, in most years, equities eke out positive returns, as long as a recession is not around the corner; we do not expect a recession anytime soon. Moreover, while the balance of valuation risk and monetary accommodation is not as supportive of stocks as it was last year, it is not pointing to an imminent deep pullback either (Chart 13). The equity risk premium echoes this message. Our ERP measure adjusts for the expected growth rate of earnings as well as the lack of stationarity of the ERP. According to this indicator, equities are not an urgent buy, but they are not at risk of a bear market either (Chart 14). This combination does not prevent corrections, but it suggests that pullbacks of 10% are to be bought. Chart 13Equities Are Not A Screaming Buy...
Equities Are Not A Screaming Buy...
Equities Are Not A Screaming Buy...
Chart 14...Nor A Screaming Sell
...Nor A Screaming Sell
...Nor A Screaming Sell
Europe’s Structural Underperformance Is Intact… Eurozone stocks have been underperforming their US counterparts since the GFC. As Chart 15 highlights, this subpar performance reflects the decline in European EPS relative to US ones. There is very little case to be made for this underperformance to end on a structural basis. Europe remains saddled with an excessive capital stock and ageing assets. This combination is weighing on European profit margins and RoE (Chart 16). To put an end to this structural underperformance, either European firms will have to consolidate within each industry (allowing cuts to the excess capital stock, to increase concentration, and to boost profit margins) or the regulatory burden must rise in the US to curtail rates of returns in relation to European levels. Chart 15Europe's Underperformance...
Europe's Underperformance...
Europe's Underperformance...
Chart 16...Reflects Profitability Problems
...Reflects Profitability Problems
...Reflects Profitability Problems
…But The Window For A Cyclical Outperformance Remains Open Despite a challenging structural backdrop, European equities have a window to outperform US stocks, similar to the outperformance of Japan from 1999 to 2006, which only marked a pause within a prolonged relative bear market. European stocks beat their US counterparts when global yields rise (Chart 17). This is because European benchmarks underweight growth stocks relative to US markets. The effect of higher yields on the relative performance of the Euro Area is not limited to the impact of higher discount rates. Yields rise when global economic activity is above trend. As Chart 18 highlights, robust readings of our Global Growth Indicator correlate with an outperformance of the EPS of value stocks compared to growth equities. Thus, when rates rise, Europe should enjoy both a period of re-rating relative to the US and stronger profits. Chart 17Yields Drive European Stocks...
Yields Drive European Stocks...
Yields Drive European Stocks...
Chart 18...And So Does Global Growth
...And So Does Global Growth
...And So Does Global Growth
Positives For Euro Area Financials Like the broad European market, the financials’ fluctuations are linked to interest rates. Moreover, Euro Area banks also move in line with EUR/USD (Chart 19). As a result, our positive view on both yields and the euro for the next 18 months or so should translate into an outperformance of financials in Europe. Additionally, European banks are inexpensive, embedding not just depressed long-term growth expectations, but also a wide risk premium. Europe’s structural problems mean that investors are correct to expect poor earnings growth from the region’s banks. However, the risk premium is overdone. Eurozone banks are much safer than they were 10 years ago. Banks now sport significantly higher Tier 1 capital adequacy ratios and NPLs have shrunk considerably (Chart 20). Moreover, governmental supports and credit guarantees implemented during the pandemic should limit the upside to NPL in the coming quarters. Finally, the so-called doom-loop that used to bind government and bank solvency together is not as problematic as it once was, because the ECB is a willing buyer of government paper and the NGEU programs create the embryo of fiscal risk sharing that limit these dynamics. As a result, investors should overweight this sector for the next 18 months. Chart 19Financials Have A Window To Shine...
Financials Have A Window To Shine...
Financials Have A Window To Shine...
Chart 20...And Are Less Risky
...And Are Less Risky
...And Are Less Risky
A Tactical Hedge Our worries about the impact on the global economy of the Chinese credit slowdown are likely to prompt some downside in European cyclical equities relative to defensive ones. Moreover, cyclicals are still significantly overbought relative to defensives, while our relative Combined Mechanical Valuation Indicator confirms the near-term threat (Chart 21). A high-octane vehicle to play this tactical underperformance of cyclicals relative to defensives is to buy Euro Area telecom stocks relative to consumer discretionary equities. Not only are the discretionary stocks massively overbought and expensive relative to telecoms (Chart 22), they also offer a lower RoE. This backdrop makes the short discretionary / long telecoms bet a great hedge for portfolios with a pro-cyclical bias over one- to two-year horizons. Chart 21Cyclicals Are Tactically Vulnerable...
Cyclicals Are Tactically Vulnerable...
Cyclicals Are Tactically Vulnerable...
Chart 22...But This Risk Can Be Hedged Away
...But This Risk Can Be Hedged Away
...But This Risk Can Be Hedged Away
Currency Performance Currency Performance
Summer Charts
Summer Charts
Fixed Income Performance Government Bonds
Summer Charts
Summer Charts
Corporate Bonds
Summer Charts
Summer Charts
Equity Performance Major Stock Indices
Summer Charts
Summer Charts
Geographic Performance
Summer Charts
Summer Charts
Sector Performance
Summer Charts
Summer Charts
Chinese credit numbers came in rather higher than expected. Total Social Finance (TSF) grew by RMB3.7 trillion in June, compared to RMB1.9 trillion in May and expectations of RMB2.9 trillion. At the same time, outstanding loan growth accelerated to 12.3%…
One of the structural challenges Brazil faces is its public debt overhang. The authorities have responded by periodically embarking on fiscal and monetary austerity. Yet, such austerity depresses nominal growth and has in fact worsened public debt dynamics. …
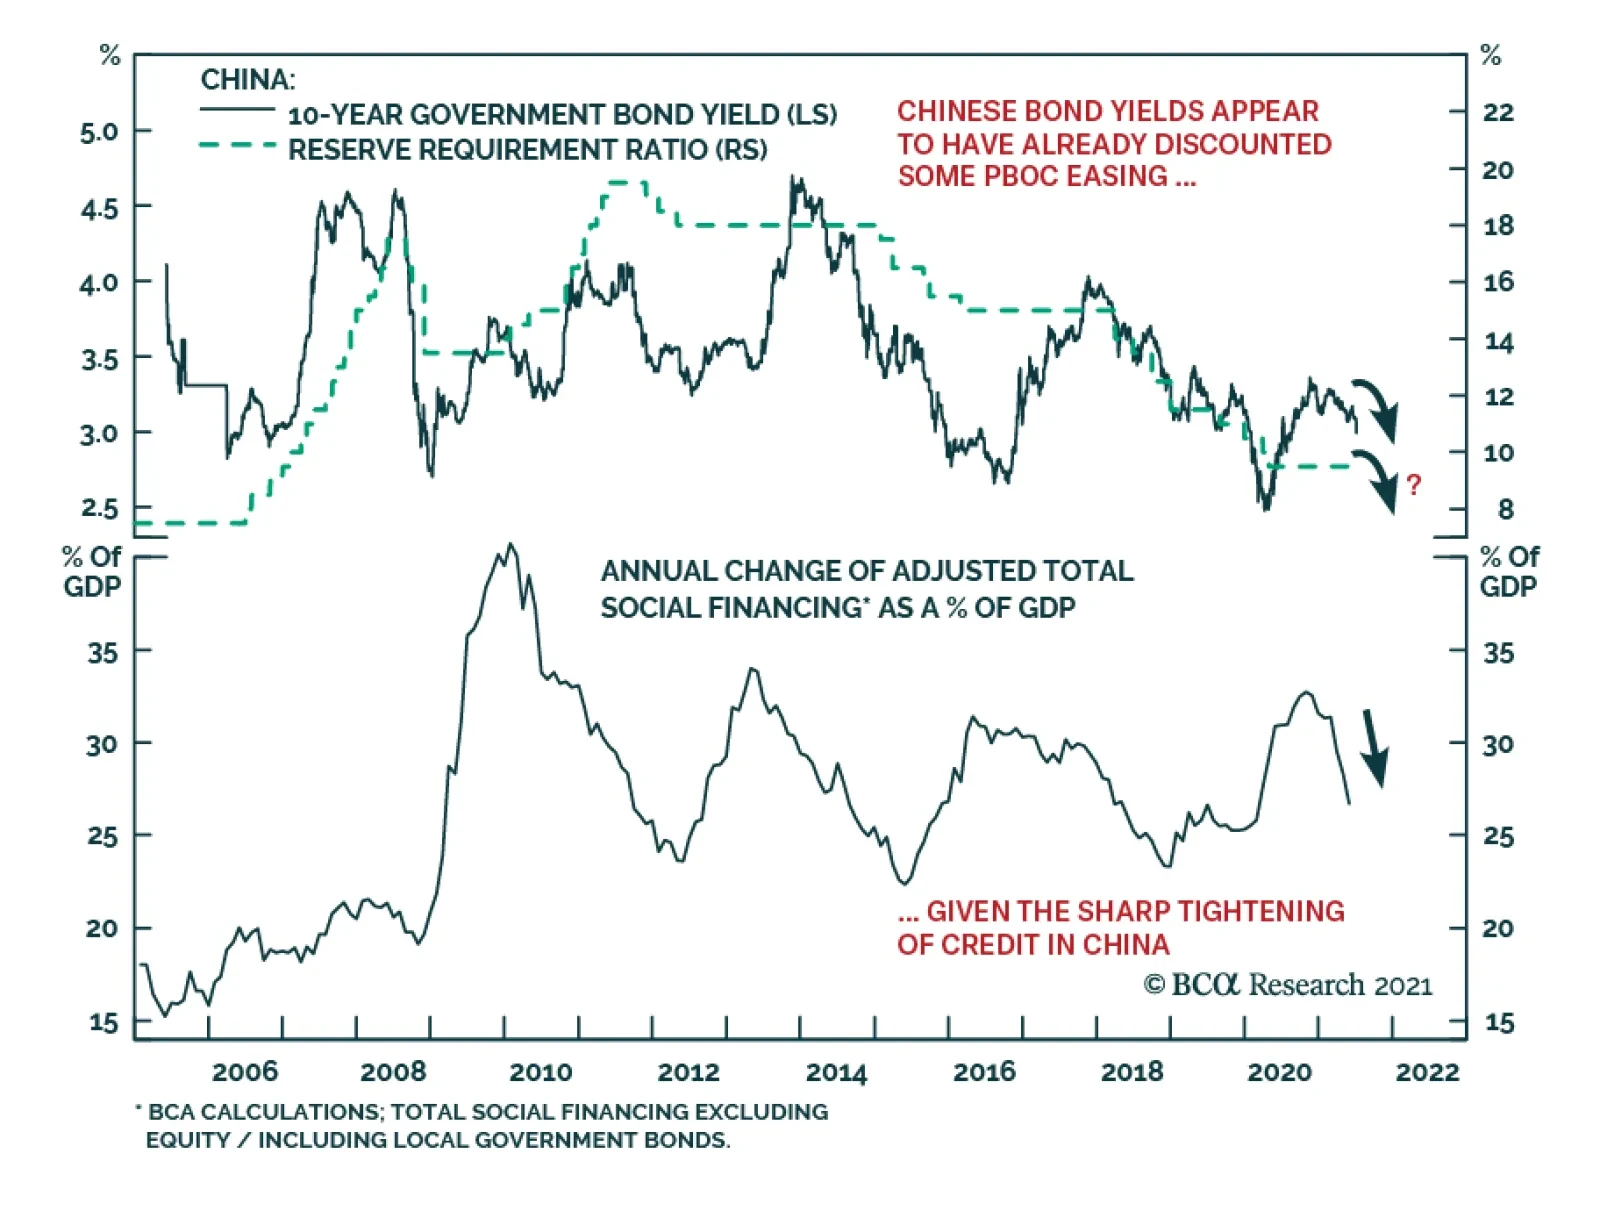
The China State Council meeting on July 7, chaired by Premier Li Keqiang, sent a somewhat ambiguous message on the direction of China’s monetary policy. The press release from the meeting stated that the country will “use monetary policy tools in a timely…

In their Q2/2021 model bond portfolio performance review, BCA Research’s Global Fixed Income Strategy team updated their recommended positioning for the next six months. Firstly, the team changed its US Treasury curve exposure to have more of a flattening…
Highlights Over the short term – 1-2 years – the pick-up in re-infection rates in Asia and LatAm states with large-scale deployments of Sinopharm and Sinovac COVID-19 vaccines will re-focus attention on demand-side risks to the global recovery (Chart of the Week). The UAE-Saudi impasse re extending the return of additional volumes of OPEC 2.0 spare capacity to the oil market over 2H21 will be short-lived. The UAE's official baseline production will be increased to 3.8mm b/d from 3.2mm b/d presently, and its output in 2H21 will be adjusted accordingly. Over the medium term – 3-5 years out – the risk to the expansion of metal supplies needed for renewables and electric vehicles (EVs) will rise, as left-of-center governments increase taxes and royalties, and carbon prices move higher. Rising metals costs will redound to the benefit of oil and gas producers, and accelerate R+D in carbon- and GHG-reduction technologies. Longer-term – 5-10 years out – the active discouragement of investment in hydrocarbons will contribute to energy shortages. In anticipation of continued upside volatility in commodity prices and share values of oil, gas and metals producers, we remain long the S&P GSCI and COMT ETF, and long equities of producers and traders via the PICK ETF. Feature Our conversations with clients almost invariably leads us to considering the risks to our long-standing bullish views for energy and metals. This week, we reprise some of the highlights of these conversations. In the short term, our bullish call on oil is underpinned by the assumption of continued expansion in vaccinations, which we believe will lead to global economic re-opening and increased mobility, as the world emerges from the devastation of COVID-19. This expectation is once again under scrutiny. On the supply side, the very public negotiations undertaken by the UAE and the leaders of OPEC 2.0 – the Kingdom of Saudi Arabia (KSA) and Russia – over re-basing the UAE's production reminds investors there is substantial spare capacity from the coalition available for the market over the short term. The slow news cycle going into the US Independence Day holiday certainly was a fortuitous time to make such a point. Chart of the WeekWorrisome Uptick Of COVID-19 Cases
Assessing Risks To Our Commodity Views
Assessing Risks To Our Commodity Views
KSA-UAE Supply-Side Worries The abrupt end to this week's OPEC 2.0 meeting was unsettling to markets. Shortly after the meeting ended – without being concluded – officials from the Biden administration in the US spoke with officials from KSA and the UAE, presumably to encourage resolution of outstanding issues and to get more oil into the market to keep crude oil prices below $80/bbl (Chart 2). We're confident the KSA-UAE impasse re extending the return of additional volumes of spare capacity to the oil market over 2H21 will be short-lived. The UAE's official baseline production number (i.e., its October 2018 output level) will be increased to 3.8mm b/d from 3.2mm b/d presently, and its output in 2H21 will be adjusted accordingly. Coupled with a likely return of Iranian export volumes in 4Q21, this will bring prices down into the mid- to high-$60/bbl range we are forecasting. Chart 2US Pushing For Resolution of KSA-UAE Spat
US Pushing For Resolution of KSA-UAE Spat
US Pushing For Resolution of KSA-UAE Spat
Longer term, markets are worried this incident is a harbinger of a breakdown in OPEC 2.0's so-far-successful production-management strategy, which has lifted oil prices 200% since their March 2020 nadir. At present, the producer coalition has ~ 6-7mm b/d of spare capacity, which resulted from its strategy to keep the level of supply below demand. A breakdown in this discipline – in extremis, another price war of the sort seen in March 2020 or from 2014-2016 – could plunge oil markets into a price collapse that re-visits sub-$40/bbl levels. In our view, economics – specifically the cold economic reality of the price elasticity of supply – continues to work for the OPEC 2.0 coalition: Higher revenues are realized by members of the group as long as relatively small production cuts produce larger revenue gains – e.g., a 5% (or less) cut in production that produces a 20% (or more) increase in price trumps a 20% increase in production that reduces prices by 50%. Besides, none of the members of the coalition possess the wherewithal to endure another shock-and-awe display from KSA similar to the one following the breakdown of the March 2020 OPEC 2.0 meeting. We also continue to expect US shale-oil producers to be disciplined by capital markets, and to retain a focus on providing competitive returns to their shareholders, which will limit supply growth to that which maintains profitability. Until we see actual evidence of a breakdown in the coalition's willingness to maintain its production-management strategy, we will continue to assume it remains operative. Worrisome COVID-19 Re-Infection Trends Reports of increased re-infection rates in Latin American and Asia-Pacific states providing Chinese Sinopharm and Sinovac COVID-19 vaccines will re-focus attention on demand-side risks to the global recovery. Conclusive data on the efficacy of these vaccines is not available at present, based on reporting from Health Policy Watch (HPW).1 The vast majority of these vaccines were purchased in Latin America and the Asia-Pacific region, where ~ 80% of the 759mm doses of the two Chinese vaccines were sold, according to HPW's reporting. This will draw the attention of markets to this risk (Chart 3). Of particular concern are the increases in re-infection rates in the Seychelles and Chile, where the majority of populations in both countries were inoculated with one of the Chinese vaccines. Re-infections in Indonesia also are drawing attention, where more than 350 healthcare workers were re-infected after receiving the Sinovac vaccination.2 The risk of renewed global lockdowns remains small, but if these experiences are repeated globally with adverse health consequences, this assessment could be challenged. Chart 3COVID-19 Returning In High-Vaccination States
Assessing Risks To Our Commodity Views
Assessing Risks To Our Commodity Views
Transition Risks To A Low-Carbon Economy Over the medium- to long-terms, our metals views are premised on the expectation the build-out of the global EV fleet and renewable electricity generation – including its supporting grids – will require massive increases in the supply of copper, aluminum, nickel, and tin, not to mention iron ore and steel. This surge in demand will be occurring as governments rush headlong into unplanned and unsynchronized wind-downs of investment in the hydrocarbon fuels that power modern economies.3 The big risk here is new metal supplies will not be delivered fast enough to build all of the renewable generation, EVs and their supporting grids and infrastructures to cover the loss of hydrocarbons phased out by policy, legal and boardroom challenges. Such a turn of events would re-invigorate oil and gas production. Renewable energy and electric vehicles are the sine qua non of the drive to achieve net-zero carbon emissions by 2050. However, the rising price of base metals will add to already high costs of rebuilding power grids to make them suitable for green energy. Given miners’ reluctance to invest in new mines, we do not expect metals prices to drop anytime soon. According to Wood Mackenzie, in 2019 the cost of shifting just the US power grid to renewable energy over the next 10 years will amount to $4.5 trillion.4 Given these cost and supply barriers, fossil fuels will need to be used for longer than the IEA outlined in its recent and controversial report on transitioning to a net-zero economy.5 To ensure that fossil fuels can be used while countries work to achieve their net zero goals, carbon capture utilization and storage (CCUS) technology will need to be developed and made cheaper. The main barrier to entry for CCUS technology is its high cost (Chart 4). However, like renewable energy, the more it is deployed and invested in, the cheaper it will become, following the trend seen in the development of renewable energy and EVs, which were aided by large-scale subsidies from governments to encourage the development of the technology. These cost reductions are already visible: In its 2019 report, the Global CCS Institute noted the cost of implementing CCS technology initially used in 2014 had fallen by 35% three years later. Chart 4CCUS Can Be Expensive
Assessing Risks To Our Commodity Views
Assessing Risks To Our Commodity Views
Metals Mines' Long Lead Times In 2020 the total amount of discovered copper reserves in the world stood at ~ 870mm MT (Chart 5), according to the US Geological Service (USGS). As of 2017, the total identified and undiscovered amount of reserves was ~ 5.6 billion MT.6 The World Bank recently estimated additional demand for copper would amount to ~ 20mm MT p.a. by 2050 (Chart 6).7 Glencore’s recently retired CEO Ivan Glasenberg last month said that by 2050, miners will need to produce around 60mm MT p.a. of copper to keep up with demand for countries’ net zero initiatives.8 Even with this higher estimate, if miners focus on exploration and can tap into undiscovered reserves, supply will cover demand for the renewable energy buildout. Chart 5Copper Reserves Are Abundant
Assessing Risks To Our Commodity Views
Assessing Risks To Our Commodity Views
Chart 6Call On Base Metals Supply Will Be Massive Out To 2050
Assessing Risks To Our Commodity Views
Assessing Risks To Our Commodity Views
While recent legislative developments in Chile and Peru, which together constitute ~ 34% of total discovered copper reserves, could lead to significantly higher costs as left-of-center governments re-write these states' constitutions, geological factors would not be the main constraint to copper supply for the renewables energy buildout: Even if copper mining companies were to move out of these two countries, there still is about 570 million MT in discovered copper reserves, and nearly ten times that amount in undiscovered reserves. As we have written in the past, capital expenditure restraint is the principal reason the supply side of copper markets – and base metals generally – is challenged (Chart 7). Unlike in the previous commodity boom, this time mining companies are focusing on providing returns to shareholders, instead of funding the development of new mines (Chart 8). Chart 7Copper Prices Remains Parsimonious
Copper Prices Remains Parsimonious
Copper Prices Remains Parsimonious
Chart 8Shareholder Interests Predominate Metals Agendas
Assessing Risks To Our Commodity Views
Assessing Risks To Our Commodity Views
Of course, it is likely metals miners, like oil producers, are waiting to see actual demand for copper and other base metals pick up before ramping capex. Sharp increases in forecasted demand is not compelling for miners, at this point. This means metals prices could stay elevated for an extended period, given the 10-15-year lead times for copper mines (Chart 9). For example, the Kamoa-Kakula mine in the Democratic Republic of Congo (DRC) now being brought on line took roughly 24 years of exploration and development work, before it started producing copper. Technological breakthroughs that increase brownfield projects’ productivity, or significant increases in the amount of recycled copper as a percent of total copper supply would address some of the price pressures arising from the long lead times associated with the development of new copper supply. Another scenario with a non-trivial probability that threatens the viability of metals investing is a breakthrough – or breakthroughs – in CCUS technology, which allows oil and gas producers to remove enough carbon from their fuels to allow firms using these fuels to achieve their net-zero carbon goals. Chart 9Long Lead Times For Mine Development
Assessing Risks To Our Commodity Views
Assessing Risks To Our Commodity Views
Investment Implications Short-term supply-demand issues affecting the oil market at present are transitory, and do not signal a shift in the fundamentals supporting our bullish call on oil. Our thesis based on continued production discipline remains intact. That said, we will continue to subject it to rigorous scrutiny on a continual basis. Our average Brent forecast for 2021 remains $66.50/bbl, with 2H21 prices averaging $70/bbl. For 2022 and 2023 we continue to expect prices to average $74 and $81/bbl, respectively (Chart 10). WTI will trade $2-$3/bbl lower. Our metals view has become slightly more nuanced, thanks to our client conversations. One of the unintended consequences of the unplanned and uncoordinated rush to a net-zero carbon future will be an improvement in the competitive position of oil and gas as transportation fuels and electric-generation fuels going forward. This will be driven by rising costs of developing and delivering the metals supplies needed to effect the net-zero transition. We expect markets will provide incentives to CCUS technologies and efforts to decarbonize oil and gas fuels, which will contribute to the global effort to arrest rising temperatures. This suggests the rush to sell these assets – which is underway at present – could be premature.9 In the extreme, this could be a true counterbalance to the metals story, if it plays out. Chart 10Our Oil Price View Remains Intact
Our Oil Price View Remains Intact
Our Oil Price View Remains Intact
Robert P. Ryan Chief Commodity & Energy Strategist rryan@bcaresearch.com Ashwin Shyam Research Associate Commodity & Energy Strategy ashwin.shyam@bcaresearch.com Commodities Round-Up Energy: Bullish The monthly OPEC 2.0 meeting ended without any action to increase monthly supplies, following the UAE's bid to increase its baseline reference production – determined based on October 2018 production levels – to 3.8mm b/d, up from 3.2mm b/d. S&P Global Platts reported the UAE's Energy Minister, Suhail al-Mazrouei, advanced a proposal to raise its monthly production level under the coalition's overall output deal, while KSA's energy minister, Prince Abdulaziz bin Salman, insisted the UAE follow OPEC 2.0 procedures in seeking an output increase. We do not expect this issue to become a protracted standoff between these states. The disagreement between the ministers is procedural to substantive. Remarks by bin Salman last month – to wit, KSA has a role in containing inflation globally – and his earlier assertions that production policy of OPEC 2.0 would be driven by actual oil demand, as opposed to forecasted oil demand, suggest the Kingdom is not aiming for higher oil prices per se. Base Metals: Bullish Spot benchmark iron ore (62 Fe) prices traded above $222/MT this week in China on the back of stronger steel demand, according to mining.com (Chart 11). Market participants are anticipating further steel-production restrictions and appear to be trying to get out in front of them. Precious Metals: Bullish The USD rally eased this week, allowing gold prices to stabilize following the June Federal Open Market Committee (FOMC) meeting. In the two weeks since the FOMC, our gold composite indicator shows that gold started entering oversold territory (Chart 12). We believe gold prices will start correcting upwards, expecting investor bargain-hunting to pick up after the price drop. The mixed US jobs report, which showed the unemployment rate ticked up more than expected, implies that interest rates are not going to be raised soon. Our colleagues at BCA Research's US Bond Strategy (USBS) expect rates to increase only by end-2022.10 This, along with slightly higher odds of a potential COVID-19 resurgence, will support gold prices in the near-term. Ags/Softs: Neutral The USDA's Crop Progress report for the week ended 4 July 2021 showed 64% of the US corn crop was in good to excellent condition, down from the 71% reported for the comparable 2020 date. The Department reported 59% of the bean crop was in good to excellent shape vs 71% the year earlier. Chart 11
BENCHMARK IRON ORE 62% FE, CFR CHINA (TSI) GOING DOWN
BENCHMARK IRON ORE 62% FE, CFR CHINA (TSI) GOING DOWN
Chart 12
Sentiment Supports Oil Prices
Sentiment Supports Oil Prices
Footnotes 1 Please see Are Chinese COVID Vaccines Underperforming? A Dearth of Real-Life Studies Leaves Unanswered Questions, published by Health Policy Watch, June 18, 2021. 2 According to HPW, the World Health Organization's Emergency Use Listing for these two vaccines "were unique in that unlike the Pfizer, AstraZeneca, Moderna, and Jonhson & Johonson vaccines that it had also approved, neither had undergone review and approval by a strict national or regional regulatory authority such as the US Food and Drug Administration or the European Medicines Agency. Nor have Phase 3 results of the Sinopharm and Sinovac trials been published in a peer-reviewed medical journal. More to the point, post-approval, any large-scale tracking of the efficacy of the Sinovac and Sinopharm vaccine rollouts by WHO or national authorities seems to be missing." 3 Please see A Perfect Energy Storm On The Way, which we published on June 3, 2021 for additional discussion. It is available at ces.bcaresearch.com. 4 Please refer to The Price of a Fully Renewable US Grid: $4.5 Trillion, published by greentechmedia 28 June 2019. 5 Please refer to the IEA's Net Zero By 2050, published in May 2021. 6 Please refer to USGS Mineral Commodity Summaries, 2021. 7 Please refer to Minerals for Climate Action: The Mineral Intensity of the Clean Energy Transition, published by the World Bank. 8 Please refer to Copper supply needs to double by 2050, Glencore CEO says, published by reuters.com on June 22, 2021. 9 Please see the FT's excellent coverage of this trend in A $140bn asset sale: the investors cashing in on Big Oil’s push to net zero published on July 6, 2021. 10 Please refer to Watch Employment, Not Inflation, published by the USBS on June 15, 2021. Investment Views and Themes Strategic Recommendations Tactical Trades Commodity Prices and Plays Reference Table Trades Closed in 2021 Summary of Closed Trades
Image
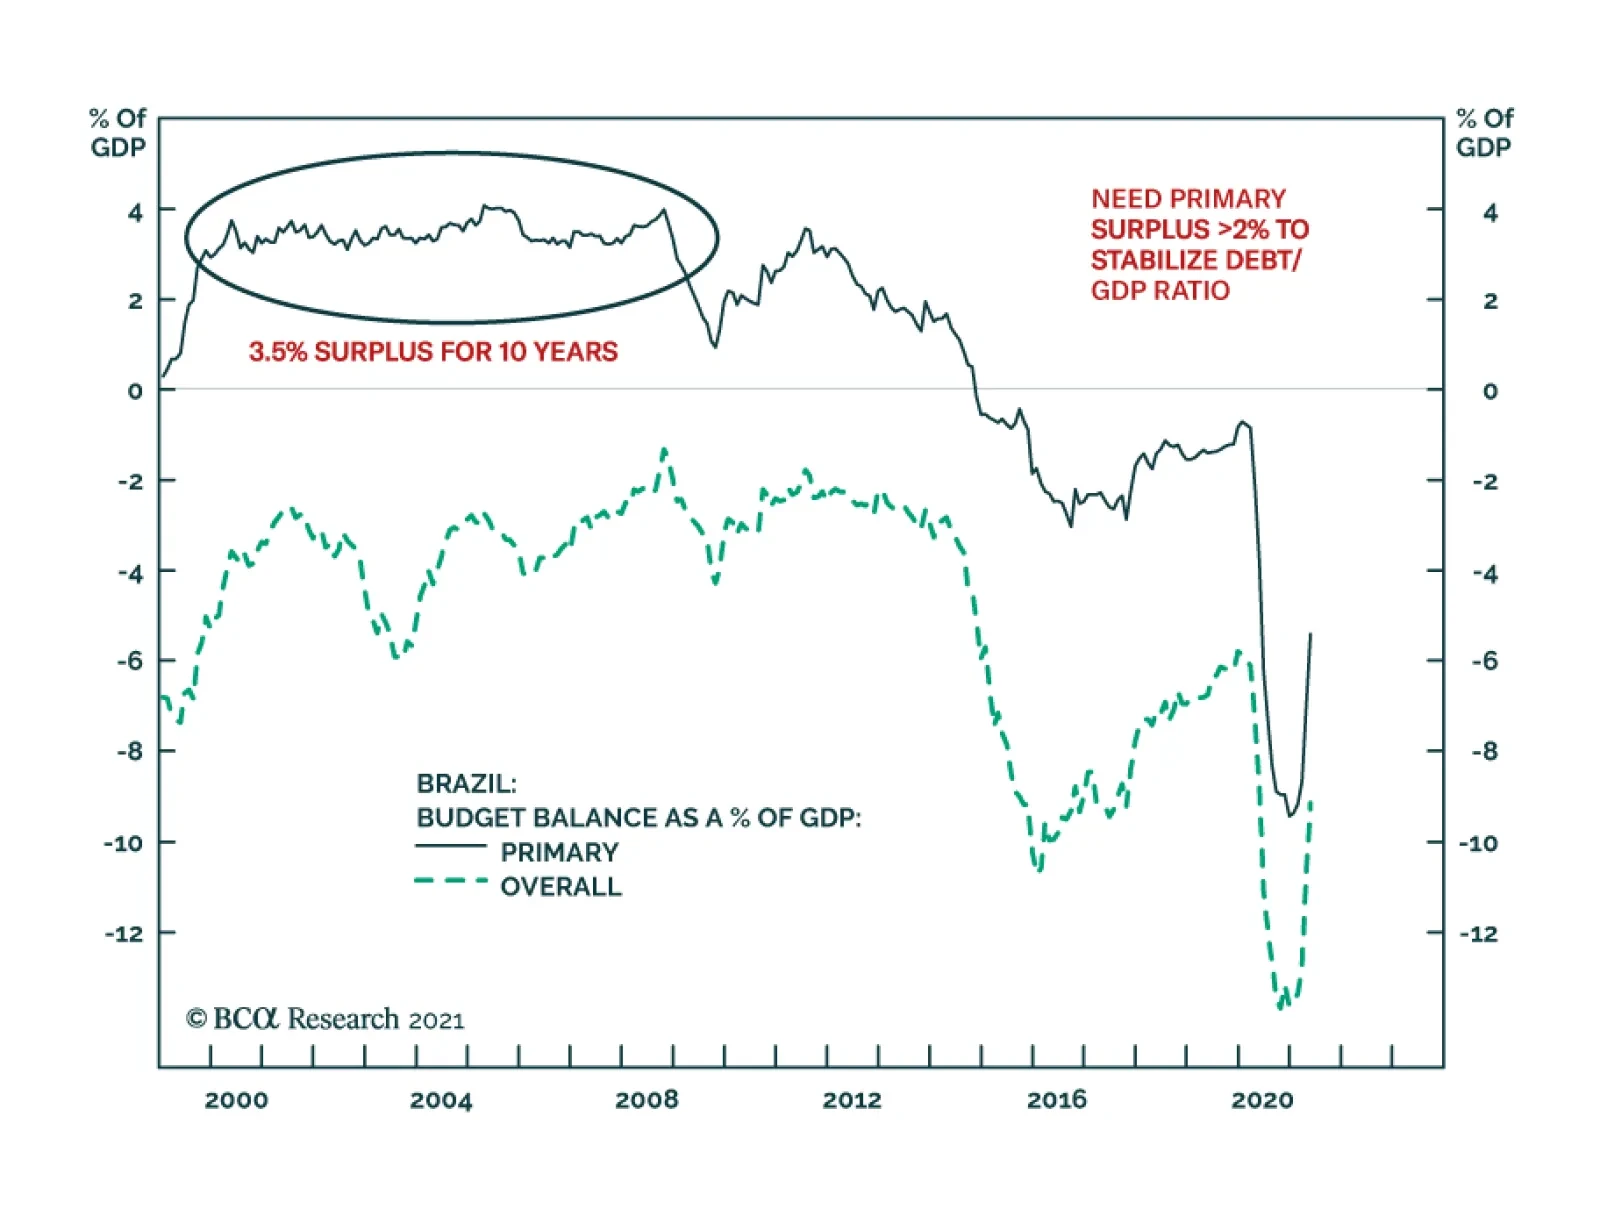
Please note: There will be no Strategy Report next week, July 15. Our next publication will be a Thematic: Charts That Matter, on July 22. Highlights For any country with local currency public debt, the ultimate constraints to lower debt burden and service debt are the magnitude of inflation overshoot and/or currency depreciation that authorities are willing to tolerate. What makes Brazil’s public debt untenable is not the level of debt but the very high domestic interest rates. Growing odds of Lula’s victory in the next presidential election in October 2022 entail an eventual shift to more pro-growth fiscal and monetary policies in Brazil. The upshot of these policies will be higher inflation and chronic currency depreciation. Brazilian share prices will likely rally on the back of high nominal growth over the coming years. Yet, currency depreciation will dampen equity returns for international investors. Absolute-return investors with a medium- and long-term horizon should consider going long stocks and shorting the BRL. Feature One of the structural challenges Brazil faces is the public debt overhang. Fiscal and monetary authorities have responded by periodically embarking on fiscal and monetary austerity. Yet, such austerity depresses nominal growth and has in fact worsened public debt dynamics. Can Brazil break out of the vicious circle that has held the economy in check for the past several years? We suspect that authorities will ultimately move away from fiscal and monetary tightening despite the large public debt overhang. Abandoning fiscal and monetary austerity will boost growth. However, these policies will entail higher inflation and currency depreciation. Such a macro shift warrants the following long-term investment strategy in Brazil: going long stocks and shorting the real. Policymakers’ Ultimate Constraint For any country with local currency public debt, the ultimate constraints to lower debt burden and service debt are the magnitude of inflation overshoot and/or currency depreciation that authorities are willing to tolerate. In Brazil, such a policy trade-off is pertinent because productivity-boosting structural reforms – that could lift its potential GDP growth rate – are not realistic in the foreseeable future. We discuss the political landscape and economic policies in detail below. Chart 1Sufficient Fiscal Tightening To Stabilize Public Debt Is Not Politically Feasible
Can Brazil Break Out Of A Vicious Circle?
Can Brazil Break Out Of A Vicious Circle?
As we have written previously, any country with predominantly local currency public debt can stabilize the debt-to-GDP ratio by either (1) running continuous sizable primary surpluses or (2) having nominal GDP growth consistently above the interest rate on government debt. The former is politically unfeasible in Brazil because it requires such substantial fiscal tightening that no government can deliver (Chart 1). The second criteria of having nominal GDP to grow meaningfully above government borrowing costs cannot be achieved in Brazil without major government stimulus to boost nominal GDP while also capping local bond yields. Although the nation’s nominal GDP growth has recently improved at about 6.5-7%, its underlying trend is still below government borrowing costs in local currency at 8% (Chart 2). Chart 2Brazil Needs Higher Nominal GDP Growth And Lower Domestic Bond Yields
Can Brazil Break Out Of A Vicious Circle?
Can Brazil Break Out Of A Vicious Circle?
If and as the central bank (BCB) continues to hike policy rate, government effective borrowing costs will rise. The basis is that in recent years, the government has drastically increased the share of short-term local currency debt. Consequently, as the BCB raises the SELIC rate and as the government has to roll over maturing short-term bonds, its borrowing costs will rise. Chart 3Various Measures Of Public Debt
Can Brazil Break Out Of A Vicious Circle?
Can Brazil Break Out Of A Vicious Circle?
On the whole, we consider that in the medium and long run, Brazil’s nominal GDP growth will need to hover at higher levels (say, 9-10%) for it to meaningfully exceed government borrowing costs of 8%. This is the only politically feasible option to achieve public debt sustainability in Brazil. Yet, this entails persistent inflation of 7-8%. Provided that Brazil’s labor force growth will be 0.5% in the coming years, and if we assume underlying productivity growth of 1.5%, the potential (real) GDP growth is probably around 2%. Hence, to achieve nominal GDP growth of 9-10%, inflation should average 7-8%. This is only possible if fiscal and monetary policies become very stimulative. Why does Brazil need to stabilize the public debt-to-GDP ratio? The reason is that the latter is at levels where debt servicing consumes 4% of GDP or 26% of federal government spending. A higher debt-to-GDP ratio will devour more resources. With fiscal spending straightjacketed by the Fiscal Responsibility Law, rising debt servicing will curb non-interest government spending and, thus, economic growth. There are different measures of the nation’s public debt. The Brazilian central bank’s measure stands at 87% of GDP while the IMF’s measure stands at 97% of GDP. The difference is that the IMF includes all government securities held by the central bank while the BCB excludes non-repo government securities held by the BCB from its public debt calculation (please see Chart 3 and Box 1 for more information and analysis). BOX 1 What Is The Correct Measure Of Brazil’s Public Debt? The key difference between the IMF and BCB calculations of Brazil’s public debt is the way these account for government securities held by the central bank. The BCB’s measure of public debt includes its holdings of government securities used in repo operations – they amount to 15% of GDP – but excludes the ones for non-repo operations – equivalent to 10% of GDP. The IMF measure includes all government securities held by the central bank (Chart 3). Each of these two measures has its pros and cons. We will not get into technical details as to which one is superior because from a big picture perspective the precise level of public debt and how to measure it are not significant. We have three considerations concerning this point: The reason why Brazil needs to reduce the public debt-to-GDP ratio is that interest payments on public debt consume 4% of GDP or 26% of federal government spending. This is hurting Brazil’s development. The government needs to divert spending to other programs to lift the nation’s growth trajectory. “High public debt” is a relative concept and this metric should be compared with the identical measures of other countries. Given the Brazilian central bank’s large holdings of government bonds, it makes sense to compare Brazil with the US and Japan where their respective central banks also own large shares of government bonds and notes. As Chart 3 reveals, if one were to exclude the central bank’s holdings of government securities from public debt, the public debt-to-GDP ratio would be 70% in Brazil, 105% in the US and 125% in Japan. Finally, if investor concern is public debt monetization by the central bank and commercial banks, the focal point of analysis should be the level of and trend in broad money supply not the level of public debt. Chart 4 suggests that broad money supply as a share of GDP in Brazil is somewhat elevated but not very high compared with other nations. Bottom Line: What makes Brazil’s public debt untenable is not the level of debt but the very high domestic interest rates. Brazil needs much lower interest rates – potentially via financial repression – to ensure public debt sustainability. In turn, financial repression/suppression of interest rates will cause considerable currency deprecation. Chart 4Broad Money Supply-to-GDP Ratios: A Cross Country Perspective
Can Brazil Break Out Of A Vicious Circle?
Can Brazil Break Out Of A Vicious Circle?
Yet, whether the level of public debt is 87% of GDP or 97% does not really matter. If neither of the above two criteria of public debt sustainability is satisfied, the government debt-to-GDP ratio will continue rising with negative ramifications for growth in Brazil. Chart 5Brazil: Broad Money (M4) Growth And Impulse
Can Brazil Break Out Of A Vicious Circle?
Can Brazil Break Out Of A Vicious Circle?
While Brazil needs higher nominal growth, local bond yields must also be capped well below nominal GDP growth. If local and foreign creditors are reluctant to finance the government at yields lower than nominal GDP growth, the central bank and/or commercial banks could fill in the gap and purchase domestic bonds. In doing so, the central bank and commercial banks would create more deposits/money supply and, thereby, ceteris paribus exert downward pressure on the exchange rate. As we have argued in previous reports, in any country, when the central bank and commercial banks purchase securities from non-banks, they create money/deposits “out of thin air.” Hence, national savings are not a constraint for the central bank and for commercial banks to finance the government and bring down government bond yields. The primary indicator to monitor whether Brazil is beginning to run more stimulative policies is the M4, the broadest measure of money supply in Brazil. It reflects the monetary and fiscal policy stance as well as captures debt monetization. Chart 5 illustrates Brazil’s M4 annual growth rate (the top panel) and its impulse – calculated as the second derivative (the bottom panel). The M4 impulse reflects how stimulative both monetary and fiscal policies are at any point in time. The spike in the M4 impulse last year reflected large fiscal stimulus and aggressive monetary easing by the central bank. Chart 6Brazil Is Going Through Large Fiscal Tightening
Can Brazil Break Out Of A Vicious Circle?
Can Brazil Break Out Of A Vicious Circle?
For now, the M4 impulse will continue falling because monetary policy is tightening and the fiscal thrust is estimated by the IMF to be -5% of GDP this year and -1% in 2022 (Chart 6). Bottom Line: The only chance for Brazil to stabilize public debt dynamics is to run loose monetary and fiscal policies. In short, Brazil needs to inflate its way out of public debt. The outcome will be currency depreciation yet strong nominal growth that will produce higher share prices in local currency terms. Former president Lula’s PT (Workers’ Party) and its economic policies put Brazil’s government finances on an unsustainable trajectory ten years ago. Ironically, it could be Lula’s comeback as president that could address the issue of public debt and stabilize public finances. Lula’s Comeback Chart 7Lula Is Massively Beating Bolsonaro In Polls
Can Brazil Break Out Of A Vicious Circle?
Can Brazil Break Out Of A Vicious Circle?
Odds of former president Luiz Inácio Lula da Silva running and winning the presidential elections next year have greatly increased in recent months. His presidency will have considerable ramifications for macro-economic policies, the economy and financial markets in the medium-to-long term. The rulings of the Supreme Federal Court have legally paved the way for Lula to participate in the 2022 October presidential elections. While there are still charges pending against Lula, the odds of a full trial and conviction against the ex-president within the next 15 months are negligible. According to the latest June polls from local company IPEC, voting intentions for the first round of elections show Lula mustering over twice as many votes as Bolsonaro, and miles away from the crowded centrist camp (Chart 7). President Bolsonaro’s disapproval rating has reached an all-time high since the beginning of his term. The government’s failure to handle the COVID-19 pandemic effectively has been put in the spotlight due to an ongoing inquiry by Congress, which is being broadcast daily on public television. Further, last week the Supreme Court authorized a criminal investigation into the government for allegations of corruption and irregularities in the procurement of vaccines from India’s Covaxin. It is uncertain as to whether these trials will lead to impeachment procedures given House leader Arthur Lira’s support for Bolsonaro. Nevertheless, odds are that the investigation will cement popular opinion against the current president. There is growing evidence that Lula is positioning himself as a mainstream moderate candidate. This will give him an advantage against Bolsonaro as centrist voters will likely abandon Bolsonaro and support Lula in the upcoming presidential elections. Lula has been meeting with political leaders from the center left and center right, trying to garner support from various corners of the political spectrum that have become disillusioned with Bolsonaro. It seems Lula is attempting to position next year’s presidential elections as a matter of Bolsonaro versus the rest of the country. Most notably, Lula has secured the support of longtime rival, ex-President Fernando Cardoso. This is particularly noteworthy for two reasons: First, Cardoso represents the ultimate economic orthodoxy and pragmatism in Brazil. Second, Cardoso expressed his support for his former political arch-rival Lula in the nation’s most important economic newspaper, Valor Economico. Another important source of support for Lula will likely be the business community. The corporate establishment dropped their backing of Bolsonaro over his mishandling of the pandemic. Further, his failure to combat corruption and his inflammatory rhetoric against democratic institutions have disturbed businesspeople and investors. Anecdotal evidence shows that behind closed doors the business elite is discussing supporting Lula for several reasons. First, banks and large conglomerates had positive relations with the ex-President during the 2000s. Second, even though Lula will not pass structural economic reforms or support privatization, his behavior is at least predictable. Chart 8Brazil: Real Income Per Capita Has Plunged
Can Brazil Break Out Of A Vicious Circle?
Can Brazil Break Out Of A Vicious Circle?
Although Lula is the most prominent member of the Workers’ Party (PT), not all voters necessarily associate him with the corruption that prevailed during the PT’s rule. Not only low-income but also middle-income households associate Lula’s presidency with rising per capita income. Neither Michel Temer’s centrist government nor Jair Bolsonaro’s right and conservative government were able to deliver rising income per capita (Chart 8). In short, centrist voters might favor Lula over Bolsonaro’s disarray. Economic Policy During Lula’s Potential Presidency Lula will not likely run on a purely socialist platform. By vying to gather support from centrist political parties and centrist voters, it is very likely that Lula’s election platform and third term will be marked by pragmatism rather than ideology. We believe fiscal policy during Lula’s presidency will be expansionary. Known as a ferocious political dealmaker, Lula will probably succeed in persuading Congress to dismantle the fiscal spending cap that limits government expenditure growth to last year’s consumer price inflation. This will allow the government to stimulate the economy via fiscal policy. Chart 9Brazil: The Economy Is Recovering But Not Surging
Can Brazil Break Out Of A Vicious Circle?
Can Brazil Break Out Of A Vicious Circle?
Regarding monetary policy, Lula will likely build a consensus across the political spectrum for an accommodative monetary policy. The latter is required to both boost growth and to cap government borrowing costs. A shrewd political operator, Lula will likely convince Congress to change the central bank’s singular mandate of targeting inflation to include targeting economic growth and employment. The US Federal Reserve’s dual mandate might be used as a justification for the change. Bottom Line: The Brazilian population is shattered by extremely poor economic conditions and will favor the presidential candidate who promises more stimulative macro policies. Lula will appeal to such popular sentiment. Following an election win, he will work with various political parties to promote legislation enabling easier fiscal and monetary policies. In short, Lula’s policies will boost nominal GDP growth while capping government borrowing costs. This is needed to stabilize the nation’s public debt-to-GDP ratio. However, the collateral damage of these policies will be the exchange rate: the currency will depreciate meaningfully in such a scenario. A Word About Business Cycle Incoming economic data suggest the economy is recovering. However, year-on-year growth rates appear very strong partially due to a low base effect from the lockdowns a year ago. In Chart 9, we show two-year growth rates, that are annualized, for key business cycle variables. The message is that the recovery is progressing but muted. Further, the BCB has justified its rate hikes by fast rising core and headline inflation. Nevertheless, high inflation readings are also partially the result of very low prints last year from the economic lockdowns. Chart 10 removes the base effect showing a 24-month rate of change and it reveals that core measures of inflation actually remain tame. In addition, lending rates in real terms remain high. This entails that the monetary authorities are risking over-tightening and impeding the recovery. Interestingly, our marginal propensity to spend proxy is forecasting a relapse in economic growth (Chart 11). Chart 10Brazil: Core Inflation Is At The Low End Of BCB's Target
Can Brazil Break Out Of A Vicious Circle?
Can Brazil Break Out Of A Vicious Circle?
Chart 11Is Brazil's Business Cycle About To Peak?
Can Brazil Break Out Of A Vicious Circle?
Can Brazil Break Out Of A Vicious Circle?
Chart 12Households' Debt Servicing And Importance Of Fiscal Spending
Can Brazil Break Out Of A Vicious Circle?
Can Brazil Break Out Of A Vicious Circle?
Importantly, the household debt-service ratio is very high, which means successive rate hikes could dampen consumption (Chart 12, top panel). In fact, there has been little improvement in the unemployment rate and household nominal disposable income and wages. Finally, the fiscal thrust is estimated by the IMF to be -5% of GDP this year and -1% in 2022 (please refer to Chart 6 above). Given government spending (excluding interest payments) accounts for 24% of GDP (Chart 12, bottom panel), fiscal tightening is a major risk to the economy over the next 18 months. Bottom Line: A combination of tightening fiscal and monetary policies will cap the economic recovery. By failing to deliver strong growth this year and next year, the government risks handing the election to ex-President Lula da Silva. While Bolsonaro will likely push to relax fiscal policy leading up to the election, our hunch is that it will be too little too late to help facilitate his reelection. Investment Conclusions Growing odds of Lula’s victory in the next presidential election in October 2022 entail a shift to more pro-growth fiscal and monetary policies in Brazil. The upshot of these policies will be higher inflation (say, core CPI above 6%) and chronic currency depreciation. Chart 13Brazilian Stock Prices, Valuations And EPS
Can Brazil Break Out Of A Vicious Circle?
Can Brazil Break Out Of A Vicious Circle?
Brazilian share prices will likely rally on the back of high nominal growth over the coming years. Yet, currency depreciation will dampen equity returns for international investors. Absolute-return investors with a medium- and long-term horizon should consider going long stocks and shorting the BRL. Our favored segment of the equity market is Brazilian small cap stocks and exporters. The former will benefit from high nominal growth while the latter from a cheapened exchange rate. For EM portfolio managers, our recommended strategy is as follows: While still underweighting Brazil within an EM equity portfolio, we are putting this bourse on an upgrade watch list. We intend to use the potential underperformance by Brazilian stocks in the coming months to upgrade this stock market. This equity market’s valuation is close to its fair value according to our cyclically-adjusted P/E ratio (Chart 13). Relative to the EM equity benchmark, Brazilian share prices might be forming a bottom (Chart 14). We are upgrading Brazilian sovereign credit to overweight relative to the EM sovereign credit benchmark. Brazil’s foreign currency debt stands at only 11% of GDP and the government does not have a problem servicing its foreign currency debt even if the currency depreciates. For local currency bonds, we recommend patience before upgrading. As financial markets start pricing in the fact of Lula’s presidency, the real will likely drop and domestic bond yields might rise. Finally, we continue shorting BRL as a part of our EM currency basket versus the US dollar. The real will likely have a setback in the coming months due to the US dollar’s rebound, a selloff in commodities prices driven by China’s slowdown and disappointing political news flow in Brazil. Concerning currency valuation, Chart 15 shows the real’s real effective exchange rate. The upshot is that it is not cheap. Chart 14Brazil Versus EM: Relative Share Prices
Can Brazil Break Out Of A Vicious Circle?
Can Brazil Break Out Of A Vicious Circle?
Chart 15The Brazilian Real Is Not Cheap
Can Brazil Break Out Of A Vicious Circle?
Can Brazil Break Out Of A Vicious Circle?
Arthur Budaghyan Chief Emerging Markets Strategist arthurb@bcaresearch.com Juan Egaña Research Analyst juane@bcaresearch.com Footnotes
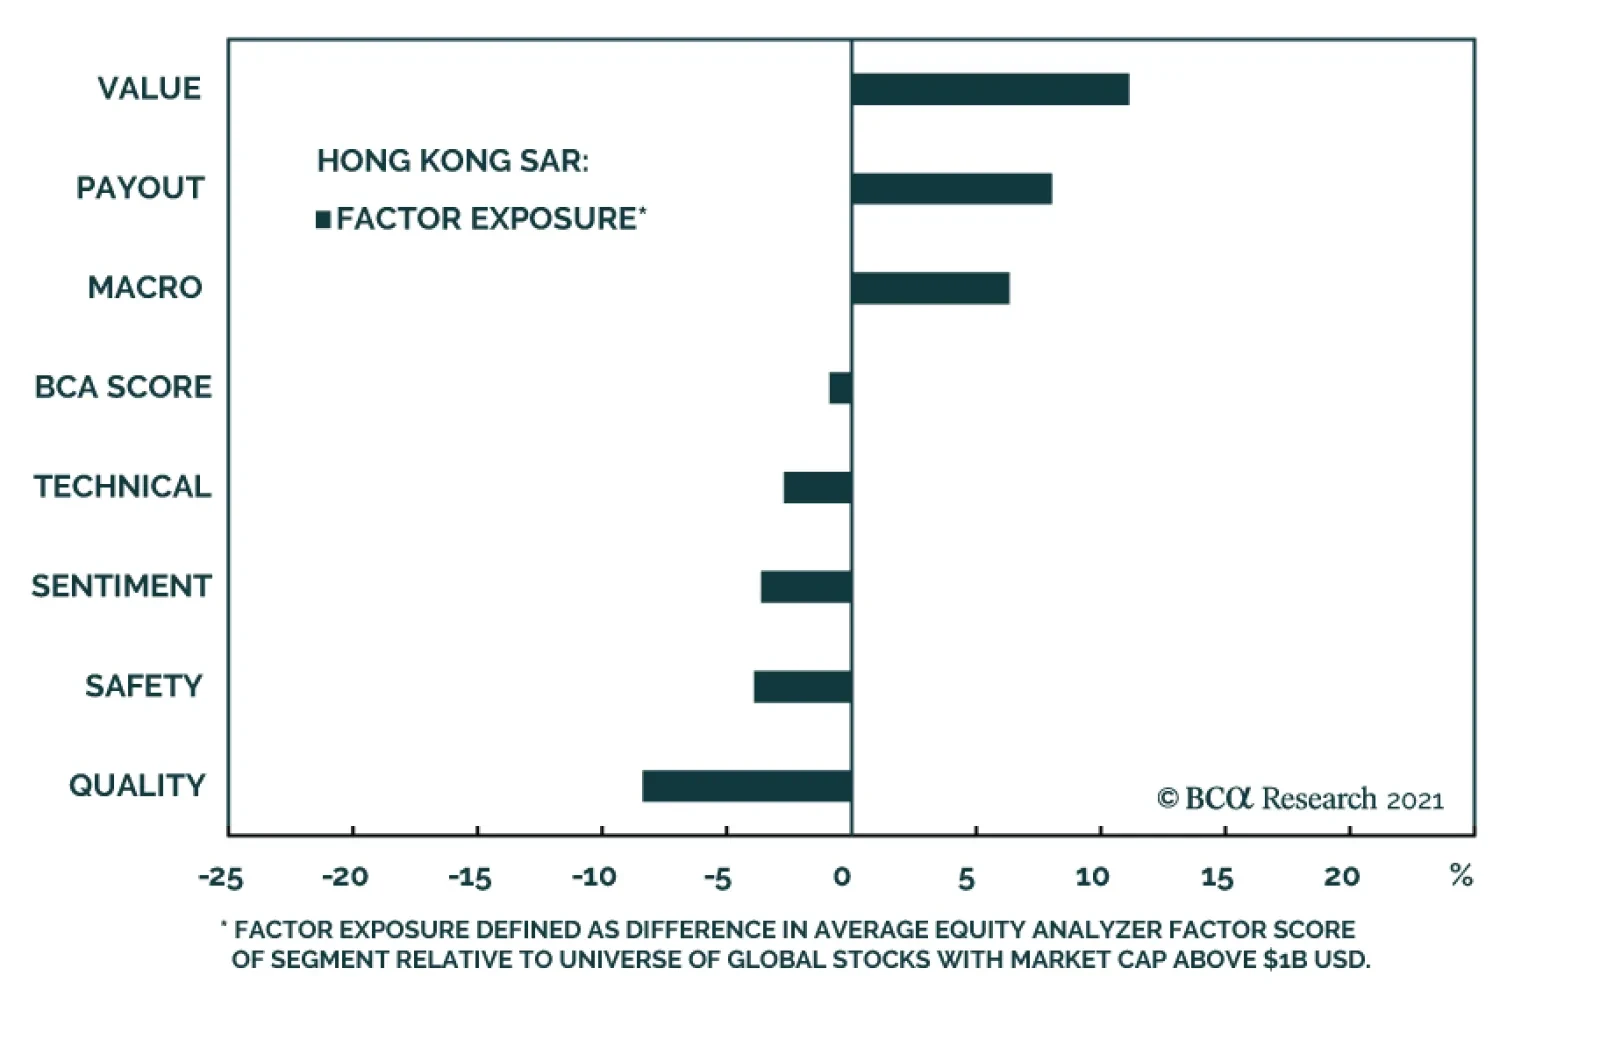
On a long/short basis (long top 10% / short bottom 10% based on the BCA Score), Hong Kong has been the top performing equity market in Equity Analyzer (EA) over the past three months and has been fourth over the past six. The results do not mean that EA sees…
GFIS Model Bond Portfolio Q2/2021 Performance Review & Current Allocations: Hitting A Few Roadblocks
Highlights Q2/2021 Performance Breakdown: Our recommended model bond portfolio underperformed the custom benchmark index by -6bps during the second quarter of the year. Winners & Losers: The government bond side of the portfolio underperformed by -21bps, led overwhelmingly by our underweight to US Treasuries (-18bps). Spread product allocations outperformed by +15bps, primarily due to overweights on US high-yield (+11bps) and US CMBS (+3bps). Portfolio Positioning For The Next Six Months: We are maintaining an overall below-benchmark portfolio duration stance, against a backdrop of persistent above-trend global growth and a highly stimulative fiscal/monetary policy mix. We are maintaining a moderate overweight to global spread product versus government debt, concentrated on an overweight to US high-yield where valuations look the least stretched. We are making two changes to the portfolio allocations heading into Q3: shifting the Treasury curve exposure to have more of a flattening bias, while downgrading EM USD-denominated corporates to neutral. Feature The trend in global bond yields so far in 2021 has been a tale of two quarters. The first three months of the year saw a surge in yields worldwide on the back of rapidly improving economic data, the rollout of COVID-19 vaccines and supply squeezes triggering rapid increases in inflation. During the second three months of the year, however, global yields drifted a bit lower in response to more mixed economic data, the spread of the Delta variant and slightly hawkish shifts from a few key central banks – most notably, the Fed – even with economic confidence measures remaining upbeat across the developed economies. The decline in yields has not been seen across the maturity spectrum, though. The yield-to-maturity of the Bloomberg Barclays Global and US Treasury 10+ year indices fell by -12bps and -30bps, respectively, from recent peaks. At the same time, shorter term bond yields have been relatively stable as central banks continue to signal that interest rate hikes are still well off into the future. In contrast to government bonds, credit markets have remained calm with spreads tight for developed market corporates and emerging market (EM) debt. With that in mind, we present our quarterly review of the BCA Research Global Fixed Income Strategy (GFIS) model bond portfolio during the second quarter of 2021. We also present our recommended positioning for the portfolio for the next six months (Table 1), as well as portfolio return expectations for our base case and alternative investment scenarios. The latter half of 2021 should prove to be even more challenging for bond investors, who must disentangle less consistent messages across countries on the Delta variant, vaccinations, inflation and the outlook for both monetary and fiscal policy. Table 1GFIS Model Bond Portfolio Recommended Positioning For The Next Six Months
GFIS Model Bond Portfolio Q2/2021 Performance Review & Current Allocations: Hitting A Few Roadblocks
GFIS Model Bond Portfolio Q2/2021 Performance Review & Current Allocations: Hitting A Few Roadblocks
As a reminder to existing readers (and to new clients), the model portfolio is a part of our service that complements the usual macro analysis of global fixed income markets. The portfolio is how we communicate our opinion on the relative attractiveness between government bond and spread product sectors. We do this by applying actual percentage weightings to each of our recommendations within a fully invested hypothetical bond portfolio. Q2/2021 Model Bond Portfolio Performance: Mixed Returns Chart 1Q2/2021 Performance: Credit Gains & Duration Losses
Q2/2021 Performance: Credit Gains & Duration Losses
Q2/2021 Performance: Credit Gains & Duration Losses
The total return for the GFIS model portfolio (hedged into US dollars) in the second quarter was +1.13%, slightly underperformed the custom benchmark index by -6bps (Chart 1).1 In terms of the specific breakdown between the government bond and spread product allocations in our model portfolio, the former generated -21bps of underperformance versus our custom benchmark index while the latter outperformed by +15bps. We have remained significantly underweight US Treasuries and positioned for a bearish steepening of the US Treasury curve since just before last year's US presidential election. That tilt was a big contributor to the excess return of the portfolio in Q1 (+63bps) that was partially given back (-18bps) in Q2 as longer maturity Treasury yields fell during the quarter. Our inflation-linked bond allocations in the US and Europe (+5bps) helped mitigate the loss on the government bond side from our below-benchmark duration stance and general curve steepening bias in most countries in the portfolio (Table 2). Table 2GFIS Model Bond Portfolio Q2/2021 Overall Return Attribution
GFIS Model Bond Portfolio Q2/2021 Performance Review & Current Allocations: Hitting A Few Roadblocks
GFIS Model Bond Portfolio Q2/2021 Performance Review & Current Allocations: Hitting A Few Roadblocks
The sum of excess returns during the quarter from countries that we overweighted (Germany, France, Italy, Spain, and Japan) was zero. Improving growth momentum and stronger economic confidence helped push yields higher in those countries. Therefore, those positions could not offset the losses from the underweight to US Treasuries. We did make two shifts in the country allocation within the government bond portion of the portfolio during Q2, downgrading Canada to underweight on April 20 and upgrading Australia to overweight on June 9. Neither change meaningfully contributed to the return of the portfolio. Meanwhile, our moderate overall overweight tilt on spread product versus government bonds fueled the outperformance from the credit side of the portfolio, led by US high-yield (+11bps) and US CMBS (+3bps). Overall gains from spread product were impressive in both USD-hedged total return terms (+95bps) and relative to our custom benchmark (+15bps), despite spreads entering Q2 at fairly tight levels. In the second quarter, improving economic confidence and easing credit conditions allowed spreads to narrow even further for corporate debt in the US and Europe, as well as for EM USD-denominated credit. The bar charts showing the total and relative returns for each individual government bond market and spread product sector are presented in Charts 2 & 3. Chart 2GFIS Model Bond Portfolio Q2/2021 Government Bond Performance Attribution
GFIS Model Bond Portfolio Q2/2021 Performance Review & Current Allocations: Hitting A Few Roadblocks
GFIS Model Bond Portfolio Q2/2021 Performance Review & Current Allocations: Hitting A Few Roadblocks
Chart 3GFIS Model Bond Portfolio Q2/2021 Spread Product Performance Attribution By Sector
GFIS Model Bond Portfolio Q2/2021 Performance Review & Current Allocations: Hitting A Few Roadblocks
GFIS Model Bond Portfolio Q2/2021 Performance Review & Current Allocations: Hitting A Few Roadblocks
Biggest Outperformers: Overweight US high-yield: Ba-rated (+5bps), B-rated (+4bps), and Caa-rated (+3bps) Overweight US TIPS (+4bps) Overweight US CMBS (+3bps) Overweight Euro Area high-yield (+1bps) Biggest Underperformers: Underweight US Treasuries with a maturity greater than 10 years (-17bps), Underweight US Treasuries with a maturity between 7 and 10 years (-3bps) Underweight US Treasuries with a maturity between 5 and 7 years (-2bps) Underweight EM USD sovereigns (-1bps) Underweight UK GIlts with a maturity greater than 10 years (-1bps) Chart 4 presents the ranked benchmark index returns of the individual countries and spread product sectors in the GFIS model bond portfolio for Q2/2021. Returns are hedged into US dollars (we do not take active currency risk in this portfolio) and adjusted to reflect duration differences between each country/sector and the overall custom benchmark index for the model portfolio. We have also color coded the bars in each chart to reflect our recommended investment stance for each market during Q2 (red for underweight, dark green for overweight, gray for neutral). Chart 4Ranking The Winners & Losers From The GFIS Model Bond Portfolio Universe In Q2/2021
GFIS Model Bond Portfolio Q2/2021 Performance Review & Current Allocations: Hitting A Few Roadblocks
GFIS Model Bond Portfolio Q2/2021 Performance Review & Current Allocations: Hitting A Few Roadblocks
Ideally, we would look to see more green bars on the left side of the chart where market returns are highest, and more red bars on the right side of the chart were returns are lowest. In Q2, the picture on that front was mixed. We were only neutral some of the biggest outperformers like UK Gilts (+312bps in USD-hedged duration-matched total return terms) and investment grade credit in the US (+430bps) and UK (+231bps). Our relative value allocation within EM, overweight corporates (+430bps) versus sovereigns (+527bps), also underperformed during Q2. We remained overweight government debt markets in the euro area which were the worst performers during the quarter (Germany: -25bps, Spain: -59bps, Italy: -67bps, and France: -83bps). The news was better on the credit side, where our significant overweight to US high-yield (+146bps) was a big positive contributor, as were overweights to US CMBS (+137bps) and euro area high-yield (+92bps). Bottom Line: Our model bond portfolio slightly underperformed its benchmark index in the second quarter of the year by -6bps – a negative result mainly driven by our underweight allocation to the US Treasury market but with an overweight to US high-yield providing a meaningful offset. Future Drivers Of Portfolio Returns & Scenario Analysis Looking ahead, the performance of the model bond portfolio will continue to be driven primarily by swings in global government bond yields, most notably US Treasuries. Our most favored cyclical indicators for global bond yields are still, in aggregate, signaling more upside potential over at least the next six months, although the nature of the signal is changing (Chart 5). Our Global Duration Indicator, comprised of leading economic indicators and measures of future economic sentiment, remains elevated but appears to have peaked. At the same time, the global manufacturing PMI, which typically leads global real bond yields by around six months, continues to climb to new cyclical highs. This suggests that the recent downdraft in global real bond yields could prove to be short-lived. Our Global Central Bank Monitor is climbing steadily, indicating greater upward pressure on bond yields from the combination of strong growth, rising inflation and loose financial conditions. Admittedly, bond yields are lagging the upward trajectory implied by the Monitor with central banks deliberately responding far more slowly to the cyclical pressures that would have triggered bond-bearish monetary tightening in the past. Nonetheless, the Monitor, the Global Duration Indicator and the global manufacturing PMI and all sending the same message – global bond yields remain too low, suggesting a below-benchmark overall portfolio duration stance remains appropriate. With regards to country allocation within the government bond side of our model portfolio, we continue to overweight countries where central banks are less likely to begin normalizing pandemic-era monetary policy quickly (Germany, France, Italy, Spain, Japan, Australia), while underweighting countries where normalization is expected to begin within the next 6-12 months (the US and Canada). We remain neutral the UK, although we have them on “downgrade watch” until there is greater clarity on how severely the spread of the Delta variant is impacting UK growth. The US remains the biggest underweight. The modestly hawkish turn by the Fed at the June FOMC meeting likely marked the end of the cyclical bear-steepening trend of the US Treasury curve. A full-blown turn to a bear-flattening of the US curve will be slow to develop, but we fully expect the cyclical pressures that drove the underperformance of longer-maturity US Treasuries over the past year to begin leaking into shorter-maturity bonds. That trend already appears to be underway with 5-year US yields starting to drift upward at a faster pace compared to other developed market peers (Chart 6). Chart 5Cyclical Indicators Suggest Global Yields Still Have More Upside
Cyclical Indicators Suggest Global Yields Still Have More Upside
Cyclical Indicators Suggest Global Yields Still Have More Upside
Chart 6UST Underperformance Will Shift To Shorter Maturities
UST Underperformance Will Shift To Shorter Maturities
UST Underperformance Will Shift To Shorter Maturities
This leads us to make a change to our model portfolio allocations this week, reducing the exposure to the belly of the US Treasury curve (the 3-5 year and 5-7 year maturity buckets), while modestly increasing the allocation to the 7-10 year bucket. To neutralize the duration-extending implication of that marginal shift, we added a new allocation to US Treasury bills, thus turning this US Treasury shift into a “butterfly” trade, essentially selling the 5-year bullet for a cash/10-year barbell. Longer-term Treasury yields, however, are still in the process of working off an oversold condition that developed in Q1 (Chart 7). Duration positioning remains quite short, according to the JP Morgan survey of bond investors, while speculators are still working off a huge net short position in 30-year Treasury futures according to data from the CFTC. We anticipate that it will take another month or two to work off such an extreme oversold condition for US Treasuries, based on similar episodes over the past two decades. After that, longer-maturity Treasury yields will begin to begin climbing again, to the benefit of the US underweight (and below-benchmark duration stance) in our model portfolio. Chart 7Longer-Maturity USTs Working Off Oversold Condition
Longer-Maturity USTs Working Off Oversold Condition
Longer-Maturity USTs Working Off Oversold Condition
Chart 8A Sharply Diminished Impulse From Global QE
A Sharply Diminished Impulse From Global QE
A Sharply Diminished Impulse From Global QE
Outside the US, the bond-friendly impact of quantitative easing programs is fading, on the margin, with the growth of central bank balance sheets slowing (Chart 8). While outright tapering of bond buying has only occurred in Canada and the UK (within our model bond portfolio universe), we expect the Fed to begin tapering in early 2022. Financial stability concerns are expected to play an increasingly important role in future tapering decisions, with house prices booming in many countries, most notably Canada which supports our underweight stance on Canadian government debt. Australia is the notable exception to this trend towards slowing balance sheet growth, with the Reserve Bank of Australia (RBA) maintaining a healthy pace of bond buying given underwhelming realized inflation. The recent wave of COVID-19 cases, which has left half of Australia under lockdowns that were largely avoided in 2020, will ensure that the RBA stays dovish for longer, to the benefit of our overweight stance on Australian government bonds. We continue to see the overall dovish stance of global central bankers as being conducive to the outperformance of inflation-linked bonds versus nominal government debt. However, inflation breakevens in most countries have largely completed the rebound from the depressed levels reached during the 2020 COVID-19 global recession. Our Comprehensive Breakeven Indicators combine three measures to determine the upside potential for 10-year inflation breakevens: the distance from fair value based on our models, the spread between headline inflation and central bank target inflation, and the gap between market-based and survey-based measures of inflation expectations. Those indicators suggest that the most attractive markets to position for further upside potential for breakevens are in Italy and France, with breakevens looking more stretched in the US, Canada and Australia (Chart 9). On the back of this, we are maintaining our allocations to inflation-linked bonds in the euro area in our model portfolio. Chart 9Less Scope For Wider Global Inflation Breakevens
Less Scope For Wider Global Inflation Breakevens
Less Scope For Wider Global Inflation Breakevens
Chart 10Fading Support For Credit Markets From Global QE
Fading Support For Credit Markets From Global QE
Fading Support For Credit Markets From Global QE
Moving our attention to the credit side of our model portfolio, we feel that a moderate overweight stance on overall global corporates versus governments remains appropriate. However, the slowing trend in developed market central bank balance sheets, as an indicator of the incremental shift away from the COVID-era monetary policies from 2020, is flashing a warning sign for the performance of global spread product. The annual growth rate of the combined balance sheets of the Fed, ECB, Bank of Japan and Bank of England has been an excellent leading indicator of the excess returns of both global investment grade and high-yield corporates over the past decade (Chart 10). That growth rate peaked back in February of this year, suggesting a peak of global corporate bond excess returns around February 2022 Although given the current tight level of global corporate bond spreads, both for investment grade and high-yield, we expect future return outperformance from corporates versus government debt to come from carry rather than spread compression. Our preferred measure of the attractiveness of credit spreads is the historical percentile ranking of 12-month breakeven spreads, which measure how much spreads would need to widen to eliminate the carry advantage over duration-matched government bonds on a one-year horizon. Currently, only the lower-rated high-yield credit tiers in the US and euro area offer 12-month breakeven spreads above the bottom quartile of their history, within the credit sectors of our model portfolio (Chart 11). Chart 11Lower-Rated High-Yield Offers Relatively Attractive Spreads
GFIS Model Bond Portfolio Q2/2021 Performance Review & Current Allocations: Hitting A Few Roadblocks
GFIS Model Bond Portfolio Q2/2021 Performance Review & Current Allocations: Hitting A Few Roadblocks
Given the sharply reduced default risks on both sides of the Atlantic, and with nominal growth in good shape amid low borrowing rates, we are maintaining our overweights to high-yield bonds in both the US and euro area. At the same time, we are sticking with only a neutral stance on investment grade corporates in the US, euro area and the UK. We do anticipate starting to reduce the overall corporate bond exposure later this year, however, based on the ominous leading signal from the growth of central bank balance sheets – and what that signals about the future path for global monetary policy. Within the euro area, we continue to prefer owning Italian government bonds (and to a lesser extent, Spanish government debt) over investment grade corporates, given the more explicit support for the sovereigns through ECB quantitative easing (Chart 12). We expect the ECB to be the most accommodative central bank within our model portfolio universe over at least the next year, with even tapering of any kind unlikely in 2022. Chart 12Favor Italian BTPs Over Euro Area Investment Grade
Favor Italian BTPs Over Euro Area Investment Grade
Favor Italian BTPs Over Euro Area Investment Grade
One area of the spread product universe where we are starting to reduce risk in the model portfolio is EM USD-denominated credit. EM debt has benefited from a bullish combination of global policy stimulus, a weakening US dollar and rising commodity prices over the past year. We have positioned for that in our model portfolio through an overall overweight stance on EM USD-denominated debt, but one that favors investment grade corporates over sovereigns. Now, all of those supportive factors for EM credit are fading. Chinese policymakers have reigned in both credit stimulus and fiscal stimulus this year, with the combined impulse suggesting a slower pace of Chinese economic growth in the latter half of 2021 (Chart 13). Given China’s huge share of the global consumption of industrial commodities, slowing Chinese growth should cool the momentum of commodity prices over the next few quarters. A slowing liquidity impulse from global central bank asset purchases is also a negative for EM debt performance, on the margin. The same can be said for the US dollar, which is no longer depreciating as markets start to pull forward the expected future path for US interest rates (Chart 14). A stronger US dollar typically correlates with softer commodity prices and wider EM credit spreads. Chart 13Major EM Risks: China Tightening & Global QE Tapering
Major EM Risks: China Tightening & Global QE Tapering
Major EM Risks: China Tightening & Global QE Tapering
Chart 14EM Supportive USD Weakness Is Fading
EM Supportive USD Weakness Is Fading
EM Supportive USD Weakness Is Fading
In response to these growing risks to the bullish EM backdrop - including the rapid spread of the Delta variant made worse by the less-effective vaccines available in those countries - we are downgrading our overall EM USD credit exposure in the model bond portfolio to underweight from neutral. We are doing this by cutting the EM corporate exposure from overweight to neutral, while maintaining an underweight tilt on EM USD sovereigns. We expect to further cut the EM exposure in the coming months by moving to a full underweight on EM corporates. Summing it all up, our overall allocations and risks in our model portfolio leading into Q3/2021 look like this: An overall below-benchmark stance on global duration, equal to nearly one full year versus the custom index (Chart 15) A moderate overweight stance on global spread product versus government debt, equal to five percentage points of the portfolio (Chart 16). This overweight comes almost entirely from overweight allocations to US and euro area high-yield corporate debt. Chart 15Overall Portfolio Duration: Stay Below Benchmark
Overall Portfolio Duration: Stay Below Benchmark
Overall Portfolio Duration: Stay Below Benchmark
Chart 16Overall Portfolio Allocation: Small Spread Product Overweight
GFIS Model Bond Portfolio Q2/2021 Performance Review & Current Allocations: Hitting A Few Roadblocks
GFIS Model Bond Portfolio Q2/2021 Performance Review & Current Allocations: Hitting A Few Roadblocks
After the changes made to our US Treasury and EM positions, the tracking error of the portfolio, or its expected volatility versus that of the benchmark index, is quite low at 34bps (Chart 17). The main reason for this is that our positioning remains focused heavily on the US (Treasury underweight, high-yield overweight), with much of the other positioning close to neutral or largely offsetting other positions in a relative value sense (overweight Australia vs underweight Canada, overweight US CMBS versus underweight US Agency MBS). This fits with our desire to maintain only a moderate level of overall portfolio risk. The yield of the portfolio is now slightly higher than that of the benchmark, with a small “positive carry”, hedged into USD, of 13bps (Chart 18). Chart 17Overall Portfolio Risk: Moderate
Overall Portfolio Risk: Moderate
Overall Portfolio Risk: Moderate
Chart 18Overall Portfolio Yield: Small Positive Carry Vs. Benchmark
Overall Portfolio Yield: Small Positive Carry Vs. Benchmark
Overall Portfolio Yield: Small Positive Carry Vs. Benchmark
Scenario Analysis & Return Forecasts After making the shifts to our model bond portfolio allocations in the US and EM, we now turn to scenario analysis to determine the return expectations for the portfolio for the next six months. On the credit side of the portfolio, we use risk-factor-based regression models to forecast future yield changes for global spread product sectors as a function of four major factors - the VIX, oil prices, the US dollar and the fed funds rate (Table 2A). For the government bond side of the portfolio, we avoid using regression models and instead use a yield-beta driven framework, taking forecasts for changes in US Treasury yields and translating those in changes in non-US bond yields by applying a historical yield beta (Table 2B). For our scenario analysis over the next six months, we use a base case scenario plus two alternate “tail risk” scenarios. We see global growth momentum and the Fed monetary policy outlook as the two most important factors for fixed income markets in the second half of 2021, thus our scenarios are defined along those lines. Table 2AFactor Regressions Used To Estimate Spread Product Yield Changes
GFIS Model Bond Portfolio Q2/2021 Performance Review & Current Allocations: Hitting A Few Roadblocks
GFIS Model Bond Portfolio Q2/2021 Performance Review & Current Allocations: Hitting A Few Roadblocks
Table 2BEstimated Government Bond Yield Betas To US Treasuries
GFIS Model Bond Portfolio Q2/2021 Performance Review & Current Allocations: Hitting A Few Roadblocks
GFIS Model Bond Portfolio Q2/2021 Performance Review & Current Allocations: Hitting A Few Roadblocks
Base Case Global growth stays above-trend in both Q3 and Q4, putting downward pressure on unemployment rates and keeping realized inflation elevated. Ongoing global vaccinations lead to more of the global economy fully reopening, with the Delta variant not having serious widespread impact on economic confidence outside of parts of the emerging world. Excess savings built up during the pandemic are run down by both consumers and businesses as optimism stays ebullient within the developed economies. China credit tightening slows growth enough to cool off upward commodity price momentum. At the same time, falling US unemployment and surprisingly “sticky” domestic US realized inflation embolden the Fed to signal a move to begin tapering its bond purchases starting in January 2022. Real bond yields globally bottom out, while inflation expectations recover some of the pullback seen in Q2/2021. The entire US Treasury curve shifts higher, led by the 10-year reaching 1.65% and a modest bear-flattening of the 5-year/30-year curve. The VIX stays near 15, the US dollar rises +3%, the Brent oil price goes nowhere and the fed funds rate is unchanged at 0% Upside Growth Surprise The Delta variant proves to be far less deadly than feared. A rapid pace of global vaccinations leads to booming growth led by the US but including a fully reopened euro area. Chinese policymakers begin to reverse some of the H1/2021 credit tightening. Unemployment rates rapidly fall worldwide, while supply bottlenecks persist, keeping upward pressure on realized inflation. Markets pull forward the timing and pace of future central bank interest rate hikes, most notably in the US when the Fed begins tapering bond purchases sooner than expected before year-end. Real bond yields drift higher globally, but inflation breakevens stay elevated with the earlier surge in realized inflation proving not to be “transitory”. The US Treasury curve modestly bear-flattens, with the 10-year reaching 1.9% and the 5-year/30-year spread narrowing by 25bps. The VIX rises to 25 as risk assets struggle in response to rising bond yields even with faster growth. The US dollar falls -5% on the back of improving global growth expectations, the Brent oil price climbs +5% and the fed funds rate stays unchanged. Downside Growth Surprise The global economy gets hit on multiple fronts: the rapid spread of the Delta variant overwhelms the positive momentum on vaccinations, most notably in EM countries; Europe struggles to fully reopen; China policy tightening results in a larger-than-expected drag on global growth; and US households are reluctant to draw down on excess savings after government income support measures expire in September. Diminished economic optimism leads to a pullback in global equity values, lower government bond yields and wider global credit spreads. The US Treasury curve bull flattens as longer-maturity yields fall in a risk-off move, with the 10-year yield moving back down to 1.25% alongside lower inflation breakevens. The VIX rises to 30, the safe-haven US dollar rises +5%, the Brent oil price falls -10% and the fed funds rate stays at 0%. Chart 19Risk Factor Assumptions For The Scenario Analysis
Risk Factor Assumptions For The Scenario Analysis
Risk Factor Assumptions For The Scenario Analysis
Chart 20US Treasury Yield Assumptions For The Scenario Analysis
US Treasury Yield Assumptions For The Scenario Analysis
US Treasury Yield Assumptions For The Scenario Analysis
The inputs into the scenario analysis are shown in Chart 19 (for the USD, VIX, oil and the fed funds rate), while the US Treasury yield scenarios are in Chart 20. The excess return scenarios for the model bond portfolio, using the above inputs in our simple quantitative return forecast framework, are shown in Table 3A (the scenarios for the changes in US Treasury yields are shown in Table 3B). Table 3AGFIS Model Bond Portfolio Scenario Analysis For The Next Six Months
GFIS Model Bond Portfolio Q2/2021 Performance Review & Current Allocations: Hitting A Few Roadblocks
GFIS Model Bond Portfolio Q2/2021 Performance Review & Current Allocations: Hitting A Few Roadblocks
Table 3BUS Treasury Yield Assumptions For The 6-Month Forward Scenario Analysis
GFIS Model Bond Portfolio Q2/2021 Performance Review & Current Allocations: Hitting A Few Roadblocks
GFIS Model Bond Portfolio Q2/2021 Performance Review & Current Allocations: Hitting A Few Roadblocks
The model bond portfolio is expected to deliver a positive excess return over the next six months of +46bps in the base case scenario and +28bps in the optimistic growth scenario, but is projected to underperform by -36bps in the pessimistic growth scenario. Bottom Line: We are maintaining an overall below-benchmark portfolio duration stance, against a backdrop of persistent above-trend global growth and a highly stimulative fiscal/monetary policy mix. We are maintaining a moderate overweight to global spread product versus government debt, concentrated on an overweight to US high-yield where valuations look the least stretched. We are making two changes to the portfolio allocations heading into Q3: shifting the Treasury curve exposure to have more of a flattening bias, while downgrading EM USD-denominated corporates to neutral. Robert Robis, CFA Chief Fixed Income Strategist rrobis@bcaresearch.com Ray Park, CFA Research Analyst ray@bcaresearch.com Footnotes 1 The GFIS model bond portfolio custom benchmark index is the Bloomberg Barclays Global Aggregate Index, but with allocations to global high-yield corporate debt replacing very high-quality spread product (i.e. AA-rated). We believe this to be more indicative of the typical internal benchmark used by global multi-sector fixed income managers. Recommendations The GFIS Recommended Portfolio Vs. The Custom Benchmark Index
GFIS Model Bond Portfolio Q2/2021 Performance Review & Current Allocations: Hitting A Few Roadblocks
GFIS Model Bond Portfolio Q2/2021 Performance Review & Current Allocations: Hitting A Few Roadblocks
Duration Regional Allocation Spread Product Tactical Trades Yields & Returns Global Bond Yields Historical Returns
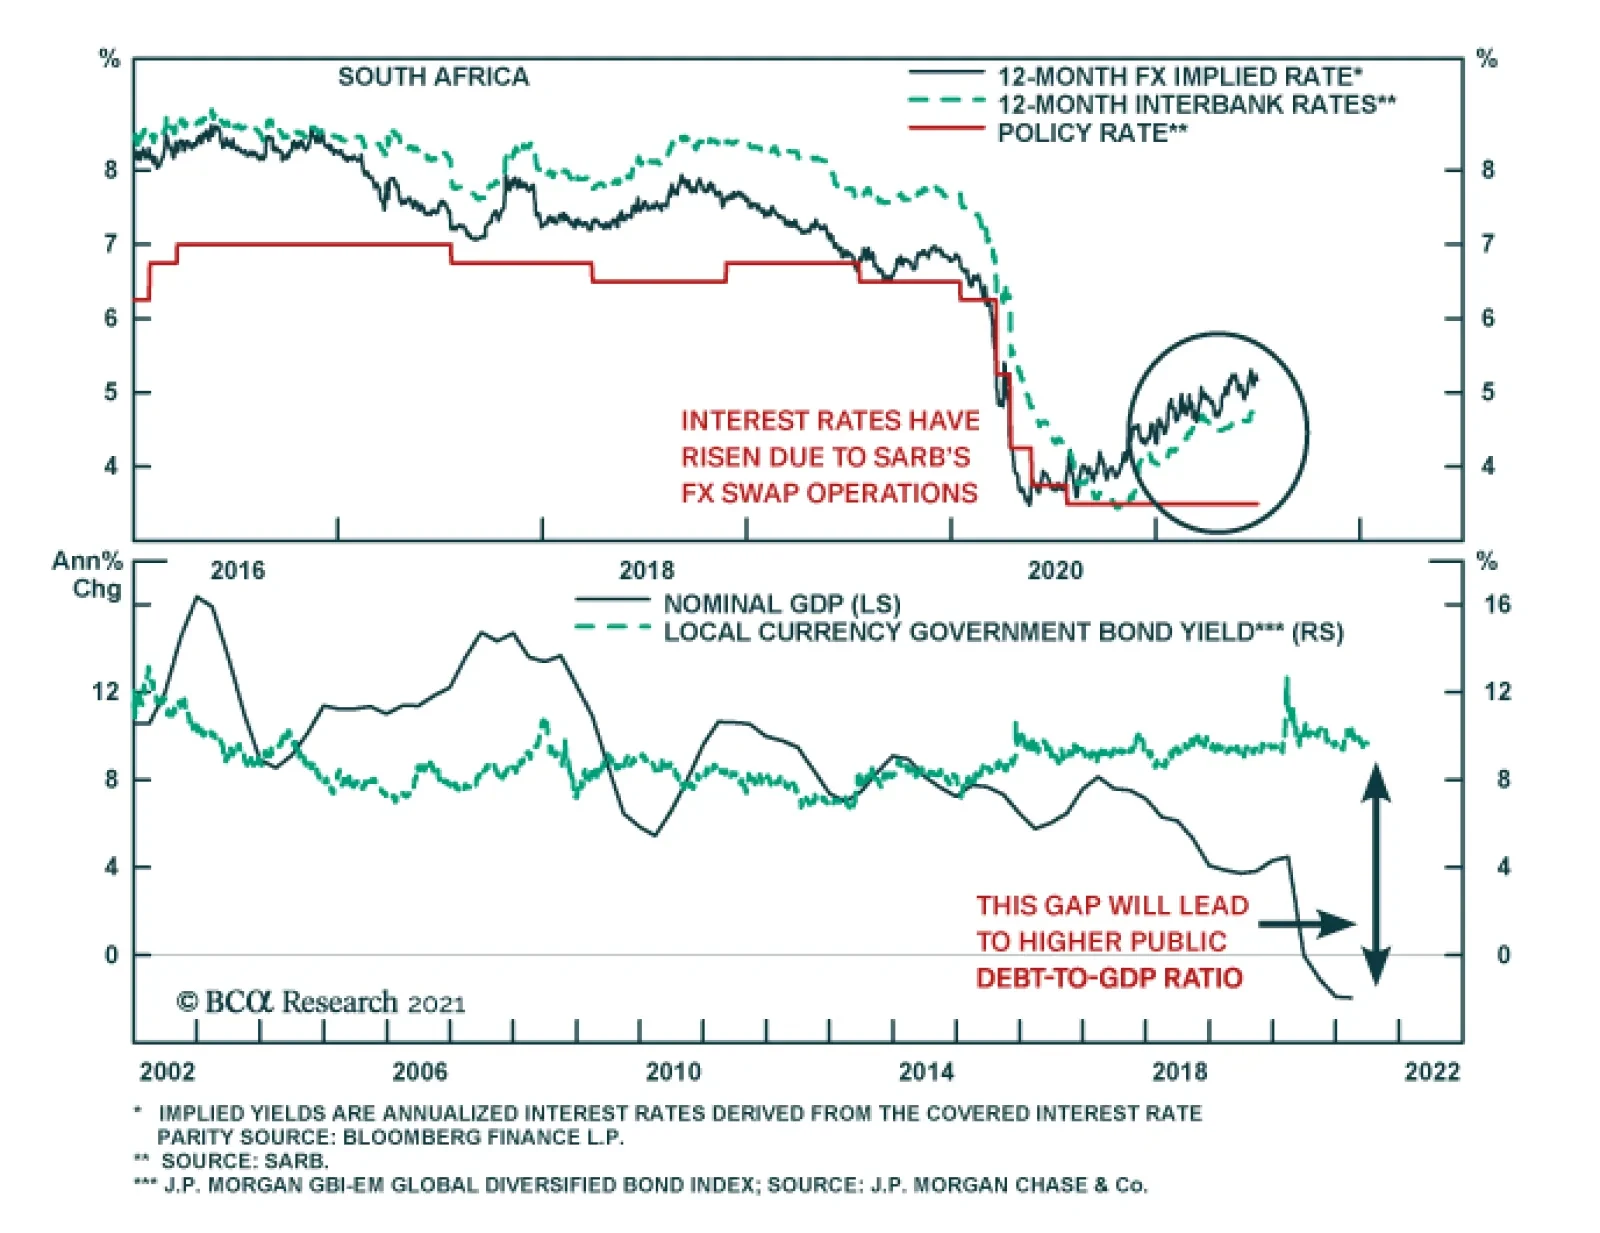
The central bank’s efforts to sterilize inflows of US dollars from the IMF have inadvertently led to considerably tighter monetary conditions. Not only has the currency appreciated a lot but also market interest rates have risen (top panel). Fiscal…