Emerging Markets
The May economic data confirm that China’s domestic demand recovery has passed its peak strength. Most of the macro indicators released yesterday are below the consensus and growing at a slower rate (on both a year-on-year and month-to-month basis) than last…

Dear Client, Next week, in lieu of our regular weekly report, I will be hosting two webcasts where I will discuss the outlook for China’s economy and financial markets, a year into policy normalization. The webcasts will be held on Tuesday, June 22 at 10:00 am EDT (English), and Thursday, June 24 at 9:00 am HKT (Mandarin). We will return to our regular publishing schedule on Wednesday, June 30. Best regards, Jing Sima, China Strategist Feature China’s onshore stocks rebounded in the past two months on the back of a rapidly appreciating RMB versus the US dollar and accelerating foreign capital inflows (Chart 1). However, in our view, China’s domestic policy backdrop and economic fundamentals do not support a sustained rally in Chinese stocks in the next six months. The RMB’s rise vis-à-vis the US dollar will likely falter in the second half of the year as China’s growth weakens. A narrowing in real yields later this year between China’s government bonds and US Treasuries will also discourage foreign flows into Chinese assets. Performance of Chinese cyclical stocks versus defensives failed to decisively breakout in both the onshore and offshore equity markets. An underperformance in cyclical stocks relative to defensives has historically pointed to waning market sentiment towards the Chinese economy (Chart 2). Chart 1Rapid Appreciation In The RMB Buoyed A Recent Rebound In A-Shares
Rapid Appreciation In The RMB Buoyed A Recent Rebound In A-Shares
Rapid Appreciation In The RMB Buoyed A Recent Rebound In A-Shares
Chart 2Cyclical Stocks Continued To Underperform Defensives
Cyclical Stocks Continued To Underperform Defensives
Cyclical Stocks Continued To Underperform Defensives
The number of onshore stocks with prices rising versus falling remains low, even though there has been a slight improvement this year from Q4 2020. The narrow breath in the equity market implies that recent rebound in A-share stocks has been largely driven by a handful of companies (Chart 3). Such narrow breadth suggests that the rebound in Chinese stock prices will not sustain (Chart 4). Chart 3A Narrow-Based Market Rally in A-Shares
A Narrow-Based Market Rally in A-Shares
A Narrow-Based Market Rally in A-Shares
Chart 4Narrowing Market Breadth Has Historically Led To Price Pullbacks
Narrowing Market Breadth Has Historically Led To Price Pullbacks
Narrowing Market Breadth Has Historically Led To Price Pullbacks
A tightened monetary and credit environment has created obstacles for Chinese equities since early this year. Credit numbers released last week show that credit growth deceleration has gathered speed in May, raising the risk of policy overtightening, i.e. credit growth undershooting the government’s 2021 targets. We could see some moderation in the credit growth deceleration into 2H21. A delay in the rollout of local government (LG) bonds and LG special purpose bonds (SPBs) in the first five months of the year means the pace of LG bond issuance between June and October will escalate, which will help to stabilize credit growth. However, weak corporate bond net financing and contracting shadow banking will cap the upside in credit expansion. Chart 5The Economy Could Surprise The Market To The Downside In Q3
The Economy Could Surprise The Market To The Downside In Q3
The Economy Could Surprise The Market To The Downside In Q3
Additionally, if more LG bonds come onto the market in Q3, then we could see tighter interbank liquidity conditions and higher bond yields. This, in turn, would partially offset the positive effects on the economy and equity market from a slower pace in credit growth deceleration. For the next six months, we continue to hold an underweight position in Chinese onshore and investable stocks, in both absolute terms and within a global equity portfolio. Policy tightening has not reversed course and there is an escalating risk that economic data will surprise the market to the downside in Q3 (Chart 5). Qingyun Xu, CFA Associate Editor qingyunx@bcaresearch.com Macro Policy Conditions Are Still Unfavorable For Risk Assets A further deterioration in the credit impulse in May reflects Chinese authorities’ efforts to reduce local government leverage and shadow banking activities. Net corporate bond financing contracted for the first time since early 2018, driven by shrinking local government financing vehicle (LGFV) bonds (Chart 6). Meanwhile, the pace of contraction in shadow-bank loans climbed. At this rate of deceleration, credit growth will undershoot the government’s 2021 target, which is expected to be in line with this year’s nominal GDP growth. The pace in credit expansion on a year-over-year basis has dropped to its previous cycle’s trough (Chart 7). Moreover, the speed of the deceleration in credit growth has outpaced the 2017/18 tightening cycle. It has been seven months since Chinese credit growth peaked (October 2020), which is significantly less than the 13 months it took for credit to decline from top to bottom in 2017/18. Chart 6Contraction In Net Corporate Bond Financing And Shadow Banking Dragged Down Credit Growth In May
Contraction In Net Corporate Bond Financing And Shadow Banking Dragged Down Credit Growth In May
Contraction In Net Corporate Bond Financing And Shadow Banking Dragged Down Credit Growth In May
Chart 7Credit Growth Has Decelerated To Its Trough Reached In 2017/18 Tightening Cycle
Credit Growth Has Decelerated To Its Trough Reached In 2017/18 Tightening Cycle
Credit Growth Has Decelerated To Its Trough Reached In 2017/18 Tightening Cycle
Chart 8Most Of LG Bonds Issued In The First Five Months Are Refinancing Bonds
The Stars Are Not Yet Aligned For Chinese Stocks
The Stars Are Not Yet Aligned For Chinese Stocks
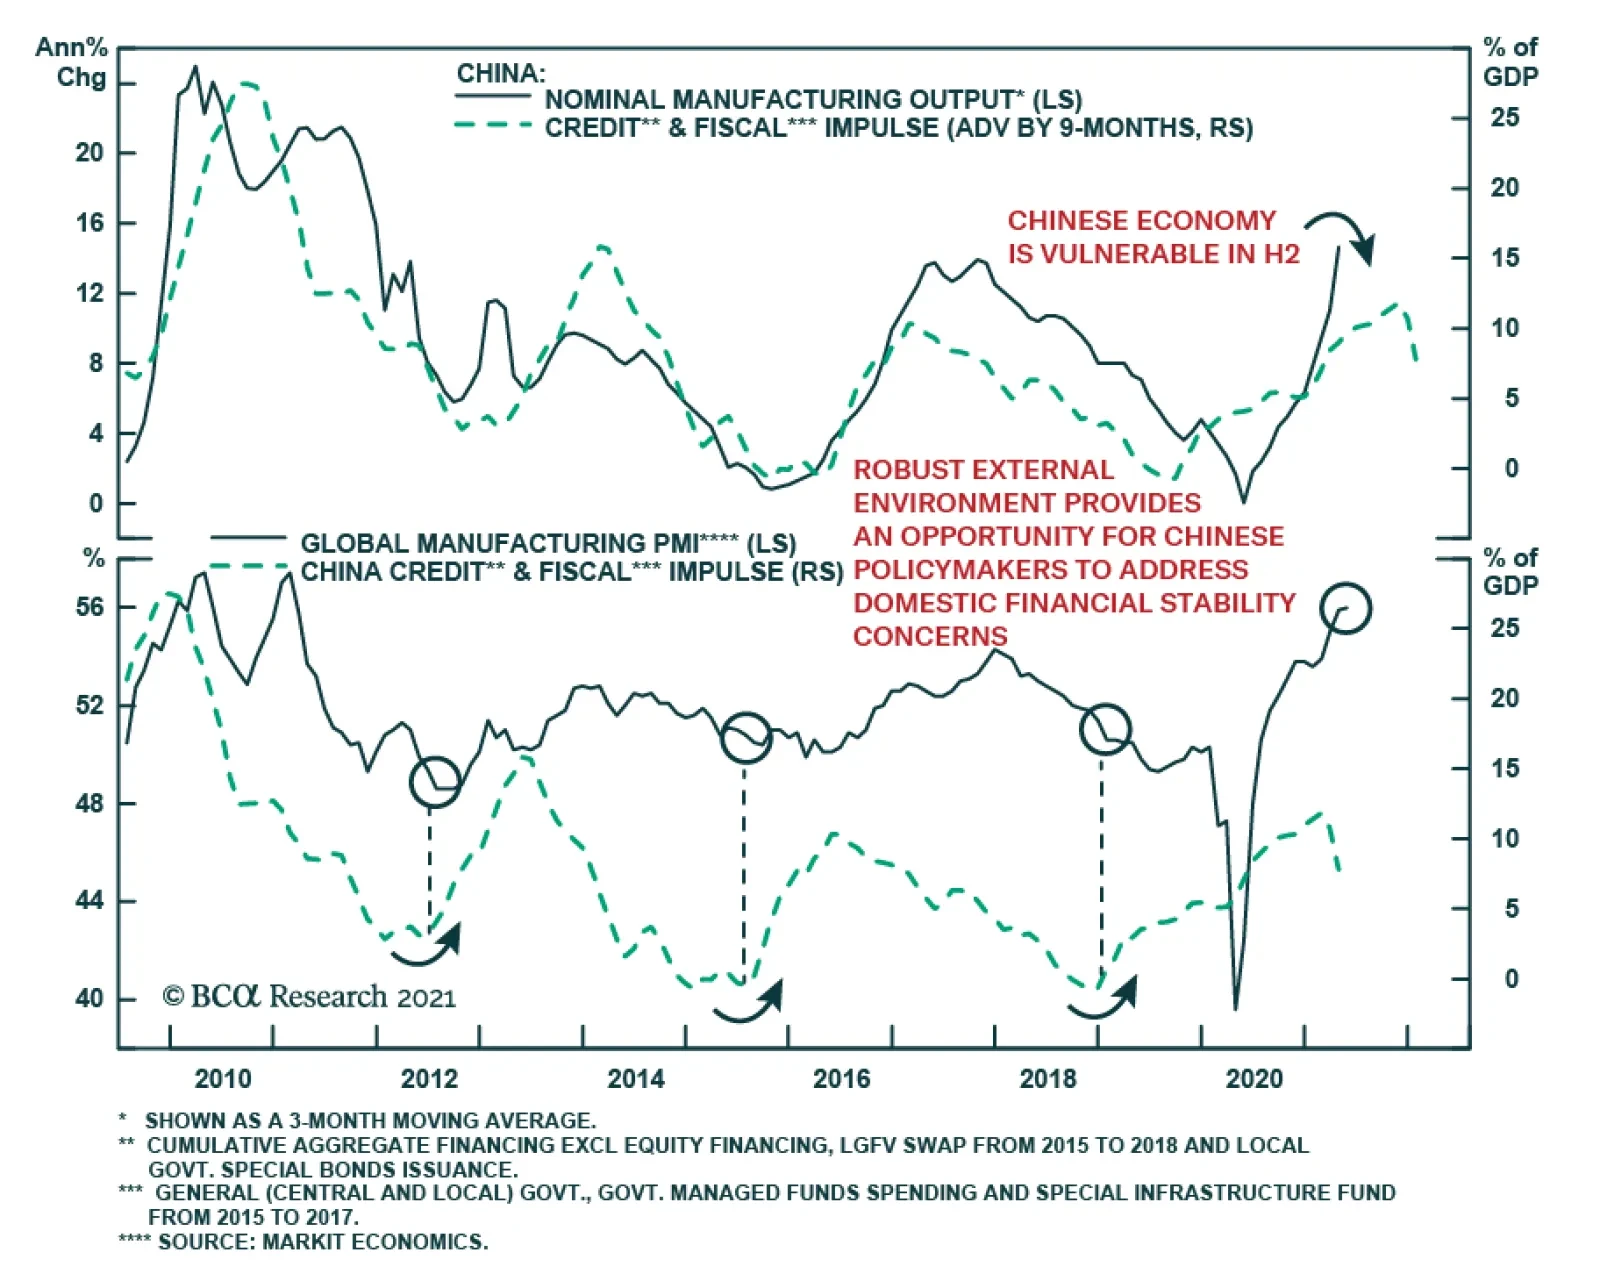
So far this year, LG bond issuance is also behind schedule. About 63% of LG bonds issued in the first five months are refinancing bonds (Chart 8). The new LG bonds and LG SPBs issued to date account for only 21% and 16.5%, respectively, of their 2021 quotas. A delay in LG bond issuance in the first five months means that much more bonds will be on the market between June and October, which may help to stabilize credit growth in Q3. However, weak corporate bond financing and an acceleration in contracting shadow banking activities will cap the upside on broad credit. We do not expect a reversal in policy tightening. Instead, credit growth will likely hover near current levels for the rest of the year. In the past, Chinese policymakers eased when the global manufacturing backdrop faltered. Given that global growth is robust, Chinese policymakers will not feel any urgency to reverse policy setting and will likely use the strong external environment as an opportunity for domestic deleveraging. Chinese Exports Will Face Challenges In The Second Half Of The Year Chart 9A Broad-Based Moderation In China's Exports to DMs
A Broad-Based Moderation In China's Exports to DMs
A Broad-Based Moderation In China's Exports to DMs
Export growth slowed in May with a broad-based moderation in the country’s exports to developed markets (DMs), albeit from a very elevated level (Chart 9). The easing in exports reflects an ongoing demand shift in the DMs away from goods to services as economic activity normalizes (Chart 10). China’s robust exports, which have been driven by strong and partly pandemic-induced global demand for goods, will likely gradually lose strength in the second half of the year. China’s weakening new export orders component in the May manufacturing PMI reflects this trend (Chart 11). Chart 10Global Consumption Recovery In Services Will Likely Outpace Goods
Global Consumption Recovery In Services Will Likely Outpace Goods
Global Consumption Recovery In Services Will Likely Outpace Goods
Chart 11China's Softening New Export Orders Signal Further Export-Sector Weakness
China's Softening New Export Orders Signal Further Export-Sector Weakness
China's Softening New Export Orders Signal Further Export-Sector Weakness
An appreciating RMB versus the US dollar is also a headwind for Chinese exports. The USD/CNY historically has led Chinese new export orders by around six months, with the exception of the pandemic-hit outlier in 2020 (Chart 12). The recent sharp RMB appreciation is starting to weight on Chinese exports. Moreover, BCA’s Geopolitical strategists do not expect that China will principally benefit from US President Biden’s $2.4 trillion infrastructure and green energy plan . US explicitly aims to diminish China’s role as a supplier of US goods and materials. The widening divergence between US’s trade deficit with China and the rest of world already shows evidence (Chart 13). Chart 12The RMB's Rapid Rise Creates Headwinds For Chinese Exports
The RMB's Rapid Rise Creates Headwinds For Chinese Exports
The RMB's Rapid Rise Creates Headwinds For Chinese Exports
Chart 13China's Exports May Not Benefit From Biden's Infrastructure Plan
China's Exports May Not Benefit From Biden's Infrastructure Plan
China's Exports May Not Benefit From Biden's Infrastructure Plan
Still No Inflation Pass-Through Chart 14Chinese Producers Are Unable To Pass Rising Input Costs On To Consumers
Chinese Producers Are Unable To Pass Rising Input Costs On To Consumers
Chinese Producers Are Unable To Pass Rising Input Costs On To Consumers
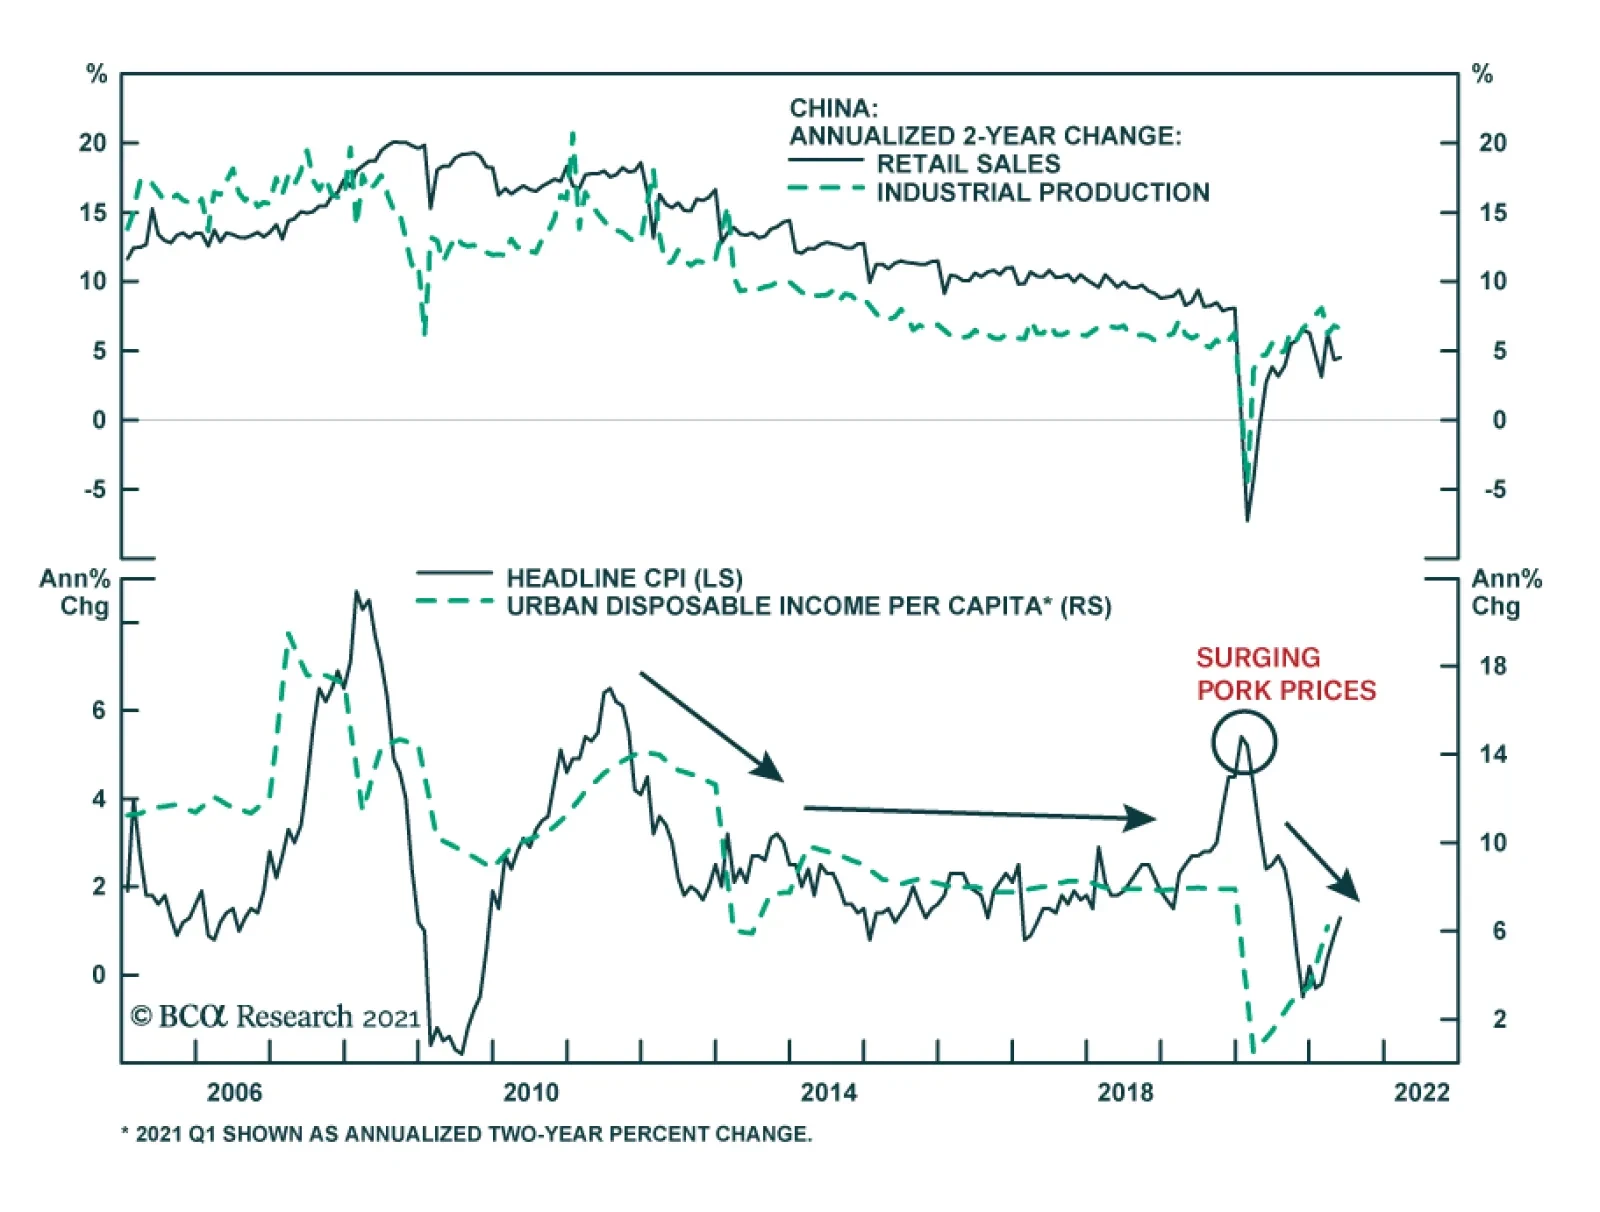
Chinese surging producer prices overstate domestic inflationary pressures. Inflation in the Producer Price Index (PPI) surged by 9.0% year-over-year in May, jumping to its highest level since 2009. High PPI inflation reflects rising commodity prices and a low base effect. Meanwhile, inflationary pressures are much more muted for consumer goods and services. The gap between producer and consumer prices widened to the highest level since 1990, highlighting the absence of price inflation pass-through from producers to consumers (Chart 14). We expect soaring PPI inflation to be transitory; it will ease when low-base factors from last year and global supply constraints are removed later this year. CPI inflation will remain tame through the year. As such, Chinese authorities are unlikely to tighten monetary policy in response to high PPI readings. Instead, Beijing will continue to use regulatory measures to curb speculation in the commodity market and window-guide industries to readjust material inventories to help ease the pace of rising commodity prices. Historically, PPI inflation’s impact on consumer prices has been weak when prices on producer goods were pushed up by supply shocks rather than mounting domestic demand. The sharp uptick in the PPI during the 2017/18 cycle was mostly due to China’s supply-side reforms and a rapid consolidation in the upstream industries. Global supply constraints linked to the pandemic have also resulted in a sharp upturn in the Chinese PPI since mid-2020. Moreover, Chart 15 shows that the pass-through from PPI inflation to consumers is closely correlated to household income growth. The pass-through has weakened significantly since 2011 when household income growth subdued along with a declining Chinese working population (Chart 16). Chart 15Subdued Household Income Growth Since 2011 Has Suppressed CPI Inflation
Subdued Household Income Growth Since 2011 Has Suppressed CPI Inflation
Subdued Household Income Growth Since 2011 Has Suppressed CPI Inflation
Chart 16Income Growth Decelerated After China's Working Population Peaked
Income Growth Decelerated After China's Working Population Peaked
Income Growth Decelerated After China's Working Population Peaked
Chart 17Profits Diverged Between Upstream And Mid & Downstream Industries
The Stars Are Not Yet Aligned For Chinese Stocks
The Stars Are Not Yet Aligned For Chinese Stocks
Lacking inflation pass-through from producers to consumers has led to a bifurcated profit recovery between upstream and mid & downstream industries. Since late last year, the share of upstream industries in total profits increased sharply at the expense of mid and downstream businesses (Chart 17). A deterioration in the profits of mid and downstream industries will weigh on the outlook for their capex, which in turn, will reduce the demand for upstream goods. Domestic Demand Remains China’s Weakest Link Investments and household demand remain the weakest links in China’s economy. Sluggish household consumption reflects a fragile post-pandemic recovery in manufacturing and services employment, and a rising propensity for precautionary savings (Chart 18). A PBoC survey shows that households’ preference for more saving deposits soared in 2020 (Chart 19). Although it has slightly diminished since late 2020, the reading is still much higher than its pre-pandemic level and will likely persist to year-end on the back of a subdued outlook for employment and income. Chart 18Weak Employment In Both Manufacturing And Service Industries
Weak Employment In Both Manufacturing And Service Industries
Weak Employment In Both Manufacturing And Service Industries
Chart 19Propensity For Precautionary Savings Is Still Elevated
Propensity For Precautionary Savings Is Still Elevated
Propensity For Precautionary Savings Is Still Elevated
Manufacturing investment continued its rebound in April, but the growth has not rallied to its pre-pandemic state and the recovery was more than offset by falling old-economy infrastructure and real estate investment growth (Chart 20). Although a pickup in LG SPB issuance in Q3 will provide some support to infrastructure expenditures, the effect on aggregate infrastructure investment probably will be muted. China’s Ministry of Finance has raised the requirements for approvals of new investment projects, which have decreased notably since early this year (Chart 21). Hence, growth in infrastructure investment may not significantly improve in 2H21 without a harmonized policy impetus for more bank loans and loosened regulations on local government spending. Chart 20Recovery In Manufacturing Investment Was More Than Offset By Falling Infrastructure And Real Estate Investment Growth
Recovery In Manufacturing Investment Was More Than Offset By Falling Infrastructure And Real Estate Investment Growth
Recovery In Manufacturing Investment Was More Than Offset By Falling Infrastructure And Real Estate Investment Growth
Chart 21Falling New Projects Approval
Falling New Projects Approval
Falling New Projects Approval
Real Estate Sector: Mounting Deleverage Pressure Property developers face challenges from heightened government scrutiny on bank loans and limits on the sector’s leverage ratio, along with curtailed off-balance sheet funding due to Asset Management Regulation (AMR) . Bank loans to real estate developers and household mortgages have tumbled to historical lows and will likely slow further in the next few months (Chart 22, top panel). The tightened financing policies have started to cool demand in the real estate market (Chart 22, bottom panel). Softer housing demand will start to drag down property developers’ capital spending and real estate construction activities (Chart 23). Chart 22Deteriorating Financing Starting To Cool The Property Market
Deteriorating Financing Starting To Cool The Property Market
Deteriorating Financing Starting To Cool The Property Market
Chart 23Real Estate Investments And Construction Activities May Slow Further
Real Estate Investments And Construction Activities May Slow Further
Real Estate Investments And Construction Activities May Slow Further
Table 1China Macro Data Summary
The Stars Are Not Yet Aligned For Chinese Stocks
The Stars Are Not Yet Aligned For Chinese Stocks
Table 2China Financial Market Performance Summary
The Stars Are Not Yet Aligned For Chinese Stocks
The Stars Are Not Yet Aligned For Chinese Stocks
Footnotes Cyclical Investment Stance Equity Sector Recommendations
Note: An update on Peru is available on page 10. Highlights The longer it takes the Colombian government to drastically expand fiscal policy and increase social benefits, the higher the risk that next year’s presidential election will result in a win for the left. The government will be slow or reluctant to act and, hence, odds of a left-wing government in one year’s time is increasing. We are not forecasting that radical left-wing candidate Gustavo Petro will win next year’s presidential elections. Our point is that rising odds of a victory will be sufficient to undermine Colombia’s financial markets as the nation’s macro risk premium widens. We are downgrading Colombian equities from neutral to underweight and local currency bonds and sovereign credit from overweight to neutral relative to their respective EM benchmarks. Short the Colombian peso versus the US dollar. Feature Colombia has entered a critical moment in its history. The country was once seen as a beacon of political stability, fiscal orthodoxy, and market friendly policies. However, recent large-scale protests have raised the question as to whether Colombia will move toward the left, as has occurred in Mexico, Argentina and more recently in Peru with the election of Pedro Castillo. The nationwide protests in Colombia were triggered by the government’s attempt to raise taxes amidst a recession. What’s more, these protests are a manifestation of deep-rooted popular anger about poor social security benefits, income inequality and unaffordability of education and health care for a large chunk of the population. Further, angst relating to organized crime and government corruption has boiled over as the government has failed to address these systemic issues. In a nutshell, years of market-friendly conservative policies have widened the gap between “haves” and “have nots”. The recent recession has only exaggerated this income disparity and has unleashed public anger toward the government. Critically, social transfers in Colombia amid the pandemic were among the lowest in the world (Chart 1). Chart 1Colombia: Is A Political Shift To The Left Coming?
Colombia: Is A Political Shift To The Left Coming?
Colombia: Is A Political Shift To The Left Coming?
The main risk to the nation’s financial markets is not that President Duque drastically increases fiscal spending to calm down protests, but rather the rising odds of a left-wing victory in the May 2022 presidential elections. Unfortunately, the current government’s reluctance to let go of traditional economic conservatism could eventually backfire and inadvertently swing the country to the far left. As a result, we are downgrading our stance on Colombian equities from neutral to underweight and are downgrading local and sovereign bonds from overweight to neutral in their respective EM portfolios. Underlying Motives For Popular Discontent There are fundamental grounds for Colombia’s popular discontent. This year’s protests against President Duque echo the sentiment of previous demonstrations that occurred in 2019 and 2020: weak income growth, high income inequality, low government support for social programs, and unsuccessful policies to reduce corruption and organized crime. These issues have not been resolved even as Colombia emerged as one of the most successful economies in the region. In essence, wealth and development have not been felt by the entire population. According to the Gini coefficient, Colombia is the most unequal country among Latin American and OECD nations, even after accounting for taxes and transfers (Chart 2). Colombia suffers from a stubbornly high official unemployment rate which has seldom fallen below double-digit levels in the past two decades (Chart 3). Chart 2Colombia Is One Of The Most Unequal Countries In The World
Colombia: Is A Political Shift To The Left Coming?
Colombia: Is A Political Shift To The Left Coming?
Chart 3Colombia’s Unemployment: High And No Improvement Yet
Colombia: Is A Political Shift To The Left Coming?
Colombia: Is A Political Shift To The Left Coming?
Government cash transfers and spending on pensions and education remain among the lowest of developed and developing nations (Chart 4). Voters are frustrated with the government’s failure to tackle crime and insurgent paramilitary groups, especially given that Duque ran on an anti-crime platform. According to data from Transparency International, Colombian’s perception of government corruption has risen dramatically since 2018 (Chart 5). Chart 4The Government’s Social Spending In Colombia Is Small
Colombia: Is A Political Shift To The Left Coming?
Colombia: Is A Political Shift To The Left Coming?
Chart 5Corruption Perception Has Been Rising
Colombia: Is A Political Shift To The Left Coming?
Colombia: Is A Political Shift To The Left Coming?
Bottom Line: Even though Colombia’s GDP growth has been solid, especially relative to its Latin American peers, the benefits have not been widely distributed across all social groups. The severe recession has highlighted Colombia’s challenges and unleashed popular anger toward the government. When Too Much Economic Orthodoxy Backfires Colombia’s right-wing government has provoked massive public discontent due to its insistence on tightening fiscal policy during the worst recession in the country’s history. In essence, the government tried to pass a tax reform bill which would raise taxes on utilities, consumer goods, and business income at the height of the second wave of the COVID-19 pandemic and amid a massive nominal and real GDP contraction (Chart 6). Chart 6Colombia: The First Nominal GDP Contraction On Record
Colombia: Is A Political Shift To The Left Coming?
Colombia: Is A Political Shift To The Left Coming?
What followed were not only protests but also a broad-based backlash against the government from all corners, including political parties. President Duque has become isolated and is quickly turning into a lame duck president. Duque’s economic policies, his failure to reduce violence from insurgent paramilitary groups in recent years, and his own militant response to protests have made him lose the confidence of voters. Moreover , his failure to control the political upheaval from the outset has made him lose the confidence of international investors. Going forward, the major risk to financial markets will be rising odds that a left-wing candidate might win next year’s presidential elections. Chart 7 illustrates that leftist Gustavo Petro leads other potential contenders by a wide margin. Petro is a former member of a guerilla organization and was the frontrunner in the 2018 presidential election. Chart 7Growing Risks Of A Left-Wing Presidency In 2022
Colombia: Is A Political Shift To The Left Coming?
Colombia: Is A Political Shift To The Left Coming?
If he were to win, it would mark a major pivot from an orthodox/conservative approach to a considerably leftist model of economic policy. Some of his proposals include nationalizing mining companies, de-investing from fossil fuels, government confiscation of land for agriculture, reducing central bank independence, and import substitution policies for the industrial sector. In order to reduce Petro’s odds of winning the election, the current government must splurge on public spending and dramatically reform the country’s social security policies to appease a wide portion of the population. Nevertheless, we believe the government’s response will be too little, too late. Not only is the government reluctant to open the fiscal taps, but it also has no intention of revamping social security, health care and education policies. In fact, talks with protesters have yet to go anywhere after more than a month of a national strike. The current government’s failure to address Colombians’ concerns may boost the popularity of left-wing politicians. As a result, the market could soon start pricing in rising odds of a left-wing presidency in Colombia. This is negative for financial assets. Bottom Line: Investors will soon start realizing that there is a risk that a left-wing government could upend Colombia’s structural backdrop in a year’s time. To reiterate, we are not forecasting that radical left-wing presidential candidate Gustavo Petro will win next year’s presidential elections. Rather, our point is that rising odds of his victory will be sufficient to undermine Colombia’s financial markets as the nation’s macro risk premium widens. Implications For Financial Markets 1. Downgrade equities from neutral to underweight within an EM equity portfolio. A lingering pandemic, dwindling consumer and business confidence, and a broken monetary policy transmission mechanism are major headwinds for the economy and for corporate profits: Various sectors of the economy are struggling to recover, and our proxy for the marginal propensity to spend is suggesting that the economy will underwhelm (Chart 8). Nominal income growth is very weak. One of the reasons is very low inflation – core CPI measures remain below the central bank’s target range (Chart 9). Chart 8Growth Will Surprise To The Downside
Colombia: Is A Political Shift To The Left Coming?
Colombia: Is A Political Shift To The Left Coming?
Chart 9Colombia: Inflation Is Nowhere To Be Seen
Colombia: Is A Political Shift To The Left Coming?
Colombia: Is A Political Shift To The Left Coming?
Commercial banks are not expanding credit and will not do so any time soon. Credit growth is negative, and provisions and non-performing loans will continue rising, reaching historical highs (Chart 10). Given that banks make up a large part of Colombia’s bourse, this will weigh heavily on Colombian equity indexes. Notably, lending rates are higher than warranted by economic conditions. This will make it very difficult for borrowers to service debt. While the central bank (Banrep) has cut rates to a historical low of 1.75%, the nominal prime lending rate is at 8.1% and real (deflated by core inflation) lending rates remain elevated at 6% (Chart 11). Rolling economic lockdowns will impede the economic normalization process. Colombia is still suffering from a deadly second wave of COVID-19 infections. New daily cases and deaths are at all-time highs, and the country’s vaccination drive is falling behind most DM countries and large regional peers. This will further cap economic growth. Chart 10Bank Credit Is Very Weak
Colombia: Is A Political Shift To The Left Coming?
Colombia: Is A Political Shift To The Left Coming?
Chart 11Colombian Lending Rates Are Elevated
Colombia: Is A Political Shift To The Left Coming?
Colombia: Is A Political Shift To The Left Coming?
2. Short the Colombian peso versus the US dollar. The basis is that the current account deficit remains wide at 3.8% of GDP while foreign capital inflows – both FDI and portfolio flows – will wane due to political volatility and rising odds of a left-wing government next year (Chart 12). 3. Downgrade Local Currency Bonds and Sovereign Credit to Neutral Domestic Bonds: While local yields seem quite attractive, currency depreciation risks are too high. The yield curve is incredibly steep and swap rates are pricing in about 75 basis points in rate hikes over the next 12 months (Chart 13). Yet, economic conditions warrant lower not higher interest rates. This makes long-term bond yields attractive, barring the election of a left-wing government next year. Chart 12Balance Of Payments Will Weigh On The Currency
Colombia: Is A Political Shift To The Left Coming?
Colombia: Is A Political Shift To The Left Coming?
Chart 13Colombian Local Bonds: Value Or A Value Trap?
Colombia: Is A Political Shift To The Left Coming?
Colombia: Is A Political Shift To The Left Coming?
Despite very attractive yields and low inflation, the risk-reward tradeoff of overweighting Colombian local bonds is no longer attractive. We are also closing the position of receiving 10-year swap rates. Sovereign credit: The nation’s sovereign credit spreads will widen if and as international agencies downgrade Colombia’s rating. The nation’s sovereign credit spreads are tight because its governments have been known for orthodox macroeconomic policies and prudent debt management. With political pressures for more social spending, sharply rising public debt and growing odds of a left-wing victory in the next presidential elections, sovereign credit might be repriced. We will monitor the situation and if the government fails to appease protesters with higher fiscal spending, we will downgrade our allocation to local currency bonds and sovereign credit further to underweight within their respective EM benchmarks. A Word On The Peruvian Elections The election of left-wing candidate Pedro Castillo in Peru is all but confirmed. While right-wing presidential candidate Keiko Fujimori is alleging signs of fraud and is demanding a recount of hundreds of thousands of votes, it is unlikely that this will change the outcome of the election. Fujimori lost the popular vote by an even smaller margin in 2016 but conceded victory after days of uncertainty. Chart 14Peruvian Stocks Are On The Edge Of A Breakdown
Colombia: Is A Political Shift To The Left Coming?
Colombia: Is A Political Shift To The Left Coming?
Nevertheless, next week will prove to be volatile as the electoral tribunal makes a decision on Fujimori’s appeal. We expect uprisings from voters on both sides: Castillo supporters will defend his triumph and Fujimori supporters will voice their anger at what they perceive to be an unfair election. We continue to recommend an underweight allocation on Peruvian equities within an EM-dedicated equity portfolio. In the short term, Peruvian share prices will suffer from socio-political volatility. In the medium to long term, Castillo’s populist and anti-market policies will undermine business and investor confidence. Chart 14 shows that Peruvian equities have reached critical levels, displaying a tapering wedge technical profile. If they relapse further, it would qualify as a major breakdown. A significant gap down is likely to follow. We also recommend investors maintain a neutral allocation to Peruvian local bonds and downgrade sovereign credit to underweight. While public debt remains low at 22.6% of GDP, an overhaul of orthodox macroeconomic policies requires a re-rating of Peruvian sovereign credit. Juan Egaña Research Analyst juane@bcaresearch.com
On a month-on-month basis, Chinese credit was relatively stable in May. Aggregate financing was flat at CNY 1.92 trillion versus CNY 1.85 trillion in April. Similarly, CNY 1.5 trillion worth of new yuan loans were extended, broadly in line with April’s CNY…
Highlights Geopolitical risk is trickling back into financial markets. China’s fiscal-and-credit impulse collapsed again. The Global Economic Policy Uncertainty Index is ticking back up after the sharp drop from 2020. All of our proprietary GeoRisk Indicators are elevated or rising. Geopolitical risk often rises during bull markets – the Geopolitical Risk Index can even spike without triggering a bear market or recession. Nevertheless a rise in geopolitical risk is positive for the US dollar, which happens to stand at a critical technical point. The macroeconomic backdrop for the dollar is becoming less bearish given China’s impending slowdown. President Biden’s trip to Europe and summit with Russian President Vladimir Putin will underscore a foreign policy of forming a democratic alliance to confront Russia and China, confirming the secular trend of rising geopolitical risk. Shift to a defensive tactical position. Feature Back in March 2017 we wrote a report, “Donald Trump Is Who We Thought He Was,” in which we reaffirmed our 2016 view that President Trump would succeed in steering the US in the direction of fiscal largesse and trade protectionism. Now it is time for us to do the same with President Biden. Our forecast for Biden rested on the same points: the US would pursue fiscal profligacy and mercantilist trade policy. The recognition of a consistent national policy despite extreme partisan divisions is a testament to the usefulness of macro analysis and the geopolitical method. Trump stole the Democrats’ thunder with his anti-austerity and anti-free trade message. Biden stole it back. It was the median voter in the Rust Belt who was calling the shots all along (after all, Biden would still have won the election without Arizona and Georgia). We did make some qualifications, of course. Biden would maintain a hawkish line on China and Russia but he would reject Trump’s aggressive foreign and trade policy when it came to US allies.1 Biden would restore President Obama’s policy on Iran and immigration but not Russia, where there would be no “diplomatic reset.” And Biden’s fiscal profligacy, unlike Trump’s, would come with tax hikes on corporations and the wealthy … even though they would fall far short of offsetting the new spending. This is what brings us to this week’s report: New developments are confirming this view of the Biden administration. Geopolitical Risk And Bull Markets Chart 1Global Geopolitical Risk And The Dollar
Global Geopolitical Risk And The Dollar
Global Geopolitical Risk And The Dollar
In recent weeks Biden has adopted a hawkish policy on China, lowered tensions with Europe, and sought to restore President Obama’s policy of détente with Iran. The jury is still out on relations with Russia – Biden will meet with Putin on June 16 – but we do not expect a 2009-style “reset” that increases engagement. Still, it is too soon to declare a “Biden doctrine” of foreign policy because Biden has not yet faced a major foreign crisis. A major test is coming soon. Biden’s decision to double down on hawkish policy toward China will bring ramifications. His possible deal with Iran faces a range of enemies, including within Iran. His reduction in tensions with Russia is not settled yet. While the specific source and timing of his first major foreign policy crisis is impossible predict, structural tensions are rebuilding. An aggregate of our 13 market-based GeoRisk indicators suggests that global political risk is skyrocketing once again. A sharp spike in the indicator, which is happening now, usually correlates with a dollar rally (Chart 1). This indicator is mean-reverting since it measures the deviation of emerging market currencies, or developed market equity markets, from underlying macroeconomic fundamentals. The implication is positive for the dollar, although the correlation is not always positive. Looking at both the DXY’s level and its rate of change shows periods when the global risk indicator fell yet the dollar stayed strong – and vice versa. The big increase in the indicator over the past week stems mostly from Germany, South Korea, Brazil, and Australia, though all 13 of the indicators are now either elevated or rising, including the China/Taiwan indicators. Some of the increase is due to base effects. As global exports recover, currencies and equities that we monitor are staying weaker than one would expect. This causes the relevant BCA GeoRisk indicator to rise. Base effects from the weak economy in June 2020 will fall out in coming weeks. But the aggregate shows that all of the indicators are either high or rising and, on a country by country level, they are now in established uptrends even aside from base effects. Chart 2Global Policy Uncertainty Revives
Global Policy Uncertainty Revives
Global Policy Uncertainty Revives
Meanwhile the global Economic Policy Uncertainty Index is recovering across the world after the drop in uncertainty following the COVID-19 crisis (Chart 2). Policy uncertainty is also linked to the dollar and this indicator shows that it is rising on a secular basis. The Geopolitical Risk Index, maintained by Matteo Iacoviello and a group of academics affiliated with the Policy Uncertainty Index, is also in a secular uptrend, although cyclically it has not recovered from the post-COVID drop-off. It is sensitive to traditional, war-linked geopolitical risk as reported in newspapers. By contrast our proprietary indicators are sensitive to market perceptions of any kind of risk, not just political, both domestic and international. A comparison of the Geopolitical Risk Index with the S&P 500 over the past century shows that a geopolitical crisis may occur at the beginning of a business cycle but it may not be linked with a recession or bear market. Risk can rise, even extravagantly, during economic expansions without causing major pullbacks. But a crisis event certainly can trigger a recession or bear market, particularly if it is tied to the global oil supply, as in the early 1970s, 1980s, and 1990s (Chart 3). Chart 3Secular Rise In Geopolitical Risk Soon To Reassert Itself
Secular Rise In Geopolitical Risk Soon To Reassert Itself
Secular Rise In Geopolitical Risk Soon To Reassert Itself
While geopolitical risk is normally positive for the dollar, the macroeconomic backdrop is negative. The dollar’s attempt to recover earlier this year faltered. This underlying cyclical bearish dollar trend is due to global economic recovery – which will continue – and extravagant American monetary expansion and budget deficits. This is why we have preferred gold – it is a hedge against both geopolitical risk and inflation expectations. Tactically this year we have refrained from betting against the dollar except when building up some safe-haven positions like Japanese yen. Over the medium and long term we expect geopolitical risk to put a floor under the greenback. The bottom line is that the US dollar is at a critical technical crossroads where it could break out or break down. Macro factors suggest a breakdown but the recovery of global policy uncertainty and geopolitical risk suggests the opposite. We remain neutral. A final quantitative indicator of the recovery of geopolitical risk is the performance of global aerospace and defense stocks (Chart 4). Defense shares are rising in absolute and relative terms. Chart 4Another Sign Of Geopolitical Risk: Defense Stocks Outperform As Virus Ebbs And Military Spending Surges
Another Sign Of Geopolitical Risk: Defense Stocks Outperform As Virus Ebbs And Military Spending Surges
Another Sign Of Geopolitical Risk: Defense Stocks Outperform As Virus Ebbs And Military Spending Surges
Can The WWII Peace Be Prolonged? Qualitative assessments of geopolitical risk are necessary to explain why risk is on a secular upswing – why drops in the quantitative indicators are temporary and the troughs keep getting higher. Great nations are returning to aggressive competition after a period of relative peace and prosperity. Over the past two decades Russia and China took advantage of America’s preoccupations with the Middle East, the financial crisis, and domestic partisanship in order to build up their global influence. The result is a world in which authority is contested. The current crisis is not merely about the end of the post-Cold War international order. It is much scarier than that. It is about the decay of the post-WWII international order and the return of the centuries-long struggle for global supremacy among Great Powers. The US and European political establishments fear the collapse of the WWII settlement in the face of eroding legitimacy at home and rising challenges from abroad. The 1945 peace settlement gave rise to both a Cold War and a diplomatic system, including the United Nations Security Council, for resolving differences among the great powers. It also gave rise to European integration and various institutions of American “liberal hegemony.” It is this system of managing great power struggle, and not the post-Cold War system of American domination, that lies in danger of unraveling. This is evident from the following points: American preeminence only lasted fifteen years, or at best until the 2008 Georgia war and global financial crisis. The US has been an incoherent wild card for at least 13 years now, almost as long as it was said to be the global empire. Russian antagonism with the West never really ended. In retrospect the 1990s were a hiatus rather than a conclusion of this conflict. China’s geopolitical rise has thawed the frozen conflicts in Asia from the 1940s-50s – i.e. the Chinese civil war, the Hong Kong and Taiwan Strait predicaments, the Korean conflict, Japanese pacifism, and regional battles for political influence and territory. Europe’s inward focus and difficulty projecting power have been a constant, as has its tendency to act as a constraint on America. Only now is Europe getting closer to full independence (which helped trigger Brexit). Geopolitical pressures will remain historically elevated for the foreseeable future because the underlying problem is whether great power struggle can be contained and major wars can be prevented. Specifically the question is whether the US can accommodate China’s rise – and whether China can continue to channel its domestic ambitions into productive uses (i.e. not attempts to create a Greater Chinese and then East Asian empire). The Great Recession killed off the “East Asia miracle” phase of China’s growth. Potential GDP is declining, which undermines social stability and threatens the Communist Party’s legitimacy. The renminbi is on a downtrend that began with the Xi Jinping era. The sharp rally during the COVID crisis is over, as both domestic and international pressures are rising again (Chart 5). Chart 5Biden Administration Review Of China Policy: More China Bashing
Biden Administration Review Of China Policy: More China Bashing
Biden Administration Review Of China Policy: More China Bashing
While the data for China’s domestic labor protests is limited in extent, we can use it as a proxy for domestic instability in lieu of official statistics that were tellingly discontinued back in 2005. The slowdown in credit growth and the cyclical sectors of the economy suggest that domestic political risk is underrated in the lead up to the 2022 leadership rotation (Chart 6). Chart 6China's Domestic Political Risk Will Rise
China's Domestic Political Risk Will Rise
China's Domestic Political Risk Will Rise
Chart 7Steer Clear Of Taiwan Strait
Steer Clear Of Taiwan Strait
Steer Clear Of Taiwan Strait
The increasing focus on China’s access to key industrial and technological inputs, the tensions over the Taiwan Strait, and the formation of a Russo-Chinese bloc that is excluded from the West all suggest that the risk to global stability is grave and historic. It is reminiscent of the global power struggles of the seventeenth through early twentieth centuries. The outperformance of Taiwanese equities from 2019-20 reflects strong global demand for advanced semiconductors but the global response to this geopolitical bottleneck is to boost production at home and replace Taiwan. Therefore Taiwan’s comparative advantage will erode even as geopolitical risk rises (Chart 7). The drop in geopolitical tensions during COVID-19 is over, as highlighted above. With the US, EU, and other countries launching probes into whether the virus emerged from a laboratory leak in China – contrary to what their publics were told last year – it is likely that a period of national recriminations has begun. There is a substantial risk of nationalism, xenophobia, and jingoism emerging along with new sources of instability. An Alliance Of Democracies The Biden administration’s attempt to restore liberal hegemony across the world requires a period of alliance refurbishment with the Europeans. That is the purpose of his current trip to the UK, Belgium, and Switzerland. But diplomacy only goes so far. The structural factor that has changed is the willingness of the West to utilize government in the economic sphere, i.e. fiscal proactivity. Infrastructure spending and industrial policy, at the service of national security as well as demand-side stimulus, are the order of the day. This revolution in economic policy – a return to Big Government in the West – poses a threat to the authoritarian powers, which have benefited in recent decades by using central strategic planning to take advantage of the West’s democratic and laissez-faire governance. If the West restores a degree of central government – and central coordination via NATO and other institutions – then Beijing and Moscow will face greater pressure on their economies and fewer strategic options. About 16 American allies fall short of the 2% of GDP target for annual defense spending – ranging from Italy to Canada to Germany to Japan. However, recent trends show that defense spending did indeed increase during the Trump administration (Chart 8). Chart 8NATO Boosts Defense Spending
Joe Biden Is Who We Thought He Was
Joe Biden Is Who We Thought He Was
The European Union as a whole has added $50 billion to the annual total over the past five years. A discernible rise in defense spending is taking place even in Germany (Chart 9). The same point could be made for Japan, which is significantly boosting defense spending (as a share of output) after decades of saying it would do so without following through. A major reason for the American political establishment’s rejection of President Trump was the risk he posed to the trans-Atlantic alliance. A decline in NATO and US-EU ties would dramatically undermine European security and ultimately American security. Hence Biden is adopting the Trump administration’s hawkish approach to trade with China but winding down the trade war with Europe (Chart 10). Chart 9Europe Spending More On Guns
Joe Biden Is Who We Thought He Was
Joe Biden Is Who We Thought He Was
Chart 10US Ends Trade War With Europe?
Joe Biden Is Who We Thought He Was
Joe Biden Is Who We Thought He Was
A multilateral deal aimed at setting a floor in global corporate taxes rates is intended to prevent the US and Europe from undercutting each other – and to ensure governments have sufficient funding to maintain social spending and reduce income inequality (Chart 11). Inequality is seen as having vitiated sociopolitical stability and trust in government in the democracies. Chart 11‘Global’ Corporate Tax Deal Shows Return Of Big Government, Attempt To Reduce Inequality In The West
Joe Biden Is Who We Thought He Was
Joe Biden Is Who We Thought He Was
Risks To Biden’s Diplomacy It is possible that Biden’s attempt to restore US alliances will go nowhere over the course of his four-year term in office. The Europeans may well remain risk averse despite their initial signals of willingness to work with Biden to tackle China’s and Russia’s challenges to the western system. The Germans flatly rejected both Biden and Trump on the Nord Stream II natural gas pipeline linkage with Russia, which is virtually complete and which strengthens the foundation of Russo-German engagement (more on this below). The US’s lack of international reliability – given the potential of another partisan reversal in four years – makes it very hard for countries to make any sacrifices on behalf of US initiatives. The US’s profound domestic divisions have only slightly abated since the crises of 2020 and could easily flare up again. A major outbreak of domestic instability could distract Biden from the foreign policy game.2 However, American incapacity is a risk, not our base case, over the coming years. We expect the US economic stimulus to stabilize the country enough that the internal political crisis will be contained and the US will continue to play a global role. The “Civil War Lite” has mostly concluded, excepting one or two aftershocks, and the US is entering into a “Reconstruction Lite” era. The implication is negative for China and Russia, as they will now have to confront an America that, if not wholly unified, is at least recovering. Congress’s impending passage of the Innovation and Competition Act – notably through regular legislative order and bipartisan compromise – is case in point. The Senate has already passed this approximately $250 billion smorgasbord of industrial policy, supply chain resilience, and alliance refurbishment. It will allot around $50 billion to the domestic semiconductor industry almost immediately as well as $17 billion to DARPA, $81 billion for federal research and development through the National Science Foundation, which includes $29 billion for education in science, technology, engineering, and mathematics, and other initiatives (Table 1). Table 1Peak Polarization: US Congress Passes Bipartisan ‘Innovation And Competition Act’ To Counter China
Joe Biden Is Who We Thought He Was
Joe Biden Is Who We Thought He Was
With the combination of foreign competition, the political establishment’s need to distract from domestic divisions, and the benefit of debt monetization courtesy of the Federal Reserve, the US is likely to achieve some notable successes in pushing back against China and Russia. On the diplomatic front, the US will meet with some success because the European and Asian allies do not wish to see the US embrace nationalism and isolationism. They have their own interests in deterring Russia and China. Lack Of Engagement With Russia Russian leadership has dealt with the country’s structural weaknesses by adopting aggressive foreign policy. At some point either the weaknesses or the foreign policy will create a crisis that will undermine the current regime – after all, Russia has greatly lagged the West in economic development and quality of life (Chart 12). But President Putin has been successful at improving the country’s wealth and status from its miserably low base in the 1990s and this has preserved sociopolitical stability so far. Chart 12Russia's Domestic Political Risk
Russia's Domestic Political Risk
Russia's Domestic Political Risk
It is debatable whether US policy toward Russia ever really changed under President Trump, but there has certainly not been a change in strategy from Russia. Thus investors should expect US-Russia antagonism to continue after Biden’s summit with Putin even if there is an ostensible improvement. The fundamental purpose of Putin’s strategy has been to salvage the Russian empire after the Soviet collapse, ensure that all world powers recognize Russia’s veto power over major global policies and initiatives, and establish a strong strategic position for the coming decades as Russia’s demographic decline takes its toll. A key component of the strategy has been to increase economic self-sufficiency and reduce exposure to US sanctions. Since the invasion of Ukraine in 2014, Putin has rapidly increased Russia’s foreign exchange reserves so as to buffer against shocks (Chart 13). Chart 13Russia Fortified Against US Sanctions
Russia Fortified Against US Sanctions
Russia Fortified Against US Sanctions
Putin has also reduced Russia’s reliance on the US dollar to about 22% (Chart 14), primarily by substituting the euro and gold. Russia will not be willing or able to purge US dollars from its system entirely but it has been able to limit America’s ability to hurt Russia by constricting access to dollars and the dollar-based global financial architecture. Russian Finance Minister Anton Siluanov highlighted this process ahead of the Biden-Putin summit by declaring that the National Wealth Fund will divest of its remaining $40 billion of its US dollar holdings. Chart 14Russia Diversifies From USD
Joe Biden Is Who We Thought He Was
Joe Biden Is Who We Thought He Was
In general this year, Russia is highlighting its various advantages: its resilience against US sanctions, its ability to re-invade Ukraine, its ability to escalate its military presence in Belarus and the Black Sea, and its ability to conduct or condone cyberattacks on vital American food and fuel supplies (Chart 15). Meanwhile the US is suffering from deep political divisions at home and strategic incoherence abroad and these are only starting to be mended by domestic economic stimulus and alliance refurbishment. Chart 15Cyber Security Stocks Recover
Cyber Security Stocks Recover
Cyber Security Stocks Recover
Europe’s risk-aversion when it comes to strategic confrontation with Russia, and the lack of stability in US-Russia relations, means that investors should not chase Russian currency or financial assets amid the cyclical commodity rally. Investors should also expect risk premiums to remain high in developing European economies relative to their developed counterparts. This is true despite the fact that developed market Europe’s outperformance relative to emerging Europe recently peaked and rolled over. From a technical perspective this outperformance looks to subside but geopolitical tensions can easily escalate in the near term, particularly in advance of the Russian and German elections in September (Chart 16). Chart 16Developed Markets In Europe Will Outperform Emerging Europe Unless Russian Geopolitical Risk Abates
Developed Markets In Europe Will Outperform Emerging Europe Unless Russian Geopolitical Risk Abates
Developed Markets In Europe Will Outperform Emerging Europe Unless Russian Geopolitical Risk Abates
Developed Europe trades in line with EUR-RUB and these pair trades all correspond closely to geopolitical tensions with Russia (Chart 17). A notable exception is the UK, whose stock market looks attractive relative to eastern Europe and is much more secure from any geopolitical crisis in this region (Chart 17, bottom panel). The pound is particularly attractive against the Czech koruna, as Russo-Czech tensions have heated up in advance of October’s legislative election there (Chart 18). Chart 17Long UK Versus Eastern Europe
Long UK Versus Eastern Europe
Long UK Versus Eastern Europe
Chart 18Long GBP Versus CZK
Long GBP Versus CZK
Long GBP Versus CZK
Meanwhile Russia and China have grown closer together out of strategic necessity. Germany’s Election And Stance Toward Russia Germany’s position on Russia is now critical. The decision to complete the Nord Stream II pipeline against American wishes either means that the Biden administration can be safely ignored – since it prizes multilateralism and alliances above all things and is therefore toothless when opposed – or it means that German will aim to compensate the Americans in some other area of strategic concern. Washington is clearly attempting to rally the Germans to its side with regard to putting pressure on China over its trade practices and human rights. This could be the avenue for the US and Germany to tighten their bond despite the new milestone in German-Russia relations. The US may call on Germany to stand up for eastern Europe against Russian aggression but on that front Berlin will continue to disappoint. It has no desire to be drawn into a new Cold War given that the last one resulted in the partition of Germany. The implication is negative for China on one hand and eastern Europe on the other. Germany’s federal election on September 26 will be important because it will determine who will succeed Chancellor Angela Merkel, both in Germany and on the European and global stage. The ruling Christian Democratic Union (CDU) is hoping to ride Merkel’s coattails to another term in charge of the government. But they are likely to rule alongside the Greens, who have surged in opinion polls in recent years. The state election in Saxony-Anhalt over the weekend saw the CDU win 37% of the popular vote, better than any recent result, while Germany’s second major party, the Social Democrats, continued their decline (Table 2). The far-right Alternative for Germany won 21% of the vote, a downshift from 2016, while the Greens won 6% of the vote, a slight improvement from 2016. All parties underperformed opinion polling except the CDU (Chart 19). Table 2Saxony-Anhalt Election Results
Joe Biden Is Who We Thought He Was
Joe Biden Is Who We Thought He Was
Chart 19Germany: Conservatives Outperform In Final State Election Before Federal Vote, But Face Challenges
Joe Biden Is Who We Thought He Was
Joe Biden Is Who We Thought He Was
Chart 20Germany: Greens Will Outperform in 2021 Vote
Germany: Greens Will Outperform in 2021 Vote
Germany: Greens Will Outperform in 2021 Vote
The implication is still not excellent for the CDU. Saxony-Anhalt is a middling German state, a CDU stronghold, and a state with a popular CDU leader. So it is not representative of the national campaign ahead of September. The latest nationwide opinion polling puts the CDU at around 25% support. They are neck-and-neck with the Greens. The country’s left- and right-leaning ideological blocs are also evenly balanced in opinion polls (Chart 20). A potential concern for the CDU is that the Free Democratic Party is ticking up in national polls, which gives them the potential to steal conservative votes. Betting markets are manifestly underrating the chance that Annalena Baerbock and the Greens take over the chancellorship (Charts 21A and 21B). We still give a subjective 35% chance that the Greens will lead the next German government without the CDU, a 30% that the Greens will lead with the CDU, and a 25% chance that the CDU retains power but forms a coalition with the Greens. A coalition government would moderate the Greens’ ambitious agenda of raising taxes on carbon emissions, wealth, the financial sector, and Big Tech. The CDU has already shifted in a pro-environmental, fiscally proactive direction. Chart 21AGerman Greens Will Recover
Joe Biden Is Who We Thought He Was
Joe Biden Is Who We Thought He Was
Chart 21BGerman Greens Still Underrated
Joe Biden Is Who We Thought He Was
Joe Biden Is Who We Thought He Was
No matter what the German election will support fiscal spending and European solidarity, which is positive for the euro and regional equities over the next 12 to 24 months. However, the Greens would pursue a more confrontational stance toward Russia, a petro-state whose special relations with the German establishment have impeded the transition to carbon neutrality. Latin America’s Troubles A final aspect of Biden’s agenda deserves some attention: immigration and the Mexican border. Obviously this one of the areas where Biden starkly differs from Trump, unlike on Europe and China, as mentioned above. Vice President Kamala Harris recently came back from a trip to Guatemala and Mexico that received negative media attention. Harris has been put in charge of managing the border crisis, the surge in immigrant arrivals over 2020-21, both to give her some foreign policy experience and to manage the public outcry. Despite telling immigrants explicitly “Do not come,” Harris has no power to deter the influx at a time when the US economy is fired up on historic economic stimulus and the Democratic Party has cut back on all manner of border and immigration enforcement. From a macro perspective the real story is the collapse of political and geopolitical risk in Mexico. From 2016-20 Mexico faced a protectionist onslaught from the Trump administration and then a left-wing supermajority in Congress. But these structural risks have dissipated with the USMCA trade deal and the inability of President Andrés Manuel López Obrador to follow through with anti-market reforms, as we highlighted in reports in October and April. The midterm election deprived the ruling MORENA party of its single-party majority in the Chamber of Deputies, the lower house of the legislature (Chart 22). AMLO is now politically constrained – he will not be able to revive state control over the energy and power sectors. Chart 22Mexican Midterm Election Constrained Left-Wing Populism, Political Risk
Joe Biden Is Who We Thought He Was
Joe Biden Is Who We Thought He Was
Chart 23Buy Mexico (And Canada) On US Stimulus
Buy Mexico (And Canada) On US Stimulus
Buy Mexico (And Canada) On US Stimulus
American monetary and fiscal stimulus, and the supply-chain shift away from China, also provide tailwinds for Mexico. In short, the Mexican election adds the final piece to one of our key themes stemming from the Biden administration, US populism, and US-China tensions: favor Mexico and Canada (Chart 23). A further implication is that Mexico should outperform Brazil in the equity space. Brazil is closely linked to China’s credit cycle and metals prices, which are slated to turn down as a result of Chinese policy tightening. Mexico is linked to the US economy and oil prices (Chart 24). While our trade stopped out at -5% last week we still favor the underlying view. Brazilian political risk and unsustainable debt dynamics will continue to weigh on the currency and equities until political change is cemented in the 2022 election and the new government is then forced by financial market riots into undertaking structural reforms. Chart 24Brazil's Troubles Not Truly Over - Mexico Will Outperform
Brazil's Troubles Not Truly Over - Mexico Will Outperform
Brazil's Troubles Not Truly Over - Mexico Will Outperform
Elsewhere in Latin America, the rise of a militant left-wing populist to the presidency in a contested election in Peru, and the ongoing social unrest in Colombia and Chile, are less significant than the abrupt slowdown in China’s credit growth (Charts 25A and 25B). According to our COVID-19 Social Stability Index, investors should favor Mexico. Turkey, the Philippines, South Africa, Colombia, and Brazil are the most likely to see substantial social instability according to this ranking system (Table 3). Chart 25AMexico To Outperform Latin America
Mexico To Outperform Latin America
Mexico To Outperform Latin America
Chart 25BChina’s Slowdown Will Hit South America
China's Slowdown Will Hit South America
China's Slowdown Will Hit South America
Table 3Post-COVID Emerging Market Social Unrest Only Just Beginning
Joe Biden Is Who We Thought He Was
Joe Biden Is Who We Thought He Was
Investment Takeaways Close long emerging markets relative to developed markets for a loss of 6.8% – this is a strategic trade that we will revisit but it faces challenges in the near term due to China’s slowdown (Chart 26). Go long Mexican equities relative to emerging markets on a strategic time frame. Our long Mexico / short Brazil trade hit the stop loss at 5% but the technical profile and investment thesis are still sound over the short and medium term. Chart 26China Slowdown, Geopolitical Risk Will Weigh On Emerging Markets
China Slowdown, Geopolitical Risk Will Weigh On Emerging Markets
China Slowdown, Geopolitical Risk Will Weigh On Emerging Markets
Chart 27Relative Uncertainty And Safe Havens
Relative Uncertainty And Safe Havens
Relative Uncertainty And Safe Havens
China’s sharp fiscal-and-credit slowdown suggests that investors should reduce risk exposure, take a defensive tactical positioning, and wait for China’s policy tightening to be priced before buying risky assets. Our geopolitical method suggests the dollar will rise, while macro fundamentals are becoming less dollar-bearish due to China. We are neutral for now and will reassess for our third quarter forecast later this month. If US policy uncertainty falls relative to global uncertainty then the EUR-USD will also fall and safe-haven assets like Swiss bonds will gain a bid (Chart 27). Gold is an excellent haven amid medium-term geopolitical and inflation risks but we recommend closing our long silver trade for a gain of 4.5%. Disfavor emerging Europe relative to developed Europe, where heavy discounts can persist due to geopolitical risk premiums. We will reassess after the Russian Duma election in September. Go long GBP-CZK. Close the Euro “laggards” trade. Go long an equal-weighted basket of euros and US dollars relative to the Chinese renminbi. Short the TWD-USD on a strategic basis. Prefer South Korea to Taiwan – while the semiconductor splurge favors Taiwan, investors should diversify away from the island that lies at the epicenter of global geopolitical risk. Close long defense relative to cyber stocks for a gain of 9.8%. This was a geopolitical “back to work” trade but the cyber rebound is now significant enough to warrant closing this trade. Matt Gertken Vice President Geopolitical Strategy mattg@bcaresearch.com Footnotes 1 Trump’s policy toward Russia is an excellent example of geopolitical constraints. Despite any personal preferences in favor of closer ties with Russia, Trump and his administration ultimately reaffirmed Article 5 of NATO, authorized the sale of lethal weapons to Ukraine, and deployed US troops to Poland and the Czech Republic. 2 As just one example, given the controversial and contested US election of 2020, it is possible that a major terrorist attack could occur. Neither wing of America’s ideological fringes has a monopoly on fanaticism and violence. Meanwhile foreign powers stand to benefit from US civil strife. A truly disruptive sequence of events in the US in the coming years could lead to greater political instability in the US and a period in which global powers would be able to do what they want without having to deal with Biden’s attempt to regroup with Europe and restore some semblance of a global police force. The US would fall behind in foreign affairs, leaving power vacuums in various regions that would see new sources of political and geopolitical risk crop up. Then the US would struggle to catch up, with another set of destabilizing consequences.
BCA Research’s Emerging Markets Strategy service recommends that investors overweight the KOSPI within an EM equity portfolio. Korean share prices have been moving sideways in recent months. Margin loans for security purchases and the number of equity…
Highlights US labor-market disappointments notwithstanding, the global recovery being propelled by real GDP growth in the world's major economies is on track to be the strongest in 80 years. This growth will fuel commodity demand, which increasingly confronts tighter supply. Higher commodity prices will ensue, and feed through to realized and expected inflation. Manufacturers will continue to see higher input and output prices. Our modeling suggests the USD will weaken to end-2023; however, most of the move already has occurred. Real US rates will remain subdued, as the Fed looks through PCE inflation rates above its 2% target and continues to focus on its full-employment mandate (Chart of the Week). Given these supportive inflation fundamentals, we remain long gold with a price target of $2,000/oz for this year. We are upgrading silver to a strategic position, expecting a $30/oz price by year-end. We remain long the S&P GSCI Dynamic Roll Index ETF (COMT) and the S&P GSCI, expecting tight supply-demand balances to steepen backwardations in forward curves, and long the Global Metals & Mining Producers ETF (PICK). Global economic policy uncertainty will remain elevated until broader vaccine distributions reduce lockdown risks. Feature The recovery of the global economy catalyzed by massive monetary accommodation and fiscal stimulus is on track to be the strongest in the past 80 years, according to the World Bank.1 The Bank revised its growth expectation for real GDP this year sharply higher – to 5.6% from its January estimate of 4.1%. For 2022, the rate of global real GDP growth is expected to slow to 4.3%, which is still significantly higher than the average 3% growth of 2018-19. DM economies are expected to grow at a 4% rate this year – double the average 2018-19 rate – while EM growth is expected to come in at 6% this year vs a 4.2% average for 2018-19. The big drivers of growth this year will be China, where the Bank expects an unleashing of pent-up demand to push real GDP up by 8.5%, and the US, where massive fiscal and monetary support will lift real GDP 6.8%. The Bank expects other DM economies will contribute to this growth, as well. Growth in EM economies will be supported by stronger demand and higher commodity prices, in the Bank's forecast. Commodity demand is recovering faster than commodity supply in the wake of this big-economy GDP recovery. As a result, manufacturers globally are seeing significant increases in input and output prices (Chart 2). Chart of the WeekUS Real Rates Continue To Languish
Gold, Silver, Indexes Favored As Inflation Looms
Gold, Silver, Indexes Favored As Inflation Looms
Chart 2Global Manufacturers' Prices Moving Higher
Gold, Silver, Indexes Favored As Inflation Looms
Gold, Silver, Indexes Favored As Inflation Looms
These price increases at the manufacturing level reflect the higher-price environment in global commodity markets, particularly in industrial commodities – i.e., bulks like iron ore and steel; base metals like copper and aluminum; and oil prices, which touch most processes involved in getting materials out of the ground and into factories before they make their way to consumers, who then drive to stores to pick up goods or have them delivered. Chart 3Commodity Price Increases Reflected in CPI Inflation Expectations
Commodity Price Increases Reflected in CPI Inflation Expectations
Commodity Price Increases Reflected in CPI Inflation Expectations
These price pressures are being picked up in 5y5y CPI swaps markets, which are cointegrated with commodity prices (Chart 3). This also is showing up in shorter-tenor inflation gauges – monthly CPI and 2y CPI swaps. Oil prices, in particular, will be critical to the evolution of 5-year/5-year (5y5y) CPI swap rates, which are closely followed by fixed-income markets (Chart 4). Chart 4Oil Prices Are Key To 5Y5Y CPI Swap Rates
Oil Prices Are Key To 5Y5Y CPI Swap Rates
Oil Prices Are Key To 5Y5Y CPI Swap Rates
Higher Gold Prices Expected CPI inflation expectations drive 5-year and 10-year real rates, which are important explanatory variables for gold prices (Chart 5).2 In addition, the massive monetary and fiscal policy out of the US also is driving expectations for a lower USD: Currency debasement fears are higher than they otherwise would be, given all the liquidity and stimulus sloshing around global markets, which also is bullish for gold (Chart 6). Chart 5Weaker Real Rates Bullish For Gold
Weaker Real Rates Bullish For Gold
Weaker Real Rates Bullish For Gold
Chart 6Weaker USD Supports Gold
Weaker USD Supports Gold
Weaker USD Supports Gold
All of these effects, particularly the inflationary impacts, are summarized in our fair-value gold model (Chart 7). At the beginning of 2021, our fair-value gold model indicated price would be closer to $2,005/oz, which was well above the actual gold price in January. Gold prices have remained below the fair value model since the beginning of 2021. The model explains gold prices using real rates, TWIB, US CPI and global economic policy uncertainty. Based on our modeling, we expect these variables to continue to be supportive of gold, bolstering our view the yellow metal will reach $2000/ oz this year. Unlike industrial commodities, gold prices are sensitive to speculative positioning and technical indicators. Our gold composite indicator shows that gold prices may be reflecting bullish sentiment. This sentiment likely reflects increasing inflation expectations, which we use as an explanatory variable for gold prices. The fact that gold is moving higher on sentiment is corroborated by the latest data point from Marketvane’s gold bullish consensus, which reported 72% of the traders expect prices to rise further (Chart 8). Chart 7BCAs Gold Fair-Value Model Supports 00/oz View
BCAs Gold Fair-Value Model Supports $2000/oz View
BCAs Gold Fair-Value Model Supports $2000/oz View
Chart 8Sentiment Supports Oil Prices
Sentiment Supports Oil Prices
Sentiment Supports Oil Prices
Investment Implications The massive monetary and fiscal stimulus that saw the global economy through the worst of the economic devastation of the COVID-19 pandemic is now bubbling through the real economy, and will, if the World Bank's assessment proves out, result in the strongest real GDP growth in 80 years. Liquidity remains abundant and interest rates – real and nominal – remain low. In its latest Global Economic Prospects, the Bank notes, " The literature generally suggests that monetary easing, both conventional and unconventional, typically boosts aggregate demand and inflation with a lag of 1-3 years …" The evidence for this is stronger for DM economies than EM; however, as the experience in China shows, scale matters. If the Bank's assessment is correct, the inflationary impulse from this stimulus should be apparent now – and it is – and will endure for another year or two. This stimulus has catalyzed organic growth and will continue to do so for years, particularly in economies pouring massive resources into renewable-energy generation and the infrastructure required to support it, a topic we have been writing about for some time.3 We remain long gold with a price target of $2,000/oz for this year. We are long silver on a tactical basis, but given our growth expectations, are upgrading this to a strategic position, expecting a $30/oz price by year-end. As we have noted in the past, silver is sensitive to all of the financial factors we consider when assessing gold markets, and it has a strong industrial component that accounts for more than half of its demand.4 Supportive fundamentals remain in place, with total supply (mine output and recycling) falling, demand rising and balances tightening (Chart 9). Worth noting is silver's supply is constrained because of underinvestment in copper production at the mine level, where silver is a by-product. On the demand side, continued recovery of industrial and consumer demand will keep silver prices well supported. In terms of broad commodity exposure, we remain long the S&P GSCI Dynamic Roll Index ETF (COMT) and the S&P GSCI, expecting tight supply-demand balances to continue to draw down inventories – particularly in energy and metals markets – which will lead to steeper backwardations in forward curves. Backwardation is the source of roll-yields for long commodity index investments. Investors initially have a long exposure in deferred commodity futures contracts, which are then liquidated and re-established when these contracts become more prompt (i.e., closer to delivery). If the futures' forward curves are backwardated, investors essentially are buying the deferred contracts at a lower price than the price at which the position likely is liquidated. We also remain long the Global Metals & Mining Producers ETF (PICK), an equity vehicle that spans miners and traders; the longer discounting horizon of equity markets suits our view on metals. Chart 9Upgrading Silver To Strategic Position
Gold, Silver, Indexes Favored As Inflation Looms
Gold, Silver, Indexes Favored As Inflation Looms
Chart 10Wider Vaccine Distribution Will Support Gold Demand
Gold, Silver, Indexes Favored As Inflation Looms
Gold, Silver, Indexes Favored As Inflation Looms
Global economic policy uncertainty will remain elevated until broader vaccine distributions reduce lockdown risks. We expect the wider distribution of vaccines will become increasingly apparent during 2H21 and in 2022. This will be bullish for physical gold demand – particularly in China and India – which will add support for our gold position (Chart 10). Robert P. Ryan Chief Commodity & Energy Strategist rryan@bcaresearch.com Ashwin Shyam Research Associate Commodity & Energy Strategy ashwin.shyam@bcaresearch.com Commodities Round-Up Energy: Bullish The US EIA expects Brent crude oil prices to fall to $60/bbl next year, given its call higher production from OPEC 2.0 and the US shales will outpace demand growth. The EIA expects global oil demand will average just under 98mm this year, or 5.4mm b/d above 2020 levels. For next year, the EIA is forecasting demand will grow 3.6mm b/d, averaging 101.3mm b/d. This is slightly less than the demand growth we expect next year – 101.65mm b/d. We are expecting 2022 Brent prices to average $73/bbl, and $78/bbl in 2023. We will be updating our oil balances and price forecasts in next week's publication. Base Metals: Bullish Pedro Castillo, the socialist candidate in Peru's presidential election, held on to a razor-thin lead in balloting as we went to press. Markets have been focused on the outcome of this election, as Castillo has campaigned on increasing taxes and royalties for mining companies operating in Peru, which accounts for ~10% of global copper production. The election results are likely to be contested by opposition candidate rival Keiko Fujimori, who has made unsubstantiated claims of fraud, according to reuters.com. Copper prices traded on either side of $4.50/lb on the CME/COMEX market as the election drama was unfolding (Chart 11). Precious Metals: Bullish As economies around the world reopen and growth rebounds, car manufacturing will revive. Stricter emissions regulations mean the demand for autocatalysts – hence platinum and palladium – will rise with the recovery in automobile production. Platinum is also used in the production of green hydrogen, making it an important metal for the shift to renewable energy. On the supply side, most platinum shafts in South Africa are back to pre-COVID-19 levels, according to Johnson Matthey, the metals refiner. As a result, supply from the world’s largest platinum producer will rebound by 40%, resulting in a surplus. South Africa accounts for ~ 70% of global platinum supply. The fact that an overwhelming majority of platinum comes from a nation which has had periodic electricity outages – the most recent one occurring a little more than a week ago – could pose a supply-side risk to this metal. This could introduce upside volatility to prices (Chart 12). Ags/Softs: Neutral As of 6 June, 90% of the US corn crop had emerged vs a five-year average of 82%; 72% of the crop was reported to be in good to excellent condition vs 75% at this time last year. Chart 11
Political Risk in Chile and Peru Could Bolster Copper Prices
Political Risk in Chile and Peru Could Bolster Copper Prices
Chart 12
Platinum Prices Going Up
Platinum Prices Going Up
Footnotes 1 Please see World Bank's Global Economic Prospects update, published June 8, 2021. 2 In fact, US Treasury Inflation-Indexed securities include the CPI-U as a factor in yield determination. 3 For our latest installment of this epic evolution, please see A Perfect Energy Storm On The Way, which we published last week. It is available at ces.bcareserch.com. 4 Please see Higher Inflation Expectations Battle Lower Risk Premia In Gold Markets, which we published February 4, 2021. It is available at ces.bcareserch.com. Investment Views and Themes Strategic Recommendations Tactical Trades Commodity Prices and Plays Reference Table Trades Closed in 2021 Summary of Closed Trades
Higher Inflation On The Way
Higher Inflation On The Way
Highlights As commodity inflation subsides, so will broader inflation. As broader inflation subsides, so will inflation expectations – because inflation expectations just follow realised inflation. Overweight US T-bonds versus TIPS. Overweight UK gilts versus index-linked gilts. Within equities, sell the reflation trades: specifically, go underweight basic materials and industrials. Underweight commodity currencies, such as the Canadian dollar, South African rand, and Norwegian krone. Fractal trade shortlist: ZAR/USD, HUF/USD, AMC Entertainment. Feature Chart of the WeekThe Inflation Bubble Will Burst
The Inflation Bubble Will Burst
The Inflation Bubble Will Burst
In the past few weeks, most commodity prices have undergone healthy corrections. Relative to recent peaks, the lumber price has plunged by 30 percent, while wheat, iron ore, and DRAM (semiconductor) prices are almost 15 percent lower. The price of copper, together with other industrial metals, is also down, albeit by a more modest 5 percent (Chart I-2). Chart I-2Most Commodity Prices Have Corrected
Most Commodity Prices Have Corrected
Most Commodity Prices Have Corrected
Oil is the only major commodity that has not corrected (yet), but even here, the 1-year inflation rate has plummeted. This is highly significant, as the oil inflation rate feeds straight into the headline CPI inflation rate. Hence, we can say with reasonable conviction that the inflation bubble will soon burst (Chart I-1). What drove the spike in inflation? The answer is that as industries reconfigured for the end of lockdowns, supply bottlenecks in some commodities and services led to understandable surges in their prices. These price surges unleashed fears about inflation, causing investors to pile into inflation hedges. This drove up commodity prices further and more broadly… which added to the inflation fears…which added more fuel to the mania in inflation expectations. And so, the indiscriminate rally in commodities continued. The indiscriminate rally in commodity prices is ending. But supply bottlenecks eventually ease, at which point the price spike corrects – in some cases violently – and the indiscriminate rally in commodity prices ends. This is what we are witnessing now. As commodity inflation subsides, so will broader inflation. And as inflation subsides, so will inflation expectations – because inflation expectations just follow realised inflation. The Markets Are Lousy At Predicting Inflation We now come to a profound question. Why do inflation expectations just follow realised inflation? (Chart I-3) After all, the chances are low that inflation in the future will be the same as it was in the past (Chart I-4). Chart I-3Inflation Expectations Just Follow Realised Inflation
Inflation Expectations Just Follow Realised Inflation
Inflation Expectations Just Follow Realised Inflation
Chart I-4AThe Markets Are Lousy At Predicting Inflation
The Markets Are Lousy At Predicting Inflation
The Markets Are Lousy At Predicting Inflation
Chart I-4BThe Markets Are Lousy At Predicting Inflation
The Markets Are Lousy At Predicting Inflation
The Markets Are Lousy At Predicting Inflation
The answer comes from our insensitivity to changes in low inflation rates. We cannot perceive changes in the broad inflation rate between -1 and 3 percent, a range we just perceive as ‘price stability’. For example, if a loaf of bread costs £1.50 today, most people cannot perceive the difference between it costing £1.44 two years ago (2 percent inflation) or £1.47 pence (1 percent inflation). Quality improvements compound the perception difficulty. If the loaf used to cost £1.47 pence but the ingredients and nutritional quality are 5 percent better today, then the quality-adjusted price has gone down. The inflation rate is -1 percent! Inflation rates within a low range just feel the same to us, so it is impossible to fine-tune our inflation expectations. As inflation rates within a low range just feel the same to us, it is impossible to fine-tune our inflation expectations. Therefore, when asked to quantify our inflation expectation, we just anchor on the latest realised number. Which explains why inflation expectations just follow realised inflation. Unfortunately, central banks persist in thinking of inflation as a linear phenomenon which they can nail to one decimal place, as if the decimal point means something! But, to repeat, we cannot perceive much difference between low rates of inflation. The entire range of low inflation just feels like price stability. Therefore, within this range, our behaviour stays unchanged. And if our behaviour is unchanged, what is the transmission mechanism to fine-tune inflation within the -1 to 3 percent range? In fact, inflation is a non-linear phenomenon, with two phases: price stability and price instability. Hence, policymakers can undoubtedly take an economy from price stability into price instability – and often do, as witnessed recently in Argentina, Venezuela, and Turkey (Chart I-5). Chart I-5The Choice Is Price Stability Or Price Instability
The Choice Is Price Stability Or Price Instability
The Choice Is Price Stability Or Price Instability
But if a major developed economy tried to take the road to price instability, the ensuing collapse in asset prices would unleash a massive deflationary impulse, as we explained in The Road To Inflation Ends At Deflation. Time To Sell The Reflation Trades Our insensitivity to small changes in low inflation rates contrasts with our very finely-tuned sensation of changes in low nominal interest rates. For example, if your UK floating mortgage rate was tied to the Bank of England policy rate, and the Bank hiked the policy rate to 0.25 percent, your monthly mortgage payment would double. Which would really hurt!1 Contrast this with an alternative situation in which the UK inflation rate fell by 0.25 percent from, say, 0.1 percent to -0.15 percent. In this case, the real interest rate would double. Yet you would barely notice it. Proving again that changes in low inflation rates are imperceptible. All of this has important implications for how we should interpret real interest rates. An ex-post (historical) real interest rates is reliable because it is the true historical nominal interest less the true historical inflation rate. However, an ex-ante (expected) real interest rate is unreliable because it is the true prospective nominal interest less the predicted inflation rate. The problem is that the predicted inflation rate will almost certainly turn out to be wrong. Inflation expectations are too high. In short, if commodity inflation is rolling over, then inflation expectations are too high. The upshot is that the ex-ante real interest rate, as priced by Treasury Inflation Protected Securities (TIPS) and UK index-linked gilt yields is too low – at least, relative to nominal yields. Which leads to the following investment conclusions: 1. Overweight US T-bonds versus TIPS. 2. Overweight UK gilts versus index-linked gilts. 3. Within equities, it is time to sell the reflation trades: specifically, go underweight basic materials and industrials – which are just a proxy for inflation expectations (Chart I-6). Chart I-6Basic Materials And Industrials Are Just Tracking Inflation Expectations
CAD/USD Is Just Tracking Inflation Expectations
CAD/USD Is Just Tracking Inflation Expectations
4. Underweight commodity currencies, such as the Canadian dollar, South African rand, and Norwegian krone. In fact, CAD/USD is just a very tight play on inflation expectations. Nothing more, nothing less (Chart I-7). Moreover, the fragile fractal structures for CAD/USD and ZAR/USD confirm that both commodity currencies are vulnerable to correction (Chart I-8). Chart I-7CAD/USD Is Just Tracking Inflation Expectations
Basic Materials And Industrials Are Just Tracking Inflation Expectations
Basic Materials And Industrials Are Just Tracking Inflation Expectations
Chart I-8ZAR/USD Is Vulnerable To Correction
ZAR/USD Is Vulnerable To Correction
ZAR/USD Is Vulnerable To Correction
5. In addition, HUF/USD is also vulnerable to correction given that a sharper rise in Hungarian inflation expectations have already driven up the currency cross (Chart I-9). A recommended trade is to short HUF/USD, setting the profit target and symmetrical stop-loss at 3 percent. Chart I-9HUF/USD Is Vulnerable To Correction
HUF/USD Is Vulnerable To Correction
HUF/USD Is Vulnerable To Correction
Fractal Analysis Of ‘Meme’ Stocks Finally, several clients have asked if the use of fractal analysis can be extended from indexes and asset-classes to individual stocks. The answer is an emphatic yes. Fractal analysis works by identifying when the time horizons of investors setting the investment’s price has become dangerously skewed to short-term horizons. At this point, as longer-term value investors are missing from the price setting process, the price becomes unmoored from the longer-term valuation anchor. Eventually though, when the longer-term investors re-enter the price setting process, the price snaps back towards the valuation anchor. This makes fractal analysis particularly suitable for identifying when ‘meme’ stock rallies – fuelled by aggressive trend-following – are most susceptible to correct. Right now, the recent 700 percent rally in the meme stock, AMC Entertainment, is at such a point of vulnerability (Chart I-10). Chart I-10AMC Entertainment's Aggressive Rally Is At A Point Of Vulnerability
AMC Entertainment's Aggressive Rally Is At A Point Of Vulnerability
AMC Entertainment's Aggressive Rally Is At A Point Of Vulnerability
On this basis, a recommended trade is to short AMC, setting the profit target and symmetrical stop-loss at 100 percent. Dhaval Joshi Chief Strategist dhaval@bcaresearch.com Footnotes 1 In this illustrative example, we assume that the mortgage rate equals the base rate plus 0.1 percent. Hence, if the base rate rose from 0.1 percent to 0.25 percent, the mortgage rate would rise from 0.2 percent to 0.35 percent, a near doubling. Fractal Trading System Fractal Trades 6-Month Recommendations Structural Recommendations Closed Fractal Trades Closed Trades Asset Performance Equity Market Performance Indicators To Watch - Bond Yields Chart II-1Indicators To Watch - Bond Yields ##br##- Euro Area
Indicators To Watch - Bond Yields - Euro Area
Indicators To Watch - Bond Yields - Euro Area
Chart II-2Indicators To Watch - Bond Yields ##br##- Europe Ex Euro Area
Indicators To Watch - Bond Yields - Europe Ex Euro Area
Indicators To Watch - Bond Yields - Europe Ex Euro Area
Chart II-3Indicators To Watch - Bond Yields ##br##- Asia
Indicators To Watch - Bond Yields - Asia
Indicators To Watch - Bond Yields - Asia
Chart II-4Indicators To Watch - Bond Yields ##br##- Other Developed
Indicators To Watch - Bond Yields - Other Developed
Indicators To Watch - Bond Yields - Other Developed
Indicators To Watch - Interest Rate Expectations Chart II-5Indicators To Watch - Interest Rate Expectations
Indicators To Watch - Interest Rate Expectations
Indicators To Watch - Interest Rate Expectations
Chart II-6Indicators To Watch - Interest Rate Expectations
Indicators To Watch - Interest Rate Expectations
Indicators To Watch - Interest Rate Expectations
Chart II-7Indicators To Watch - Interest Rate Expectations
Indicators To Watch - Interest Rate Expectations
Indicators To Watch - Interest Rate Expectations
Chart II-8Indicators To Watch - Interest Rate Expectations
Indicators To Watch - Interest Rate Expectations
Indicators To Watch - Interest Rate Expectations
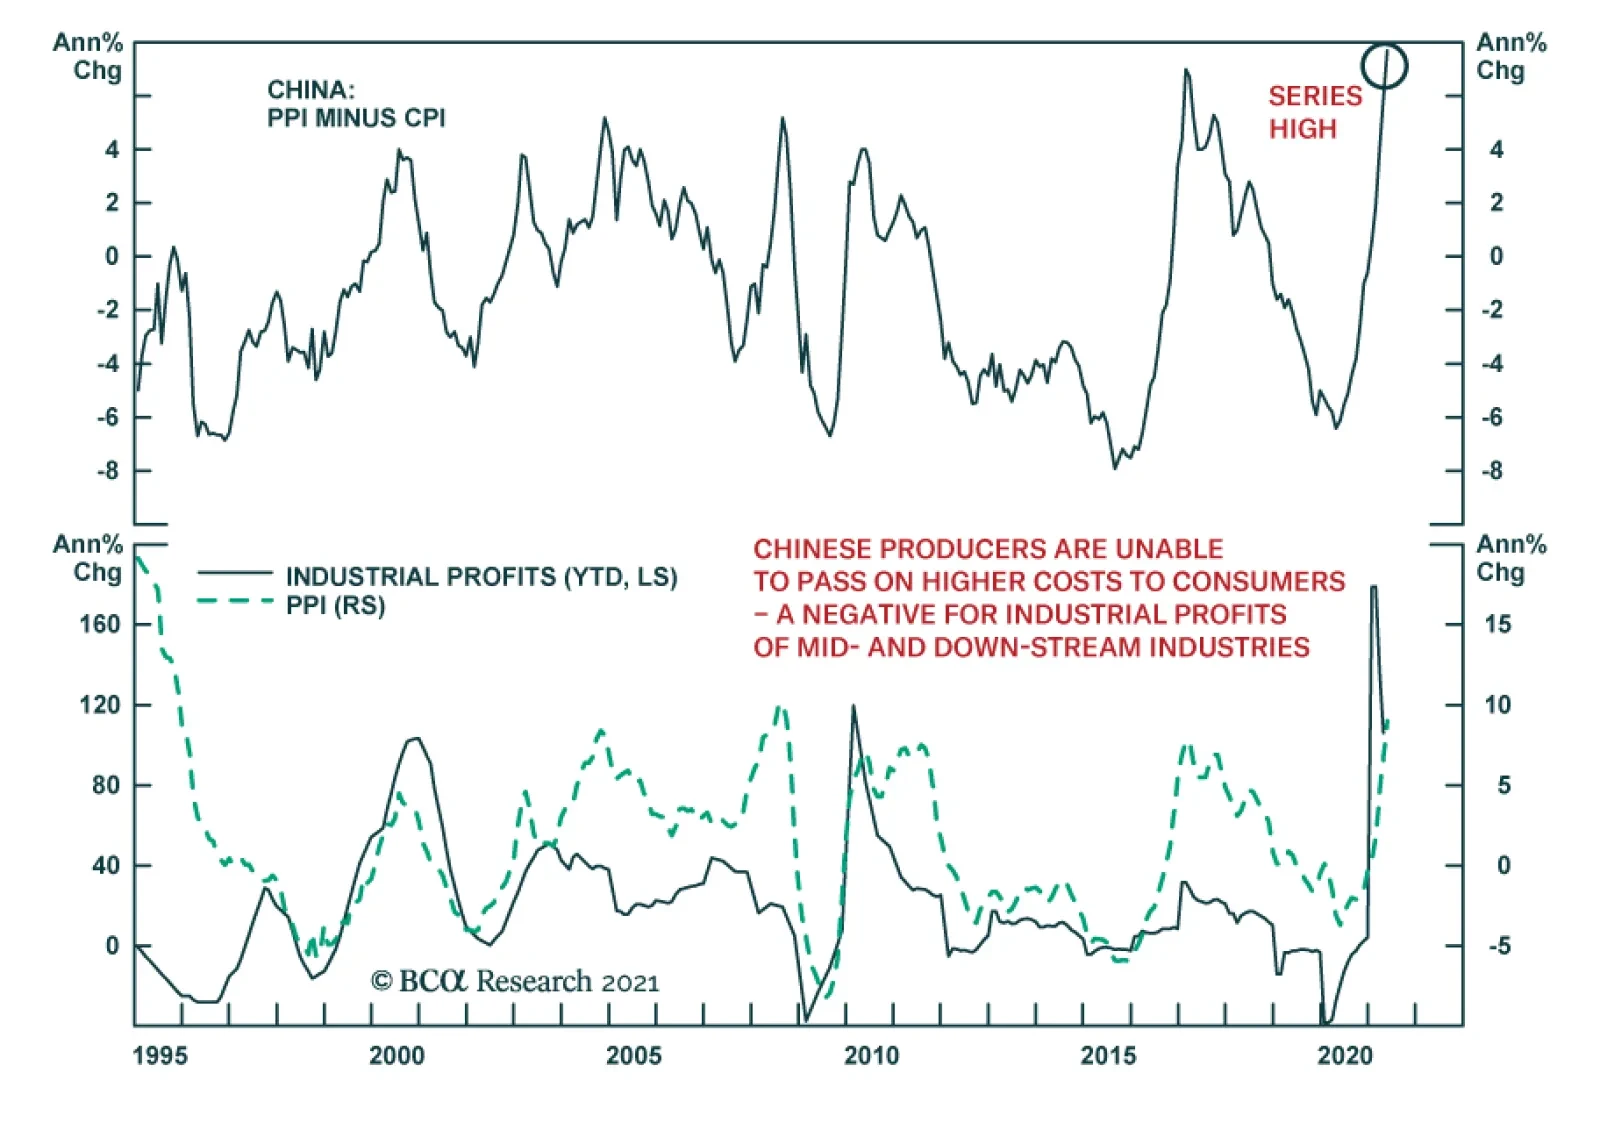
Chinese producer prices surprised to the upside in May, jumping to a 13-year high of 9.0% y/y from 6.8% y/y, above the expected 8.5% y/y. Meanwhile, inflationary pressures were much more muted for Chinese consumers. The 12.0% increase in the producer goods…
Highlights In the near term, the RMB against the US dollar has ceased to be a one-way bet. Market sentiment will re-focus on economic fundamentals, which are less supportive of further RMB appreciation. In the longer term, the RMB still has some upside potential, but the pace of its growth should be much slower than in the past 12 months. The sharp rise in the trade-weighted RMB index is starting to threaten China’s export sector and has exacerbated the tightening of domestic monetary conditions. Barring a monetary policy reset by Chinese authorities, even a small increase in the broad-RMB index would heighten the risk of a contraction in corporate profit growth in the coming 12 months. We remain risk adverse to Chinese stocks for the next 6 months. Feature Chart 1The RMB Back On A Fast Ascending Path
The RMB Back On A Fast Ascending Path
The RMB Back On A Fast Ascending Path
After a brief pause in March, China’s currency versus the US dollar extended its steep upward trend began in mid-2020 (Chart 1). Chinese policymakers recently ramped up their strong-worded statements warning against speculating on the RMB. Regulators have also taken steps to stem the rise. Questions we have recently been getting from our clients about the RMB can be summarized as follows: After a 10% appreciation since its trough a year ago, does the RMB have more upside in 2021 and beyond? If the RMB continues to appreciate, what would be the impact on China’s economy and corporate sector? What can the PBoC do to slow the pace of the currency’s appreciation? One could argue that the US dollar will continue to weaken, but we see substantial headwinds to the RMB within the year. A weaker US dollar would support global stock prices outside of the US and foreign inflows have driven the recent rally in China’s onshore stocks. However, we think China’s domestic macro policy and economic conditions pose more downside risks on a cyclical basis. How Far Can The RMB Go? A continued upswing in the CNY relative to the USD can no longer be taken for granted. In the coming months, there is a strengthening case for the RMB to fall against the greenback as factors supporting a strong RMB in the past year start to abate. Economic fundamentals will no longer prop up the RMB’s rise going into 2H21. China’s growth momentum is softening due to significant tightening in the monetary environment in the second half of last year and a rapid deceleration in credit growth this year (Chart 2). Meanwhile, the massive rollouts of COVID-19 vaccines in North America and Europe have successfully reduced new infections and hospitalization rates, allowing these countries to reopen their economies. The economic growth gaps between China and the developed markets (DMs) will narrow more significantly in the coming months (Chart 3). Chart 2Chinese Economic Fundamentals Will Start To Weaken
Chinese Economic Fundamentals Will Start To Weaken
Chinese Economic Fundamentals Will Start To Weaken
Chart 3China's Growth Gap Relative To DMs Will Narrow
China's Growth Gap Relative To DMs Will Narrow
China's Growth Gap Relative To DMs Will Narrow
Chart 4Global Consumption Recovery In Services Will Likely Outpace Goods
Global Consumption Recovery In Services Will Likely Outpace Goods
Global Consumption Recovery In Services Will Likely Outpace Goods
China’s large current account surplus will likely start narrowing. It has been driven by strong global demand for goods, which is unlikely to be sustained as the pent-up demand for services in DMs will outpace the consumption for goods (Chart 4). Emerging countries (EMs), many of which are China’s export competitors, lag far behind DMs and China on inoculation rates and some have resurging COVID cases (Chart 5). However, EMs will likely benefit from meaningful expansions in global vaccine production in the second half of the year.1 A catchup in vaccinations in these countries will reduce China’s export-sector advantage, reversing the RMB’s gains over other Asian currencies in the past month. Chart 5China's Asian Neighbors Have Been Hit By Resurging COVID Cases
China's Asian Neighbors Have Been Hit By Resurging COVID Cases
China's Asian Neighbors Have Been Hit By Resurging COVID Cases
The future trend of the USD also matters to the USD/CNY exchange rate. The recent strength of the CNY vis-à-vis the dollar was the mirror image of USD weakness, which has been due to low real rates in the US and recovering economic momentum outside the US (Chart 6). However, the broad dollar index is sitting at a critical technical level that could either breakout or breakdown (Chart 7). When the Fed announces the slowing of asset purchases, which our BCA US Bond Strategy expects before the end of 2021, it could lead to higher US real yields and reverse the trend of hot money flows into China. Chart 6The Sharp Rise In The RMB In The Past Two Months Has Been Dollar-Driven
The Sharp Rise In The RMB In The Past Two Months Has Been Dollar-Driven
The Sharp Rise In The RMB In The Past Two Months Has Been Dollar-Driven
Chart 7The Dollar Index: Breakout or Breakdown?
The Dollar Index: Breakout or Breakdown?
The Dollar Index: Breakout or Breakdown?
Furthermore, the financial market does not seem to have priced in unstable US-China relations, which could undermine global risk appetite (Chart 8). Recent actions by US President Joe Biden – from expanding the investment ban on 59 blacklisted Chinese tech companies to calling for the US intelligence community to investigate the origins of COVID-19 – point to risks for escalating tensions between the two nations. Longer term, the RMB is at about one standard deviation below its fair value, which suggests that it still has more upside potential (Chart 9). Based on our BCA’s Foreign Exchange Strategist’s real effective exchange rate (REER) model, the RMB’s fair value mostly climbed in the past three decades, driven by higher productivity in China relative to its trading partners. However, part of the RMB’s appreciation since mid-2020 has been a catch up to its pre-trade war value and its valuation gap has rapidly narrowed. From the current valuation levels, the pace of RMB appreciation should be much slower going forward. Chart 8Geopolitical Surprises Could Spook The Market
Geopolitical Surprises Could Spook The Market
Geopolitical Surprises Could Spook The Market
Chart 9Valuation Gap Has Rapidly Narrowed
Valuation Gap Has Rapidly Narrowed
Valuation Gap Has Rapidly Narrowed
We also expect China’s real interest rates relative to the US to dwindle in the next three to five years. Demographic headwinds in China herald lower real rates while the Fed is primed to start rate liftoffs within the next two years. Bottom Line: The RMB still has some upside potential in the long run, but the pace of its appreciation should be much slower than in the past 12 months. In the near term, odds are high that economic fundamentals will not boost the RMB any further. How Does A Stronger RMB Affect China’s Economy? Historically, a stronger RMB relative to the dollar has not had a significant impact on China’s economy. However, if the CNY appreciates considerably versus the greenback so that it pushes up the trade-weighted RMB index, then China’s corporate profits will be negatively affected (Chart 10). Chart 10Strengthening Broad-RMB Index Has Historically Led To Weaker Corporate Profit Growth...
Strengthening Broad-RMB Index Has Historically Led To Weaker Corporate Profit Growth...
Strengthening Broad-RMB Index Has Historically Led To Weaker Corporate Profit Growth...
Chart 11...And Could Significantly Raise Prob Of A Earnings Contraction In 12 Months
...And Could Significantly Raise Prob Of A Earnings Contraction In 12 Months
...And Could Significantly Raise Prob Of A Earnings Contraction In 12 Months
Our earnings growth recession probability model confirms our view. If all else is equal, a 3% rise in the trade-weighted RMB index from its current level would more than double the probability of a contraction in earnings growth in the coming 12 months (Chart 11, Scenario 1). On the other hand, all else will not be equal if the broad RMB index goes up by 3%. A quick increase in the RMB’s value against the currencies of its trading partners will impede China’s export growth and tighten domestic monetary conditions. Chart 12Moving Into Restrictive Territory For Chinese Exports
Moving Into Restrictive Territory For Chinese Exports
Moving Into Restrictive Territory For Chinese Exports
Chart 12 shows the impact on export growth from the speed of the RMB’s appreciation; we calculate the rise in an export-weighted RMB index relative to its highs and lows in the past few years. The metric implies that the acceleration in the RMB’s value has reached levels that should be restrictive for exports. The nominal export-weighted RMB index has been significantly above the median value since 2015 and it is approaching the peak reached in that year. Clearly, the strong RMB is linked to a recent weakness in the PMI surveys on export orders. A 3% increase in the trade-weighted RMB from the current level, coupled with a drop in export growth and further deceleration in credit impulse would prop up the earnings contraction probability to more than 50% (Scenario 2 in Chart 11 above). Bottom Line: Our metrics suggest that the RMB’s recent sharp rise is starting to threaten the export sector. An additional 3% appreciation in the broad RMB index would cause a meaningful increase in the probability of a corporate earnings growth contraction in the coming 12 months. What Can The PBoC Do To Halt The RMB Rally? We break this question into two parts: the willingness and the capability of the PBoC to intervene in the currency market. On the first aspect, the PBoC in recent years has largely refrained from draconian intervention measures in the currency market. Allowing a more market-based currency exchange rate regime is a crucial part of China’s RMB internationalization process. The PBoC seems to be mostly sticking to this long-term goal. Chart 13New FX Regime Began In 2015 Has Significantly Lowered USD Weight In The Broad-RMB Index...
New FX Regime Began In 2015 Has Significantly Lowered USD Weight In The Broad-RMB Index...
New FX Regime Began In 2015 Has Significantly Lowered USD Weight In The Broad-RMB Index...
Importantly, the new exchange rate regime that the PBoC switched to at end-2015 has greatly weakened the link between the USD and the broad RMB trend (Chart 13). Since then China has continuously cut the weighting of the USD in the CFETS currency index basket, which has reduced the impact of dollar moves on the index. Therefore, the PBoC has mostly ignored short-term volatilities in the CNY/USD exchange rate. The central bank tends to intervene only when swings in the CNY/USD exchange rate are large enough and/or the market forms a unilateral view on the Chinese currency to drive sustained movements in the broader RMB index. For example, the RMB value rose at a much faster rate against the USD compared with its other trading partners in the second half of 2020. However, this year, the pace of growth in the broad RMB index has caught up with that of the CNY/USD appreciation. Moreover, even when the RMB depreciated against the USD in March, the CFETS index basket kept rising and is now breaching its previous peak in April 2018 (Chart 14). As discussed in the previous section, a sharp jump in the trade-weighted RMB would be more detrimental to China’s corporate profits than an increase in the CNY/USD. Chart 14...But The Massive Appreciation In The CNY/USD Of Late Has Pushed The RMB Index To A Three-Year High
...But The Massive Appreciation In The CNY/USD Of Late Has Pushed The RMB Index To A Three-Year High
...But The Massive Appreciation In The CNY/USD Of Late Has Pushed The RMB Index To A Three-Year High
Chart 15The PBoC Has Been Trying To Guide Market Expectations Lower On The RMB
The PBoC Has Been Trying To Guide Market Expectations Lower On The RMB
The PBoC Has Been Trying To Guide Market Expectations Lower On The RMB
On the second aspect, the PBoC is unlikely to alter its monetary policy trajectory to tame the RMB’s appreciation. A looser monetary environment would encourage more asset price bubbles domestically and jeopardize policymakers’ ongoing progress in financial and property-market de-risking. If the CFETS strengthens further, Chinese authorities will probably use tools such as managing market expectations and various capital controls to mop up excess FX liquidity generated from capital inflows. In the near term, the PBoC may set a weaker fixing rate against the dollar to dampen market expectations for more RMB growth (Chart 15). An increase in the FX deposit reserve requirement ratio (RRR) rate, announced by the PBoC last week, is another example of the central bank trying to prevent a one-sided expectation by market participants. However, the previous three FX deposit RRR hikes –all taken place more than a decade ago—did little to alter the path of the CNY exchange rate; the pace of USD/CNY depreciation actually accelerated following the May 2007 RRR hike. The two-percentage point bump in the FX deposit RRR rate will drain China’s domestic FX liquidity by about US$20 billion. Its effect on domestic FX liquidity and FX loan rates is rather limited – FX inflows to Chinese financial institutions since 2H20 were more than US$20 billion a month –more than offsetting the tightening from a RRR rate hike. The PBoC can further loosen outward capital controls to release some pressure on the RMB’s increase. In a report from November last year we wrote that Chinese policymakers attempted to slow the pace of appreciation in the RMB through a build-up in strategic FX assets by commercial banks and other financial institutions . Since August last year, China has relaxed outbound investment regulations and increased quotas to help channel domestic money into offshore financial markets. China’s commercial banks significantly ramped up their FX assets last year (Chart 16). In Q1 this year, commercial banks enriched their FX asset holdings by US$518.5 billion, a record high in the past five years. Bottom Line: The PBoC is willing to allow more volatility in the USD/CNY exchange rate, but a sharp jump in the RMB’s value against a basket of other currencies would warrant further policy actions. Chart 16Chinese Banks Ramped Up FX Asset Holdings
Chinese Banks Ramped Up FX Asset Holdings
Chinese Banks Ramped Up FX Asset Holdings
Chart 17Chinese Onshore Stocks Propped Up By Foreign Investors
Chinese Onshore Stocks Propped Up By Foreign Investors
Chinese Onshore Stocks Propped Up By Foreign Investors
Investment Conclusions A tightened monetary and credit environment has created headwinds for Chinese equities since early this year. However, the domestic market appears to have found support at a key technical level of late (Chart 17). The recent rebound in China’s onshore stocks on the back of a sharp CNY appreciation and accelerated foreign capital inflows, in our view, are unsustainable on a cyclical basis. Despite buoyant global economic growth, investors should consider deteriorating cyclical conditions in China when judging the appropriate allocation for Chinese equities. While policy tightening has brought multiples closer to earth than last year, the upside in Chinese stock prices will be capped by subsiding stimulus and slower profit growth ahead. As such, a decisive breakout to the upside in Chinese stock prices will require major reflationary catalysts, and it is the reason we are still risk adverse on Chinese equities (Chart 18). Meanwhile, we continue to favor onshore consumer discretionary stocks relative to the broad A-share market. A strong RMB can be a booster to domestic discretionary spending. We initiated this trade in May last year and it has largely outperformed China’s onshore broad market (Chart 19). We will close the trade when the CNY loses its strength and Chinese domestic demand starts to falter. Chart 18Cyclical Performance In Chinese Stocks Is Still Driven By Economic Fundamentals
Cyclical Performance In Chinese Stocks Is Still Driven By Economic Fundamentals
Cyclical Performance In Chinese Stocks Is Still Driven By Economic Fundamentals
Chart 19Keep A Long CD Position, But On A Short Leash
Keep A Long CD Position, But On A Short Leash
Keep A Long CD Position, But On A Short Leash
Jing Sima China Strategist jings@bcaresearch.com Footnotes 1The UN estimates that as many as 15 billion vaccine doses could be produced by the second half of 2021, enough to inoculate most of the world’s population. Cyclical Investment Stance Equity Sector Recommendations