Emerging Markets
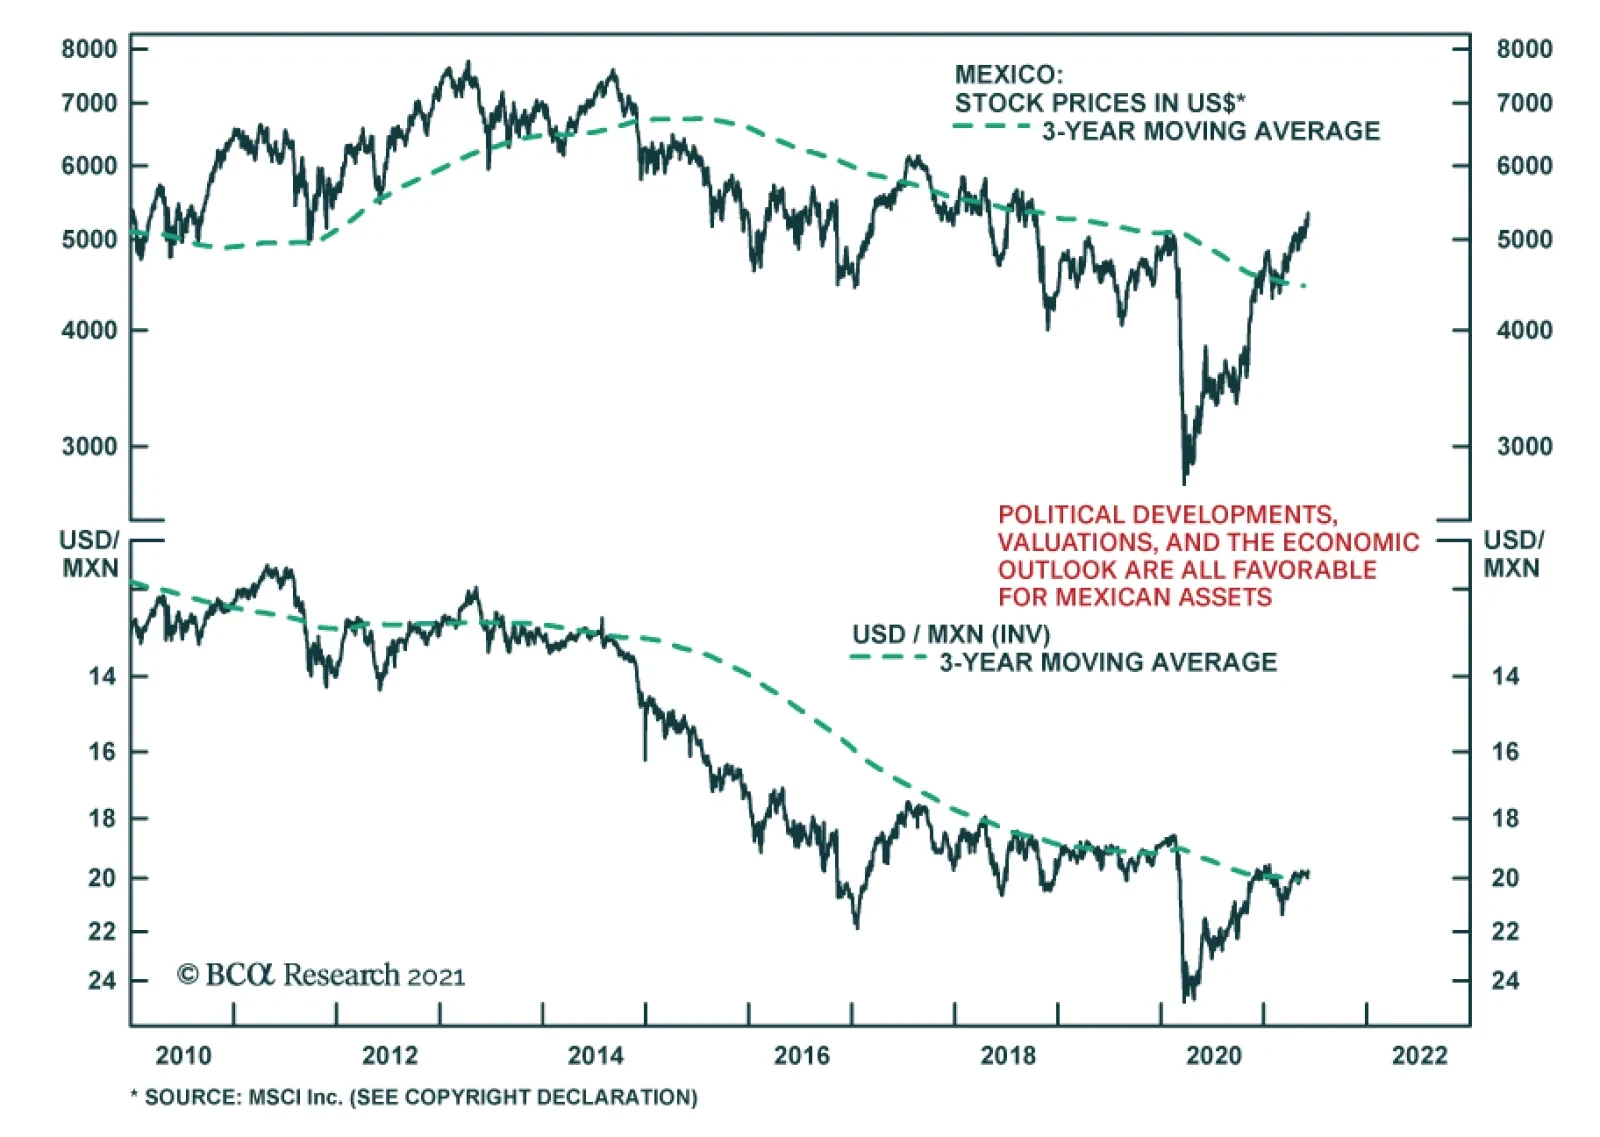
Mexico’s midterm elections yielded a positive outcome for Mexican assets over the weekend. Preliminary estimates by the National Electoral Institute indicate that left-wing President Andres Manuel Lopez Obrador’s (AMLO) ruling coalition failed to secure…
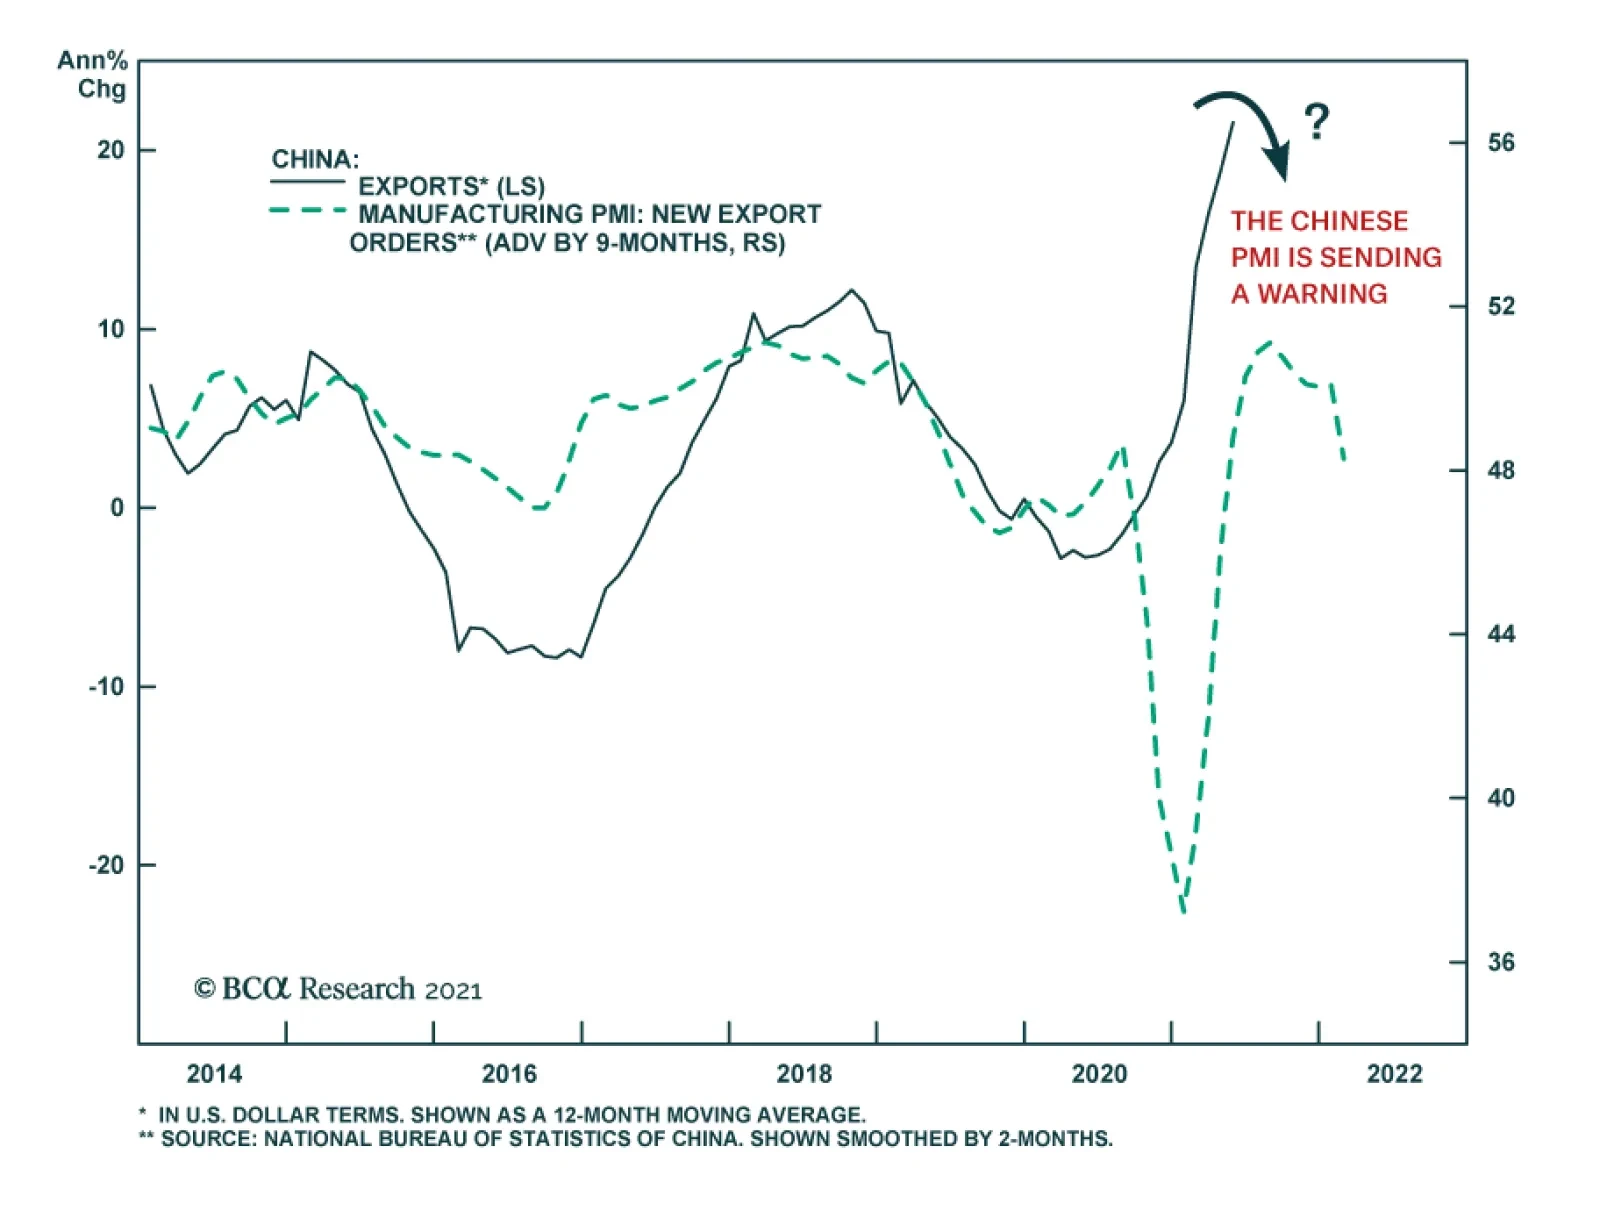
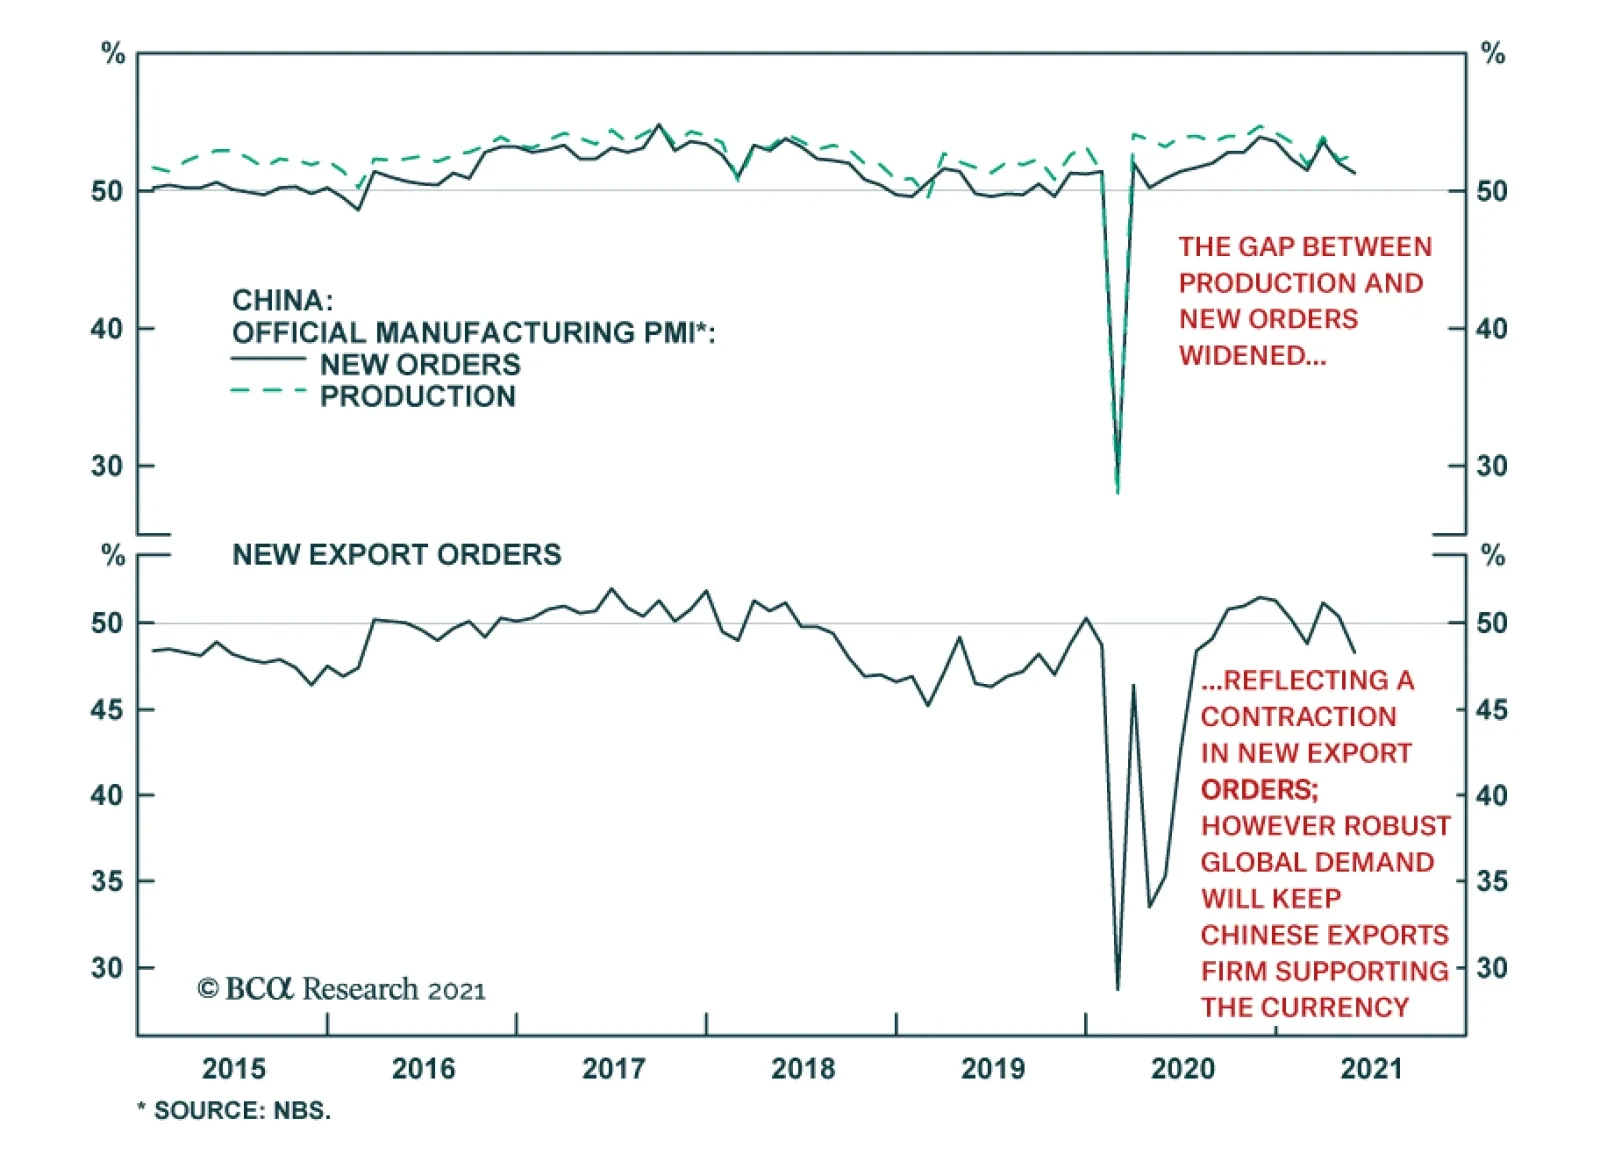
China’s trade surplus widened for the second consecutive month in May, rising to $45.5 billion from $42.9 billion. Exports decelerated to 27.9% y/y from April’s 32.3% y/y, while imports accelerated to 51.1% y/y from 43.1% y/y. The easing in exports…

Dear Client, In this special report we are pleased to introduce Ritika Mankar, the newest Strategist to join BCA Research and Geopolitical Strategy. Ritika hails from Mumbai where she has led a distinguished career as a director at Ambit, an institutional equity brokerage, leading one of the top macro research franchises in India. She is also a director on the board of CFA Society India. Going forward Ritika will oversee Geopolitical Strategy’s India and South Asia analysis. In this report Ritika argues that owing to both under-investment and under-employment, India’s growth engine is set to misfire in FY22. Investors should pare their exposure to Indian assets for now. I trust you will find the report insightful and will look forward to Ritika’s regular contributions, which will deepen our global coverage of market-relevant geopolitical trends and themes. Sincerely, Matt Gertken Geopolitical Strategist Highlights Indian equities have outperformed emerging market equities decisively since March 2020. But a festering jobs problem in the informal sector and weak consumer confidence, will mean that both consumption and investment growth could disappoint in FY22. We recommend closing the Long Indian / Short Chinese Equities trade and the Long Indian Local Currency Bond / Short EM Bonds trade. We launch two new trades: Short India Banks and Long India Consumer Discretionary. Feature India has been the blue-eyed boy of the emerging market space since the dawn of the twenty-first century. Narratives about India have had a marked bullish tilt. To be fair, this optimism is justified most of the time for three very good reasons. Firstly, India’s geopolitical backdrop has improved. At home, the aftermath of the Great Recession saw the emergence of a new policy consensus consisting of nationalism and economic development. Indian policymakers recognize that if they undertake reforms to boost productivity then India has a chance of achieving a stronger strategic position in South Asia than military might alone can give it. Abroad, India is being courted by foreign powers and foreign investors. The United States has broken up the special relationship it maintained with China since the early 1970s. India stands to benefit from the West’s need now to counter-balance China. Secondly, India’s growth engine relies primarily on consumption as compared to more volatile components like net exports. Consumption makes up 56% of GDP. A consumption-powered economy that is young and not yet saturated with consumer goods, from washing machines to cars, deserves a premium. Growth in such an economy is likely to be far more predictable as compared to an export-driven economy that must contend with commodity price cycles, foreign business cycles, and de-globalization. Thirdly, India scores over other emerging markets as it offers political stability in a well-entrenched democratic framework. Despite having a low per capita income, India has a political system that is comparable to that of high-income developed countries. India’s head of state has been democratically elected since 1951 and the government at the centre has completed its full five-year term every time since 1999. More importantly, India’s institutions by design are “inclusive.”1 Institutions that provide checks and balances also deliver most of the time. So, unlike say in the case of China, Russia, Brazil, or even Turkey, India rarely gives an emerging market fund manager sleepless nights on account of politics or policy unpredictability. Whilst India deserves the premium it attracts most of the time, in this note we highlight that the market seems to be underpricing certain material risks that are building up in India. Distinct from the challenges created by COVID-19 (more on this later), India’s growth engine appears to be sputtering as two key faults develop: Under-investment: India has underinvested in capital creation for over a decade now. With government finances stretched, and with middling capacity utilization rates, investment growth in the short run is likely to stay compromised. Under-employment: India’s high GDP growth rate over the last few years has not been accompanied by an expansion in employment. Even before the pandemic, the Indian economy’s growth process had been asymmetric (or K-shaped) with the majority’s employment prospects worsening while a limited minority’s economic prospects were improving. This trend has become even more entrenched post-pandemic. Till India’s fast-compounding unemployment problem is solved, consumption growth in India will disappoint. And until then, only a select few upwardly mobile consumers of the service economy and business class will be supporting consumption growth in India. Both these dynamics will hurt India’s ability to grow its economy in the short term. These faults could force policymakers to take imprudent fiscal decisions to boost growth in the medium term too. Against this backdrop and with MSCI India trading at a 79% premium to EMs versus a two-year average of 57%, we reckon that the time is right for investors to scale down their exposure to segments of the Indian market where valuations look stretched. This report is divided into three segments: Segment 1: India’s GDP in FY22: Brace for disappointments Segment 2: COVID-19 in India: The road to normalcy will be long Segment 3: Investment conclusions India GDP In FY22: Brace For Disappointments Both the under-investment and the under-employment problem predate the COVID-19 crisis. Even as a degree of reflation kicks in as the second wave of COVID-19 infections abates, both these problems will act as a drag on India’s GDP growth in FY22. Investment Growth In India To Stay Constrained In FY22 The importance of investment in India is often underrated. Not only does gross fixed capital formation make up a third of India’s GDP each year, it also plays a critical role in driving consumption growth over the subsequent period (Chart 1). Occasional upcycles in investment are required to ensure that income growth remains robust, which in turn powers consumption growth. What is worrying is that India’s investment-to-GDP ratio had been trending downwards even before the onset of COVID-19 (Chart 2). This ratio in fact has been inching lower since the global financial crisis (GFC) from a peak of 36% to 29% in FY20. Unsurprisingly, investments have fallen further following the pandemic. The investment-to-GDP ratio fell to 27% in FY21 which is the lowest reading for this metric since the bursting of the dot-com bubble in 2001. Chart 1Consumption Growth Today, Is A Function Of Investments Made In The Past
India: Flying Without Wings
India: Flying Without Wings
Chart 2India’s Investment To Gdp Ratio Has Been Trending Lower Since The GFC
India: Flying Without Wings
India: Flying Without Wings
In addition, India’s investment-to-GDP ratio appears likely to stay constrained in FY22 as well. This is because the government sector and the private corporate sector (which together account for 62% of India’s investments) are unlikely to have the ability or incentive to expand capacity. Government “big push” is missing: The stock of capital in any country is created by the household sector, the private corporate sector, and the government sector. In India’s case, the government accounts for about 25% of capital formation on a cross-cycle basis. India’s government has consistently underinvested in growing its capital stock. For instance, the central government’s allocation towards capital expenditure has stayed range-bound between 1.5%-2.5% of GDP for over a decade now (see Chart 2). Hence India has not had the benefit of a big push from the government to create capital assets, such as the Four Asian Tigers undertook in the 1970-80s and China undertook in the 1990s. To be fair, the Union Budget for FY22 envisages an increase in capital expenditure to 2.5% of GDP from 2.2% of GDP last year. However, this increase is small, and we worry that the actual government spending on capital investments could well surprise to the downside. Moreover government revenues could get crimped owing to the second wave of COVID-19 in India. History suggests that government capital expenditure priorities are often set aside when India confronts a crisis. Following the GFC, the Indian central government expanded its fiscal deficit from 2.6% of GDP in FY08 to 6.1% of GDP in FY09. However, a breakdown of expenditure-side data suggests that this increase was mainly driven by higher revenue spends. Capital expenditure in fact was cut back from 2.4% of GDP in FY08 to 1.6% of GDP in FY09. Private sector faces low demand: The private sector accounts for about 37% of capital formation on a cross-cycle basis. The private corporate sector is unlikely to want to fire up investments in FY22 as the demand scenario looks weak and capacity utilization rates in the economy are middling. Whilst specific sectors and companies are growing, consumer confidence in India on an economy-wide level remains low thereby pointing to a lackluster demand environment. The post-2020 revival in consumer confidence in India, surveys suggest, has been weaker than that experienced by developed and developing country peers (Chart 3). History suggests that upturns in the investment cycle are triggered when capacity utilization rates hover at 74% or more (Chart 4). Reserve Bank of India’s latest capacity utilization survey suggests that utilization rates were recorded at only 67% in 4Q 2020. So, with consumer confidence levels low and with capacity utilization rates not being high enough, an economy-wide upsurge in investment growth in India at this stage appears unlikely. Chart 3Consumer Confidence In India Is Yet To Return To Pre-2020 Levels
India: Flying Without Wings
India: Flying Without Wings
Chart 4Capacity Utilization Rates In India Are Low And Hovering At Less Than 70% Levels
India: Flying Without Wings
India: Flying Without Wings
Finally, the household sector accounts for about 38% of capital formation and is the only source of hope. Whilst the upper-income segment of India’s household sector may have the financial firepower to support investment growth, the lower income segment is unlikely to be able to drive investments in an environment of poor jobs growth. Large-Scale Unemployment Likely In India’s Unreported Underbelly Unlike most developing and developed countries, data on India’s monthly employment situation is not collected. But piecing together jobs data from a range of sources makes it clear that India’s job market is undergoing a meaningful squeeze. These job losses in India’s mid- and low-income groups will restrain consumption growth in India in FY22. GDP growth not translating into employment growth: The last pan-India employment survey was conducted in 2019. An analysis of these historical surveys suggests that India’s high GDP growth rate has not been translating into high employment growth in India for a while. The formal employment data could be understating the extent of unemployment in India and even the official unemployment rate has not fallen despite high GDP growth (Chart 5). Chart 5Even When Gdp Growth Is High, Unemployment Rates In India Remain Elevated
India: Flying Without Wings
India: Flying Without Wings
Chart 6For Most Of India’s Population, Business Relevance Of Education And Digital Preparedness Is Poor
India: Flying Without Wings
India: Flying Without Wings
Unless India’s manufacturing sector grows rapidly, the widening rift between India’s GDP growth rate and jobs growth rate could become a structural phenomenon. Whilst labor supply in India is large, only part of this can be absorbed into India’s fast-growing service sector, as the business relevance of education as well as the digital preparedness of India’s labor force is low (Chart 6). Job losses in the informal sector: According to the Centre for Monitoring Indian Economy (CMIE), a private firm, India’s unemployment rate was recorded at 11.9% as at June 1, 2021. Even before the second COVID-19 wave and related lockdowns began, this metric was recorded at an elevated level of 7.5% over Dec 2020 to Feb 2021. Most of the job losses that have occurred are likely to be concentrated in the informal or unorganized sector, which employs 80% of India’s workforce. Rural wage inflation collapse points to excess supply: The supply of labor in the informal sector has increased at a faster pace than demand as evinced by the slowdown in rural wage inflation in India from an average of 12% over 2008-19 to 5% over 2019. This dynamic has worsened amid the pandemic as rural wage inflation fell to 2% in 2021YTD. This is after a challenging 2020 when unorganized sector wages could have contracted by 22%, according to a study conducted by the International Labor Organization (ILO). Informal sector’s market share loss suggests demand may stay weak: The Indian economy over the last five years has been undergoing a rapid pace of formalization. This was triggered by government action including the “de-monetization” move in 2016 (which outlawed high denomination notes that were in circulation) and then the introduction of the goods and services tax regime in 2017 (which discourages businesses from working with informal, non-tax paying businesses). The trend of formalization was then cemented in the pre-pandemic years by the fact that the economic health of the informal sector’s consumer was worsening. The formal sector on the other hand caters to a relatively high-income consumer whose incomes/jobs grew at a steady clip. The pandemic expedited this trend of formal sector businesses gaining market share as access to finance from unorganized sources either dried up or became prohibitively expensive, thereby leading to another wave of causalities in the informal sector. Also, it is worth noting that formal sector businesses tend to be more efficient and need fewer hands to generate each unit of profit so even as this sector grows it needs fewer workers. This trend of formalization has been particularly true for the retail, financial, building materials and real estate sectors in India, where the informal sector has shrunk and left behind a trail of job losses. Bottom Line: India’s growth prospects in FY22 could disappoint. With government finances strained and private demand weak, investment growth in FY22 is likely to decelerate. Additionally, employment growth is likely to stay low, especially for informal workers, as the economy rapidly formalizes. Given that wage growth has not slowed down for the top income strata as much as for the bottom, it is this top income group’s consumption growth which is likely to support consumption in FY22. However, the bulk of household consumption will falter. The interplay of these forces will mean that the two prime drivers of India’s growth engine, consumption and investment, will stay constrained in the short run. In view of these factors, we highlight the risk of India’s GDP growth rate in FY22 undershooting the Indian central bank’s forecast of 10.5% by 200-350bps. Now it is tempting to think that even a 7.5% real GDP growth rate appears decent compared to peers. But it is critical to note that India’s headline GDP growth data in FY22 has an unusual padding built into it. Strong low base effect: Whilst emerging markets’ GDP growth contracted by 2.2% in 2020 as per IMF, India’s GDP contracted by 7.3%. So, the contraction experienced by India in 2021 was 3x times more than that experienced by peer countries. FY22 GDP comparison with FY21 makes growth appear high, when it is not: If India’s GDP growth rate in FY22 were to be recorded at 8%, then this would in fact imply no growth over the real GDP recorded in FY20. COVID-19 Effect: The Road To Economic Normalcy Will Be Long Whilst the second wave of the pandemic has peaked in India, the time required for this peak to turn into a trough could take longer than was the case last year. Furthermore, India’s slow vaccine roll-out (particularly in India’s large states) adds to the probability of a potential third wave. The Second Wave In India Was 3.6 Times Stronger Than First Chart 7Second COVID-19 Wave Was 3.6x Stronger
India: Flying Without Wings
India: Flying Without Wings
The virus in the second wave has been far more virulent and necessitated another wave of lockdowns. In specific, the peak COVID-19 deaths during the second wave were recorded at 4,188 deaths per day (on a 7-day moving average basis), which is 3.6 times greater than the peak hit last year (Chart 7). Also, a range of sources2 suggest that actual daily deaths in India could be 1.5-2x the stated numbers. Given that this wave has been stronger, the journey to the trough too is likely to be longer and thus may need localized lockdowns to stay in place. Headline Vaccination Rates Hide Vast Regional Disparities Only 15% of India’s population has received at least one dose. Headline vaccination rates conceal the slow pace of vaccination underway in some of India’s largest states (Chart 8). For instance, less than 8% of the population has been given its first dose in India’s most populous state (i.e. Uttar Pradesh). Given that state borders are porous, persistently low vaccination rates in large states can allow the virus to spread and mutate. Chart 8India’s Largest States Are Lagging On Vaccinations
India: Flying Without Wings
India: Flying Without Wings
Even today only 3% of India’s population has received both doses of vaccines. Even as the government plans to vaccinate all of India’s adult population by December 2021, this goalpost could have to be shifted to early 2022. A Loaded State Election Calendar Cometh In 2022 Looking into 2022, the state election calendar will get busier than it was this year. This could be a problem if vaccination rates are slow because elections involve large-scale rallies and gatherings. It is worth noting that: Five state elections that account for about 20% of India’s population were held in 2021. Elections will be due in seven states that account for about 25% of India’s population in 2022. To provide context, the population involved in state elections in India in 2021 was almost equivalent to that of a national election in Brazil. The states in India undergoing elections in 2022 have a population comparable to the United States. Besides involving a larger population, state elections due in 2022 will also have higher political stakes. This is mainly because in five of the seven states, the ruling Bharatiya Janata Party (BJP) is the incumbent party and will want to defend its status. This contrasts with the 2021 elections when the BJP was the incumbent in only one of the five states. In specific, India’s most populous state, Uttar Pradesh, is scheduled to undergo elections in February 2022. This is easily the most important state election in India and will be a high stakes four-cornered contest. Vaccine rates in this state are currently lagging the national average. Bottom Line: During the first wave, it took about five months for the trough to form after the peak in September 2020. The current wave has been significantly stronger (causing 4x more deaths) with vaccine rates too being low. Therefore, this wave may take longer than 5-6 months to subside. The long road to the trough in turn implies that the road to economic normalcy too may be slower than anticipated. Investment Takeaways Chart 9India's Outperformance Since March 2020 - Driven More By P/E Expansion, Less By Earnings
India's Outperformance Since March 2020 - Driven More By P/E Expansion, Less By Earnings
India's Outperformance Since March 2020 - Driven More By P/E Expansion, Less By Earnings
The Indian stock market has outperformed relative to emerging markets (Chart 9). Given that we are increasingly worried about India’s growth capabilities, we will close our Long Indian / Short Chinese Equities trade for a gain of 11.7%. Tactically, excessive policy tightening remains a genuine risk for the Chinese economy. Incidentally, we also expect that the looming US-Iran diplomatic détente will weigh on bullish fundamentals for oil in the second half of the year, which would be good for Indian stocks. However, the pair trade is challenged from a technical perspective and so we will book gains and move to the sidelines for now. Moreover to mitigate the effects of the coming growth slowdown in India on client portfolios, we recommend initiating two sectoral trades, namely Short India Banks and Long India Consumer Discretionary. Our Emerging Markets Strategy has shown that Indian private banks have higher efficiency and better balance sheets vis-à-vis EM banks. Our concern is that markets have already priced this dynamic. Specifically, Indian banks’ return on equity has seen a sharp drop from pre-pandemic levels and yet valuations remain high (Chart 10). As GDP growth in India slows, credit growth will stay low. This along with rising domestic interest rates could mean that banks’ net interest margins disappoint. As India’s broader consumption story disappoints and a K-shaped recovery takes shape, we expect a limited set of high-income services and business sector professionals to drive demand for high end-consumer discretionary products. So these two sectoral trades tap into the differential growth rates that two different segments of the economy are set to experience. Finally, we recommend closing the Long Indian Local Currency Bond / Short EM Bonds trade which is currently in the money. This is for two sets of reasons. Firstly, history points to a tight correlation between the US 10-year bond yield and Indian local currency denominated 10-year bond yields. As the US 10-year yield moves upwards, we expect Indian yields also to inch higher. Secondly, we worry that India’s fiscal response to the pandemic has been relatively small thus far and so India could opt for an unexpected expansion in its fiscal deficit over the next 12 months (Chart 11). Chart 10Indian Banks Appear To Be Factoring In All Positives
India: Flying Without Wings
India: Flying Without Wings
Chart 11India’s Fiscal Response To The Pandemic Has Been Relatively Small So Far
India: Flying Without Wings
India: Flying Without Wings
Ritika Mankar, CFA Editor/Strategist ritika.mankar@bcaresearch.com Footnotes 1Daron Acemoglu and James Robinson, Why Nations Fail: The Origins of Power, Prosperity, and Poverty (New York: Crown, 2012) 2Please see Jeffrey Gettleman, Sameer Yasir, Hari Kumar, and Suhasini Raj, “As Covid-19 Devastates India, Deaths Go Undercounted,” New York Times, April 24, 2021, nytimes.com and Murad Banaji, “The Importance of Knowing How Many Have Died of COVID-19 in India,” The Wire, May 9, 2021, science.thewire.in.
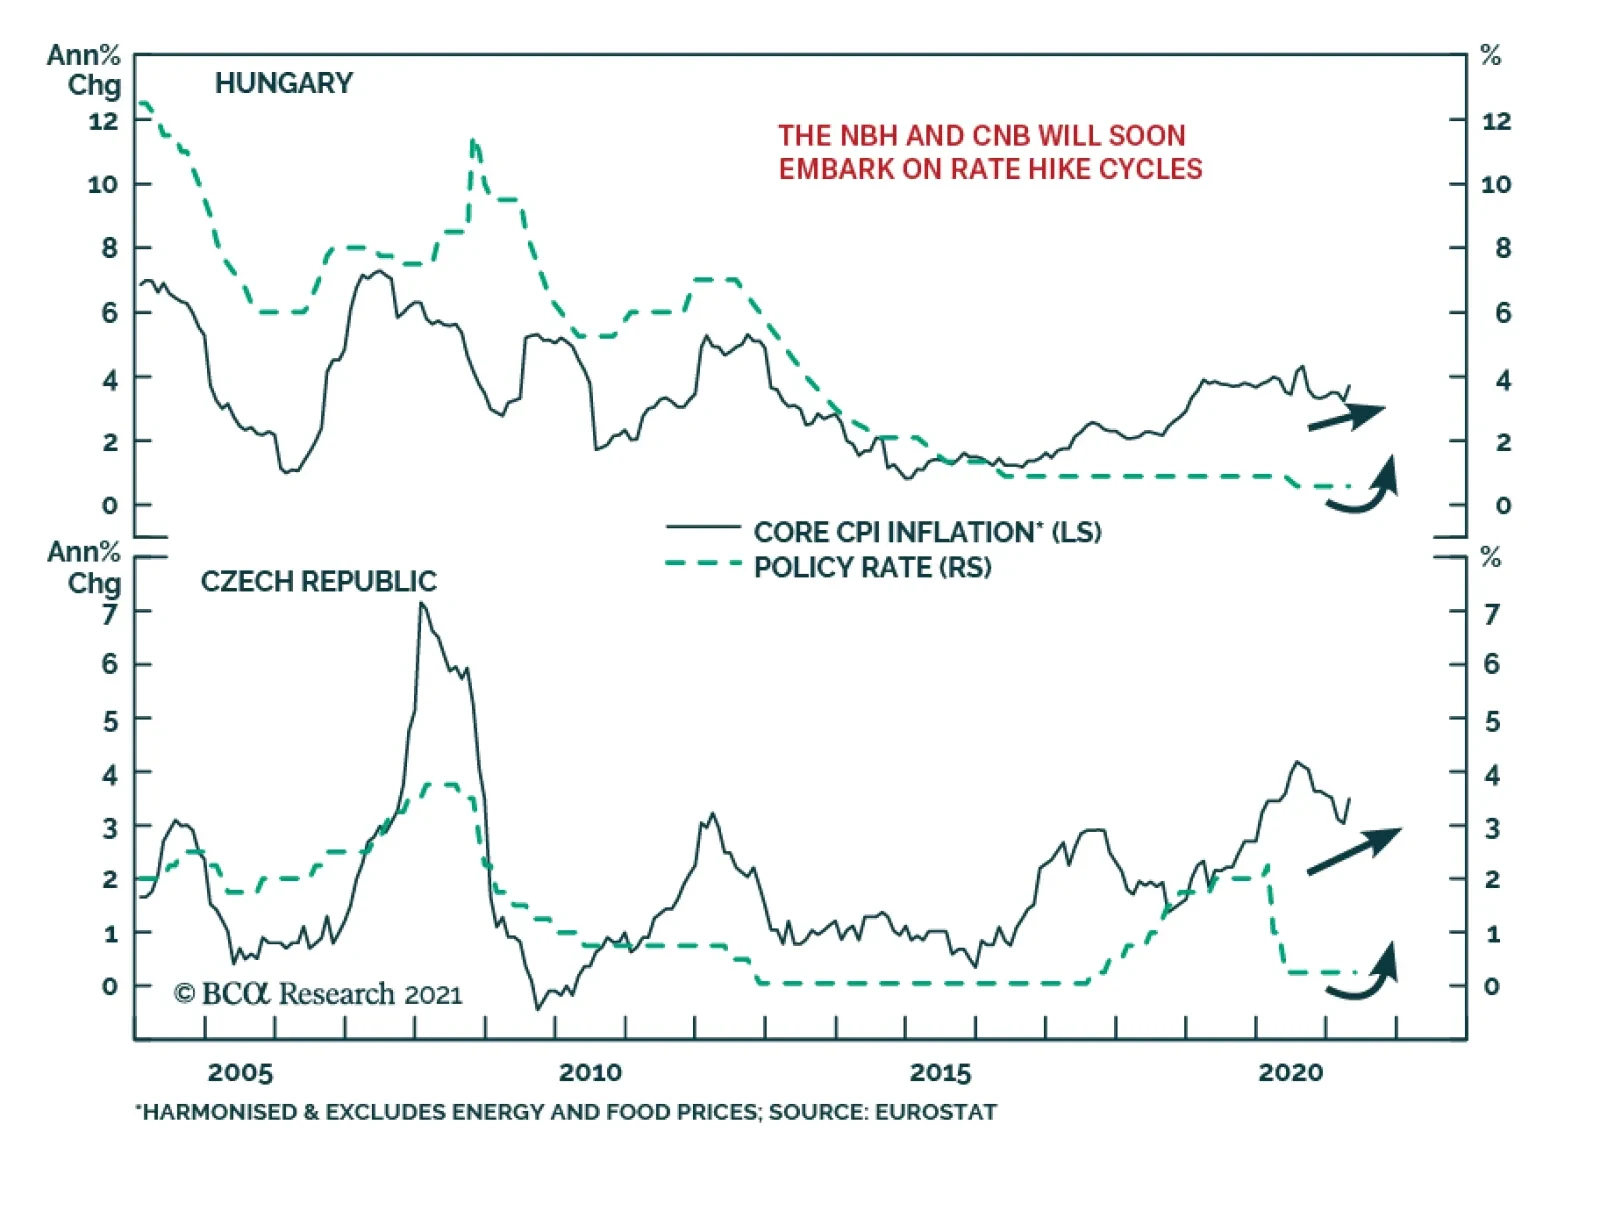
BCA Research’s Emerging Markets Strategy service concludes that the Czech koruna will outperform the Hungarian forint. Conditions for central bank rate hike cycles are in place in Hungary and the Czech Republic. Yet Czech authorities are following a more…
Highlights Political and corporate climate activism will increase the cost of developing the resources required to produce and deliver energy going forward – e.g., oil and gas wells; pipelines; copper mines, and refineries. Over the short run, the fastest way for investor-owned companies (IOCs) to address accelerated reductions in CO2 emissions imposed by courts and boards is to walk away from the assets producing them, which could be disruptive over the medium term. Longer term, state-owned companies (SOCs) not facing the constraints of IOCs likely will be required to provide an increasing share of the resources needed to produce and distribute energy. The real difficulty will come in the medium term. Capex for critical metals like copper languishes, just as the call on these metals steadily increases over the next 30 years (Chart of the Week). The evolution to a low-carbon future has not been thought through at the global policy level. A real strategy must address underinvestment in base metals and incentivize the development of technology via a carbon tax – not emissions trading schemes – so firms can innovate to avoid it. We remain long energy and metals exposures.1 Feature And you may ask yourself, "Well … how did I get here?" David Byrne, Once In A Lifetime Energy markets – broadly defined – are radically transforming from week to week. The latest iteration of these markets' evolution is catalyzed by climate activists, who are finding increasing success in court and on corporate boards – sometimes backed by major institutional investors – and forcing oil and gas producers to accelerate CO2 emission-reduction programs.2 Climate activists' arguments are finding increasing purchase because they have merit: Years of stiff-arming investors seeking clarity on the oil and gas producers' decarbonization agendas, coupled with a pronounced failure to provide returns in excess of their cost of capital, have given activists all of the ammo needed to argue their points. Chart of the WeekCall On Metals For Energy Will Increase
A Perfect Energy Storm On The Way
A Perfect Energy Storm On The Way
This activism is not limited to the courts or boardrooms. Voters in democratic societies with contested elections also are seeking redress for failures of their governments to effectively channel mineral wealth back into society on an equitable basis, and to protect their environments and the habitats of indigenous populations. This voter activism is especially apparent in Chile and Peru, where elections and constitutional conventions likely will result in higher taxes and royalties on metals IOCs operating in these states, which will increase production costs and ultimately be passed on to consumers.3 These states account for ~ 40% of world copper output. IOCs Walk Away Earlier this week, Exxon walked away from an early-stage offshore oil development project in Ghana.4 This followed the unfavorable court rulings and boardroom setbacks experienced by Royal Dutch Shell, Chevron and Exxon recently (referenced in fn. 2). While the company had no comment on its abrupt departure, its action shows how IOCs can exercise their option to put a project back to its host government, thus illustrating one of the most readily available alternatives for energy IOCs to meet court- or board-mandated CO2 emissions targets. If these investments qualify as write-offs, the burden will be borne by taxpayers. As climate activism increases, state-owned companies (SOCs) not facing the constraints of IOCs likely will be required to provide an increasing share of the resources – particularly oil and gas – needed to produce and distribute energy going forward. This is not an unalloyed benefit, as the SOCs still face stranded-asset risks, if they invest in longer-lived assets that are obviated by a successful renewables + grid buildout globally. That is a cost that will have to be compensated, when the SOCs work up their capex allocations. Still, if legal and investor activism significantly accelerates IOCs' capex reductions in oil and gas projects, the SOCs – particularly those in OPEC 2.0 – will be able to expand their position as the dominant supplier in the global oil market, and could perhaps increase their influence on price levels and forward-curve dynamics (Chart 2).5 Chart 2OPEC 2.0s Could Expand If Investor Activism Increases
OPEC 2.0s Could Expand If Investor Activism Increases
OPEC 2.0s Could Expand If Investor Activism Increases
Higher Call On Metals At present, there is a lot of talk about the need to invest in renewable electricity generation and the grid structure supporting it, but very little in the way of planning for this transition. Other than repeated assertions of its necessity, little is being said regarding how exactly this strategy will be executed given the magnitude of the supply increase in metals required. Nowhere is this more apparent than in the refined copper market, which has been in a physical deficit – i.e., production minus consumption is negative – for the last 6 years (Chart 3). Physical copper markets in China, which consumes more than 50% of refined output, remain extremely tight, as can be seen in the ongoing weakness of treating charges and refining charges (TC/RC) for the past year (Chart 4). These charges are inversely correlated to prices – when TC/RCs are low, it means there is surplus refining capacity for copper – unrefined metal is scarce, which drives down demand for these services. Chart 3Coppers Physical Deficit Likely Persist
Coppers Physical Deficit Likely Persist
Coppers Physical Deficit Likely Persist
Chart 4Chinas Refined Copper Supply Remains Tight
Chinas Refined Copper Supply Remains Tight
Chinas Refined Copper Supply Remains Tight
Theoretically, high prices will incentivize higher levels of production. However, after the last decade’s ill-timed investment in new mine discoveries and expansions, mining companies have become more wary with their investments, and are using earnings to pay dividends and reduce debt. This leads us to believe that mining companies will not invest in new mine discoveries but will use capital expenditure to expand brownfield projects to meet rising demand. In the last decade, as copper demand rose, capex for copper rose from 2010-2012, and fell from 2013-2016 (Chart 5). During this time, the copper ore grade was on a declining trend. This implies that the new copper brought online was being mined from lower-grade ore, due to the expansion of existing projects(Chart 6). Chart 5Copper Capex Growth Remains Weak
A Perfect Energy Storm On The Way
A Perfect Energy Storm On The Way
Chart 6Copper Ore-Quality Declines Persist Through Capex Cycle
A Perfect Energy Storm On The Way
A Perfect Energy Storm On The Way
Capex directed at keeping ore production above consumption will not be sufficient to avoid major depletions of ore supplies beginning in 2024, according to Wood Mackenzie. The consultancy foresees a cumulative deficit of ~ 16mm MT by 2040. Plugging this gap will require $325-$500 billion of investment in the copper mining sector.6 The Case For A Carbon Tax The low-carbon future remains something of a will-o'-the-wisp – seen off in the future but not really developed in the present. Most striking in discussions of the low-carbon transition is the assumption of resource availability – particularly bases metals –in, e.g., the IEA's Net Zero by 2050, A Roadmap for the Global Energy Sector, published last month. In the IEA's document, further investment in hydrocarbons is not required beyond 2025. The copper, aluminum, steel, etc., required to build the generation and supporting grid infrastructure will be available and callable as needed to build all the renewable generation the world requires. The document is agnostic between carbon trading and carbon taxes as a way to price carbon and incentivize the technology that would allow firms and households to avoid a direct cost on carbon. A real strategy must address the fact that most of the world will continue to rely on fossil fuels for decades, as development goals are pursued. Underinvestment in base metals and its implications for the buildout of generation and grids has to be a priority if these assets are to be built. Given the 5-10-year lead times base metals mines require to come online, it is obvious that beyond the middle of this decade, the physical reality of demand exceeding supply will assert itself. A good start would be a global effort to impose and collect carbon taxes uniformly across states.7 This would need to be augmented with a carbon club, which restricts admission and trading privileges to those states adopting such a scheme. Harmonizing the multiple emissions trading schemes worldwide will be a decades-long effort that is unlikely to succeed. Such schemes also can be gamed by larger players, producing pricing distortions. A hard and fast tax that is enforced in all of the members of such a carbon club would immediately focus attention on the technology required to avoid paying it – mobilizing capital, innovation and entrepreneurial drive to make it a reality. This would support carbon-capture, use and storage technologies as well, thus extending the life of existing energy resources as the next generation of metals-based resources is built out. In addition, a carbon tax raises revenue for governments, which can be used for a variety of public policies, including reducing other taxes to reduce the overall burden of taxation. Lastly, a tax eliminates the potential for short-term price volatility in the pricing of carbon – as long as households and firms know what confronts them they can plan around it. Tax revenues also can be used to reduce the regressive nature of such levies. Investment Implications The lack of a coherent policy framework that addresses the very real constraints on the transition to a low-carbon economy makes the likelihood of a volatile, years-long evolution foreordained. We believe this will create numerous investment opportunities as underinvestment in hydrocarbons and base metals production predisposes oil, natural gas and base metals prices to move higher in the face of strong and rising demand. We remain long commodity index exposure – the S&P GSCI and GSCI Commodity Dynamic Roll Strategy ETF (COMT), which is optimized to take advantage of the most backwardated commodity forward curves in the index. These positions were up 5.3% and 7.2% since inception on December 7, 2017 and March 12, 2021, respectively, at Tuesday's close. We also remain long the MSCI Global Metals & Mining Producers ETF (PICK), which is up 33.9% since it was put on December 10, 2020. Expecting continued volatility in metals – copper in particular – we will look for opportunities to re-establish positions in COMEX/CME Copper after being stopped out with gains. A trailing stop was elected on our long Dec21 copper position established September 10, 2020, which was closed out with a 48.2% gain on May 21, 2021. Our long calendar 2022 vs short calendar 2023 COMEX copper backwardation trade established April 22, 2021, was closed out on May 20, 2021, leaving us with a return of 305%. Robert P. Ryan Chief Commodity & Energy Strategist rryan@bcaresearch.com Ashwin Shyam Research Associate Commodity & Energy Strategy ashwin.shyam@bcaresearch.com Commodities Round-Up Energy: Bullish OPEC 2.0 offered no surprises to markets this week, as it remained committed to returning just over 2mm b/d of production to the market over the May-July period, 70% of which comes from the Kingdom of Saudi Arabia (KSA), according to Platts. While Iran's return to the market is not a given in OPEC 2.0's geometry, we have given better than even odds it will return to the market beginning in 3Q21 and restore most of the 1.4mm b/d not being produced at present to the market over the course of the following year. OPEC itself expects demand to increase 6mm b/d this year, somewhat above our expectation of 5.3mm b/d. Stronger demand could raise Brent prices above our average $63/bbl forecast for this year (Chart 7). Brent was trading above $71/bbl as we went to press. Base Metals: Bullish BHP declared operations at its Escondida and Spence mines were running at normal rates despite a strike by some 200 operations specialists. BHP is employing so-called substitute workers to conduct operation, according to reuters.com, which also reported separate unions at both mines are considering strike actions in the near future. Precious Metals: Bullish The Fed’s reluctance to increase nominal interest rates despite indications of higher inflation will reduce real rates, which will support higher gold prices (Chart 8). We agree with our colleagues at BCA Research's US Bond Strategy that the Fed is waiting for the US labor market to reach levels consistent with its assessment of maximum employment before it makes its initial rate hike in this interest-rate cycle. Subsequent rate changes, however, will be based on realized inflation and inflation expectations. In our opinion, the Fed is following this ultra-accommodative monetary policy approach to break the US liquidity trap, brought about by a rise in precautionary savings due to the pandemic. In addition, we continue to expect USD weakness, which also will support gold and precious metals prices. We remain long gold, expecting prices to clear $2,000/oz this year. Ags/Softs: Neutral Corn prices fell more than 2% Wednesday, following the release of USDA estimates showing 95% of the corn crop was planted by 31 May 2021, well over the 87% five-year average. This was in line with expectations. However, the Department's assessment that 76% of the crop was in good-to-excellent condition exceeded market expectations. Chart 7
By 2023 Brent Trades to $80/bbl
By 2023 Brent Trades to $80/bbl
Chart 8
Gold Prices Going Up
Gold Prices Going Up
Footnotes 1 Please see Trade Tables below. 2 Please see OPEC, Russia seen gaining more power with Shell Dutch ruling and EXCLUSIVE BlackRock backs 3 dissidents to shake up Exxon board -sources published by reuters.com June 1, 2021 and May 25, 2021. 3 Please see Chile's govt in shock loss as voters pick independents to draft constitution published by reuters.com May 17, 2021, and Peru’s elite in panic at prospect of hard-left victory in presidential election published by ft.com June 1, 2021. Peru has seen significant capital flight on the back of these fears. See also Results from Chile’s May 2021 elections published by IHS Markit May 21, 2021 re a higher likelihood of tax increases for the mining sector. The risk of nationalization is de minimis, according to IHS. 4 Please see Exxon walks away from stake in deepwater Ghana block published by worldoil.com June 1, 2021. 5 Please see OPEC 2.0's Production Strategy In Focus, which we published on May 20, 2021, for a recap our how we model OPEC 2.0's strategy. It is available at ces.bcaresearch.com. 6 Please see Will a lack of supply growth come back to bite the copper industry?, published by Wood Mackenzie on March 23, 2021. 7 Please see The Challenges and Prospects for Carbon Pricing in Europe published by the Oxford Institute for Energy Studies last month for a discussion of carbon taxes vs. emissions trading schemes. Investment Views and Themes Strategic Recommendations Tactical Trades Commodity Prices and Plays Reference Table Trades Closed in 2021 Summary of Closed Trades
Higher Inflation On The Way
Higher Inflation On The Way
Highlights Asset Management Regulation (AMR) represents a critical and successful structural reform that is defusing risks in the most hazardous parts of China’s credit system. This bodes well for long-term sustainability of the nation’s financial system and, hence, its long-term economic outlook. That said, the sheer size of risky products and shadow banking makes it impossible to reduce systemic risk without hampering overall credit origination. AMR will dampen bank and shadow banking credit growth further and the credit impulse will be negative by year-end. As a result, China's growth will decelerate. The risk-reward profile of Chinese stocks remains poor. Favor Chinese local currency government bonds as yields will drop further. Feature Chart 1China’s Growth Is Set To Decelerate
China's Growth Is Set To Decelerate
China's Growth Is Set To Decelerate
China’s broad credit and money growth have relapsed substantially. Given that they have historically been reliable leading indicators of business cycles (Chart 1), the question is: how far will credit growth decelerate. When gauging the magnitude of a money/credit slowdown, one should not only look at borrowing costs but also at the willingness and capacity of creditors to extend credit. In this context, it is essential to examine the impact of Asset Management Regulation (AMR) in China on both bank and non-bank credit growth. Please refer to Box 1 below for a more detailed discussion on AMR. BOX 1 What Is AMR? AMR (Asset Management Regulation) was introduced in 2018 to mitigate financial system risks, increase transparency of financial products, and, hence, enhance investor protection. Financial institutions (banks and non-banks) were originally obliged to meet AMR requirements by the end of 2020. However, after the pandemic broke out, this term was extended to the end of 2021. The main objectives of AMR are: To restrict financial institutions from dodging financial regulations and prevent them from engaging in regulatory arbitrage. To prohibit financial institutions from providing other financial organizations with “channels” for evading regulatory requirements. To preclude banks from investing in high-risk assets. To forbid financial institutions from providing explicit or implicit guarantees for the principal and return on asset management products. AMR non-compliant products need to be either terminated or revamped to become AMR compliant before December 31, 2021. Assessing the value of outstanding AMR non-compliant products will help to gauge the actual impact of AMR on credit growth over the course of this year. A portion of banks’ wealth management products (WMP) and single fund trust products are AMR non-compliant and will need to be terminated or revamped. Commercial banks’ WMPs represent fund investment and management plans developed, designed and sold by commercial banks to individuals or institutions. In China, individual investors are the main customers for banks’ WMPs. In 2020, individual investors accounted for more than 99% in number of investors and 87% in investment amounts.1 The outstanding amount of WMPs is presently RMB 25 trillion. Single fund trusts have one investor – usually a bank or another financial institution. Given the disclosure regulation for single fund trusts is much looser than other fund trusts, it was prevalently used by financial institutions, including banks, to channel funds into investments to achieve regulatory arbitrage. Chart 2China Has Not Yet Deleveraged
China Has Not Yet Deleveraged
China Has Not Yet Deleveraged
AMR represents regulatory tightening and will negatively affect bank and non-bank credit growth over the course of this year. In this report we examine what its impact will be on broad credit growth as banks and shadow banking attempt to comply with AMR by end of December this year. Authorities in China have been conducting well-thought-out surgical reforms – AMR being the cornerstone of these – to curb and restructure the risky elements of the credit system. By doing so, they have already dramatically reduced systemic risk in the financial system. Regardless of how deft and precise these reforms have been, they will continue to weigh on bank and shadow banking credit growth. The basis is that the sheer size of risky products and shadow banking makes it impossible to reduce systemic risk without hampering overall credit origination. It should also be noted that China has not yet deleveraged (Chart 2). How Large Are AMR Non-Compliant Assets? We reckon that AMR’s effect on broad credit is mainly through its impact on commercial banks’ Wealth Management Products (WMP) and single fund trusts. S&P Global2 estimates that by the end of 2020, banks will still have RMB 8.5 trillion in off-balance sheet WMP to restructure. Single fund trusts’ assets stood at RMB 7.7 trillion in March 2021. However, to avoid double counting, flows from banks to trust funds (“bank-trust cooperation”) should be deducted from this value. The basis is that channeling funds by banks via trust companies is already captured in banks’ WMP statistics. Overall, non-compliant AMR assets that need to be revamped by year-end are as follows: Banks’ non-compliant WPM 8.5 trillion Single fund trust assets excluding “bank-trust cooperation” 1.2 trillion Total RMB 9.7 trillion This RMB 9.7 trillion represents 3.6% of total social financing (TSF) excluding equity issuance and 4.2% of private credit. The latter is defined as TSF excluding equity and central and local government bond issuance as well as special bonds. Chart 3China: Various Borrowing Costs
China: Various Borrowing Costs
China: Various Borrowing Costs
SP Global2 estimates that around RMB 5 trillion WMP will be revamped and made AMR compliant during this year. To put this figure into perspective, banks revamped RMB 4.8 trillion in 2020 and RMB 5.7 trillion in 2019. This will leave RMB 3.5 trillion of non-compliant WMP that banks are likely to take on their balance sheet before year-end. Even in the case of revamped WMP and single fund trusts, there will be unintended consequences for borrowers. In particular, the cost of borrowing could rise and/or the maturity of loans could be shortened. Both will weigh down on economic activity in general, and investment in the real economy in particular. With full transparency and no implicit guarantee from banks, investors will require higher interest rates to invest in these products (Chart 3). In addition, investors will opt for shorter maturities of these products. Impact On Bank Credit… Chart 4China: Bank Loan Approvals And Bank Credit Impulse
China: Bank Loans Approvals And Bank Credit Impulse
China: Bank Loans Approvals And Bank Credit Impulse
As banks take these AMR non-compliant WMP onto their balance sheets, their assets will automatically expand even though they will not originate new loans/provide financing to the real economy. The estimated RMB 3.5 trillion of WMP is equivalent to 1.5% of commercial bank broad credit and 1.2% of their assets. Hence, AMR will reinforce the deceleration in new credit origination. Both bank assets and broad bank credit will slow and their impulses will contract further (Chart 4). Importantly, bringing these assets onto their balance sheet will require banks to both (1) allocate more capital to support these new assets and (2) increase provisions for the portion of these assets that are non-performing. The non-performing share of these AMR-non-compliant assets could be significant given that funds from off-balance sheet WMP were often invested in high-risk, high-return projects. These often represent claims on risky businesses, including property developers and local government financing vehicles (LGFV). In brief, there were reasons why banks did not initially put these assets on their balance sheets and doing so now will not be inconsequential. Overall, this move will hinder commercial banks’ ability and willingness to originate new credit, i.e., to provide new funding to the real economy (Chart 4). …And Shadow Banking Chart 5 demonstrates that shadow banking credit – comprised of trust loans, entrust loans, and unrealized banker acceptance bills – has been contracting. Outstanding shadow banking credit at RMB 23.9 trillion makes up 9% of TSF excluding equity issuance. Single fund trust loans – please refer to Box 1 above for more information – are the most vulnerable part of shadow banking to AMR. Despite their having contracted since 2017, single fund trust assets excluding “bank-trust cooperation” still amount to RMB 1.2 trillion or 0.5% of TSF, excluding equity issuance (Chart 6). Chart 5China’s Shadow Banking Continues To Shrink
China's Shadow Banking Continues To Shrink
China's Shadow Banking Continues To Shrink
Chart 6Single Fund Trusts Are The Most Vulnerable To AMR Regulation
Single Fund Trusts Are The Most Vulnerable To AMR Regulation
Single Fund Trusts Are The Most Vulnerable To AMR Regulation
This type of financing will continue to shrink, weighing on aggregate credit flow. Although investors in these products might reinvest their funds in AMR-compliant funds, they will demand higher interest rates to offset higher credit risk. The basis is that full transparency will inform them that the trust companies and banks can neither guarantee principal nor interest on their investments. Higher interest rates demanded by investors in trust funds or their reduced financing will affect borrowers that rely on funding from this source. Specifically, trust funds investment in property developers and LGFV has been and will continue to shrink (Chart 7). Impact On Property Developers And LGFV Property developers and LGFV are among the most vulnerable segments to reduced financing because of AMR. Trust companies have meaningful exposure to both real estate developers and LGFV. RMB 2.3 trillion in trust funds are invested in real estate and RMB 1.2 trillion in government projects, mostly representing claims on LGFV. Trust companies’ claims to both segments have been and will continue contracting (Chart 7). Property developers and LGFV are not only vulnerable to curtailed funding due to AMR but also from authorities’ campaign to limit their debt. Three Red Lines policy for property developers imposes caps on their debt. In addition, bank regulators have imposed limits on banks’ claims on property developers as well as residential mortgages (Chart 8, top panel). Loans are capped at 40% for the largest state-owned lenders, while banks’ mortgage lending should be no more than 32.5% of large banks’ outstanding credit. The regulations are even more rigorous for smaller banks. For smaller banks, caps on loans to real estate and mortgage loans are 27.5% and 20%, respectively.3 Banks’ credit to property developers and household mortgages are growing at a historically low pace and will likely decelerate further (Chart 8, bottom panel). To sum up, banks and shadow banking will curtail their exposure to property developers and LGFV. Consequently, these credit-intensive sectors will have to shrink their capital spending and construction activity. The latter will have ramifications for raw materials and industrial sectors exposed to traditional infrastructure and construction. Chart 7Trust Funds’ Exposure To Property Developers And LGFVs
Trust Funds' Exposure To Property Developers And LGFVs
Trust Funds' Exposure To Property Developers And LGFVs
Chart 8Banks’ Exposure To Property Developers And Residential Mortgages
Banks' Exposure To Property Developers And Residential Mortgages
Banks' Exposure To Property Developers And Residential Mortgages
Investment Conclusions On the positive side, AMR represents critical and successful structural reform that is defusing risks in the most hazardous parts of China’s credit system. This bodes well for long-term sustainability of the nation’s financial system and, hence, its long-term economic outlook. Nevertheless, this regulatory tightening along with clampdown on the property market and local government debt will weigh on the Chinese business cycle over the next six-to-nine months: Private credit growth will continue downshifting and its impulse will turn negative, weighing on credit-exposed sectors (Chart 9). Although the private credit impulse is unlikely to reach -10% of GDP like it did in 2018, it will likely turn negative by year-end. Our guess it might be negative 3-4 % of GDP later this year. Chart 9China: Private Credit Impulse Will Turn Negative By Year-End
China: Private Credit Impulse Will Turn Negative By Year-End
China: Private Credit Impulse Will Turn Negative By Year-End
Chart 10China: Fiscal Spending Impulse Will Be Modestly Positive In 2021
China: Fiscal Spending Impulse Will Be Modestly Positive In 2021
China: Fiscal Spending Impulse Will Be Modestly Positive In 2021
Public sector credit – measured as borrowing by central and local government, including special-purpose bonds – will continue decelerating according to bond quotas for this year. Still, higher government revenue will offset the slump in government borrowing so that government spending will grow in 2021 from a year ago. In aggregate, the fiscal spending impulse for all of 2021 will be positive at 1.6% of GDP (Chart 10). Overall, the fiscal spending impulse of 1.6% of GDP in 2021 will not offset the private credit impulse that we reckon to be about negative 3-4% of GDP. The upshot will be a modestly negative aggregate credit and fiscal spending impulse. The latter will be slightly worse than the readings of this indicator during the 2011 and 2014-15 slowdowns but more positive than in 2018 (please refer to Chart 1 above). This heralds a non-trivial business cycle slowdown. The latter will be concentrated in areas that usually benefit from credit and fiscal stimulus. Construction activity and traditional infrastructure spending are the most vulnerable areas. This entails that Chinese demand for raw materials will disappoint and base metals prices are vulnerable. With regard to investment strategy, investors should continue favoring Chinese local currency government bonds over stocks. As the economy decelerates, bond yields will drift lower. Share prices remain vulnerable. Chart 11 illustrates that net EPS revisions for the MSCI China A-share index has rolled over but has not yet dropped to their previous lows. Our hunch that EPS slowdown is not yet fully priced into the Chinese onshore equity market. Concerning MSCI China Investable non-TMT stocks, they have rolled over at their previous high (Chart 12). Given the negative corporate profit outlook, the risk-reward is unattractive both in absolute terms and relative to global equities. Chart 11Chinese Stocks: EPS Growth Expectations Will Downshift Further
Chinese Sotkcs: EPS Growth Expectations Will Downshift Further
Chinese Sotkcs: EPS Growth Expectations Will Downshift Further
Chart 12An Intermediate-Term Top In Chinese Non-TMT Stocks?
An Intermediate-Term Top In Chinese Non-TMT Stocks?
An Intermediate-Term Top In Chinese Non-TMT Stocks?
In the long run, however, the de-risking of the credit system is bullish for Chinese share prices. Declining systemic financial risks entail a lower equity risk premium. Consequently, equity valuations will ultimately be re-rated. Arthur Budaghyan Chief Emerging Markets Strategist arthurb@bcaresearch.com Qingyun Xu Associate Editor Qingyun@bcaresearch.com Footnotes 1 2020 Bank’s Wealth Management Product Report 2 Source: SP Global "China Banks May Still Have RMB3 Trillion In Shadow Assets By Year-End Deadline." 3 https://www.cbirc.gov.cn/cn/view/pages/ItemDetail.html?docId=955074&ite… Cyclical Investment Stance Equity Sector Recommendations
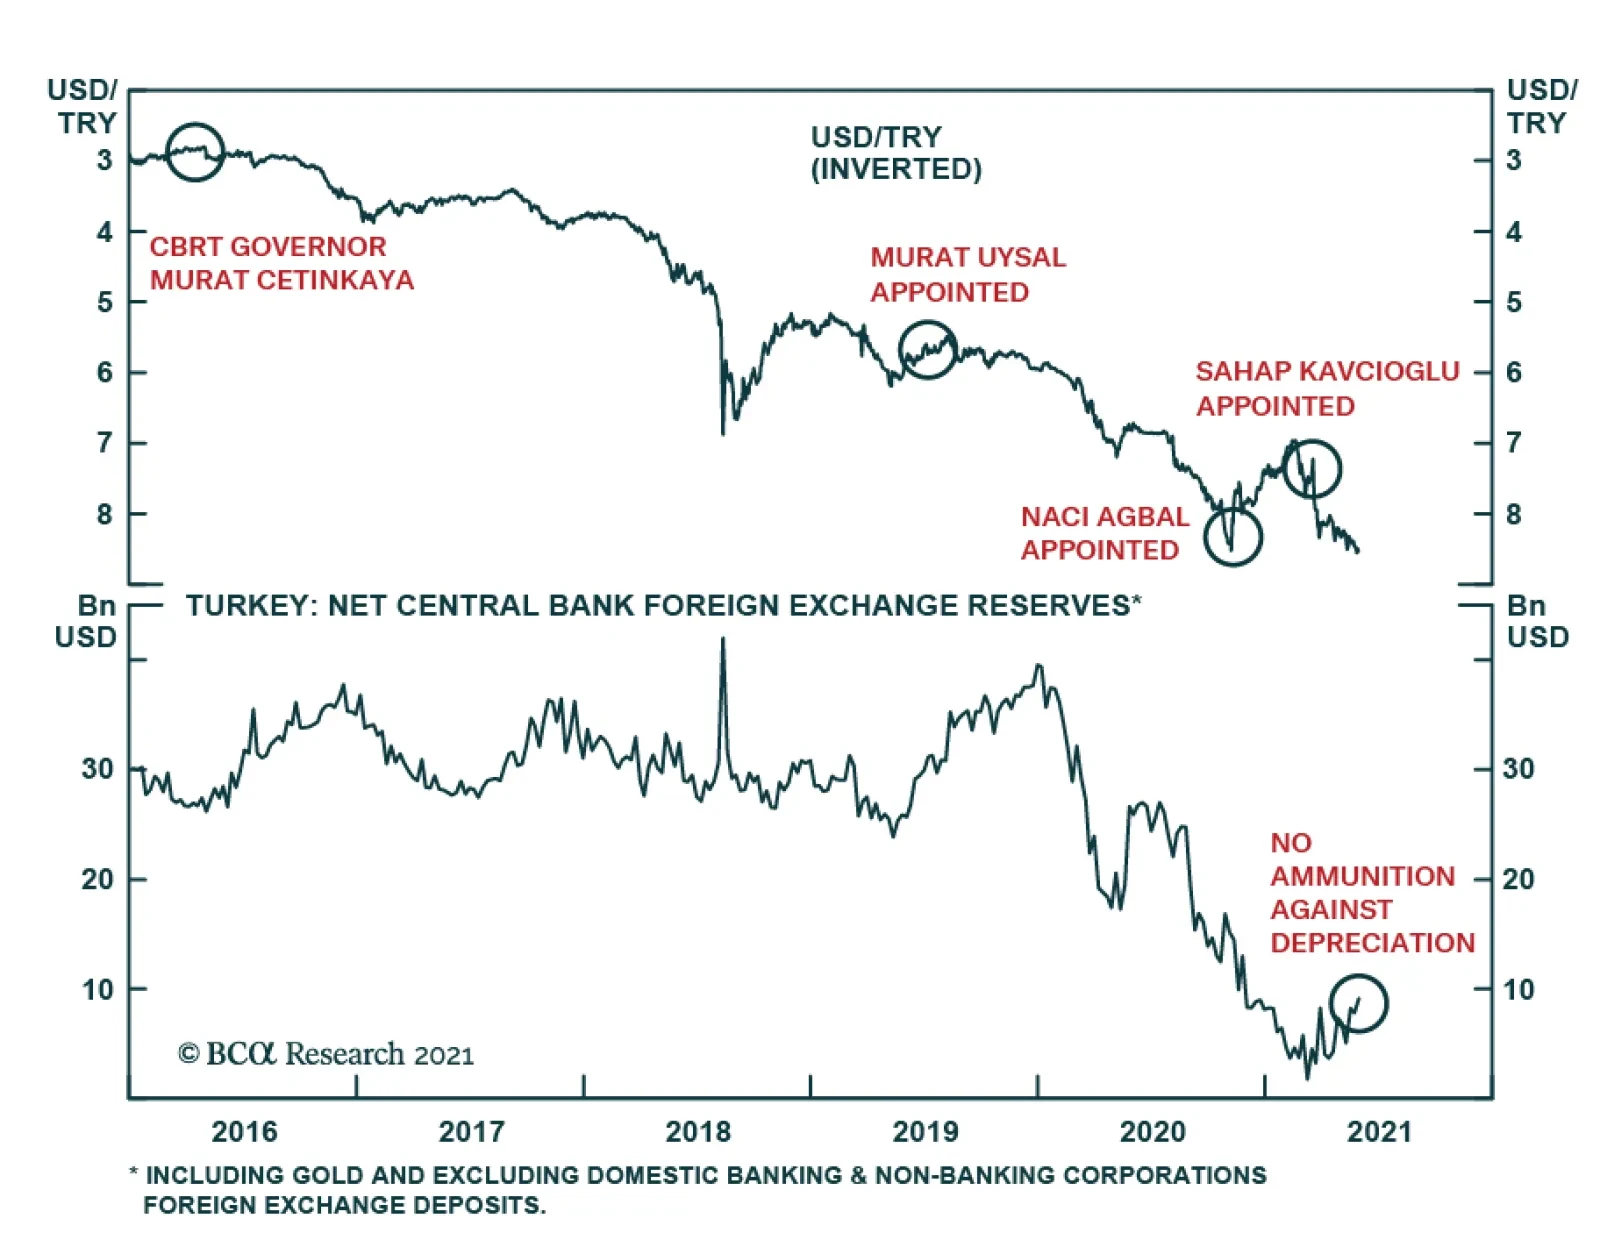
President Erdogan is once again injecting himself into the Turkish monetary policy. In an interview on Tuesday, the president stated “it’s an imperative that we lower interest rates. For that, we will reach July and August thereabouts so that rates can begin…
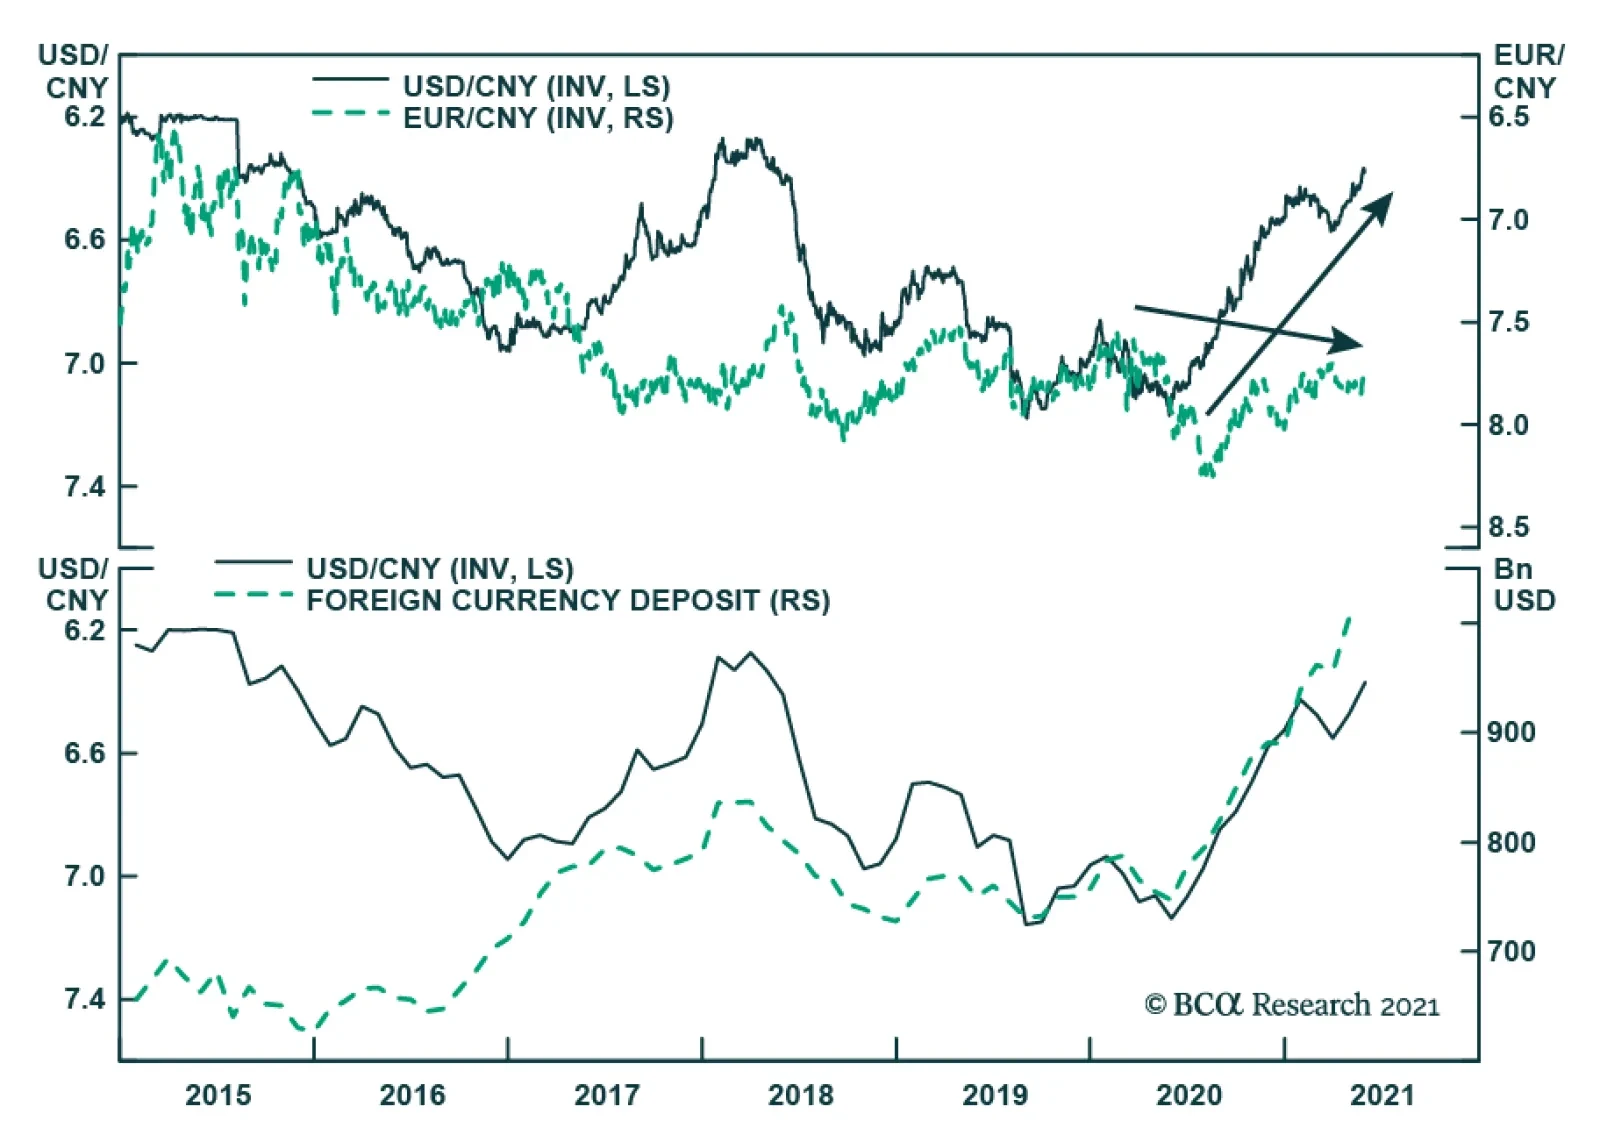
The PBoC announced on Monday that it will raise the reserve requirement ratio rate for FX deposits at financial institutions –the first FX deposit RRR rate hike in 14 years – effective on June 15. The RMB fell by a meager half percentage point against the USD…
Total Social Financing, a broad measure of Chinese credit growth, has slowed from its peak last October. The current pace of credit growth is broadly in line with nominal GDP growth. The authorities have made it clear that they want to stabilize the ratio of…
On Monday, the PBoC raised the reserve requirement ratio for Chinese banks’ foreign exchange deposits to 7% from 5% beginning June 15. The change aims to reduce foreign currency liquidity and in the process curb the CNY’s appreciation. The RRR hike follows a…