Emerging Markets

Highlights The Seventh National Population Census highlights the seriousness of China’s demographic deterioration; apart from a shrinking working-age population, the nation’s fertility and birth rates have dropped meaningfully. China’s urbanization rate will likely slow in the second half of this decade. The country’s urban population growth is only slightly positive, while the rural population is declining and aging. Demand for housing will experience a structural downshift, particularly in less developed regions. Competition for labor will become fiercer among regions and sectors, and wage growth will continue to accelerate. However, the manufacturing sector will remain competitive regardless of wage inflation, thanks to the rising quality of China’s labor force and innovation. Interest rates will structurally shift to a lower range, providing some tailwind to Chinese equities and government bonds. Feature The Seventh Population Census, conducted by the National Bureau of Statistics every 10 years, reinforced the magnitude of China’s demographic challenge. The nation’s population is not only aging but is set to start shrinking due to extremely low birth and fertility rates. The main implication is that China’s urbanization rate will slow and property market will likely encounter a structural downshift, tied to declining demand from both its working-age (age 15 to 64) and total population. Demand for housing will increasingly concentrate in top-tier cities because these metropolitan areas have more advantages attracting labor. Secondly, manufacturing will likely maintain its share of GDP, despite China’s push for consumption and growth in the service sector. Importantly, interest rates will continue to shift downward along with a decelerating potential growth; waning interest rates will create a tailwind to China’s capital market in the long term. Highlights From The Census The Census showed three meaningful shifts in China’s demographics in the past decade: 1. China is getting old before getting rich. China is experiencing a worse demographic transition than Japan in the early 1990s, with a lower level of per capita wealth than Japan attained when its working-age population peaked (Chart 1). Over the past ten years China’s population has only expanded by 5.4%, the lowest rate since the first census in 1953. Moreover, the country’s oldest cohort rose from 8.9% in 2010 to 13.5% and the working-age population is falling more quickly than in Japan. China’s working-age population peaked in 2010 and then fell by 6.79 percentage points in the next 10 years. In contrast, Japan’s working-age population peaked in 1992 and fell by 2.18 percentage points in the subsequent decade (Chart 1, top panel). 2. China’s total population is set to start declining in five years. Some demographers project that China’s total population will peak in 2027,1 but a high-level Chinese official recently predicted that the country’s population will start to trend down as early as in 2025.2 The relaxation of the one-child policy in 2015 helped to lift the birthrate (births per 1,000 people) briefly in 2016, before falling sharply again in 2017. The population’s natural growth rate, calculated as birthrate minus deathrate, is rapidly approaching zero (Chart 2). Chart 1China's Working Population Falling Faster Than Japan's In 1990s
China's Working Population Falling Faster Than Japan's In 1990s
China's Working Population Falling Faster Than Japan's In 1990s
Chart 2China's Population Growth Will Turn Negative In Mid-2020s
China's Population Growth Will Turn Negative In Mid-2020s
China's Population Growth Will Turn Negative In Mid-2020s
The birthrate is the main determinant of the population’s natural growth rate given that China’s deathrate has been steady for decades. If the birthrate continues to fall at the current rate, then China will undoubtedly reach a population turning point and will join nations such as Japan, Germany and South Korea, which have negative population growth. 3. A low fertility trap. Chart 3China's Alarmingly Low Fertility Rate Is Set To Decline Even Further...
China's Alarmingly Low Fertility Rate Is Set To Decline Even Further...
China's Alarmingly Low Fertility Rate Is Set To Decline Even Further...
China’s extremely low fertility rate3 is a major contributor to its falling birthrate. The current 1.3 reading is less than in many developed countries, such as Japan with 1.4 and the US with 1.6, and it is far below the fertility rate of 2.1 needed to stabilize a population, according to the United Nations (Chart 3). China’s fertility rate is set to dive even further in the coming years due to structural factors such as a dwindling number of childbearing-age women linked to the one-child policy implemented in the 1980s (Chart 4). China’s high female labor participation rate and low propensity among young people to get married, and the high cost of raising children in urban areas, all are long-standing socio-economic issues hindering the Chinese from having more babies (Chart 5). Chart 4…Due To Fewer Childbearing-Age Women And…
China’s Shifting Demographic Profile
China’s Shifting Demographic Profile
Chart 5...Structural Issues That Curb Chinese Propensity To Produce Babies
...Structural Issues That Curb Chinese Propensity To Produce Babies
...Structural Issues That Curb Chinese Propensity To Produce Babies
Bottom Line: These structural trends will take decades to reverse. China faces a dramatic plunge in its population in the very near future if the authorities do not enact significant and immediate policy changes. Urbanization Pace Will Slow The Census indicates that rapid urbanization continued through 2020, with the rate hitting 64% of the population, up 14 percentage points from 2010. However, the headline number in the urbanization rate understates China’s progress in industrialization, i.e. the country’s rural-to-urban transition has entered a late stage and the current pace cannot be sustained in the future. Significantly, China’s underlying demographic shifts will likely lead to a passive increase in the urbanization rate in the second half of this decade. This trend will curb rather than boost demand in urban areas. The experience of developed countries suggests that the pace of urbanization begins to slow when the rate reaches around 70% (Chart 6). Based on China’s current level, the country should reach the 70% threshold in just six to seven years. Meanwhile, China is much more industrialized than generally perceived: the country’s industrialization rate is currently 85%, which means that 85% of jobs in China are in non-agricultural sectors (Chart 7). Chart 6Urbanization Progress Stabilizes When Reaching 70%
Urbanization Progress Stabilizes When Reaching 70%
Urbanization Progress Stabilizes When Reaching 70%
Chart 7China Is Much More Industrialized Than Commonly Believed
China Is Much More Industrialized Than Commonly Believed
China Is Much More Industrialized Than Commonly Believed
Furthermore, a higher urbanization reading may be the result of negative natural population growth. Given that the urbanization rate is calculated as a percentage of urban population in the total population, a decline in the absolute level of total population (the denominator) could lead to a passive increase in the numerator. Chart 8Japan Has Had A "Passive" Increase In Urbanization Since 2012
Japan Has Had A "Passive" Increase In Urbanization Since 2012
Japan Has Had A "Passive" Increase In Urbanization Since 2012
For example, Japan’s urbanization rate rose significantly during the 2000s, and maintained an upward momentum even as its total population peaked in 2010. However, its urban population growth rate dropped dramatically and turned negative in 2012 – suggesting the increase in the urbanization rate is due to a shrinking total population instead of expanding urbanities (Chart 8). The rising deathrate of the rural elderly population is another important reason for the accelerated increase in Japan's urbanization rate. China’s urban population growth is on a sharp down trend, although it is still slightly positive (Chart 9). However, the rural population has shrunk and aged, which limits future migration from rural to urban areas (Chart 10). China’s rural population has shrunk by almost half from its peak in 1995 to 2020. The share of the rural population 50 years and older doubled in the same period. Chart 9China's Urban Population Growth Is On The Decline...
China's Urban Population Growth Is On The Decline...
China's Urban Population Growth Is On The Decline...
Chart 10...While Rural Population Has Shrunk And Aged
...While Rural Population Has Shrunk And Aged
...While Rural Population Has Shrunk And Aged
Thus, China’s rural-to-urban migration has slowed in the past decade (the trend turned negative last year due to the pandemic). The number of new migrant workers moving from the country to the city tumbled from 12.5 million a year to 2.5 million, and the number of younger migrants (50 years and younger) has contracted since 2017 (Chart 11). Chart 11The Number Of Young Migrant Workers Started Contracting In 2017
The Number Of Young Migrant Workers Started Contracting In 2017
The Number Of Young Migrant Workers Started Contracting In 2017
Bottom Line: Country-to-city migration will be smaller going forward based on a diminishing rural population, an increasing number of elders and a reduced proportion of young people in rural areas. When China’s population peaks, which is highly likely by 2025, its urbanization progress will turn passive and the aggregate population growth in urban areas may also turn negative. Aggregate Housing Demand Will Dwindle The demographic shifts described above will impact the demand for properties and accentuate regional divergences in housing demand and prices. Historically, changes in the working-age population led residential home sales by five to six years. Home sales have fluctuated in a downward trend in the past five years along with a peak in the working-age population in 2015 (Chart 12). Moreover, the sharp deterioration in China’s birthrate means that home sales will be significantly reduced in the next 15-20 years. Chart 12Aggregate Demand For Housing Will Dwindle Along With Smaller Labor Force
Aggregate Demand For Housing Will Dwindle Along With Smaller Labor Force
Aggregate Demand For Housing Will Dwindle Along With Smaller Labor Force
Chart 13Population Is An Important Driver For Urban Development
Population Is An Important Driver For Urban Development
Population Is An Important Driver For Urban Development
The regional divergence in the demand for housing will also widen. Population, especially the labor force, is an important driver for urban development and housing (Chart 13 above). Population migration mainly occurs among 15-59-year-olds, and this cohort is also the main homeowner group. As China’s labor force increasingly flocks to developed areas, the economic development of less developed areas will face greater challenges (Chart 14). Those areas will encounter a combination of declining birthrate and outflow of labor force. This demographic shift is already evident in many two- and third-tier cities where housing prices have lagged far behind the tier-one cities (Chart 15). Chart 14Less Developed Regions Have Seen Net Population Losses In The Past Decade…
China’s Shifting Demographic Profile
China’s Shifting Demographic Profile
Chart 15...And Softening Housing Prices
...And Softening Housing Prices
...And Softening Housing Prices
Bottom Line: The drop in China’s birthrate and working-age population will lead to less demand for housing. However, China’s first-tier cities (and core metropolitan areas) will likely continue to outperform third- and fourth-tier cities in terms of labor growth, consumption and home prices. Labor Measures And Manufacturing Competitiveness Labor shortages in selected sectors and upward pressure on wages will likely intensify in the coming decade. While labor quantity will decrease, the quality of China’s labor force will remain competitive. From an aggregate economy perspective, improving labor productivity and automation can help to offset the smaller number of workers (Chart 16). Following two decades of rapid expansion in the industrial sector, China’s labor shortages began to multiply when the country’s urbanization ratio rose to between 50% and 60%. Looking at Japan and Korea, for example, a shortage in manufacturing labor emerged when the countries’ manufacturing/agricultural employment ratio climbed above one. China’s employment ratio likely have crossed this threshold in the mid-2010s, coinciding with a rollover in its working-age population and a massive jump in wage growth (Chart 17). Chart 16Improving Labor Quality To Offset Smaller Labor Quantity
China’s Shifting Demographic Profile
China’s Shifting Demographic Profile
Chart 17Manufacturing Labor Shortage And Wage Pressure Intensified In Mid-2010s
Manufacturing Labor Shortage And Wage Pressure Intensified In Mid-2010s
Manufacturing Labor Shortage And Wage Pressure Intensified In Mid-2010s
The manufacturing and service sectors will continue to compete with agriculture for labor. The wage gap between urban and rural areas is disappearing and there are signs of labor market tightness in urban settings (Chart 18). While the demand for labor has been flat, labor supply peaked in 2013/14 and has been on the wane since that time, which has resulted in an ascending demand-to-supply ratio in China’s urban labor market (Chart 19). Chart 18Wage Gap Between Urban And Rural Areas Is Disappearing
Wage Gap Between Urban And Rural Areas Is Disappearing
Wage Gap Between Urban And Rural Areas Is Disappearing
Chart 19Urban Labor Supply Can't Keep Up With Demand
Urban Labor Supply Can't Keep Up With Demand
Urban Labor Supply Can't Keep Up With Demand
The bright side is that China’s labor shortage and escalating wages have not eroded the competitiveness of its manufacturing sector. Impressive labor productivity gains and progressively improving labor quality have trumped higher input costs (Chart 20). Consistent with improved productivity, China’s share of global trade continues to build regardless of higher wages, a stronger currency, and import tariffs from the US (Chart 21). The manufacturing sector has gradually climbed the value-added chain in recent years and mounting wage pressures will likely push the corporate sector, particularly in more developed coastal regions, to move further away from a labor-intensive model. Chart 20Rising Wages But Stable Unit Labor Costs
Rising Wages But Stable Unit Labor Costs
Rising Wages But Stable Unit Labor Costs
Chart 21Chinese Exporters Have Maintained Their Global Market Share Despite Higher Costs
Chinese Exporters Have Maintained Their Global Market Share Despite Higher Costs
Chinese Exporters Have Maintained Their Global Market Share Despite Higher Costs
The 14th Five-Year Plan outlined policymakers’ decision to maintain the share of manufacturing in GDP, which is around 30%. Labor productivity in the manufacturing sector is notably higher than in the service sector. In an environment of shrinking labor, keeping workers in a high-productivity sector may be a better way to stabilize potential growth. Bottom Line: The competition for labor between sectors will intensify. Meanwhile, manufacturing’s share of China’s economy will likely be sustained in this decade, which will help to mitigate the speed of the deceleration in China’s growth. Implications On Policy Setting Chart 22AInterest Rates Drop With Aging Population
Interest Rates Drop With Aging Population
Interest Rates Drop With Aging Population
The combination of a weak fertility/birthrate and a decline in the working-age population will weigh on consumption and investment growth, bringing deflationary headwinds to the economy. China’s interest rate regime will likely follow its Asian neighbors to downshift structurally (Chart 22). Despite moderating potential economic growth, a low interest rate environment may be positive for China’s financial asset prices. Chart 22BInterest Rates Drop With Aging Population
Interest Rates Drop With Aging Population
Interest Rates Drop With Aging Population
Chart 22CInterest Rates Drop With Aging Population
Interest Rates Drop With Aging Population
Interest Rates Drop With Aging Population
Chart 23Support Ratios Are Declining Globally
Support Ratios Are Declining Globally
Support Ratios Are Declining Globally
One could argue that a falling support ratio – measured by the number of workers relative to consumers – can lead to inflation (Chart 23). This could happen to the US where baby boomers retire but continue to spend particularly on healthcare, while production falls along with the available workers. As production falls in relation to consumption, inflation could rise. However, this is not the case in China where both production and consumption will fall. Demand from an aging population may increase pockets of inflationary pressures, such as healthcare and elderly care, but it is unlikely to fully offset weakening demand from a declining working-age population and total population. In other words, both the numerator (workers) and denominator (consumers) will be falling in China. While a weakening demographic profile is negative for economic growth, lower prices on capital will make corporate debt-servicing cheaper. Further industrial consolidation aimed at supply-side reforms will also improve corporate profitability. Cheaper capital, improving productivity and efficiency could provide tailwinds to Chinese stocks and government bonds in the long run. Jing Sima China Strategist jings@bcaresearch.com Footnotes 1As of 2020, China’s total population is at 1411.78 million. 2"China faces an economic crisis as a population peak nears," South China Morning Post, April 18, 2021. 3The total fertility rate is based on the number of newborns by women in child-bearing years, which is ages 15-44 or 15-49 by international statistical standards. Cyclical Investment Stance Equity Sector Recommendations
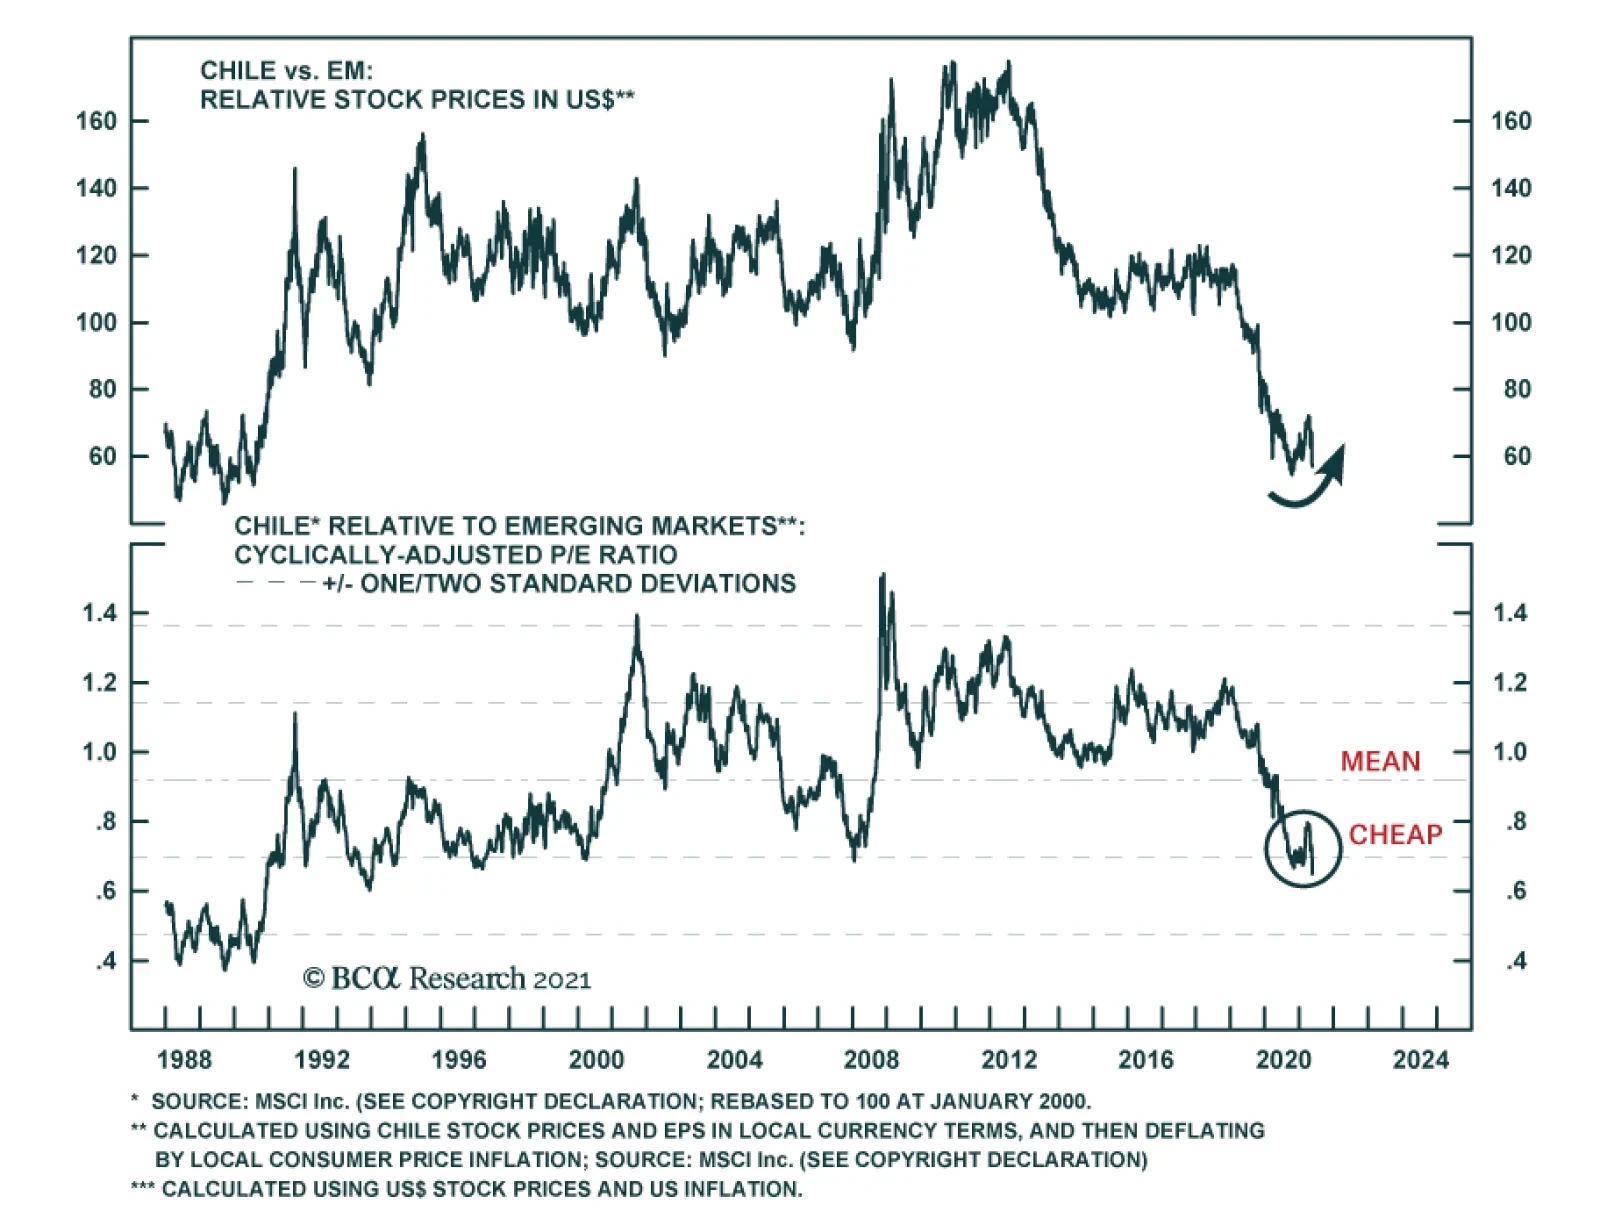
Chilean equities collapsed last week on news of the ruling coalition’s surprise underperformance in the election for members of the constitutional convention tasked with rewriting the constitution. President Sebastian Pinera’s center-right Chile Vamos…
Highlights The number one risk to our upbeat view on European economic activity and assets is a Chinese economic slowdown. The second most important risk to our view is a potential deterioration in the global credit impulse, even outside of China. The third major risk is that the current bout of US inflation proves to be permanent, which, paradoxically, would prompt a deflationary shock for the global economy. Despite these risks, we maintain our favorable view on European assets over the coming 12 to 18 months. However, favoring industrials over materials, and financials over other cyclicals, Swedish equities and peripheral bonds in balanced portfolios mitigate some of these risks. Do not expect the ECB to announce a tapering of its asset purchases at the June meeting. The ECB will lag well behind the Fed and the BoE. Buy European steepeners and US flatteners as a box trade. Feature Over the past three weeks, a sustained marketing push gave us the opportunity to interact intensively with a large subset of our clients (albeit virtually, courtesy of COVID-19). Generally, our positive stance on European assets was well received, but investors are loosely committing themselves to this view and very few are willing to make an aggressive bet on Europe. In fact, in most meetings, we spent more time than usual discussing the risks to our upbeat view on Europe and European cyclical equities. Three risks to our 12- to 18-month view standout. The first is a serious slowdown in Chinese growth. The second is a greater-than-anticipated impact on economic activity as a result of a deterioration in DM credit impulses. The third is stronger-than-expected US inflation. An also-ran was the risk that the current vaccines do not protect against the two variants of the COVID-19 virus dominant in India. However, an increasing body of recent scientific studies demonstrates that this is not the case; hence, this risk has been lowered to minor. Risk #1: A Chinese Slowdown Authorities in China have been constricting credit policy over the past six months. The key tools used have been a regulatory tightening in shadow-banking activities and real estate transactions, moral suasion on small banks to limit the expansion of their loan books, and slowing liquidity injections in the interbank system. Beijing’s policy tightening reflects the following two worries. First, the financial stability risk has increased meaningfully over the past 16 months. China’s corporate debt-to-GDP has increased 13 points to 163%, and is among the highest for major economies (Chart 1). Moreover, Chinese policymakers remain concerned by the middle-income trap, which would become an increasingly likely outcome if the stability of the country’s financial and banking system were compromised. Second, the latest round of stimulus has worsened wealth inequalities. House prices have been robust, yet household disposable income growth is still low by the yardstick of the past 40 years (Chart 2). Thus, a large proportion of China’s population has experienced a decline in housing affordability. Chart 1China"s Financial Stabilitiy Risk
China"s Financial Stabilitiy Risk
China"s Financial Stabilitiy Risk
Chart 2Chinese Households Are Not Doing That Well
Chinese Households Are Not Doing That Well
Chinese Households Are Not Doing That Well
The Chinese economy recently started to feel the impact of the policy tightening. China’s April retail sales data missed expectation by 7.2%, and, as our China Investment Strategy colleagues have observed, the demand side of the economy has lagged behind the recovery in supply ever since China re-opened last year. Credit trends confirm this assessment. The decline in the excess reserve ratio of the Chinese banking system is consistent with the recent deterioration in the credit impulse, which accelerated in April (Chart 3). Since the Great Financial Crisis, weaker Chinese credit flows herald softer global industrial activity and trade (Chart 3, bottom panel). The Chinese slowdown could become a major problem for the European economy and its asset markets. As we recently showed, the sensitivity of European economic activity to global growth has been steadily increasing over the past 20 years (Chart 4). Moreover, the spread between M1 and M2 money supply growth in China best explains the gap between European industrial activity and that of the US (Chart 4, middle and bottom panels). Essentially, M1 minus M2 approximates the Chinese private sector’s marginal propensity to consume, because it captures how fast demand deposits are growing relative to savings deposits. Thus, the recent decline in China’s marginal propensity to consume constitutes a bad omen for European activity and profit growth, both in absolute terms and relative to the US. Chart 3A Policy-Induced Slowdown
A Policy-Induced Slowdown
A Policy-Induced Slowdown
Chart 4Europe Is More Exposed Than The US
Europe Is More Exposed Than The US
Europe Is More Exposed Than The US
The slowdown in China’s economy will hurt European asset prices via multiple channels. Importantly, cyclical stocks are expensive and overbought compared to defensive ones. A meaningful decline in Chinese growth could result in a deep fall in the cyclicals-to-defensives ratio, which would hurt the pro-cyclical EUR/USD exchange rate (Chart 5). A weaker China might also create a significant fall in global yields, because it would hurt global growth, accentuate deflationary forces, and upset investor sentiment. European stocks underperform US equities when global yields decline (Chart 6). Chart 5The Euro Is Pro-Cyclical
The Euro Is Pro-Cyclical
The Euro Is Pro-Cyclical
Chart 6A Key Threat To European Stocks
A Key Threat To European Stocks
A Key Threat To European Stocks
Despite the dire impact that a Chinese economic slowdown normally causes on European growth and assets, this outcome remains a risk and not a base case (albeit, the top risk in our view). First, today is one of the rare occasions when global and European economic activity can decouple from China. The Euro Area’s vaccination campaign is gaining steam, which will allow a re-opening of the economy this summer (Chart 7). The vast pent-up demand in durable goods evident in Europe and the positive impact of the European monetary expansion on the contribution of consumer expenditure to real GDP growth also create powerful offsets (Chart 8). Chart 8European Pent-Up Demand As An Offset
European Pent-Up Demand As An Offset
European Pent-Up Demand As An Offset
Chart 7Improving Vaccine Rollout
Improving Vaccine Rollout
Improving Vaccine Rollout
The global industrial cycle is more buffered than usual against a Chinese economic slowdown. The collapse in the inventory-to-sales ratios around the world will fuel several quarters of restocking, which will boost the global manufacturing sector (Chart 9). Moreover, governments across advanced economies are unleashing large-scale infrastructure plans, such as the $2 trillion bill proposed by the Biden administration in the US or the EUR250 billion budget proposal by the Draghi government in Italy. As the EUR750 billion NGEU funds are disbursed, the tailwind to infrastructure spending will only grow (Chart 10). Additionally, the current spurt in inflation around the world is a relative price shock driven by scarcity created during the pandemic. This price shock incentivizes companies to expand production and capacity to meet demand. As a result, global capex intentions are rising, which will create an additional offset to China. Chart 9Restocking Ahead
Restocking Ahead
Restocking Ahead
Chart 10More Fiscal Support This Way Comes
More Fiscal Support This Way Comes
More Fiscal Support This Way Comes
Finally, constraints on Chinese policymakers limit to how far Chinese growth will decelerate. The Chinese Communist Party Congress, in which the make-up of the politburo is determined for the next five years, takes place in October 2022. However, the weak growth rate of household disposable income creates a headache for China’s leadership. While another round of massive stimulus is unlikely to shore up household disposable income (it has not worked thus far), Beijing will not take the chance to generate another deflationary shock. This constraint creates a natural floor under the growth deceleration that Beijing can tolerate. Thus, while a policy mistake is still possible, it is not our base case scenario. Investment Implication Faced with the aforementioned dynamics, BCA recommends that investors with a short-term investment horizon go neutral on cyclical equities relative to defensive ones. Practically, this means that EUR/USD is likely to continue to churn between 1.18 and 1.235 for the coming two to three months. Additionally, European equities are likely to move sideways relative to their US counterparts over this period. Within cyclical equities, we favor industrials over materials. Commodity prices, and thus the materials sector, are the most exposed to China. Meanwhile, the outlook for infrastructure spending and capex in DM economies has a greater impact on industrial stocks than on materials ones. Technically, industrials remain toward the bottom of their upward-slopping trend channel relative to materials, which suggests further catch up is likely (Chart 11). We also favor European financials over the rest of the cyclical sectors. The negative impact of a greater-than-expected Chinese economic slowdown on global yields will hurt financials. Nonetheless, domestic economic activity affects financials more than it influences the more internationally focused industrials and materials sectors. Thus, if the Eurozone service PMI can slingshot higher, a result of the re-opening of the economy this summer, then European financials will outperform industrials and materials stocks even if the Chinese economy slows (Chart 12). Moreover, financials trade at a large discount compared to these other two cyclical sectors (Chart 12). Chart 11Overweight Industrials Vs Materials
Overweight Industrials Vs Materials
Overweight Industrials Vs Materials
Chart 12Financials As A Protection Against China
Financials As A Protection Against China
Financials As A Protection Against China
Finally, we continue to favor Swedish equities. Industrials and financials account for 65% of the Swedish MSCI benchmark compared to 30% for that of the Euro Area. Therefore, they are particularly exposed to the positive outlook on global infrastructure spending and capex. Moreover, Swedish equities generate a return on equity of 15%, compared to 6% for the Eurozone stocks. To protect against the risk created by a weakening Chinese economy, we recommend investors hedge a long / overweight bet on Sweden with a short / underweight position in Norwegian equities that massively over-represent energy and materials. Risk #2: A Global Credit Impulse Deterioration According to the BIS data, the global credit impulse is on the verge of deteriorating, even outside of China. The G10 plus China annual credit impulse is elevated and peaking (Chart 13, left). Meanwhile, quarterly credit impulses in the US, the Euro Area, and China are negative (Chart 13, right), which often leads to turning points in the annual change in credit flows. Chart 13A Global Credit Impulse Problem
A Global Credit Impulse Problem (I)
A Global Credit Impulse Problem (I)
Chart 13A Global Credit Impulse Problem
A Global Credit Impulse Problem (I)
A Global Credit Impulse Problem (I)
A deterioration in the credit impulse could result in a sharp slowdown in global economic growth, because the deceleration in credit creation is broad-based among the major economies. If global growth decelerates, then European economic activity will also suffer. Table 1Essential Sector Breakdowns
Risks
Risks
The impact on European financial markets will come from lower yields. A growth deceleration prompted by a falling credit impulse will put downward pressure on yields and will hurt the performance of value stocks relative to growth equities. Cyclical equities will also underperform defensive ones. In this scenario, European stocks will lag behind their US counterparts because of their relative sectoral biases (Table 1). Within the European benchmark, Tech-heavy Dutch stocks would perform best once yields begin to decline. The effect on growth of the slowing credit impulse remains a risk and not a base case scenario. Last year’s surge in credit intake mostly reflected precautionary demand. Companies around the world tapped their credit lines or the capital markets early in the crisis to build liquidity buffers. They then continued to borrow to take advantage of the exceptionally low interest rates that prevailed throughout most of the year. Similarly, a large proportion of household borrowing amounted to debt refinancing. As a result, last year’s explosion in credit growth had a limited impact on spending. Thus, the credit impulse’s decline in advanced economies should minimally hurt aggregate demand in the coming months. Investment Implication Investors can protect against this risk by overweighting Italian and Spanish bonds in a balanced portfolio. First, these instruments continue to offer better value than other government bonds around the world. Moreover, if global growth turns out to be weaker than expected, the ECB might have to increase the envelope of the PEPP program, which has greatly benefited peripheral bonds. Moreover, the NGEU and REACT EU program buttress weaker European sovereign borrowers. Therefore, yield-hungry global investors will resume their aggressive purchase of the high-yielding peripheral bonds if global interest rates decline anew because of softening economic activity. Risk #3: Stronger Than Expected US Inflation BCA’s house view is that the current surge in global and US inflation is transitory, even if the pressures could last a few months before ebbing. It is mainly a consequence of inadequate aggregate supply in the face of a sudden surge in demand. We cannot be dogmatic about the inflation risk. The price-components of all the major activity surveys in the world are rising, and, in the US, the inflation expectations of households have risen meaningfully (Chart 14). If an inflation mentality were to take root, then core CPI would not decelerate toward yearend. Stronger-than-expected US core CPI would put significant upward pressure on Treasury yields. First, long-dated inflation expectations could begin to converge to the breakeven rates in the shorter tenors of the curve (Chart 15). More importantly, the Fed would become more hawkish sooner. This faster policy tightening would lift the OIS curve and result in higher real yields as well. Chart 14Are Inflation Expectations Becoming Unmoored?
Are Inflation Expectations Becoming Unmoored?
Are Inflation Expectations Becoming Unmoored?
Chart 15Long-Dated Market-Based Inflation Expectations Still Lag
Long-Dated Market-Based Inflation Expectations Still Lag
Long-Dated Market-Based Inflation Expectations Still Lag
The euro would therefore weaken, and the dollar would rally across the board. European inflationary pressures are limited compared to those of the US. The Eurozone suffers from a larger output gap due to the lagging nature of the European recovery, which more timid fiscal stimulus and Europe’s late start to the vaccination campaign compounded. Consequently, the ECB will not match the Fed’s faster tightening of policy, even in this scenario. Higher US TIPS yields and a stronger dollar would ultimately be deflationary blows to global growth. The dollar would directly tighten EM financial conditions. Higher real yields would destabilize stretched equity prices around the world. The resulting shock to global financial conditions would cause a major slowdown in global growth to occur much earlier than we currently foresee. While yields would rise at first, they would end 2022 at much lower levels than we currently expect because of this deflationary outcome. This combination would be very harmful to European equities, both in absolute terms and relative to the global benchmark. At first, European stocks would probably briefly fare well. Once investors begin to digest the deleterious impact of stronger inflation on global growth, however, the pro-cyclical European market will begin to suffer. Tighter EM financial conditions and underperforming financials will only accentuate the European stock market ills. Much stronger inflation is a risk and not a base case for now, because the current bout of inflation is transitory. The supply-side of the economy is already responding to the signal created by higher prices. Firms are set to increase their inventories and capex intentions are moving higher. Moreover, many of the bottlenecks constraining global supply chains will loosen, as the global economy re-opens in response to the international vaccination campaign. Additionally, current labor shortages in low-wage industry will also dissipate, once the $300 weekly support by the US government ends after the month of September. Thus, the supply of labor will also pick up in the fourth quarter of 2021. Moreover, the Fed could remain tolerant of an inflation overshoot, which would limit the pain of its impact. That being said, there is a real inflation risk due to the global deterioration in the dependency ratio and the shift to the left in terms of the economic preferences of the median voter. However, this danger is backdated to 2024 and beyond, once global labor markets are closer to full employment. Investment Implication There is little protection in our current set of recommendations against this risk, but this is a smaller threat than the previous two risks. However, when viewed alongside the first and second set of risks, the combined probability of a dangerous outcome for the market in general and for Europe in particular has grown compared to six months ago. Thus, while the jury is still out on these questions, it makes sense to de-risk portfolios temporarily, until the reward-to-risk ratio has once again improved. Hence, a tactical neutral stance on cyclical relative to defensive equities and on Europe relative to the rest of the world is appropriate for now. Will The ECB Join The BoC? At its April meeting, the Bank of Canada jolted the market by announcing a much earlier-than-anticipated start to its tapering program. We do not believe that the ECB will follow up at its June meeting. In a recent report, BCA’s Global Fixed-Income Strategy team highlighted the constraint that will prevent the ECB from adjusting policy next month. The main factors are as follows: The results from the ECB’s strategic review have yet to be announced. Adjusting policy before an eventual change in the inflation mandate of the central banks creates an unnecessary risk of policy whipsaw. Yet another policy flip-flop would further mar the ECB’s credibility. Chart 16The ECB Does Not Want To Upend Credit Growth
The ECB Does Not Want To Upend Credit Growth
The ECB Does Not Want To Upend Credit Growth
Loan growth in Europe is slowing down, led by France. However, Italian credit activity is improving in response to the generous TLTRO uptake in the southern economy (Chart 16). At this juncture, a rapid policy adjustment would threaten the recovery, while Europe has yet to re-open. Italian spreads remain fragile. The ECB’s asset purchases are an important contributor to the easing in financial conditions across the periphery. The recent 25bps widening in the BTP-Bund spread is a reminder that European fixed-income markets are not fully tension-free. Thus, a rapid removal of support could prompt a reflex selloff in Italian bonds. The subsequent tightening in financial conditions would unnecessarily feed deflationary pressures in Europe. The euro is strong. If the ECB unsettled the market and removed monetary accommodation as fast or even faster than the Fed, the euro’s rally would suddenly accelerate. This would generate a powerful deflationary shock for Europe that would force the ECB to adjust its inflation forecasts downward. Chart 17Especially When China Creates A Threat
Especially When China Creates A Threat
Especially When China Creates A Threat
The Chinese economy is weak, which increases uncertainty around European economic outcome via the trade channel (Chart 17). Instead, the meetings in the back half of the year are much more likely candidates for the ECB to begin talking about its tapering program. By then, the European economic re-opening will have taken place, to which growth will have responded. The results of the ECB’s strategic reviews will have been announced. Finally, plans will have been ratified for the usage of NGEU funds across the EU, and thus, fiscal clarity will improve. Even if the ECB starts talking before yearend of terminating the PEPP, its communications will indicate that the program’s full envelope will be deployed within the original time frame. Thus, the PEPP program will be in place until the end of March 2022. Moreover, to prevent a rapid deterioration in bank credit, the ECB will continue to provide generous financing to deposit-taking institutions via the TLTRO program. Under these circumstances, the ECB is unlikely to increase its deposit rate before 2014. These views imply that the ECB policy tightening (both on the balance sheet and interest rate fronts) will lag behind that of the Fed, the BoE, the Norges Bank, and the Riksbank. Only the BoJ and the SNB will move after the ECB. The continued involvement of the ECB in the European fixed-income market, along with the elevated likelihood that we remain years away from the first rate hike, confirms that an overweight stance in European peripheral bonds is appropriate. We also continue to overweight corporate credit within European fixed-income portfolios. Our fixed-income colleagues also share these views. Chart 18Justifying A Box Trade
Justifying A Box Trade
Justifying A Box Trade
Finally, the German yield curve should steepen compared to that of the US. Even if the ECB lags well behind the Fed when it comes to tightening policy, the current terminal rate proxy embedded in the EONIA curve is too low (Chart 18). Meanwhile, the earlier lift-off date for interest rates in the US relative to the Euro Area points to rising short rates west of the Atlantic. In this context, a box trade buying steepeners in Europe and flatteners in the US is appropriate, especially since it generates a positive carry of 167 bps (hedged into USD). Mathieu Savary, Chief European Investment Strategist Mathieu@bcaresearch.com Cyclical Recommendations Structural Recommendations Currency Performance
Risks
Risks
Fixed Income Performance Government Bonds
Risks
Risks
Corporate Bonds
Risks
Risks
Equity Performance Major Stock Indices
Risks
Risks
Geographic Performance
Risks
Risks
Sector Performance
Risks
Risks
Closed Trades
Highlights The selloff in crypto-currencies on May 19 may be overblown but the risk of government intervention is a rising headwind for this asset class. While environmental concerns are a threat to Bitcoin, the entire crypto-currency complex faces a looming confrontation over governance. Digital currencies are a natural evolution of money following coinage and paper. Moreover a sizable body of consumers is skeptical of governments and traditional banking. Loose monetary conditions are fueling a speculative mania. However, governments fought for centuries to gain a monopoly over money. As crypto-currencies become more popular, governments will step in to regulate and restrict them. Central bank digital currencies (CBDCs) threaten to remove the speed and transactional advantage of crypto-currencies, leaving privacy/anonymity as their main use-case. Feature The prefix “crypto” derives from the Greek kruptos or “hidden.” This etymology highlights one of the biggest problems confronting the crypto-currency craze in financial markets today. Speed and anonymity are the greatest assets of the digital tokens. But the former advantage is being eroded by competitors while the latter is becoming a political liability. In the 2020s, governments are growing stronger and more interventionist, not weaker and more laissez faire. Chart 1Loose Money Fuels Crypto Mania
Loose Money Fuels Crypto Mania
Loose Money Fuels Crypto Mania
Bitcoin and rival crypto-currency Ethereum fell by 29.5% and 43.2% in intra-day trading on May 19, only to finish the day down by 13.8% and 27.2%, respectively. The market panicked on news that China’s central bank had banned firms from handling transactions in crypto-currencies. What really happened was that China’s National Internet Finance Association, China Banking Association, and Payment and Clearing Association issued a statement merely reiterating a 2013 and 2017 policy that already banned firms from handling transactions in crypto-currencies. These three institutions also warned about financial speculation regarding crypto-currencies.1 The crypto market suffered a spike in volatility because it is in the midst of a speculative mania. In the last five years, total market capitalization of crypto-currencies has risen from around $7 billion to $2.3 trillion,2 recording a 34,000% gain. Some crypto-currencies have even recorded returns in excess of that number over a shorter horizon. Price gains have been driven by retail buyers who may or may not know much about this new asset class (Chart 1). Prior to the May 19 selloff, prices had grown overextended and recent concerns over the environment, sustainability, and governance (ESG) had shaken confidence in Bitcoin and its peers. Chinese authorities have already banned financial firms from providing crypto services in a bid to deter ownership of crypto-currencies. And China is not alone. The latest market jitters are a warning sign that government interference in the crypto-currency market is a real threat. Regulation and sovereign-issued digital currencies are starting to enter the fray. While ultra-dovish central bank policies are not changing soon, and therefore crypto-currency price bubbles can continue to grow, crypto-currencies will remain subject to extreme volatility and precipitous crashes. In this report we argue that the fundamental problem with crypto-currencies is that they threaten the economic sovereignty of nation-states. Environmental degradation, financial instability, and black market crime, and other concerns about cryptos have varying degrees of merit. But they provide governments with ample motivation to pursue a much deeper interest in regulating a technological innovation that has the power to undermine state influence over the economy and society. Government scrutiny is a legitimate reason for crypto buyers to turn sellers. Does The World Need Crypto-Currencies? Broadly speaking, there are two primary justifications for crypto-currencies, centered on a transactional basis: speed and privacy/anonymity. The crux of crypto-currency creation rests on these two use cases.3 The speed of crypto-currencies comes from their ability to increase efficiency in local and global payment systems by facilitating financial transactions without the need of a third party (e.g. a financial institution). Cross-border settlement of traditional (fiat) currency transactions processed through the standard SWIFT communications system takes up to two business days. Most transactions involving crypto-currencies over a blockchain network are realized in less than an hour, cross-border or not.4 The fees involved with third-party payments are often more expensive than transacting with crypto-currencies. Simply put, excluding the “middleman” can save money. This is a selling point in a global market that expects to see retail cross-border transactions reach $3.5 trillion by the end of 2021, of which up to 5% are associated with transaction-based fees.5 But this breakthrough in payment system technology can be overstated and is not the main reason for using crypto-currency. Speculation drives current use, especially given that there is speculative behavior even among those who believe that cryptos are safe-haven assets or promising long-term investments (Chart 2). Chart 2Crypto-Currency Use Driven By Speculation
Cryptocurrencies: They Can Run But They Can’t Hide
Cryptocurrencies: They Can Run But They Can’t Hide
Chart 3Consumers Growing Skeptical Of Banking Regulation
Cryptocurrencies: They Can Run But They Can’t Hide
Cryptocurrencies: They Can Run But They Can’t Hide
If a person wants to buy an item from a company in a distant country, that person could use a crypto-currency just as he or she could use a credit card. Both parties would have a secure medium of exchange but, unlike with a credit card, both would avoid using fiat currencies. Neither party could conduct the same transaction using gold or silver. The crucial premise is the existence of an online community of individuals and firms who for one reason or another want to avoid fiat currencies. From a descriptive point of view, the crypto-currency phenomenon implies a lack of trust in modern governments, or at least their monetary systems, and an assertion of individual property rights. The list of crypto-currencies continues to grow. To date, there are approximately 9,800 of them. Some are trying to prove their economic value or use, while others have been created with no intended purpose or problem to solve. Even so, there has yet to be a crypto-currency that overwhelms the use of slower fiat money. In a recent Special Report, BCA Research’s Foreign Exchange Strategist Chester Ntonifor showed that crypto-currencies still have a long way to go to have a chance at replacing fiat monies. While crypto-currencies are showing signs of significant improvement as mediums of exchange, they still fall short as stores of value and units of account. The other primary case for crypto-currencies is privacy or anonymity. The bypassing of intermediaries implies a greater control of funds by the two parties of a transaction. Crypto-currencies are said to be more “private” compared to fiat money. Fiat money is controlled by governments and banks while crypto-currencies have only “owners.” Crypto-currencies are anonymous because they are stored in digital wallets with alphanumeric sequences – there is a limited personal data trail that follows crypto-currency compared to those of electronic fiat currency transactions. In a post-9/11, post-GFC, post-COVID world where a sizable body of consumers is growing more skeptical of government surveillance and regulation and banking industry practices (Chart 3), crypto-currencies give users more than just a means to transact with. However, privacy is not the same as security. Hacking and fraud can affect cryptos as well as other forms of money and attacks will increase with the value of the currencies. Bitcoin At The Helm Of Crypto-Currency Market Chart 4Bitcoin Slows
Bitcoin Slows
Bitcoin Slows
Bitcoin has cemented its status as the number one currency in the crypto-verse.6 It is considered to be the first crypto-currency created, it is the most widely accepted, it is touted as a store of value or “digital gold,” and it is the most featured in quoting alternative crypto-currency pairs across crypto exchanges. As it stands, Bitcoin accounts for around 42% of total crypto-currency market capitalization.7 This share has declined from around 65% at the start of 2021 on the back of the frenzied rise of several alternative coins.8 But rising risks to Bitcoin’s standing will cause the entire crypto-market to retreat. In a Special Report penned in February, BCA Research’s Chief Global Strategist Peter Berezin argued that Bitcoin is more of a trend than a solution and that its usefulness is diminishing. Bitcoin’s transaction speed is slowing and its transaction cost is rising (Chart 4). Slowing speed and rising cost on the Bitcoin network are linked to a scalability problem. The crypto-currency’s network has a limited rate at which it can process transactions related to the fact that records (or “blocks”) in the Bitcoin blockchain are limited in size and frequency. This means that one of its fundamental justifications, transactional speed, will become less attractive over time, should the network not address these issues. Bitcoin also consumes a significant amount of energy, a controversy that is gaining traction in the crypto-currency market after Elon Musk, the “techno-king” of Tesla, cited environmental concerns in reversing his decision to accept Bitcoin payment for his company’s electric vehicles. Energy consumption rises as more coins are mined, since mining each new Bitcoin becomes more computer-power intensive. The need for computing power and energy will continue to increase until all 21 million Bitcoins (total supply) are mined, which is currently estimated to occur by the year 2140. Strikingly, the energy needed to mine Bitcoin over a year are comparable to a small country’s annual power consumption, such as Sweden or Argentina (Chart 5). Chart 5Bitcoin Consumes More Energy Than A Small Country …
Cryptocurrencies: They Can Run But They Can’t Hide
Cryptocurrencies: They Can Run But They Can’t Hide
Bitcoin also generates significant quantities of electronic waste (Chart 6). Chart 6… And Generates A Lot Of Electronic Waste
Cryptocurrencies: They Can Run But They Can’t Hide
Cryptocurrencies: They Can Run But They Can’t Hide
Bitcoin mining is heavily domiciled in China, which accounts for 65% of global mining activity (Figure 1). China’s energy mix is dominated by coal power, which makes up approximately 65% of the country’s total energy mix even after a decade of aggressive state-led efforts to reduce coal reliance. Of this, coal powered energy makes up approximately 60% of Bitcoin’s energy mix in China.9 With several countries aiming to minimize carbon emissions, and with approximately 60% of Bitcoin mining powered by coal-fired energy globally,10 Bitcoin imposes a major negative environmental impact. Figure 1Bitcoin Mining Well Anchored In Asia
Cryptocurrencies: They Can Run But They Can’t Hide
Cryptocurrencies: They Can Run But They Can’t Hide
Bitcoin does not shape up well when compared to gold’s energy intensity either. Bitcoin mining now consumes more energy than gold mining over a single year. While the energy difference is not large, the economic value is. Gold’s energy consumption to economic value trade-off is lower than that of Bitcoin. The production value of gold in 2020 was close to $200 billion, while Bitcoin was measured at less than $25 billion (Chart 7A). On a one-to-one basis, gold even has a lower carbon footprint than Bitcoin (Chart 7B). Chart 7AGold Outshines Bitcoin On Production Value And Carbon Footprint
Cryptocurrencies: They Can Run But They Can’t Hide
Cryptocurrencies: They Can Run But They Can’t Hide
Chart 7BGold Outshines Bitcoin On Production Value And Carbon Footprint
Cryptocurrencies: They Can Run But They Can’t Hide
Cryptocurrencies: They Can Run But They Can’t Hide
Crypto-currency energy consumption and carbon footprint will attract the attention of government regulators. Of course, not all crypto-currencies are heavy polluters. But if the supply of cryptos is constrained by mining difficulties then they will require a lot of energy. If the supply is not constrained then the price will be low. Government Regulation Is Coming Environmental concerns point to the single greatest threat to crypto-currencies – the Leviathan, i.e. the state. In this sense the crypto market’s wild fluctuations on May 19, at the mere whiff of tougher Chinese regulation, are a sign of what is to come. Governments around the world have so far left crypto-currencies largely unregulated but this laissez-faire attitude is already changing. Environmental regulation has already been mentioned. Governments will also be eager to expand their regulatory powers to “protect” consumers, businesses, and banks from extreme volatility in crypto markets. But investors will underrate the regulatory threat if they focus on these issues. At the most basic level, governments around the world will not sit idly by and lose what could become significant control of their monetary systems. The ability to establish and control legal tender is a critical part of economic sovereignty. Governments won control of the printing press over centuries and will not cede that control lightly. If crypto-currencies are adopted widely, then finance ministries and central banks will lose their ability to manipulate the money supply and the general level of prices effectively. Politicians will lose the ability to stimulate the economy or keep inflation in check. Most importantly, while one may view such threats as overblown, it is governments, not other organizations, that will make the critical judgment on whether crypto-currencies threaten their sovereignty. Throughout the world, most crypto-currency exchanges are regulated to prevent money laundering. Crypto-currencies are not legal tender and, aside from Bitcoin, their use is mostly banned in China (Table 1). However, more specialized regulation that targets energy and economic use has yet to be brought into law across the world. Table 1World Governments Will Not Relinquish Hard-Fought Monopolies Over Money Supply
Cryptocurrencies: They Can Run But They Can’t Hide
Cryptocurrencies: They Can Run But They Can’t Hide
In China, initial coin offerings (ICOs – the equivalent of an initial public offering on the stock market) and trading platforms are banned from engaging in exchanges between the yuan and crypto-currencies or tokens. In fact, China recognizes crypto-currencies only as virtual commodities or virtual property. India is another country where exchanges and ICOs are banned. While crypto-currencies are not banned, they are not legal tender. Indian policymakers have recently proposed banning crypto-currencies, however. The proposed legislation is one of the world’s strictest policies against crypto-currencies. It would criminalize possession, issuance, mining, trading, and transferring crypto-assets. If the ban becomes law, India would be the first major economy to make holding crypto-currency illegal. Even China, which has banned mining and trading, does not penalize possession. In the US, Secretary of the Treasury Janet Yellen has already expressed concerns regarding the illicit use of cryptos for supposed criminal gain.11 She is in alignment with European Central Bank President Christine Lagarde. Because of the anonymity of crypto-currencies, identifying users behind illicit transactions is difficult. This means regulators face headwinds in identifying transactions that are made for criminal gain, as compared to fiat transactions. Governments have long dealt with the anonymity of cash but they have ways of monitoring bank accounts and paper bills. Crypto-currencies are beyond their immediate sight of control and therefore will attract growing scrutiny and legislative action in this regard. The Colonial Pipeline ransomware attack on May 7, which temporarily shuttered about 45% of the fuel supply line for the eastern United States, illustrates the point. The DarkSide group of hackers who orchestrated the attack demanded a ransom payment of $4.4 million worth of Bitcoin, which Colonial Pipeline paid them on May 7. Shortly thereafter, unspecified “law enforcement agencies” clawed back the $4.4 million from the hackers’ account (transferring it to an unknown address) and DarkSide lost access to its payment server, DOS servers, and blog. This episode should not be underrated. It was a successful, large-scale cyber-attack on critical infrastructure in the world’s most powerful country. It highlighted the illicit uses to which crypto-currencies can be put. True, criminals demand ransoms in fiat money as well – and many crypto-currency operators will distance themselves from the criminal underworld. Nevertheless governments will give little slack to an emerging technology that presents big new law enforcement challenges and is not widely used by the general public. Ultimately governments will pursue their sovereign interests in controlling money, the economy, and trade, listening to their banking lobby, expanding their remit to “protect” consumers, and cracking down on illicit activity. Governments are not capable of abolishing crypto-currencies altogether, or the underlying technology of blockchain. But they will play a large and growing role in regulating them. Central Banks Advancing On Digital Currencies Central bank digital currencies (CBDCs) will leave crypto-currencies in the realm of speculative assets. CBDCs are a form of digital money denominated in a country’s national unit of account and represent a liability on a central bank’s balance sheet. This is different from current e-money that represents a claim on a private financial institution’s balance sheet. It is also different from crypto-currencies, because there is a central authority behind a CBDC, unlike with crypto-currencies due to their decentralized nature. In China, the People’s Bank of China (PBoC) has suggested its rollout of a digital yuan is “ready” despite no release to date. Beta testing is ongoing in several provinces. The PBoC’s justification for a digital yuan comes from China’s growing cashless economy. The transition away from cash is largely thanks to mobile payment platforms like Alibaba’s Alipay and Tencent’s WeChat Pay, which, between the two of them, control almost the entire mobile payments market of some 850 million users. There is a significant amount of systemic risk in this system – one reason why Chinese authorities have recently subjected these companies to new scrutiny and regulation. Should Alibaba or Tencent go bankrupt, the local payment system will crash. The PBoC’s efforts will increase competition in the local payments space and reduce this systemic risk. Policymakers are also concerned that as Chinese citizens choose to hold their money in digital wallets provided by Alibaba and Tencent instead of bank accounts, liquidity is being drained from the traditional banking system, putting deposit levels at banks under strain, and posing risks to liability matching. The digital yuan will still involve a third party, unlike crypto-currencies which do not. Doing away with commercial banks is not a reality – indeed the Chinese Communist Party seeks to buttress the state-owned commercial banks in order to maintain control of the economy. What the digital yuan does, and other CBDCs will do too, is utilize blockchain technology, which is faster and more secure than traditional payment networks. In the US, the Fed has been studying the viability of a CBDC US dollar. The Fed has stated that it is carefully exploring whether a CBDC will lead to “safer, less expensive, faster, or otherwise more efficient payments.” While the Fed has yet to find a single standout case for a CBDC US Dollar, Fed Chair Jerome Powell said last year that the US has a “competitive payments market” with “fast and cheap services, particularly in comparison to other nations exploring a CBDC.” To date, the Fed’s observation is that many of the challenges that CBDCs hope to address do not apply to the US, including disuse of physical cash, narrow reach or high concentration of banking, and weak infrastructure for payment systems. Rather, the Fed is more focused on developing the FedNow real-time payment system for private banks. This is much the same as in Europe, where physical cash still plays a major role in day-to-day economic activity and where local payment systems are fast and secure. But central banks around the world continue to engage in work centered around CBDCs (Charts 8A and 8B) – and China’s progress will encourage others to move faster. Advanced economies are mostly interested in creating a safer and more efficient payment system, while emerging and developed economies have interest across several areas such as financial stability, monetary policy setting, and inclusiveness of banking, as well as efficiency and safety (Chart 9). CBDCs are especially attractive to emerging market policy makers at targeting those who lack access to traditional banking. Chart 8ACentral Banks Advancing On CBDC Work
Cryptocurrencies: They Can Run But They Can’t Hide
Cryptocurrencies: They Can Run But They Can’t Hide
Chart 8BCentral Banks Advancing On CBDC Work
Cryptocurrencies: They Can Run But They Can’t Hide
Cryptocurrencies: They Can Run But They Can’t Hide
Chart 9Central Banks CBDC Interest Areas
Cryptocurrencies: They Can Run But They Can’t Hide
Cryptocurrencies: They Can Run But They Can’t Hide
In remote areas, access to banking is scarce and expensive. CBDCs can help solve this problem. Individuals would have CBDC accounts directly on a central bank ledger. They could then access their money and transact through a digital wallet application that is linked to the CBDC account. Giving people access to digital currency would allow them to transact quickly, in remote settings, without the need of hard currency. Monetary policy transmission is also better in advanced economies. In emerging markets, there are bottlenecks in local financial markets. Looser central monetary policy does not always translate into cheaper financing across the economy. In remote and poverty stricken areas, monetary policy transmission is sticky, meaning high costs of borrowing can persist even through accommodative policy cycles. This is a smaller issue in advanced economies. Payment systems in advanced economies are due an overhaul in security and efficiency, and CBDCs and blockchain technology will provide this. CBDCs will prove to be just as efficient to transact with as any crypto-currencies available today. CBDCs will also be legal tender and accepted by all vendors. The anonymity factor will be lost but this will not be a problem for most users (whereas legal issues will become a problem for crypto-currencies). The probability of central banks issuing CBDCs in both the short and medium term, both in the retail and wholesale space, is rising. If advanced economies like those of the G7 issue CBDCs soon, policy makers will undoubtedly ensure the use of it over the currently circulating and partially accepted crypto-currencies. The endgame will leave crypto-currencies in the highly speculative asset class, perhaps even in the black market where anonymity is valued for transactions that wish not to be tracked. Investment Takeaways Prices of crypto-currencies may continue to rise given sky-high fiat money creation amid the COVID pandemic and ultra-low interest rates. Digitalization is the natural next step in the evolution of money from precious metals to paper banknotes to electronic coin. But the market leader, Bitcoin, is encountering more headwinds. The primary case for the use of Bitcoin is challenged due to slowing transaction speeds and rising transaction costs. The virtual currency is primarily mined using coal-powered energy, resulting in growing scrutiny from governments and consumers. Government regulation is entering the ring and policymakers will take an increasingly heavy-handed role in trying to ensure that cryptos do not undermine economic sovereignty, financial stability, and law and order. When central banks begin to rollout digital currencies, especially those domiciled in advanced economies, crypto-currencies as medium of exchange will lose much of their allure. Crypto-currencies will remain as anti-fiat currencies and speculative assets. Risks To The View Given the controversy surrounding crypto-currencies, it is only fair to state outright the risks to our view. We would also recommend clients read our colleague Dhaval Joshi’s latest bullish take on Bitcoin. First, scaling up Bitcoin’s network and processing transactions in batches instead of single transactions will resolve transaction time and cost risks, restoring efficiency. This is a clear solution to efficiency concerns. However, scaling and batching transactions are not on the immediate horizon of Bitcoin developers. Bitcoin’s network will still need to undergo another “halving” in order for this risk to subside and for the network to scale. A halving of the network will only occur again in 2024.12 Second, on the environment: Bitcoin mining is not solely dependent on fossil fuel energy that gives it a “dirty” footprint. Renewables already make up some 25% of Bitcoin mining. Increasing the use of renewables in Bitcoin’s energy mix will help lower its environmental impact. However, this is easier said than done. Global renewable energy has yet to scale up to a point where it can consistently out-supply existing fossil-fuel energy. Mining hardware also has its associated carbon footprint that would need to be addressed. And location matters too. Crypto-currency mining farms are large-scale projects. Simply uprooting operations to a country that could lower the carbon footprint of a mining farm or two is not viable due to the costs involved. Hence crypto-currency mining will probably continue to be a “dirty” operation but a rapid shift to renewables would challenge our thesis. Bitcoin’s network is also based off a “proof of work” protocol. Miners must prove that a certain amount of computational effort has been expended for confirming blocks on the network, allowing transactions to be processed. Proof of work is energy intensive. Other crypto-currencies, like Ethereum, will adopt a “proof of stake” protocol. Simply put, transactions are confirmed by users and their stake in the associated crypto-currency. Proof of stake is less energy intensive compared to proof of work. Third, as to government regulation, the longer policymakers take to enact legislation targeting crypto-currencies, the larger their market will grow. Regulation in China and India may set a benchmark for major economies but not all will follow in the Asian giants’ footsteps. Some governments have been slow to study crypto-currencies, meaning legislation aimed at governing or regulating them may still be long in coming. Innovation is a good thing and free economies will not wish to restrain crypto-currencies or blockchain technology unduly, for fear of missing out. Fourth, on CBDCs, some central banks may only adopt them based on their respective economic needs. However, rising crypto-currency populism drives associated economic risks which can force the hands of central banks to adopt CBDCs in lieu of said needs. Each country faces unique challenges. Some central banks may not want to be left behind even if they believe their policy framework is facilitating economic activity efficiently. While the Fed has stated that it will not adopt a CBDC for the primary reason of ensuring payment security since it believes it already has a safe system in place, this view will change. The Fed could justify a move to a CBDC US dollar on the single basis of transitioning to a more sophisticated technology for the future. The Fed will not want to be caught behind the curve considering the PBoC is priming its digital yuan for release soon. Technological leadership is a strategic imperative of the United States and that imperative applies to financial technology as well as other areas. Guy Russell Research Analyst GuyR@bcaresearch.com Matt Gertken Vice President Geopolitical Strategy mattg@bcaresearch.com Footnotes 1 Muyao Shen, “China Reiterates Crypto Bans From 2013 and 2017”, coindesk, May 18, 2021, coindesk.com. 2 As of May 11, 2021. 3 There are several other reasons or “problems” that crypto-currencies are created for or to solve, but speed and privacy form the basis of crypto-currencies first coming into existence. 4 Not all crypto-currencies transact in less than an hour. But there are many that transact in several minutes and in some cases, mere seconds. As the leading crypto-currency, Bitcoin takes approximately one hour for a transaction to be fully verified over its network. 5 “McKinsey’s Global Banking Annual Review”, McKinsey, Dec. 9, 2020, mckinsey.com. 6 We use Bitcoin as an example to understand the risk and impact of forthcoming government regulation and competition. Because of Bitcoin’s status, any significant risks that threaten the crypto-currency’s standing as the number one currency will threaten the entire market. 7 As of May 20, 2021. Figure varies daily. See www.coinmarketcap.com for more information. 8 Alternative currencies such as Ethereum, Ripple, Binance Coin, Dogecoin, and Cardano have chipped away at Bitcoin’s crypto-market dominance through 2021. 9 According to The Center For Alternative Finance, The University Of Cambridge. 10 According to The Center For Alternative Finance, The University Of Cambridge. 11 Data on the use of crypto-currencies for illicit activitiessays otherwise. Of all crypto-currency transactions, it is estimated that only 2.1% are used for illicit activities. See “2021 Crypto Crime Report”, Chainalysis, chainalysis.com. 12 A Bitcoin halving is when the reward for mining Bitcoin transactions is cut in half. This event also cuts Bitcoin's inflation rate and the rate at which new Bitcoins enter circulation, in half. Bitcoin last halved on May 11, 2020.
Highlights Global oil markets will remain balanced this year with OPEC 2.0's production-management strategy geared toward maintaining the level of supply just below demand. This will keep inventories on a downward trajectory, despite short-term upticks due to COVID-19-induced demand hits in EM economies and marginal supply additions from Iran and Libya over the near term. Our 2021 oil demand growth is lower – ~ 5.3mm b/d y/y, down ~ 800k from last month's estimate – given persistent weakness in realized consumption. We have lifted our demand expectation for 2022 and 2023, however, expecting wider global vaccine distribution and increased travel toward year-end. The next few months are critical for OPEC 2.0: The trajectory for EM demand recovery will remain uncertain until vaccines are more widely distributed, and supply from Iran and Libya likely will increase this year. This will lead to a slight bump in inventories this year, incentivizing KSA and Russia to maintain the status quo on the supply side. We are raising our 2021 Brent forecast back to $63/bbl from $60/bbl, and lifting our 2022 and 2023 forecasts to $75 and $78/bbl, respectively, given our expectation for a wider global recovery (Chart of the Week). Feature A number of evolving fundamental factors on both sides of the oil market – i.e., lingering uncertainty over the return of Iranian and Libyan exports and the strength of the global demand recovery – will test what we believe to be OPEC 2.0's production-management strategy in the next few months. Briefly, our maintained hypothesis views OPEC 2.0 as the dominant supplier in the global oil market. This is due to the low-cost production of its core members (i.e., those states able to attract capital and grow production), and its overwhelming advantage in spare capacity, which we reckon will average in excess of 7mm b/d this year, owing to the massive production cuts undertaken to drain inventories during the COVID-19 pandemic. Formidable storage assets globally – positioned in or near refining centers – and well-developed transportation infrastructures also support this position. We estimate core OPEC 2.0 production will average 26.58mm b/d this year and 29.43mm b/d in 2022 (Chart 2). Chart of the WeekBrent Prices Likely Correct Then Move Higher in 2022-23
Brent Prices Likely Correct Then Move Higher in 2022-23
Brent Prices Likely Correct Then Move Higher in 2022-23
Chart 2OPEC 2.0 Will Maintain Status Quo
OPEC 2.0 Will Maintain Status Quo
OPEC 2.0 Will Maintain Status Quo
The putative leaders of the OPEC 2.0 coalition – the Kingdom of Saudi Arabia (KSA) and Russia – have distinctly different goals. KSA's preference is for higher prices – ~ $70-$75/bbl (basis Brent) to the end of 2022. Higher prices are needed to fund the Kingdom's diversification away from oil. Russia's goal is to keep prices closer to the marginal cost of the US shale-oil producers, who we characterize as the exemplar of the price-taking cohort outside OPEC 2.0, which produces whatever the market allows. This range is ~ $50-$55/bbl. The sweet spot that accommodates these divergent goals is on either side of $65/bbl for this year. OPEC 2.0 June 1 Meeting Will Maintain Status Quo With Brent trading close to $70/bbl, discussions in the run-up to OPEC 2.0's June 1 meeting likely are focused on the necessity to increase the 2.1mm b/d being returned to the market over the May-July period. At present, we do not believe this will be necessary: Iran likely will be returning to the market beginning in 3Q21, and will top up its production from ~ 2.4mm b/d in April to ~ 3.85mm b/d by year-end, in our estimation. Any volumes returned to the market by core OPEC 2.0 in excess of what's already been agreed going into the June 1 meeting likely will come out of storage on an as-needed basis. Libya will likely lift its current production of ~ 1.3mm b/d close to 1.5mm b/d by year end as well. We are expecting the price-taking cohort ex-OPEC 2.0 to increase production from 53.78mm b/d in April to 53.86mm b/d in December, led by a 860k b/d increase in US output, which will take average Lower 48 output in the US (ex-GOM) to 9.15mm b/d by the end of this year (Chart 3). When we model shale output, our expectation is driven by the level of prompt WTI prices and the shape of the forward curve. The backwardation in the WTI forward curve will limit hedged revenues at the margin, which will limit the volume growth of the marginal producer. We expect global production to slowly increase next year, and the year after that, with supply averaging 101.07mm b/d in 2022 and 103mm b/d in 2023. Chart 3US Crude Output Recovers, Then Tapers in 2023
US Crude Output Recovers, Then Tapers in 2023
US Crude Output Recovers, Then Tapers in 2023
Demand Should Lift, But Uncertainties Persist We expect the slowdown in realized DM demand to reverse in 2H21, and for oil demand to continue to recover in 2H21 as the US and EU re-open and travel picks up. This can be seen in our expectation for DM demand, which we proxy with OECD oil consumption (Chart 4). EM demand – proxied by non-OECD oil consumption – is expected to revive over 2022-23 as vaccine distribution globally picks up. As a result, demand growth shifts to EM, while DM levels off. China's refinery throughput in April came within 100k b/d of the record 14.2mm b/d posted in November 2020 (Chart 5). The marginal draw in April stockpiles could also signify that as crude prices have risen higher, the world’s largest oil importer may have hit the brakes on bringing oil in. In the chart, oil stored or drawn is calculated as the difference between what is imported and produced with what is processed in refineries. With refinery maintenance in high gear until the end of this month, we expect product-stock draws to remain strong on the back of domestic and export demand. This will draw inventories while maintenance continues. Chart 4EM Demand Will Recovery Accelerates in 2022-23
EM Demand Will Recovery Accelerates in 2022-23
EM Demand Will Recovery Accelerates in 2022-23
Chart 8China Refinery Runs Remain Strong
China Refinery Runs Remain Strong
China Refinery Runs Remain Strong
COVID-19-induced demand destruction remains a persistent risk, particularly in India, Brazil and Japan. This is visible in the continued shortfall in realized demand vs our expectation so far this year. We lowered our 2021 oil demand growth estimate to ~ 5.3mm b/d y/y, which is down ~ 800k from last month's estimate, given persistent weakness in realized consumption. Our demand forecast for 2022 and 2023 is higher, however, based on our expectation for stronger GDP growth in EM economies, following the DM's outperformance this year, on the back of wider global vaccine distribution year-end (Table 1). Table 1BCA Global Oil Supply - Demand Balances (MMb/d, Base Case Balances)
OPEC 2.0's Production Strategy In Focus
OPEC 2.0's Production Strategy In Focus
Our supply-demand estimates continue to point to a balanced market this year and into 2022-23 (Chart 6). Given our expectation OPEC 2.0's production-management strategy will remain effective, we expect inventories to continue to draw (Chart 7). Chart 6Markets Remained Balanced
Markets Remained Balanced
Markets Remained Balanced
Chart 7Inventories Continue To Draw
Inventories Continue To Draw
Inventories Continue To Draw
CAPEX Cuts Bite In 2023 In 2023, we are expecting Brent to end the year closer to $80/bbl than not, which will put prices outside the current range we believe OPEC 2.0 is managing its production around (Chart 8). We have noted in the past continued weakness in capex over the 2015-2022 period threatens to leave the global market exposed to higher prices (Chart 9). Over time, a reluctance to invest in oil and gas exploration and production prices in 2024 and beyond could begin to take off as demand – which does not have to grow more than 1% p.a. – continues to expand and supply remains flat or declines. Chart 8By 2023 Brent Trades to /bbl
By 2023 Brent Trades to $80/bbl
By 2023 Brent Trades to $80/bbl
Chart 9Low Capex Likely Results In Higher Prices After 2023
OPEC 2.0's Production Strategy In Focus
OPEC 2.0's Production Strategy In Focus
Bottom Line: We are raising our 2021 forecast back to an average of $63/bbl, and our forecasts for 2022 and 2023 to $75 and $78/bbl. We expect DM demand to lead the recovery this year, and for EM to take over next year, and resume its role as the growth engine for oil demand. Longer term, parsimonious capex allocations likely result in tighter supply meeting slowly growing demand. At present, markets appear to be placing a large bet on the buildout of renewable electricity generation and electric vehicles (EVs). If this does not occur along the trajectory of rapid expansion apparently being priced by markets – i.e., the demand for oil continues to expand, however slowly – oil prices likely would push through $80/bbl in 2024 and beyond. Robert P. Ryan Chief Commodity & Energy Strategist rryan@bcaresearch.com Ashwin Shyam Research Associate Commodity & Energy Strategy ashwin.shyam@bcaresearch.com Commodities Round-Up Energy: Bullish The Colonial Pipeline outage pushed average retail gasoline prices in the US to $3.03/gal earlier this week, according to the EIA. This was the highest level for regular-grade gasoline in the US since 27 October 2014. According to reuters.com, the cyberattack that shut down the 5,500-mile pipeline was the most disruptive on record, shutting down thousands of retail service stations in the US southeast. Millions of barrels of refined products – gasoline, diesel and jet fuel – were unable to flow between the US Gulf and the NY Harbor because of the attack, which was launched 7 May 2021 (Chart 10). While most of the system is up and running, problems with the pipeline's scheduling system earlier this week prevented a return to full operation. Base Metals: Bullish Spot copper prices remained on either side of $4.55/lb (~ $10,000/MT) by mid-week following a dip from the $4.80/lb level (Chart 11). We remain bullish copper, particularly as political risk in Chile rises going into a constitutional convention. According to press reports, the country's constitution will be re-written, a process that likely will pave the way for higher taxes and royalties on copper producers.1 In addition, unions in BHP mines rejected a proposed labor agreement, with close to 100% of members voting to strike. In Peru, a socialist presidential candidate is campaigning on a platform to raise taxes and royalties. Precious Metals: Bullish According to the World Platinum Investment Council, platinum is expected to run a deficit for the third consecutive year in 2021, which will amount to 158k oz, on the back of strong demand. Refined production is projected to increase this year, with South Africa driving this growth as mines return to full operational capacity after COVID-19 related shutdowns. Automotive demand is leading the charge in higher metal consumption, as car makers switch out more expensive palladium for platinum to make autocatalysts in internal-combustion vehicles. Ags/Softs: Neutral Corn prices continued to be better-offered following last week's WASDE report, which contained the department's first look at the 2021-22 crop year. Corn production is expected to be up close to 6% over the 2020-21 crop year, at just under 15 billion bushels. On the week, corn prices are down ~ 15.3%. Chart 10
RBOB Gasoline at a High
RBOB Gasoline at a High
Chart 11
Political Risk in Chile and Peru Could Bolster Copper Prices
Political Risk in Chile and Peru Could Bolster Copper Prices
Footnotes 1 Please see Copper price rises as Chile fuels long-term supply concerns published 18 May 2021 by mining.com. Investment Views and Themes Strategic Recommendations Tactical Trades Commodity Prices and Plays Reference Table Trades Closed in 2021 Summary of Closed Trades
Higher Inflation On The Way
Higher Inflation On The Way
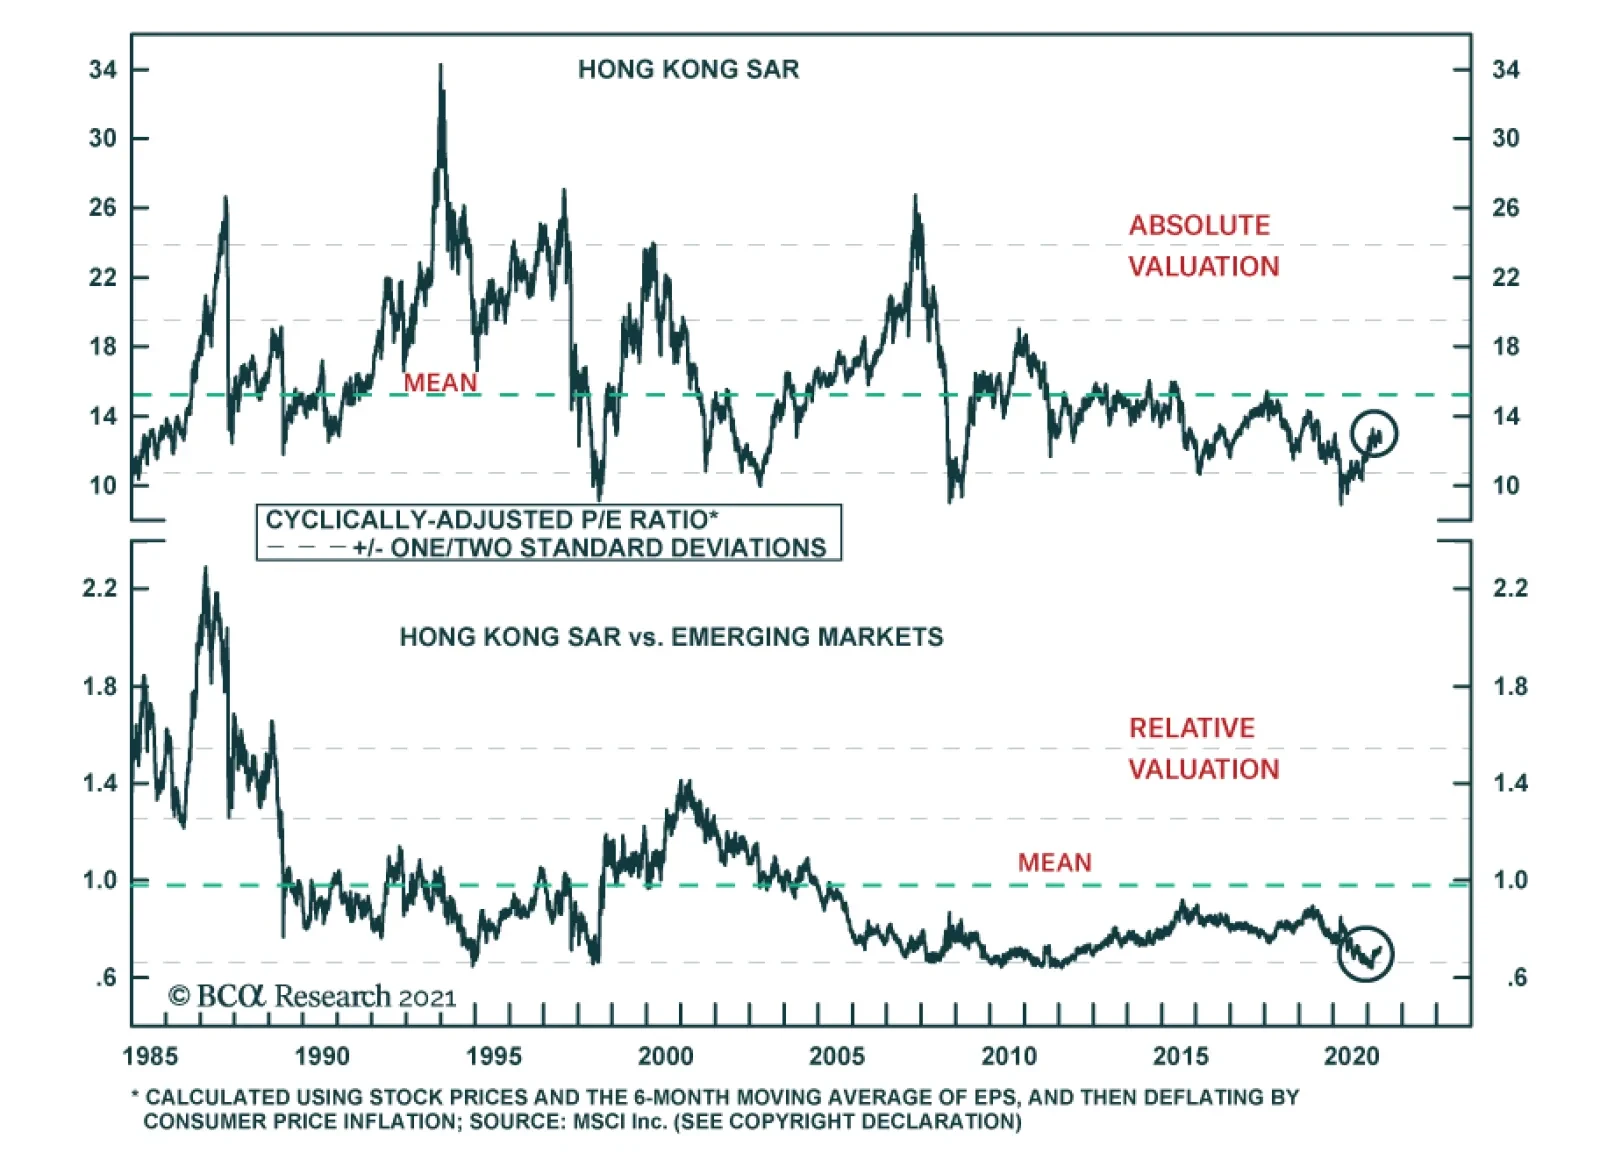
BCA Research’s Emerging Markets Strategy service recommends investors upgrade their allocation to the MSCI Hong Kong (Special Administrative Region) equity index from underweight to neutral within Asian, global and EM equity portfolios. Even though a…
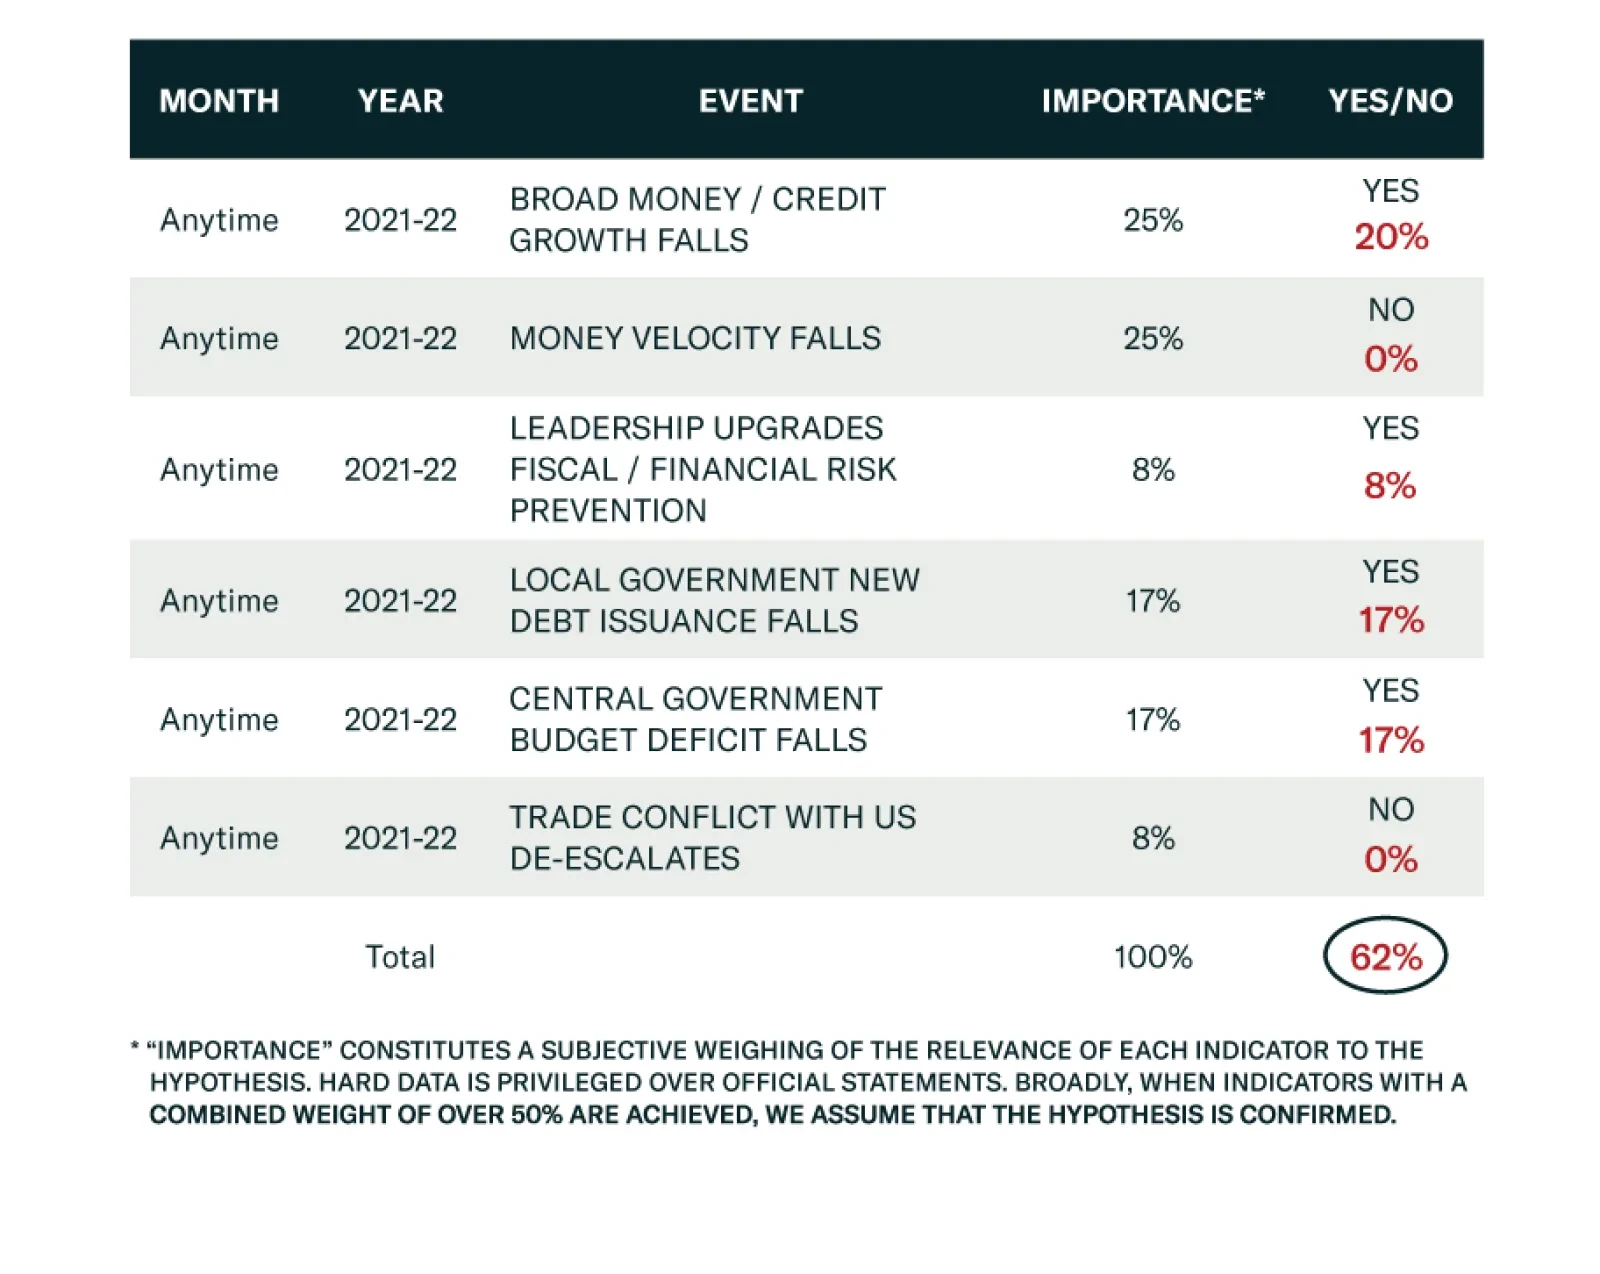
BCA Research’s Geopolitical Strategy service believes that global equities, commodities, and “China plays” are at risk of a substantial correction as a result of China’s policy tightening. China’s troubles stem from the ongoing change of its economic model…
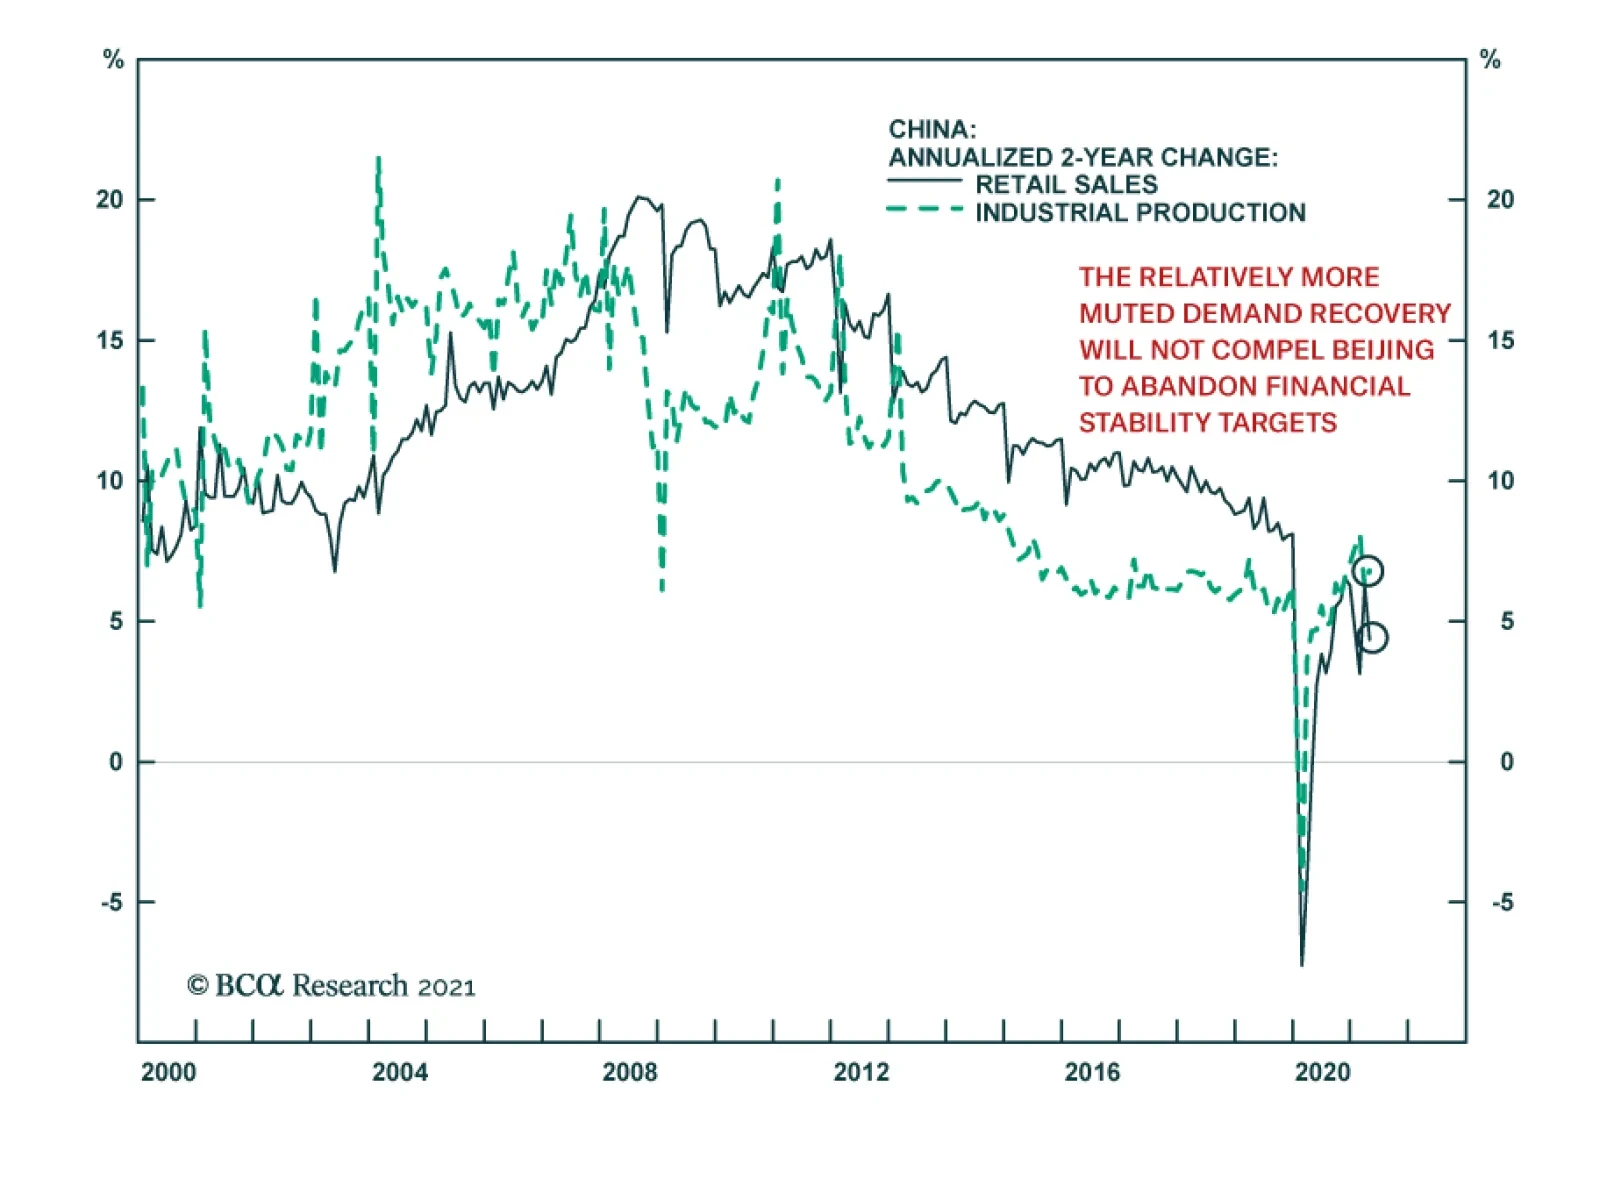
Investment and retail sales data confirm that consumer demand remains the weakest link in China’s economic recovery. While the data generally surprised to the downside, the disappointment was most pronounced in retail sales, which decelerated to 17.7% y/y…
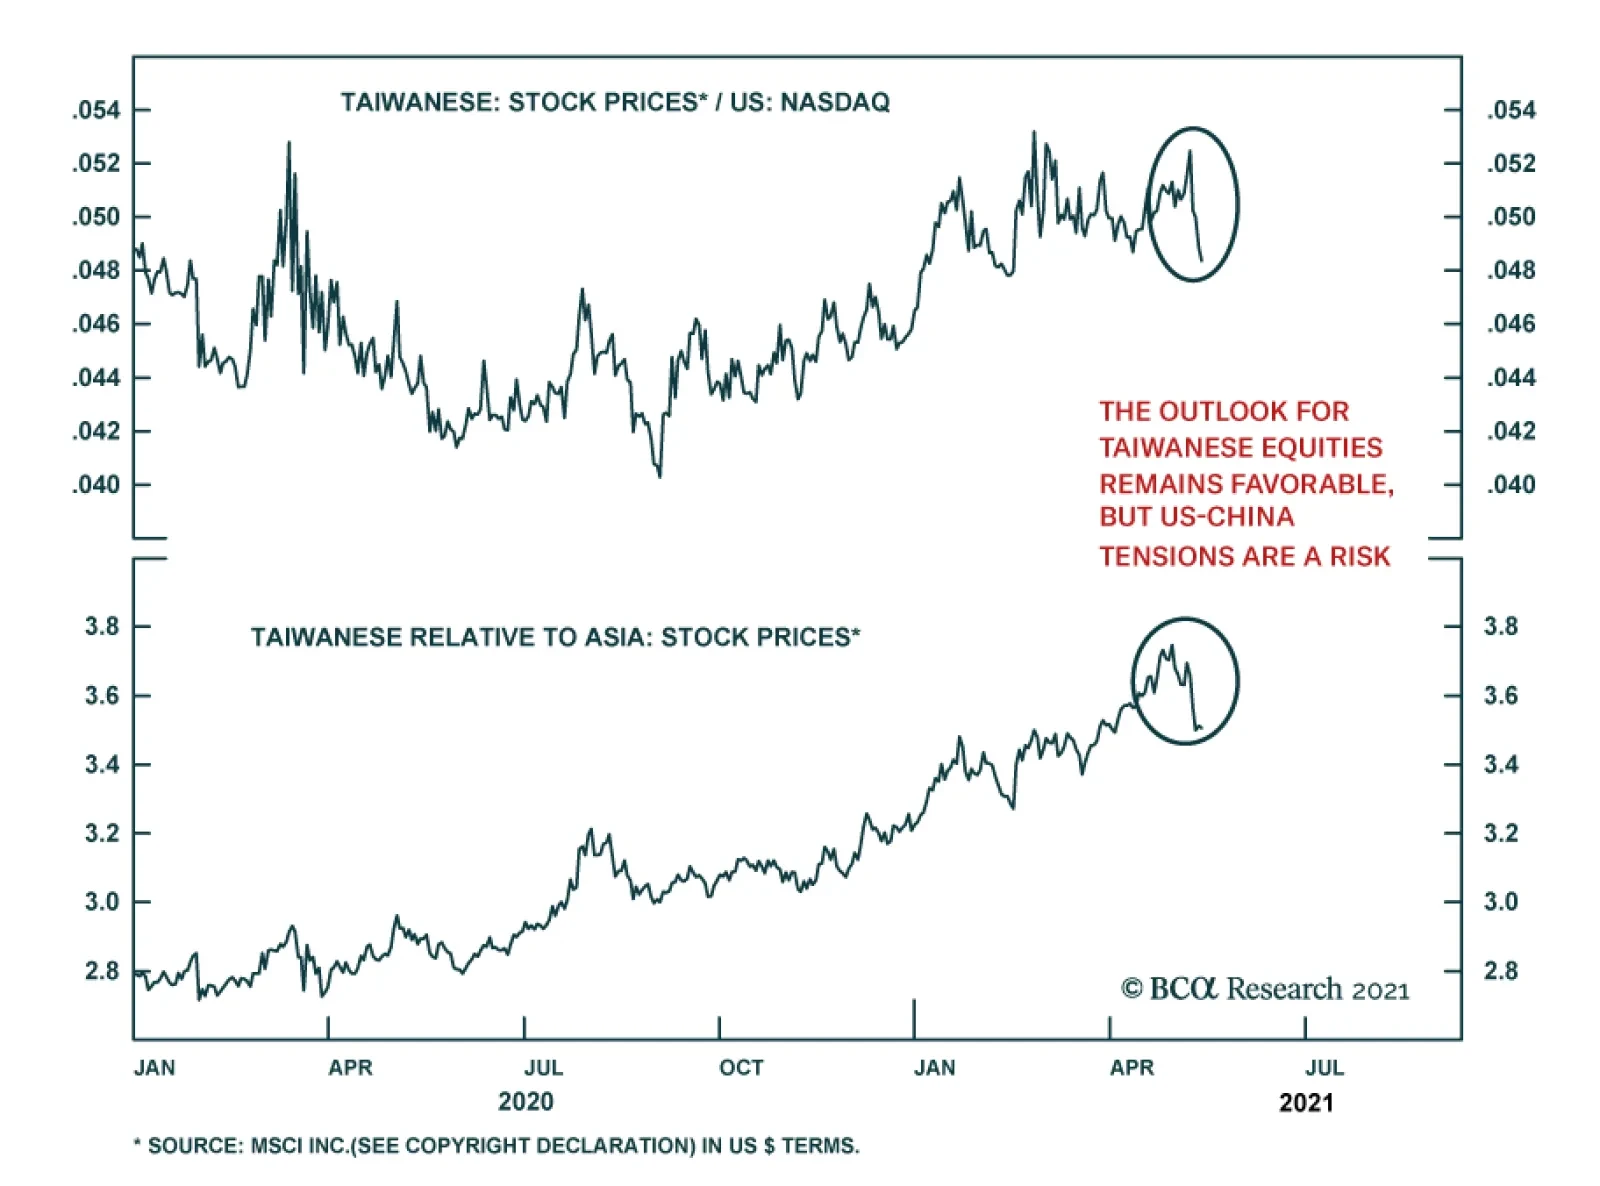
After rallying more than 100% since mid-March 2020, Taiwanese equities peaked at the end of April, and are down 11% since then – bringing the index into correction territory. Last week’s global tech selloff as well as a spike in domestic COVID-19…
Highlights Global currencies are at a critical level versus the dollar. From a positioning standpoint today, a break below 89-90 on the DXY index will be extremely bearish, while a bounce from current levels should be capped in the 3-4% range. Two key factors have pushed the dollar down: lower real rates in the US and recovering economic momentum outside the US. There could be some seasonal strength in the dollar as equity markets churn in May. However, this will provide an opportunity for fresh short positions. The Federal Reserve will maintain its resolve to view the current inflation overshoot as transitory, while it will still focus on the labor market. This will keep real rates in the US depressed relative to other countries. New trade idea: Go long CHF/NZD as a play on rising currency volatility. Also sell USD/JPY if it touches 110. Feature Chart I-1The Dollar Is At A Critical Juncture
The Dollar Is At A Critical Juncture
The Dollar Is At A Critical Juncture
After a brief rally from January to March, the dollar is once again on the verge of a technical breakdown. Both the DXY index, the Federal Reserve trade-weighted dollar and EM currency benchmarks are sitting at critical levels (Chart I-1). A breakdown will confirm that the dollar bear market that began in March 2020 remains intact. It will also trigger a flurry of speculative outflows from the dollar. In our December FX outlook,1 our view was that the DXY was headed towards 80 on a cyclical (12-18- month horizon). However, we also predicted the DXY index would hit 94-95 in the first quarter, a view we have reinforced multiple times since then. With the DXY index having peaked at 93.5, it is now instructive to explore the most likely next move. To do this, we will revisit what has changed and what has remained the same since our December piece. Gauging Investor Positioning Chart I-2Dollar Bulls Are Capitulating
Dollar Bulls Are Capitulating
Dollar Bulls Are Capitulating
Going into 2021, selling the dollar was a consensus trade and the currency was very much oversold. For contrarians, it paid to be bullish (Chart I-2). Since then, investors have closed their short positions on the dollar, shifting their focus to JPY- and CHF-funded carry trades. Speculators are still long the euro, but the magnitude of this bet has declined from a net 30% of open interest to around 10% today. Positioning in GBP and CAD are still elevated, which suggests that these currencies remain vulnerable to a technical pullback. Interestingly, the Citigroup sentiment indicator for the USD is close to its January nadir. From the vantage point of this gauge, there has been an accumulation of dollar short positions in recent weeks. This helps explain recent dollar weakness. Going forward, positioning will not be particularly useful in dictating the next move in the dollar since it only works well at extremes. Even then, it is only useful for gauging countertrend moves. For much of the early 2000s, sentiment on the dollar was bearish yet rallies were capped at 4-6%. During last decade’s dollar bull market, sentiment remained mostly in bullish territory, but the dollar achieved escape velocity (Chart I-3). Chart I-3The Dollar And Regime Shifts
The Dollar And Regime Shifts
The Dollar And Regime Shifts
From today’s positioning standpoint, a break below 89-90 on the DXY index will be an extremely bearish sign, while a bounce from current levels should be capped in the 3-4% range. This puts the greenback at a critical crossroad in technical terms. The Federal Reserve, Inflation And Interest Rates At the start of 2021, interest rates were moving in favor of the dollar, which continued a trend that has been in place since the middle of last year. The gap between the US and German 10-year yields rose from a low of around 100 basis points last year to a high of over 200 basis points in March. More recently, interest rate differentials have started to move against the dollar, explaining the broad reversal in dollar indices since March. The US-German 10-year spread now sits at 180 basis points. Exchange rates tend to reflect real interest rate differentials, since inflation erodes the purchasing power of a currency. As such, it is important to gauge not only what is happening to nominal rates, but also to underlying inflation trends. This complicates matters because inflation is often a lagging variable, so getting a sense of where inflation is headed can be greatly useful for currency strategy. As a starting point, the US does not rank well when it comes to real interest rates. Chart I-4 shows the broad correlation between real interest rates and the dollar. For low interest rate countries such as Switzerland, Sweden and the euro area, the peak in US real rates also coincided with a cyclical rebound in these currencies. Even for a currency such as the Japanese yen, real rates are favorable compared to the US. Nominal 10-year rates are 10bps and inflation swaps at the 10-year tenor are 23bps. This pins Japanese real rates almost 100bps above rates in the US. Chart I-4AInterest Rates Have Moved Against The Dollar
Interest Rates Have Moved Against The Dollar
Interest Rates Have Moved Against The Dollar
Chart I-4BInterest Rates Have Moved Against The Dollar
Interest Rates Have Moved Against The Dollar
Interest Rates Have Moved Against The Dollar
Chart I-4CInterest Rates Have Moved Against The Dollar
Interest Rates Have Moved Against The Dollar
Interest Rates Have Moved Against The Dollar
Of course, with inflation surprising to the upside in the US, the Fed could taper sooner than they have communicated and/or raise interest rates faster than the market expects. This will not be surprising given other central banks such as the Bank of Canada and the Bank of England have already telegraphed reduced asset purchases. However, even if the Fed does decide to taper its asset purchases, the impact on the dollar will not be as straightforward as some market participants expect. To understand why, consider Chart I-5, which shows that relative to other central banks, the Fed’s balance sheet impulse is already shrinking by approximately 13% of GDP. In essence, the Fed has already been "stealthily" tapering asset purchases compared to other G10 central banks. This action supported the dollar this year. It has also pushed market pricing of the Fed funds rate well above the median dots of the FOMC in 2 years (Chart I-6). Thus the prospect of the Fed tapering asset purchases might already be embedded in the price of assets. Chart I-5Stealth Tapering By The Fed?
Stealth Tapering By The Fed?
Stealth Tapering By The Fed?
Chart I-6Markets Have Already Priced A Hawkish Fed
Markets Have Already Priced A Hawkish Fed
Markets Have Already Priced A Hawkish Fed
Going forward, our Global Fixed Income colleagues have noted that the Fed is already moving down the ladder in terms of who is expected to taper next.2 The Bank of Japan and the European Central Bank have barely tapered their asset purchases. They might not announce anything significant in their June 10 and June 18 meetings respectively, but markets will still be squarely focused on any change in language. Chart I-7A Profligate US Government Has Historically Been Dollar Bearish
A Profligate US Government Has Historically Been Dollar Bearish
A Profligate US Government Has Historically Been Dollar Bearish
If investors decide to take the Fed’s messaging at face value, which suggests that the FOMC will look through any upside surprises in inflation, then real rates will remain depressed in the US—which will pressure the dollar lower. We have little conviction about whether US inflation is transient or more permanent. However, we do know that the US economy is more inflationary than most other developed markets because the US is stimulating domestic demand by much more than is required to close the output gap. Historically, this is a bearish development for the US dollar (Chart I-7). Economic Momentum As A Catalyst To the extent that monetary policy is tailored to suit domestic economic conditions, growth momentum is clearly rotating from the US to other countries. This suggests that the case for other central banks, such as the ECB or the RBA, to follow the steps of the BoE or BoC is rising at the margin. Manufacturing PMIs around the world have overtaken US levels, and it is only a matter of time before the services PMIs catchup. Chart I-8 shows that euro area data continues to surprise to the upside, with the economic surprise index between the euro area and the US at a decade high. This has historically been synonymous with modestly higher Eurozone bond yields relative to the US, which has also provided some support for the currency. The expectations component of both the ZEW and the Sentix surveys came out stronger this month, which confirms that both European and German growth should remain healthy over the summer (Chart I-9). Chart I-8Small Window For European Yields To Rise
Small Window For European Yields To Rise
Small Window For European Yields To Rise
Chart I-9Euro Area Data To Stay Strong
Euro Area Data To Stay Strong
Euro Area Data To Stay Strong
As for the slowdown in Chinese stimulus, we agree it is a risk to global growth as our China Strategists highlight, but two opposing factors are also at play: Chinese stimulus leads the economy by a long lag. Last cycle, the apex of Chinese credit was in 2016, but it took until 2018 for global trade to slow down (Chart I-10). This partly explains why commodity prices have not relapsed, despite slowing credit creation from their largest buyer. An economy cannot rely on credit formation alone. At some point, the baton has to be passed to the forces of animal spirits. The velocity of money, or how many units of GDP are created for every unit of money creation, is one of these forces. Chart I-11 shows that the velocity of money has been rising faster outside the US, led by China. Chart I-10Chinese Credit Impulse Works With A Lag
Chinese Credit Impulse Works With A Lag
Chinese Credit Impulse Works With A Lag
Chart I-11Money Velocity Versus The US
Money Velocity Versus The US
Money Velocity Versus The US
The above trends give us conviction that any strength in the dollar is a countertrend move that should be faded until the Federal Reserve does a volte face and tightens monetary policy faster than they have telegraphed. A period of weak global growth would constitute another risk to our view. Interestingly, the Chinese RMB has hit new cyclical lows, despite a narrowing of interest rate differentials between the US and China. We suggested in our February Special Report that USD/CNY was headed for 6.2, even if interest rate differentials between the US and China narrowed. If Chinese economic activity is able to stay relatively robust despite slowing credit formation, then USD/CNY will decline further. Chart I-12EM Growth Remains Weak
EM Growth Remains Weak
EM Growth Remains Weak
A break lower in USD/CNY is a necessary but not a sufficient condition for EM currencies to outperform. Relative to the US, EM growth remains worse than at the depths of the COVID-19 recession last year (Chart I-12). Our Emerging Market Strategists reckon a change in economic conditions will be necessary for EM currencies to outperform on a sustained basis. A broadening of the vaccination campaign toward EM countries is likely to hold the key to this change. The Real Risk To Dollar Short Positions The risk from shorting the dollar at current levels comes from the equity market. Developed market currencies have run ahead of the relative performance of their domestic bourses. This is a departure from historical correlations (Chart I-13). A reset in equity markets that favors defensive equities will lead to inflows into the US equity and bond markets, which will hurt DM currencies and buffet the dollar. It is worrisome that this earnings season, the US enjoyed stronger positive earnings revisions. Correspondingly, the US put/call ratio remains very depressed, with complacency reigning across most equity bourses (Chart I-14). Chart I-13ACurrencies Have Ran Ahead Of Equity Outperformance
Currencies Have Ran Ahead Of Equity Outperformance
Currencies Have Ran Ahead Of Equity Outperformance
Chart I-13BCurrencies Have Ran Ahead Of Equity Outperformance
Currencies Have Ran Ahead Of Equity Outperformance
Currencies Have Ran Ahead Of Equity Outperformance
Chart I-14Lots Of Exuberance In US Stocks
Lots Of Exuberance In US Stocks
Lots Of Exuberance In US Stocks
Chart I-15Equities And The Dollar Have Diverged
Equities And The Dollar Have Diverged
Equities And The Dollar Have Diverged
The nature of a potential market reset is important to consider. For example: Global equities correct, but technology and healthcare lead the drop. In this scenario, the dollar underperforms, as is happening now (Chart I-15) because the US has a heavy weighting in these defensive sectors. The reverse will happen if value stocks or cyclicals lead the drop in global equities. Global equities correct, but bond yields drop as well. The initial reaction will be a stronger dollar as US inflows accelerate, but this will also curb the appeal of the US dollar since Treasury yields will converge towards those of Bunds or JGBs. Moreover, US real rates will collapse even further. We will be sellers of the dollar on strength in this scenario. Global equities correct as yields increase. If US yields lead this rise, the dollar will rally at first, but outflows from the US equity market will also accelerate. If this rotation is durable, the dollar will eventually depreciate, because foreign bourses are highly levered to rising yields. In a nutshell, the US bond market offers attractive yields and the US stock market could behave defensively (as has historically been the case) in a market correction. This creates a risk to shorting the dollar today. Currency Strategy Currency markets are at a critical juncture (Chart I-1) where either a breakdown in the dollar or a countertrend reversal is imminent. Our strategy remains the same it has been so far in 2021. Continue to short the USD against a basket of the most attractive currencies. On this basis, we are already long the Scandinavian currencies. Go short USD/JPY given lopsided positioning. We are placing a limit sell on USD/JPY today at 110. We are also raising our limit buy on the euro to 1.18. It is interesting that the EUR/JPY cross broke out from a multi-year downtrend. This cross has an inverse correlation with the dollar. Buy CHF/NZD today as a play on rising currency volatility. This is a good bet as markets grapple with the next central bank taper policy (Fed versus other DM economies) (Chart I-16). Wait for the equity market correction to play out, after which a green light to short the dollar outright will once again emerge. Historically, May is a good month for the dollar and a volatile one for equities (Chart I-17). That said, dollar bear markets often run in long cycles. Chart I-16Buy CHF/NZD As Insurance
Buy CHF/NZD As Insurance
Buy CHF/NZD As Insurance
Chart I-17The Dollar And Seasonality
The Dollar And Seasonality
The Dollar And Seasonality
Chester Ntonifor Foreign Exchange Strategist chestern@bcaresearch.com Footnotes 1 Please see Foreign Exchange Strategy Special Report, "2021 Key Views: Tradeable Themes," dated December 4, 2020. 2Please see Global Fixed Income Strategy Special Report, "Who Tapers Next?," dated December 04, 2020. Currencies US Dollar Chart II-1USD Technicals 1
USD Technicals 1
USD Technicals 1
Chart II-2USD Technicals 2
USD Technicals 2
USD Technicals 2
The recent data out of the US have been mixed: Average hourly earnings improved by 0.7% in April versus March, beating the expected 0.1% increase. Non-farm payrolls increased by 266K in April, far below the expected 978K and 770K in March. The unemployment rate worsened slightly from 6% in March to 6.1% in April, versus an expected improvement to 5.8%. The NFIB Small Business Optimism survey edged higher to 99.8 in April from 98.2 the prior month. CPI came in at 4.2% year on year in April, outpacing expectations of a 3.6% rise. Month on month, CPI grew by 0.8% in April, crushing the 0.2% consensus. Core CPI came in at 3% year on year in April, beating the expected 2.3%. PPI also surprised to the upside, clocking in at 6.2% year on year in April, versus an expected rise of 5.8%. The US dollar DXY index dropped by 1.3% this week. While CPI surged ahead, employment severely lagged expectations. The Fed’s “maximum employment” target, a gateway to any asset purchase tapering, is unlikely to be reached when the market expects it. This combination of persistent Fed dovishness and potential sizable inflation is bearish for the dollar. Report Links: Arbitrating Between Dollar Bulls And Bears - March 19, 2021 The Dollar Bull Case Will Soon Fade - March 5, 2021 Are Rising Bond Yields Bullish For The Dollar? - February 19, 2021 The Euro Chart II-3EUR Technicals 1
EUR Technicals 1
EUR Technicals 1
Chart II-4EUR Technicals 2
EUR Technicals 2
EUR Technicals 2
Recent data from the euro area have been strong: March German imports strengthened by 6.5% month on month, crushing the expected 0.7%. German ZEW current condition registered at -40.1 in May, far ahead of the -48.8 in April. German ZEW economic sentiment also surprised to the upside in May at 84.4 versus the anticipated 72. For the entire euro area, the ZEW economic sentiment increased to 84 in May from 66 in April. Sentix investor confidence improved to 21 in May from 13.1 in April, beating the expected 14. Sentix investor expectations climbed to an all-time high of 36.8. The current situation crossed into positive territory for the first time since February 2020. March industrial production was up by 0.1% month on month, lower than the expected 0.7%. The euro strengthened by 1.3% this week against the USD. The uplifting ZEW survey results reinforce our expectation of a global growth rotation in favor of the euro area. While the ECB may not taper asset purchases, a forceful vaccination campaign should lead to further upside data surprises, especially in services. The Euro Area Economic Surprise Index (ESI) remains elevated in contrast with the US ESI, which has declined sharply from its July 2020 peak. Report Links: Relative Growth, The Euro, And The Loonie - April 16, 2021 Portfolio And Model Review - February 5, 2021 On Japanese Inflation And The Yen - January 29, 2021 The Yen Chart II-5JPY Technicals 1
JPY Technicals 1
JPY Technicals 1
Chart II-6JPY Technicals 2
JPY Technicals 2
JPY Technicals 2
There was scant data out of Japan this week: Household spending strengthened by 7.2% in March versus February, comfortably beating the expected 2.1% increase. The Japanese current account weakened to JPY 2.65tn in March from JPY 2.9tn in February. The Eco Watchers Survey disappointed in April, with current conditions declining from 49 to 39.1 and the expectations component falling from 49.8 to 41.7. The yen was up by 0.5% against the USD this week. The recent extension of the already months-long state of emergency will put downward pressure on the yen in the near term. However, with Japanese equities and the currency in oversold conditions, we are cautiously optimistic on the yen further along in the year. Report Links: The Dollar Bull Case Will Soon Fade - March 5, 2021 On Japanese Inflation And The Yen - January 29, 2021 The Dollar Conundrum And Protection - November 6, 2020 British Pound Chart II-7GBP Technicals 1
GBP Technicals 1
GBP Technicals 1
Chart II-8GBP Technicals 2
GBP Technicals 2
GBP Technicals 2
The recent data out of the UK have been weak: Construction PMI remained mostly unchanged at 61.6 in April. GDP weakened, quarter on quarter, by 1.5% in Q1. More disappointing was business investment that dropped in Q1 by 11.9% quarter on quarter and 18.1% year on year. March GDP strengthened by 2.1% month on month, suggesting the pullback in the first quarter was mostly due to lockdowns. Manufacturing production was up by 2.1% in March versus February, beating the 1% consensus. The trade deficit narrowed to GBP11.71B in March. The pound was up by 1.7% this week against the USD. The soft Q1 output data, primarily a result of the winter lockdown, mask improvements in March. With restrictions being lifted, services output and household consumption (induced by excess savings) should quickly catch up with the recent bounce in manufacturing. However, markets may have priced in too much of the UK’s vaccination outperformance as is reflected in the overpriced small-cap equities. Report Links: Portfolio And Model Review - February 5, 2021 The Dollar Conundrum And Protection - November 6, 2020 Revisiting Our High-Conviction Trades - September 11, 2020 Australian Dollar Chart II-9AUD Technicals 1
AUD Technicals 1
AUD Technicals 1
Chart II-10AUD Technicals 2
AUD Technicals 2
AUD Technicals 2
The recent data out of Australia have been positive: The NAB Business confidence increased to 26 in April from 17 the prior month. The NAB business survey index also edged higher to 32 in April from 25 in March. Retail sales increased by 1.3% in March month on month, slightly below the expected 1.4%. Quarter on quarter, Q1 retail sales weakened by 0.5% versus the estimated drop of 0.4%. Q1 CPI came in below expectations at 0.6% quarter on quarter and 1.1% year on year. The AUD was up by 1.2% this week against the USD. While the NAB business confidence and conditions indices came in at record highs, the price pressures remain weak in Australia and vaccination progress continues to lag. That said, leading indicators such as capex intentions and forward orders are improving. We are short AUD/MXN mainly to capitalize on Mexico’s proximity to the rebounding US. Report Links: The Dollar Bull Case Will Soon Fade - March 5, 2021 Portfolio And Model Review - February 5, 2021 Australia: Regime Change For Bond Yields & The Currency? - January 20, 2021 New Zealand Dollar Chart II-11NZD Technicals 1
NZD Technicals 1
NZD Technicals 1
Chart II-12NZD Technicals 2
NZD Technicals 2
NZD Technicals 2
The recent data out of New Zealand have been scant: Electronic card retail sales increased by 4% month on month in April after a 0.8% drop in March. The food price index came in at 1.1% month on month in April, compared to 0% in March. The NZD was up by 0.8% this week against the dollar. With positive data coming out of New Zealand recently, our Global Fixed Income Strategy colleagues judge the RBNZ to be the next central bank most likely to taper sometime in the second half of 2021. However, with Q2 inflation expectations that remain soft and the tourism sector still held back by broad border shutdowns, we remain cautious on the kiwi. Report Links: Portfolio And Model Review - February 5, 2021 Currencies And The Value-Versus-Growth Debate - July 10, 2020 Updating Our Balance Of Payments Monitor - November 29, 2019 Canadian Dollar Chart II-13CAD Technicals 1
CAD Technicals 1
CAD Technicals 1
Chart II-14CAD Technicals 2
CAD Technicals 2
CAD Technicals 2
The recent data out of Canada have been mildly disappointing: The employment report was disheartening. Canada lost 207.1K jobs in April, and the participation rate dropped from 65.2% to 64.9%. The unemployment rate also weakened from 7.5% to 8.1% in April, higher than expected. The Ivey PMI dropped to 60.6 in April from 72.9 in March, in line with expectations. The CAD was up by 1.35% against the USD this week. Despite the already months-long rallying of the loonie and the housing prices, the CAD is still cheap by its real effective exchange rate. Strengthening oil prices should continue to support the currency. A potential extension to the current COVID-19 lockdown and lagging vaccination progress remain downside risks. Report Links: Relative Growth, The Euro, And The Loonie - April 16, 2021 Will The Canadian Recovery Lead Or Lag The Global Cycle? - February 12, 2021 Currencies And The Value-Versus-Growth Debate - July 10, 2020 Swiss Franc Chart II-15CHF Technicals 1
CHF Technicals 1
CHF Technicals 1
Chart II-16CHF Technicals 2
CHF Technicals 2
CHF Technicals 2
The recent Swiss data have been neutral: Unemployment rate remained relatively unchanged at 3.3% in April, in line with expectations. The Swiss franc was up by 1% this week against the USD. The franc is cheap with a real effective exchange rate that is at one standard deviation below fair value. Should the pickup in global trade continue, this will buffet the franc. However, our bias is that the SNB will continue to fight excessive franc strength, especially against the euro. So we think the franc will lag the euro over the longer term. We are also going long CHF/NZD today should currency volatility pick up. Report Links: Portfolio And Model Review - February 5, 2021 The Dollar Conundrum And Protection - November 6, 2020 On The DXY Breakout, Euro, And Swiss Franc - February 21, 2020 Norwegian Krone Chart II-17NOK Technicals 1
NOK Technicals 1
NOK Technicals 1
Chart II-18NOK Technicals 2
NOK Technicals 2
NOK Technicals 2
The recent data out of Norway have been mixed: CPI came in at 3% in April, in line with expectations. PPI growth registered at 22.5% in April, year on year. GDP dropped by 0.6% in Q1 quarter on quarter, a disappointment given an estimated 0.4% decrease. Mainland GDP also undershot expectations, decreasing by 1% in Q1 quarter on quarter. The NOK was up by 1% this week against the dollar. The soft Q1 data may hold back the NOK in the very near term, especially considering its remarkable performance since its March 2020 lows. That said, the rally in oil prices will continue to provide support to the NOK. Vaccination progress, on par with that of the euro area, should also benefit the currency. Report Links: Portfolio And Model Review - February 5, 2021 Revisiting Our High-Conviction Trades - September 11, 2020 A New Paradigm For Petrocurrencies - April 10, 2020 Swedish Krona Chart II-19SEK Technicals 1
SEK Technicals 1
SEK Technicals 1
Chart II-20SEK Technicals 2
SEK Technicals 2
SEK Technicals 2
Recent Swedish data have been mildly positive: The unemployment rate came down from 8.4% in March to 8.2% in April. CPI came in at 2.2% year on year and 0.2% month on month in April, in line with expectations. CPIF registered at 2.5% year on year and 0.3% month on month in April, both beating the consensus. The SEK was up by 2% this week against the USD. Vaccination progress in Sweden is only notches below that of the euro area. A potential shift of sentiment out of the crowded commodity-driven trades could also lend support to the export-driven SEK, on the back of a recovery in Europe in the near term. Report Links: Revisiting Our High-Conviction Trades - September 11, 2020 Updating Our Balance Of Payments Monitor - November 29, 2019 Where To Next For The US Dollar? - June 7, 2019 Footnotes 1 Please see Foreign Exchange Strategy Special Report, "2021 Key Views: Tradeable Themes," dated December 4, 2020. 2 Please see Global Fixed Income Strategy Special Report, "Who Tapers Next?," dated December 04, 2020. Trades & Forecasts Forecast Summary Core Portfolio Tactical Trades Limit Orders Closed Trades