Emerging Markets

Highlights Clients countered our opinion that China’s economy has reached its cyclical peak. However, we have already incorporated the supporting facts into our analysis so they will not alter our cyclical outlook for the economy. The favorable external backdrop is a potential downside risk to China’s domestic economy, because the country’s pain threshold for reform is often positively correlated with global growth. We agree that an acceleration in local governments’ special-purpose bond issuance could boost infrastructure investment in the next six months, but we are skeptical about the magnitude of such support. China’s onshore and offshore stock markets remain firmly in a risk-off mode. For now, we recommend investors stay on the sidelines until some of the early indicators turn more bullish. Feature We spent the past week hosting virtual meetings with BCA’s clients in Europe and Asia. We presented our view that China’s economic recovery has likely peaked and escalating risks of a policy overtightening warrant an underweight position on Chinese stocks for the next six months. Most clients shared our concern that policymakers may keep financial and industry regulations more restrictive than the market is currently pricing in, leading to more downside surprises to risk asset prices. Clients also brought up a few opposing views which challenged our analytical framework. In this and next week’s reports we will highlight some of the counterpoints we discussed in these meetings. Interestingly, most of our clients - even ones who are more sanguine about China’s economic outlook - prefer to wait on the sidelines before jumping back into China’s equity market. They foresee sustained volatility in the coming months as the market continues to struggle between digesting high valuations and adjusting expectations for future earnings growth. Has China’s Economic Recovery Reached An Apex? The primary discussion centered around whether the strength in China’s economy has reached a cyclical peak. Q1 GDP points to slower sequential economic momentum from Q4 last year (Chart 1). Some of the high-frequency economic data also indicate that economic activity peaked in Q4 last year (Chart 2). Chart 1Q1 Sequential Growth Was The Slowest In A Decade
Q1 Sequential Growth Was The Slowest In A Decade
Q1 Sequential Growth Was The Slowest In A Decade
Chart 2Has Economic Activity Peaked?
Has Economic Activity Peaked?
Has Economic Activity Peaked?
Chart 3Our Framework Suggests A Slower Growth Momentum Ahead
Our Framework Suggests A Slower Growth Momentum Ahead
Our Framework Suggests A Slower Growth Momentum Ahead
The view fits perfectly into our analytical framework, which has worked well in the past decade. Historically, China’s credit formation has consistently led economic activity by about six to nine months. A turning point in the credit impulse occurred last October, which suggests that economic activity should start to slow in Q2 this year (Chart 3). However, our clients countered with the following arguments, which support a notion that sequential economic growth rate can still trend higher in the next six months: Aggregate demand in Europe and the US continues to improve, while the COVID-19 resurgence in major emerging economies, such as India and Brazil, has forced their production recoveries to pause. Thus, China’s exports will remain robust and should continue to make substantial contributions to the economy (Chart 4). Infrastructure spending could get a meaningful boost when local governments speed up issuing special-purpose bonds (SPB) in Q2 and Q3. Infrastructure investment growth was relatively weak in Q1, probably the result of a slower pace in credit growth and government expenditures (Chart 5). However, a delay in local government SPB issuance in Q1 this year means more support for infrastructure investment in the rest of the year (Chart 6). Chart 4Counterpoint #1: Chinese Exports Will Stay Strong
Counterpoint #1: Chinese Exports Will Stay Strong
Counterpoint #1: Chinese Exports Will Stay Strong
Chart 5Slower Credit Growth Led To A Subdued Q1 Infrastructure Investment Growth
Slower Credit Growth Led To A Subdued Q1 Infrastructure Investment Growth
Slower Credit Growth Led To A Subdued Q1 Infrastructure Investment Growth
Travel restrictions imposed during the Chinese New Year weighed heavily on the service sector in Q1 (Chart 7). If China’s domestic COVID-19 cases remain well controlled, then the trend could reverse and the pent-up demand for service consumption may usher in a significant improvement in Q2 when three major public holidays occur. The service sector accounts for more than half of China’s GDP, therefore, an improvement in this sector should significantly bolster future GDP growth. Chart 6Counterpoint #2: More LG SPBs, More Spending On Infrastructure
Opposing Views From Client Meetings (Part 1)
Opposing Views From Client Meetings (Part 1)
Chart 7Counterpoint #3: Service Sector Activities Will Pick Up
Counterpoint #3: Service Sector Activities Will Pick Up
Counterpoint #3: Service Sector Activities Will Pick Up
Our Analytical Framework The viewpoints expressed by clients have not changed our cyclical view of China’s economy, since our broad analysis of Chinese business cycle already incorporates the main points that clients raised. Additionally, data such as GDP growth figures are coincident and lagging indicators, and do not explain the direction of forward-looking financial markets. The authorities will shift their policy trajectories only if the data significantly deviate from expectations. We view Q1 GDP and underlying data broadly in line with Chinese leadership’s short- and medium-term economic growth targets and, therefore, will not lead to any policy adjustment. Chart 8If Demand For Chinese Exports Stays Strong, Reform Efforts Will Intensify
Opposing Views From Client Meetings (Part 1)
Opposing Views From Client Meetings (Part 1)
To our clients’ point that strong exports ahead will support China’s overall GDP growth, we regard a favorable external backdrop as a potential downside risk to the domestic economy. The willingness of Chinese authorities to pursue painful reforms is often positively correlated with global growth (Chart 8). BCA has written extensively about how China has taken advantage of a stronger export sector by increasing the pace of domestic reforms and in the past has embarked on a multi-year reform plan that weighed on growth. At the beginning of this year, Chinese policymakers were set out to “keep credit growth in line with nominal GDP growth in 2021.” Nonetheless, policymakers’ targets for credit and nominal GDP growth rates could change during the year, contingent on their perception of the broad growth outlook and unemployment. Chart 9Both Credit And Economic Growth Rates Are Moving Targets And Subject To Policy Finetuning
Both Credit And Economic Growth Rates Are Moving Targets And Subject To Policy Finetuning
Both Credit And Economic Growth Rates Are Moving Targets And Subject To Policy Finetuning
Even if policymakers keep the country’s leverage ratio steady in 2021, which is our base case view and assuming China’s nominal GDP grows by 11%, then the credit impulse (measured by the 12-month difference in total social financing as a percentage of GDP) will likely fall to about 28% of GDP, down from 32% of GDP in 2020 (Chart 9). The rate of credit formation increased by 13.6% in the first three months from Q1 last year, above government’s target. We expect a further pullback in credit growth in the rest of the year, to bring the annual pace at or below 12%. Construction capex, which is sensitive to both credit creation and tightening regulations in the housing sector, will likely experience a slowdown. At more than 90% of GDP, China’s economy is mainly driven by domestic demand and a weakening in the domestic economy can more than offset positive contributions from a robust export sector. Infrastructure And Services We expect infrastructure investment will grow by 4-5% this year, which is in line with its rate of expansion in 2020. However, the sequential growth in the sector in Q2 – Q4 this year will be slower than during the same period in 2020 (Chart 10). We agree that a more concentrated issuance of local government SPBs in Q2 and Q3 could help to buttress infrastructure investment. However, SPBs made up only about 15% of overall infrastructure spending in the past three years, so we are dubious that SPBs can provide the crucial support. The rest of the gap for local governments to finance their spending on infrastructure projects will need to be filled through public-private partnerships (PPP) financing, government-managed funds’ (GMFs) revenues, government budgets and bank loans. Note that only non-household medium- and long-term (MLT) bank lending showed a positive impulse so far (Chart 11). While not all of MLT loans are used for infrastructure, they have a positive correlation with investments in infrastructure projects which are generally long term in nature. Chart 10Sequential Growth In Infrastructure Investment Will Be Slower Than In Q2 – Q4 Last Year
Opposing Views From Client Meetings (Part 1)
Opposing Views From Client Meetings (Part 1)
Chart 11MLT Bank Loans Have Been Supportive To Infrastructure Spending...
MLT Bank Loans Have Been Supportive To Infrastructure Spending...
MLT Bank Loans Have Been Supportive To Infrastructure Spending...
On the other hand, the contribution of PPPs to total infrastructure spending has been plunging in recent years due to tighter regulations aimed at controlling increased risks related to local government debt (Chart 12). Depressed revenues from land sales and extended corporate tax cuts this year will also curb the ability of local governments to finance infrastructure projects (Chart 13). Chart 12...But Public-Private Partnerships Have Become Too Small To Fill The Financing Gap
...But Public-Private Partnerships Have Become Too Small To Fill The Financing Gap
...But Public-Private Partnerships Have Become Too Small To Fill The Financing Gap
Chart 13Government-Managed Funds Also Face Headwinds From Falling Land Sales
Government-Managed Funds Also Face Headwinds From Falling Land Sales
Government-Managed Funds Also Face Headwinds From Falling Land Sales
Finally, although the service sector accounts for 54% of China’s GDP (2019 statistic), transport, retail and accommodation, which were hardest hit by COVID-19, accounted for less than 30% of China’s tertiary GDP. This compares with a slightly larger share of tertiary GDP from finance- and housing-related sectors (financial intermediation, leasing & business services, and real estate) –the sectors that have been thriving since the second half of last year when both the equity and housing markets boomed (Chart 14). Nonetheless, it is unreasonable to expect these areas to strengthen even more in an environment where the policy has shifted to contain risks in the financial and housing arenas. The net result to tertiary GDP growth is that the deterioration in finance- and real estate-related segments will likely offset an improvement in transport, retail and accommodation. Chart 14More Than 70% Of China’s Services Sector Is Finance And Real Estate Related
Opposing Views From Client Meetings (Part 1)
Opposing Views From Client Meetings (Part 1)
Investment Conclusions The ultimate question we got from almost every client meeting was: What would make us turn bullish on Chinese stocks in the next 6 to 12 months? Chart 15Changes In Domestic Policy Dominate Chinese Stock Performance
Changes In Domestic Policy Dominate Chinese Stock Performance
Changes In Domestic Policy Dominate Chinese Stock Performance
Since most monthly and quarterly economic data do not provide enough market-moving catalysts, we rely on our assessment of the changes in policy direction, such as interbank liquidity conditions and excess reserves, in addition to overall credit growth (Chart 15). We will also continue to watch for the following signs before upgrading our tactical and cyclical calls from underweight to overweight: Chart 16 shows that cyclical stocks remain depressed relative to defensives in both onshore and offshore markets, underscoring investors’ concerns about China’s economy. A breakout in cyclicals versus defensives would signify a major improvement in investor sentiment towards policy support and economic growth. A technical breakdown in the performance of healthcare and utility stocks relative to investable stocks would be another bullish indicator (Chart 17). These equities have historically led China’s economic activity, core inflation and stock prices by one to three months. A technical breakdown in the relative performance of these sectors would signify that market participants anticipate a meaningful economic upturn in China. Chart 16Waiting For A Telltale Sign...
Waiting For A Telltale Sign...
Waiting For A Telltale Sign...
Chart 17...Before Upgrading Chinese Stocks
...Before Upgrading Chinese Stocks
...Before Upgrading Chinese Stocks
Given that the above mentioned indicators remain firmly in a risk-off mode, we maintain our view that China’s economy has reached its peak, and policy has tightened meaningfully. Our cyclical underweight position on Chinese stocks, in both absolute terms and within a global portfolio, is warranted. Jing Sima China Strategist jings@bcaresearch.com Cyclical Investment Stance Equity Sector Recommendations
Chinese stocks were the worst performing among major global equity benchmarks on Monday. The CSI 300 dipped 1.13%, while the S&P 500 and Eurostoxx 50 gained 0.18% and 0.22%, respectively. An investigation into Meituan’s monopolistic practices triggered…
In the second half of the year, global growth will be bifurcated. On one hand, monetary and fiscal stimulus in the US, and to a lesser extent Europe, will remain ultra-accommodative and will support their economic recoveries. On the other hand, Chinese…
The Bank of Russia raised the benchmark interest rate by 50 basis points to 5.0% on Friday, 25 bps more than expected. The central bank also increased its 2021 inflation forecast to 4.7-5.2% and argued that inflationary risks called for “an earlier return to…
Highlights The Greens are likely to win control of Germany’s government in the September 26 federal elections. At least they will be very influential in the new coalition. Germany has achieved may of its long-term geopolitical goals within the EU. There is consensus on dovish monetary and fiscal policy and hawkish environmental policy. The biggest changes will come from the outside. The US and Germany have a more difficult relationship. While they both oppose Russian and Chinese aggression, Germany will resist American aggression. The Christian Democrats have a 65% chance of remaining in government which would limit the Greens’ controversial and ambitious tax agenda. The 35% chance of a left-wing coalition will frontload fiscal stimulus for the sake of recovery. The economy is looking up and a Green-led fiscal easing would supercharge the recovery. However, coalition politics will likely fail to address Germany’s poor demography, deteriorating productivity, and large excess savings. On a cyclical basis, overweight peripheral European bonds relative to bunds; EUR/USD; and Italian and Spanish stocks relative to German stocks. Feature Chart 1Germans Turn To A Young Woman And A Green
Winds Of Change: Germany Goes Green
Winds Of Change: Germany Goes Green
Germany is set to become the first major country to be led by a green party. At very least the German election on September 26 will see an upset in which the ruling party under-performs and the Greens over-perform (Chart 1). At 30%, online betting markets are underrating the odds that Annalena Baerbock will become the first Green chancellor in 2022 – and the first elected chancellor to hail from a third party (Chart 2). The “German question” – the problem of how to unify Germany yet keep peace with the neighbors – lay at the heart of Europe for the past two centuries but today it appears substantially resolved: a peaceful and unified Germany stands at the center of a peaceful and mostly unified Europe. There are a range of risks on the horizon but this positive backdrop should be acknowledged. Chart 2Market Waking Up To Baerbock’s Bid For Chancellorship
Winds Of Change: Germany Goes Green
Winds Of Change: Germany Goes Green
All of the likeliest scenarios for the German election will reinforce the current situation by perpetuating policies that aim for Euro Area solidarity. Even the green shift is already well underway, though a Green-led government would supercharge it. Nevertheless this year’s election is important because it heralds a leftward shift in Germany and will shape fiscal, energy, industrial, and trade policy for at least the coming four years. A left-wing sweep would generate equity market excitement in the short run – a positive fiscal surprise to supercharge the post-pandemic rebound – but over the long run it would bring greater policy uncertainty because it would cause a break with the past and possibly a structural economic shift (Chart 3). The Greens are in favor of substantial increases in taxation and regulation as well as big changes in industrial and energy policy. In the absence of a left-wing sweep, coalition politics will be a muddle and Germany’s existing policies will continue. Chart 3German Policy Uncertainty On The Rise
German Policy Uncertainty On The Rise
German Policy Uncertainty On The Rise
Regardless of what happens within Germany, the geopolitical environment is increasingly dangerous. Germany will try to avoid getting drawn into the US’s great power struggles with Russia and China but it may not have a choice. Germany’s Geopolitics The difficulty of German unification stands at the center of modern European history. Because of the large and productive German-speaking population, unification in 1871 posed a security threat to the neighbors, culminating in the world wars. The peaceful German reunification after the Cold War created the potential for the EU to succeed and establish peace and prosperity on the continent. This arrangement has survived recent challenges. Germany’s relationship with the EU came under threat from the financial crisis, the Arab Spring and immigration influx, Brexit, and President Trump’s trade tariffs. But in the end these events cemented the reality that German and Europe are strengthening their bonds in the face of foreign pressures. Germany achieved what it had long sought – preeminence on the continent – by eschewing a military role, sticking to France economically, and avoiding conflict with Russia. Since Germany has achieved many of its long-sought strategic objectives it has not fallen victim to a nationalist backlash over the past ten years like the US and United Kingdom. However, Germany is not immune to populism or anti-establishment sentiment. The two main political blocs, the Christian Democrats and the Democratic Socialists, have suffered a loss of popular support in recent elections, forcing them into a grand coalition together. Anti-establishment feeling in Germany has moved the electorate to the left, in favor of the Greens. The Greens have risen inexorably over the past decade and have now seized the momentum only five months before an election (Chart 4). Yet the Greens in Germany are basically an establishment political party. They participate in 11 out of 16 state governments and currently hold the top position in Baden-Württemberg, Germany’s third most populous and productive state. From 1998-2005 they participated in government, getting their hands dirty with neoliberal structural reforms and overseas military deployments. Moreover the Greens cannot rule alone but will have to rule within a coalition, which will mediate their more controversial policies. Chart 4Greens Surge, Christian Democrats Falter
Greens Surge, Christian Democrats Falter
Greens Surge, Christian Democrats Falter
Today Germany is in lock step with France and the EU by meeting three key conditions: full monetary accommodation (the German constitutional court’s challenges to the European Central Bank are ineffectual), full fiscal accommodation (Chancellor Angela Merkel agreed to joint debt issuance and loose deficit controls amid the COVID-19 crisis as well as robust green energy policies), and full security accommodation (German rearmament exists within the context of NATO and European security aspirations are undertaken in lock-step with the French). These conditions will not change in the 2021 election even assuming that the Greens take power at the head of a left-wing coalition. Bottom Line: Germany has virtually achieved its grand strategic aims of unifying and ruling Europe. No German government will challenge this situation and every German government will strive to solidify it. The greatest risks to this setup stem from abroad rather than at home. The Return Of The German Question? Germany’s geopolitical position can be summarized by Chart 5, which shows popular views toward different countries and institutions. The Germans look positively upon the EU and global institutions like the United Nations and less so NATO. They look unfavorably upon everything else. They take an unfavorable view toward Russia, but not dramatically so, which shows their lack of interest in conflict with Russia – they do not want to be the battleground or the ramparts of another major European war. They dislike the United States and China even more, and equally. Even if attitudes toward the US have improved since the 2020 election the net unfavorability is telling. Chart 5Germany More Favorable Toward Russia Than US?
Winds Of Change: Germany Goes Green
Winds Of Change: Germany Goes Green
Since the global financial crisis, and especially Russia’s invasion of Ukraine in 2014, Germany has built up its military. This buildup is taking place under the prodding of the United States and in step with NATO allies, who are reacting to Russia’s military action to restore its sphere of influence in the former Soviet space (Chart 6). Germany’s military spending still falls short of NATO’s 2% of GDP target, however. It will not be seen as a threat to its neighbors as long as it remains integrated with France and Europe and geared toward deterring Russia. Chart 6Germany And NATO Increase Military Spending
Winds Of Change: Germany Goes Green
Winds Of Change: Germany Goes Green
Chart 7Watch Russo-German Relations For Cracks In Europe’s Edifice
Winds Of Change: Germany Goes Green
Winds Of Change: Germany Goes Green
Russia’s aggressiveness should continue to drive the Germans and Europeans into each other’s arms. This could change if Putin pursues diplomacy over military coercion, for then he could split Germany from eastern Europe. The possibility is clear from Russia’s and Germany’s current insistence on completing the Nord Stream 2 pipeline despite American and eastern European objections. The pipeline is set to be completed by September, right in time for the elections – in no small part because the Greens oppose it. If the US insists on halting the pipeline then a crisis will erupt with Russia that will humiliate Merkel and the Christian Democrats. But the US may refrain from doing so in the face of Russian military threats (odds are 50/50). The Russian positioning over 100,000 troops on the border with Ukraine this year – and now reportedly ordering them to return to base by May 1 – amounts to a test of Russo-German relations. Putin can easily expand the Russian footprint in Ukraine and tensions will remain elevated at least through the Russian legislative elections in September. Germans would respond to another invasion with sanctions, albeit likely watering down tougher sanctions proposed by the Americans. What would truly change the game would be a Russian conquest of all of Ukraine. This is unlikely – precisely because it would unite Germany, the Europeans, and the Americans solidly against Russia, to its economic loss as well as strategic disadvantage (Chart 7). China’s rise should also keep Germany bound up with Europe. The Germans fear China’s technological and manufacturing advancement, including Chinese involvement in digital infrastructure and networks. The Greens are critical of the way that carbon-heavy Chinese goods undercut the prices of carbon-lite German goods. Baerbock favors carbon adjustment fees, a pretty word for tariffs. However, the Germans want to maintain business with China and are not very afraid of China’s military. Hence there is a risk of a US-German split over the question of China. If Germany should consistently side with Russia and China over US objections then it risks attracting hostile attention from the US as well as from fellow Europeans, who will eventually fear that German power is becoming exorbitant by forming relations with giants outside the EU. But this is not the leading risk today. The US is courting Germany and seeking to renew the trans-Atlantic alliance. Meanwhile Germany needs US support against Russia’s military and China’s trade practices. US-German relations will improve unless the US forces Germany into an outright conflict with the autocratic powers. Bottom Line: The US and Germany have a more difficult relationship now than in the past but they share an interest in deterring Russian aggression and Chinese technological and trade ambitions. Biden’s attempt to confront these powers multilaterally is limited by Germany’s risk-aversion. Scenarios For The 2021 Election There are several realistic scenarios for the German election outcome. Our expectation that the Greens will form a government stems from a series of fundamental factors. Opinion polling has now clearly shifted in favor of our view, with the Greens gaining the momentum with only five months to go. Grouping the political parties into ideological blocs shows that the race is a dead heat. Our bet is that momentum will break in favor of the opposition Greens, which we explain below. Meanwhile the Free Democrats should perform well, stealing votes from the Christian Democrats. The right-wing Alternative für Deutschland (AfD), while not performing well, is persistent enough to poach some votes from the Christian Democrats. These are “lost” votes to the conservatives as none of the parties will join it in a coalition (Chart 8). Chart 8Germany's Median Voters Shifts To the Left
Germany's Median Voters Shifts To the Left
Germany's Median Voters Shifts To the Left
The Christian Democrats bear all the signs of a stale and vulnerable government. They have been in power for 16 years and their performance in state and federal elections has eroded recently, including this year (Table 1). The public is susceptible to the powerful idea that it is time for a change. Chancellor Merkel’s approval rating is still around 60%, but in freefall, and her successful legacy is not enough to save her party, which is showing all the signs of panic: succession issues, indecision, infighting, corruption scandals. The Greens will be “tax-and-spend” lefties but the coalition matters in terms of what can actually be legislated (Table 2).1 Table 1AChristian Democrats Fall, Greens Rise, In Recent State Elections
Winds Of Change: Germany Goes Green
Winds Of Change: Germany Goes Green
Table 1BChristian Democrats Fall, Greens Rise, In Recent State Elections
Winds Of Change: Germany Goes Green
Winds Of Change: Germany Goes Green
Table 2Policy Platforms Of The Green Party
Winds Of Change: Germany Goes Green
Winds Of Change: Germany Goes Green
The fact that Christian Democrats and their Bavarian sister party, the Christian Social Union, saw such a tough race for chancellor candidate is an ill omen. Moreover the party’s elites went for the safe choice of Merkel’s handpicked successor, Armin Laschet, over the more popular Markus Soeder (Chart 9), in a division that will likely haunt the party later this year. Chart 9Christian Democrats And Christian Social Union Divided Ahead Of Election
Winds Of Change: Germany Goes Green
Winds Of Change: Germany Goes Green
Laschet has received a bounce in polls with the nomination but it will be temporary. He has not cut a major figure in any polling prior to now. Chart 10Dissatisfaction Points To Government Change
Winds Of Change: Germany Goes Green
Winds Of Change: Germany Goes Green
He has quarreled openly with Merkel and the coalition over pandemic management. He was not her first choice of successor anyway – that was Annagret Kramp-Karrenbauer, who fell from grace due to controversy over the faintest hint of cooperation with the AfD. There is a manifest problem filling Merkel’s shoes. Even more important than coalition infighting is the fact that Germany, like the rest of the world, has suffered a historic shock to its economy and society. The pandemic and recession were then aggravated by a botched vaccine rollout. General dissatisfaction is high, another negative sign for the incumbent party (Chart 10). Of course, the election is still five months away. The vaccine will make its way around, the economy will reopen, and consumers will look up – see below for the very positive macro upturn that Germany should expect between now and the election. Voters have largely favored strict pandemic measures and Merkel will have long coattails. This Christian Democrats and Christian Social Union have ruled modern Germany for all but 15 years and have not fallen beneath 33% of the popular vote since reunification. The Greens have frequently aroused more energy in opinion polling than at the voting booth. With these points in mind, we offer the following election scenarios with our subjective probabilities: Green-Red-Red Coalition – Greens rule without Christian Democrats – 35% odds. Green-Black Coalition – Greens rule with Christian Democrats – 30% odds. Black-Green Coalition – Christian Democrats rule with Greens – 25% odds. Grand Coalition (Status Quo) – Christian Democrats rule without Greens – 10% odds. Our subjective probabilities are based on the opinion polls and online betting cited above but adjusted for the Greens’ momentum, the Christian Democrats’ internal divisions, the “time for change” factor, and the presence of a historic exogenous economic and social shock. Geopolitical surprises could occur before the election but they would most likely reinforce the Greens, since they have taken a hawkish line against Russia and China. Bottom Line: The Greens are likely to lead the next German government but at very least they will have a powerful influence. Policy Impacts Of Election Scenarios The makeup of the ruling coalition will determine the parameters of new policy. Fiscal policy will change based on the election outcome – both spending and taxes. The Greens will be “tax-and-spend” lefties but the coalition matters in terms of what can actually be legislated.2 The Greens’ idea is to “steer” the rebuilding process through environmental policy. But if the left lacks a strong majority then the Greens’ more controversial and punitive measures will not get through. Transformative policies will weigh heavily on the lower classes (Chart 11). Chart 11Ambitious Climate Policy Will Face Resistance
Winds Of Change: Germany Goes Green
Winds Of Change: Germany Goes Green
The policy dispositions of the various chancellor candidates help to illustrate Germany’s high degree of policy consensus. Table 3 looks at the candidates based on whether they are “hawkish” (active or offensive) or “dovish” (passive or defensive) on a given policy area. What stands out is the agreement among the different candidates despite party differences. Nobody is a fiscal or monetary hawk. Only Baerbock can be classified as a hawk on trade.3 Nobody is a hawk on immigration. Nearly everyone is a hawk on fighting climate change. And attitudes are turning more skeptical of Russia and China, though not outright hawkish. Table 3Policy Consensus Among German Chancellor Candidates
Winds Of Change: Germany Goes Green
Winds Of Change: Germany Goes Green
Germany will not abandon its green initiatives even if the Greens underperform. The current grand coalition pursued a climate package due to popular pressure even with the Greens in opposition. Germans are considerably more pro-environment even than other Europeans (Chart 12). The green shift is also happening across the world. The US is now joining the green race while China is doubling down for its own reasons. See the Appendix for current green targets and measures, which have been updated in the wake of a slew of announcements before Biden’s Earth Day climate summit on April 22-23. Chart 12Germans Care Even More About Environment Than Other Europeans
Winds Of Change: Germany Goes Green
Winds Of Change: Germany Goes Green
Any coalition will raise spending more than taxes since it will be focused on post-COVID economic recovery. There has been a long prelude to Germany’s proactive fiscal shift – it has staying power and is not to be dismissed. A Christian Democratic coalition would try to restore fiscal discipline sooner than otherwise but there is only a 5% chance that it will have the power to do so according to the scenarios given above. The rest of Europe will be motivated to spend aggressively while EU fiscal caps are on hold in 2022, especially if the German government is taking a more dovish turn. Even more than the US and UK, Germany is turning away from the neoliberal Washington Consensus. But Germans are not experiencing any kind of US-style surge of polarization and populism. At least not yet. It may be a risk over the long run, depending on the fate of the Christian Democrats, the AfD, and various internal and external developments. Bottom Line: Germany has a national consensus that consists of dovish monetary, fiscal, trade, and immigration policies and hawkish (pro-green) environmental policy. Germany is turning less dovish on geopolitical conflicts with Russia and China. Given that a coalition government is likely, this consensus is likely to determine actual policy in the wake of this year’s election. A few things are clear regardless of the ruling coalition. First, Germany is seeking domestic demand as a new source of growth, to rebalance its economy and deepen EU integration. Second, Germany is accelerating its green energy drive. Third, Germany cannot accept being in the middle of a new cold war with Russia. Fourth, Germany has an ambivalent policy on China. Germany’s Macro Outlook Even before considering the broader fiscal picture, the outlook for German economic activity over the course of the coming 12 to 24 months was already positive. Our base case scenario for the September election, which foresees a coalition government led by the Green Party, only confirms this optimistic view. However, Germany is still facing significant long-term challenges, and, so far, there has not been a political consensus to address these structural headwinds adequately. The Greens offer some solutions but not all of their proposals are constructive and much will depend on their parliamentary strength. Peering Into The Near-Term… Germany’s economy is set to benefit from the continued recovery of the global business cycle, which is a view at the core of BCA Research’s current outlook.4 Germany remains a trading and manufacturing powerhouse, and thus, it will reap a significant dividend from the continued global manufacturing upswing. Manufacturing and trade amount to 20% and 88% of Germany’s GDP, the highest percentage of any major economy. Alternatively, according to the OECD, foreign demand for German goods accounts for nearly 30% of domestic value added, a share even greater than that for a smaller economy like Korea (Chart 13). Moreover, road vehicles, machinery and other transport equipment, as well as chemicals and related products, account for 53% of Germany’s exports. These products are all particularly sensitive to the global business cycle. They will therefore enhance the performance of the German economy over the next two years. Trade with the rest of Europe constitutes another boost to Germany’s economy going forward. Shipments to the euro area and the rest of the EU account for 34% and 23% of Germany’s exports, or 57% overall. Right now, the lagging economy of Europe is a handicap for Germany; however, Europe has more pent-up demand than the US, and the consumption of durable goods will surge once the vaccination campaign progresses further (Chart 14). This will create a significant boon for Germany, since we expect European consumption to pick up meaningfully over the coming 12 to 18 months.5 Chart 13Germany Depends On Global Trade
Winds Of Change: Germany Goes Green
Winds Of Change: Germany Goes Green
Chart 14Europe Has More Pent-Up Demand Than The US
Europe Has More Pent-Up Demand Than The US
Europe Has More Pent-Up Demand Than The US
Chart 15Vaccination Progress
Vaccination Progress
Vaccination Progress
Domestic forces also point toward a strong Germany economy, not just foreign factors. The pace of vaccination is rapidly accelerating in Germany (Chart 15). The recent announcement of 50 million additional doses purchases for the quarter and up to 1.8 billion more doses over the next two years by the EU points to further improvements. A more broad-based vaccination effort will catalyze underlying tailwinds to consumption. German household income will also progress significantly. The Kurzarbeit program was instrumental in containing the unemployment rate during the crisis, which only peaked at 6.4% from 5% in early 2020. However, the program could not prevent a sharp decline in total hours worked of 7%, since by definition, it forced six million employees to work reduced hours (Chart 16). One of the great benefits of the program is that it prevents a rupture of the link between workers and employers. Thus, the economy suffers less frictional unemployment as activity recovers and household income does not suffer long lasting damage. Meanwhile, the German government is likely to extend the support for households and businesses as a result of the delayed use of the debt-brake. The Greens propose revising the debt brake rather than restoring it in 2022 like the conservatives pledge to do. Chart 16Kurtzarbeit Saved The Day
Kurtzarbeit Saved The Day
Kurtzarbeit Saved The Day
The balance-sheet strength of German households means that they will have the wherewithal to spend these growing incomes. Residential real estate prices are rising at an 8% annual pace, which is pushing the asset-to-disposable income ratio to record highs. Meanwhile, the debt-to-assets ratio, and the level of interest rates are also very low, which means that the burden of serving existing liabilities is minimal (Chart 17). In this context, durable goods spending will accelerate, which will lift overall cyclical spending, even if German households do not spend much of the EUR120 billion in excess savings built up over the past year. As Chart 18 shows, while US durable goods spending has already overtaken its pre-COVID highs, Germany’s continues to linger near its long-term trend. Thus, as the economy re-opens this summer, and income and employment increase, the concurrent surge in consumer confidence will allow for a recovery in cyclical spending. Chart 17Strong Household Balance Sheets
Strong Household Balance Sheets
Strong Household Balance Sheets
Chart 18Germany Too Has More Pent-up Demand Than The US
Germany Too Has More Pent-up Demand Than The US
Germany Too Has More Pent-up Demand Than The US
Chart 19Positive Message From Many Indicators
Positive Message From Many Indicators
Positive Message From Many Indicators
Various economic indicators are already pointing toward the coming German economic boom.Manufacturing orders are strong, and economic sentiment confidence is rising across most sectors. Meanwhile, consumer optimism is forming a trough, and new car registrations are climbing rapidly. Most positively, the stocks of finished goods have collapsed, which suggests that production will be ramped up to fulfill future demand (Chart 19). Bottom Line: The German economy is set to accelerate in the second half of the year and into 2022. As usual, Germany will enjoy a healthy dividend from robust global growth, but the expanding vaccination program, as well durable employee-employer relations, strong household balance sheets, and significant pent-up demand for durable goods will also fuel the domestic economy. Our base case scenario that fiscal policy will remain accommodative in the wake of a political shift to the left in Berlin in September will only supercharge this inevitable recovery. … And The Long-Term In contrast to the bright near-term perspective, the long-term outlook for the German economy remains poor. The policies of any new ruling coalition are unlikely to address the problems of Germany’s poor demography, deteriorating productivity, and large excess savings. There is potential for a productivity boost in the context of a global green energy and high-tech race but for now that remains a matter of speculation. The most obvious issue facing Germany is its ageing population, counterbalanced by its fertility rate of only 1.6. Over the course of the next three decades, Germany’s dependency ratio will surge to 80%, driven by an increase in the elderly dependency ratio of 20% (Chart 20). The working age population is set to decline by 18% by 2050, which will curtail potential GDP growth. The outlook for German productivity growth is also poor. Germany’s productivity growth has been in a long-term decline, falling from 5% in 1975 to less than 1% in 2019. Contrary to commonly-held ideas, from 1999 to 2007, German labor productivity growth has only matched that of France or Spain; since 2008, it has lagged behind these two nations, although it has bested Italy. One crucial reason for Germany’s uninspiring productivity performance is a lack of investment. Some of this reflects the country’s austere fiscal policy. For example, in 2019, Germany’s public investment stood at 2.4% of GDP, which compares poorly to the OECD’s average of 3.8%, or even to that of the US, where public investment stood at 3.6% of GDP. This poor statistic does not even account for the depreciation of the German public capital stock. Since the introduction of the euro, net public investment has averaged 0.03% of GDP. The biggest problem remains at the municipal level. From 2012 to 2019, federal and state level net investment averaged 0.2% of GDP, while municipal net investment subtracted 0.2% of GDP on average. Hopefully, the new government will be able to address this deficiency of the German economy. The Greens are most proactive but they will face obstacles. The bigger problem for German productivity is corporate capex. Corporate investments have been low in this country. Since the introduction of the euro, the contribution of capital intensity to productivity in Germany has equaled that of Italy and has underperformed France and Spain. As a result, the age of the German capital stock is at a record high and stands well above the US or Eurozone average (Chart 21). Chart 20Germany Has Poor Demographics
Germany Has Poor Demographics
Germany Has Poor Demographics
Chart 21Germany's Capital Stock Is Ageing
Germany's Capital Stock Is Ageing
Germany's Capital Stock Is Ageing
The make-up of Germany’s capex aggravates the productivity-handicap. According to a Bundesbank study, the contribution to labor productivity from information and communication technology (ICT) capital spending has averaged 0.05 percentage points annually from 2008 to 2012. On this metric, Germany lagged behind France and the US, but still bested Italy. From 2013 to 2017, the contribution of ICT investment to productivity fell to 0.02 percentage points, still below France and the US, but in line with Italy. Looking at the absolute level of ICT or knowledge-based capital (KBC) investment further highlights Germany’s challenge. In 2016, total investment in ICT equipment, software and database, R&D and intellectual property products, and other KBC assets (which include organizational capital and training) represented less than 8% of GDP. In France, the US, or Sweden, these outlays accounted for 11%, 12%, and 13% of GDP, respectively (Chart 22, top panel). This lack of investment directly hurts Germany’s capacity to innovate. The bottom panel of Chart 22 shows that, for the eight most important categories of ICT patents (accounting for 80% of total ICT patents), Germany remarkably lags behind the US, Japan, Korea, or China. Chart 22Germany Lags In ICT investment
Winds Of Change: Germany Goes Green
Winds Of Change: Germany Goes Green
A major source of Germany’s handicap in ICT and KBC investment comes from small businesses, which have been particularly reluctant to deploy capital. A study by the OECD shows that, between 2010 and 2019, the gap of ICT tools and activities adoption between Germany’s small and large companies deteriorated relative to the OECD average (Chart 23). The lack of venture capital investing probably exacerbates these problems. In 2019, venture capital investing accounted for 0.06% of Germany’s GDP. This is below the level of venture investing in France or the UK (0.08% and 0.1% of GDP, respectively), let alone South Korea, Canada, Israel, or the US (0.16%, 0.2%, 0.4% and 0.65%, respectively). The Greens claim they will create new venture capital funds but their capability in this domain is questionable. Chart 23The Lagging ICT Capabilities Of Small German Businesses
Winds Of Change: Germany Goes Green
Winds Of Change: Germany Goes Green
Since Germany’s productivity growth is likely to remain sub-par compared to rest of the OECD and to lag behind even that of France or the UK, the only way for Germany to protect its competitiveness will be to control costs. This means that Germany cannot allow its recent loss of competitiveness to continue much further (Chart 24). Thus, low productivity growth will limit Germany’s real wages. Chart 24Germany's Competitiveness Is Declining
Germany's Competitiveness Is Declining
Germany's Competitiveness Is Declining
This wage constraint will negatively impact consumption. Beyond a pop over the coming 12 to 24 months, German consumption is likely to remain depressed, as it was in the first decade and a half of the century, following the Hartz IV labor market reforms that also hurt real wages. The Greens for their part aim to boost welfare payments, raise the minimum wage, and reduce enforcement of Hartz IV. Bottom Line: German excess savings will remain wide on a structural basis. Without a meaningful pick-up in capex, German nonfinancial businesses will remain net lenders. Meanwhile, households that were worried about their financial future in a world of low real-wage growth will also continue to save a significant share of their income. Consequently, the excess savings Germany developed since the turn of the millennia are here to stay (Chart 25). In other words, Germany will continue to sport a large current account surplus and exert a deflationary influence on Europe and the rest of the world. The policy prescribed by the various parties contesting the September election will not necessarily result in new laws that will reverse the issues of low capex and low ICT investment. The Greens will worsen the over-regulation of the economy. Barring a policy revolution that succeeds in all its aims (a tall order), we can expect more of the same for Germany – that is, a slowly declining economy. Chart 25Too Much Savings, Not Enough Investments
Too Much Savings, Not Enough Investments
Too Much Savings, Not Enough Investments
Chart 26Germany Scores Well On Renewable Power
Winds Of Change: Germany Goes Green
Winds Of Change: Germany Goes Green
That being said, some bright spots exist. Germany is becoming a leader in renewable energy, and it can capitalize on the broadening of this trend to enlarge its export market (Chart 26). Investment Implications Bond Markets The economic outlook for Germany and the euro area at large is consistent with the underweighting of German bunds within European fixed-income portfolios. Bunds rank among the most expensive bond markets in the world, which will make them extremely vulnerable to positive economic surprise in Europe later this year, especially if Germany’s fiscal policy loosens up further in the wake of the September election (Chart 27). Moreover, easier German fiscal policy should help European peripheral bonds, especially the inexpensive Italian BTPs that the ECB currently buys aggressively. Thus, we continue to overweight BTPs, and add Greek and Portuguese bonds to the list. Chart 27German Bunds Are Expensive
Winds Of Change: Germany Goes Green
Winds Of Change: Germany Goes Green
Chart 28German Yields Already Embed Plenty Pessimism About Europe
German Yields Already Embed Plenty Pessimism About Europe
German Yields Already Embed Plenty Pessimism About Europe
Relative to US Treasurys, the outlook for Bunds is more complex. On the one hand, the ECB will not tighten policy as much as the Fed later this cycle; moreover, European inflation is likely to remain below US levels this year, as well as through the business cycle. On the other hand, Bunds already embed a significantly lower real terminal rate proxy and term premium than Treasury Notes (Chart 28). Netting it all out, BCA Research Global Fixed Income Strategy service believes Bunds should outperform Treasurys this year, because they have a lower beta, which is a valuable feature in a rising yield environment.6 We will closely monitor risks around this view, because it is likely that the European economic recovery will be the catalyst for the next up leg in global yields, in which case German bunds could temporarily underperform. On a structural basis, as long as Germany’s productivity issues are not addressed by Berlin, German Bunds are likely to remain an anchor for global yields. Germany will remain awash in excess savings, which will act as a deflationary anchor, while also limiting the long-term upside for European real rates. Excess savings results in a large current account surplus; thus, Germany will continue to export its savings abroad and act as a containing factor for global yields. The Euro The medium-term outlook points to significant euro upside. Our expectation of a European and German positive growth surprise over the coming 12 months is consistent with an outperformance of the euro. The fact that investors have been moving funds out of the Eurozone and into the US at an almost constant rate for the past 10 years only lends credence to this argument (Chart 29). Our view on Germany’s fiscal policy contributes to the euro’s luster. Greater German budget deficits help European economic activity and curtail risk premia across the Eurozone. This process is doubly positive for the euro. First, lower risk premia in the periphery invite inflows into the euro area, especially since Greek, Portuguese, Italian, or Spanish yields offer better value than alternatives. Second, stronger growth and lower risk premia relieve pressure on the ECB as the sole reflator for the Eurozone. At the margin, this process should boost the extremely depressed terminal rate proxy for Europe and help EUR/USD. Robust global economic activity adds to the euro’s appeal, beyond the positive domestic forces at play in Europe. The dollar is a countercyclical currency; thus, global business cycle upswings coincide with a weak USD, which increases EUR/USD’s appeal. Nonetheless, if the boost to global activity emanates from the US, then the dollar can strengthen. This phenomenon was at play in the first quarter of 2021. However, the global growth leadership is set to move away from the US over the next 12 months, which implies that the normal inverse relationship between the dollar and global growth will reassert itself to the euro’s benefit. The European balance of payments dynamics will consolidate the attraction of the euro. Germany’s and the Eurozone’s current account surplus will remain wide, especially in comparison to the expanding twin deficit plaguing the US. Beyond the next 12 to 24 months, the lack of structural vigor of Germany’s and Europe’s economy is likely to shift the euro into a safe-haven currency, like the yen and the Swiss franc. A strong balance of payments and low interest rates (all symptoms of excess savings) are the defining features of funding currencies, and will be permanent attributes of the euro area if reforms do not address its productivity malaise. The Eurozone’s net international position is already rising and its low inflation will put a structural upward bias to the Euro’s purchasing power parity estimates (Chart 30). Those developments have all been evident in Japan and Switzerland, and will likely extinguish the euro’s pro-cyclicality as time passes. Chart 29Investors Already Underweight European Assets
Investors Already Underweight European Assets
Investors Already Underweight European Assets
Chart 30Upward Bias In The Euro's Fair Value
Upward Bias In The Euro's Fair Value
Upward Bias In The Euro's Fair Value
Chart 31Germany Has Not Outperformed The Rest Of The Eurozone
Germany Has Not Outperformed The Rest Of The Eurozone
Germany Has Not Outperformed The Rest Of The Eurozone
German Equities In absolute terms, the DAX and German equities still possess ample upside over the next 12 to 24 months. BCA Research is assuming a positive stance on equities, and a high beta market like Germany stands to benefit.7 Moreover, the elevated sensitivity to global economic activity of German equities accentuate their appeal. BCA Research likes European stocks, and German ones are no exception.8 The more complex question is how to position German equities within a European stock portfolio. After massively outperforming from 2003 to 2012, German equities have moved in line with the rest of the Eurozone ever since (Chart 31). Moreover, German equities now trade at a discount on all the major valuation metrics relative to the rest of the Eurozone (Chart 31, bottom panel). The global macro forces that dictate the outlook for German equities relative to the rest of the Eurozone are currently sending conflicting messages. On the one hand, German equities normally outperform when commodity prices rally or when the euro appreciates (Chart 32). On the other hand, however, German equities also underperform when global yields rise, or following periods when Chinese excess reserves fall, such as what we are witnessing today. With this lack of clarity from global forces, the answer to Germany’s relative performance question lies within European economic dynamics. Germany is losing competitiveness relative to the rest of the Eurozone (Chart 24 page 22) which suggests that German stocks will benefit less than their peers from a stronger euro in comparison to their performance in the last decade. Moreover, German equities outperform when the German manufacturing PMI increases relative to that of the broad euro area. The gap between the German and euro area manufacturing PMI stands near record highs and is likely to narrow as the rest of the Eurozone catches up. This should have a bearing on the performance of German stocks (Chart 33). Chart 32Mixed Global Backdrop For Germany's Relative Performance
Mixed Global Backdrop For Germany's Relative Performance
Mixed Global Backdrop For Germany's Relative Performance
Chart 33A European Economic Catch-Up Would Hurt German Equities
A European Economic Catch-Up Would Hurt German Equities
A European Economic Catch-Up Would Hurt German Equities
Finally, sectoral dynamics may prove to be the ultimate arbiter. Table 4 highlights the limited difference in sectoral weightings between Germany and the rest of the Eurozone, which helps explain the stability in the relative performance over the past nine years. However, the variance is greater between Germany and specific European nations. In this approach, BCA’s negative stance on growth stocks correlates with an overweight of Germany relative to the Netherlands. Moreover, our positive outlook on financials and bond yields suggests that Germany should underperform Italian and Spanish stocks. Table 4Sectoral Breakdown Across Europe Major Bourses
Winds Of Change: Germany Goes Green
Winds Of Change: Germany Goes Green
Matt Gertken Vice President Geopolitical Strategy mattg@bcaresearch.com Mathieu Savary, Chief European Investment Strategist Mathieu@bcaresearch.com Appendix: Global Climate Policy Commitments
Winds Of Change: Germany Goes Green
Winds Of Change: Germany Goes Green
Winds Of Change: Germany Goes Green
Winds Of Change: Germany Goes Green
Footnotes 1 See Matthew Karnitschnig, "German Conservatives Mired In ‘The Swamp,’" Politico, March 24, 2021, politico.eu. 2 The Greens are interested in a range of taxes, including a carbon tax, a digital services tax, and a financial transactions tax. They are also interested in industrial quotas requiring steel and car makers to sell a certain proportion of carbon-neutral steel and electric vehicles. See an excellent interview with Ms. Baerbock in Ileana Grabitz and Katharina Schuler, "I don’t have to convert the SUV driver in Prenzlauer Berg," Zeit Online, January 2, 2020, zeit.de. 3 See her comments to Zeit Online. 4 Please see BCA Research Global Investment Strategy Strategy Outlook "Second Quarter 2021 Strategy Outlook: Inflation Cometh?", dated March 26, 2021, available at gis.bcareseach.com. 5 Please see BCA Research European Investment Strategy Special Report "A Temporary Decoupling", dated April 5, 2021, available at eis.bcareseach.com. 6 Please see BCA Research Global Fixed Income Strategy Strategy Report "Harder, Better, Faster, Stronger", dated March 16, 2021, available at gfis.bcareseach.com. 7 Please see BCA Research Global Income Strategy Strategy Outlook "Second Quarter 2021 Strategy Outlook: Inflation Cometh?", dated March 26, 2021, available at gis.bcareseach.com. 8 Please see BCA Research European Income Strategy Strategy Report "Time And Attraction", dated April 12, 2021, available at eis.bcareseach.com.
According to BCA Research’s Emerging Markets Strategy service, EM banks will underperform their DM peers in the next six months. Banks in emerging markets outside China, Korea, and Taiwan (Province of China) will experience higher NPLs than their DM peers.…
Highlights Higher copper prices will follow in the wake of China's surge in steel demand, which lifted Shanghai steel futures to an all-time high just under 5,200 RMB/MT earlier this month, as building and infrastructure projects are completed this year (Chart of the Week). Copper will register physical deficits this year and next, which will pull inventories even lower and will push demand for copper scrap up in China and globally. High and rising copper prices could prompt government officials to release some of China's massive state holdings of copper – believed to total some 2mm MT – if the current round of market jawboning fails to restrain demand and price increases. Strong steel margins and another round of environmental restraints on mills are boosting demand for high-grade iron ore (65% Fe), which hit a record high of just under $223/MT earlier this week. Benchmark iron ore prices (62% Fe) traded at 10-year highs this week, just a touch below $190/MT. We are lifting our copper price forecast for December 2021 to $5.00/lb from $4.50/lb. In addition, we are getting long 2022 CME/COMEX copper vs short 2023 CME/COMEX copper at tonight's close, expecting steeper backwardation. Feature Government-mandated reductions of up to 30% in steel mill operations for the rest of the year in China's Tangshan steel hub to reduce pollution will tighten an already-tight market responding to a construction and infrastructure boom (Chart 2). This boom triggered a surge in steel prices, and, perforce, in iron ore prices (Chart 3). As it has in the past, this sets the stage for the next leg of copper's bull run. Chart of the WeekSurging Steel Presages Stronger Copper Prices
Surging Steel Presages Stronger Copper Prices
Surging Steel Presages Stronger Copper Prices
In our modeling, we have found a strong relationship between steel prices, particularly for reinforcing bar (rebar), and copper prices, as can be seen in the Chart of the Week. Steel goes into building and infrastructure projects at the front end (in the concrete that is reinforced by steel and in rolled coil products), and then copper goes into the completed project (in the form of wires or pipes). Chart 2Copper Bull Market Will Continue
Copper Bull Market Will Continue
Copper Bull Market Will Continue
In addition to the building and construction boom, continued gains in manufacturing will provide a tailwind for copper prices, which will be augmented by the global recovery in activity 2H21. Chart 4 shows the relationship between nominal GDP levels and copper prices. What's important here is economic growth in Asia (including China) and ex-Asia is, unsurprisingly, cointegrated with copper prices – i.e., economic growth and industrial commodities share a long-term equilibrium, which explains their co-movement. Chart 3Steel Boom Lifts Iron Ore Prices
Steel Boom Lifts Iron Ore Prices
Steel Boom Lifts Iron Ore Prices
Media reports tend to focus on the effects of Chinese government spending as a share of GDP – e.g., total social financing relative to GDP – to the exclusion of the economic, particularly when trying to explain commodity price movements. To the extent the Chinese government is successful in further expanding the private sector – on the goods and services sides – organic economic growth will become even more important in explaining Chinese commodity demand. Chart 4Global Economic Grwoth Will Boost Copper Prices
Global Economic Grwoth Will Boost Copper Prices
Global Economic Grwoth Will Boost Copper Prices
In our copper modeling, we find copper prices to be cointegrated with nominal Chinese GDP, EM Asian GDP and EM ex-Asian GDP, along with steel and iron ore prices, which, from a pure economics point of view, is what would be expected. On the other hand, there is no cointegration – i.e., no economic co-movement or a shared trend – between these industrial commodity prices and total social financing as a percent of nominal China GDP. These models allow us to avoid spurious relationships, which offer no help in explaining or forecasting these copper prices. Chart 5Iron Ore, Copper Demand Will Lift With The "Green Energy" Buildout
Copper Headed Higher On Surge In Steel Prices
Copper Headed Higher On Surge In Steel Prices
Chart 6Renewables Dominate Incremental New Generation
Copper Headed Higher On Surge In Steel Prices
Copper Headed Higher On Surge In Steel Prices
Longer term, as we have written in past research reports, the transition to a low-carbon energy mix favoring distributed renewable electricity generation, more resilient grids and electric vehicles (EVs) will be a major source of demand growth for bulks like iron ore and steel, and base metals, particularly copper (Chart 5).1 Already, renewable generation represents the highest-growth segment of incremental power generation being added to the global grid (Chart 6). Copper Supply Growth Requires Higher Prices Copper supply will have a difficult time accommodating demand in the short term (to end-2022) when, for the most part, the buildout in renewables and EVs will only be getting started. This means that over the medium (to end-2025) and the long terms (2050) significant new supply will have to be developed to meet demand. In the short term, the supply side of refined copper – particularly the semi-refined form of the metal smelters purify into a useable input for manufactured products (condensates) – is running extremely low, as can be seen in the longer-term collapse of Treatment Charges and Refining Charges (TC/RC) at Chinese smelters (Chart 7). At ~ $22/MT last week, these charges were the lowest since the benchmark TC/RC index tracking these charges in China was launched in 2013, according to reuters.com.2 Chart 7Copper TCRCs Fall As Supplies Fall, Pushing Prices Higher
Copper TCRCs Fall As Supplies Fall, Pushing Prices Higher
Copper TCRCs Fall As Supplies Fall, Pushing Prices Higher
The copper supply story also can be seen in Chart 8, which converts annual supply and demand into balances, which will be mediated by the storage market. The International Copper Study Group (ICSG) estimates mine output again registered flat year-on-year growth last year, while refined copper supplies were up a scant 1.5% y/y. Chart 8Physical Deficits Will Draw Copper Stocks...
Physical Deficits Will Draw Copper Stocks...
Physical Deficits Will Draw Copper Stocks...
Consumption was up 2.2%, according to the ICSG's estimates, which expects a physical deficit this year of 456k MT, after adjusting for Chinese bonded warehouse stocks. This will mark the fourth year in a row the copper market has been in a physical deficit, which, since 2017, has averaged 414k MT. The net result of this means inventories will once again be relied on to fill in supply gaps, and global stockpiles, which are down ~25% y/y, and will continue to fall (Chart 9). With mining capex weak and copper ore quality falling, higher prices will be required to incentivize significant new investment in production (Chart 10). However, the lead time on these projects is five years in the best of circumstances, which means miners have to get projects sanctioned with final investment decisions made in the near future (Chart 11). Chart 9...Which After Four Years Of Physical Deficits Are Low
...Which After Four Years Of Physical Deficits Are Low
...Which After Four Years Of Physical Deficits Are Low
Chart 10Higher Copper Prices Required To Reverse Weak Capex, Falling Ore Quality
Higher Copper Prices Required To Reverse Weak Capex, Falling Ore Quality
Higher Copper Prices Required To Reverse Weak Capex, Falling Ore Quality
Chart 11Falling Lead Times To Bring New Mines Online, But Time Is Short
Copper Headed Higher On Surge In Steel Prices
Copper Headed Higher On Surge In Steel Prices
Investment Implications Our focus on copper is driven by the simple fact that it spans all renewable technologies and will be critical for EVs as well, particularly if there is widespread adoption of this technology (Chart 12). We continue to expect copper supply challenges across the short-, medium- and long-term investment horizons. To cover the short term, we recommended going long December 2021 copper on 10 September 2020, and this position is up 39.2%. To cover the longer term, we are long the S&P Global GSCI commodity index and the iShares GSCI Commodity Dynamic Roll Strategy ETF (COMT), recommended 7 December 2017 and 12 March 2021 , respectively, which are down 2.3% and 0.8%. Chart 12Widespread EV Uptake Will Create All New Copper Demand
Copper Headed Higher On Surge In Steel Prices
Copper Headed Higher On Surge In Steel Prices
At tonight's close, we will cover the medium-term opportunity of the copper supply-demand story developed above by getting long the 2022 CME/COMEX copper futures strip and short 2023 CME/COMEX copper futures strip, given our expectation the continued tightening of the market will force inventories to draw, leading to a steeper backwardation in the copper forward curve. The principal risks to our short-, medium- and long-term positions above are a global failure to contain the COVID-19 pandemic, which, we believe is a short-term risk. Second among the risks to these positions is a large release of strategic copper concentrate reserves held by China's State Reserve Bureau (aka, the State Bureau of Minerial Reserves). In the case of the latter risk, the actual holdings of the Bureau are unknown, but are believed to be in the neighborhood of 2mm MT.3 Bottom Line: We remain bullish industrial commodities, particularly copper. Robert P. Ryan Chief Commodity & Energy Strategist rryan@bcaresearch.com Commodities Round-Up Energy: Bullish Texas is expected to add 10 GW of utility-scale solar power by the end of 2022, according to the US EIA. Texas entered the solar market in a big way in 2020, installing 2.5 GW of capacity. The EIA expects The Great State to add ~ 5GW per year in the next two years, which would take total solar capacity to just under 15 GW. Roughly 30% of this new capacity is expected to be built in the Permian Basin, home to the most prolific oil field in the US. By comparison, the leading producer of solar power in the US, California, will add 3.2 GW of new solar capacity, according to the EIA (Chart 13). To end-2022, roughly one-third of total new solar generation in the will be added in Texas, which already is the leading wind-powered generator in the country. Wind availability is highest during the nighttime hours, while solar is most abundant during the mid-day period. Precious Metals: Bullish Palladium prices, trading ~ $2,876/oz on Wednesday, surpassed their previous record of $2,875.50/oz set in February 2020 and are closing in on $3,000/oz, as supply expectations continue to be lowered by Russian metals producer Nornickel, the largest palladium producer in the world (Chart 14). Earlier this week, the company updated earlier guidance and now expects mine output to be down as much as 20% this year in its copper, nickel and palladium operations, due to flooding in its mines. Palladium is used as a catalyst in gasoline-powered automobiles, sales of which are expected to rebound as the world emerges from COVID-19-induced demand destruction and a computer-chip shortage that has limited new automobile supply. In addition, production of platinum-group metals (PGMs) is being hampered by unreliable power supply in South Africa, which has forced the national utility suppling most of the state's power (> 90%) to revert to load-shedding schemes to conserve power. We remain long palladium, after recommending a long position in the metal 23 April 2020; the position is up 35.6%. Chart 13
Copper Headed Higher On Surge In Steel Prices
Copper Headed Higher On Surge In Steel Prices
Chart 14
Palladium Prices
Palladium Prices
Footnotes 1 Please see, e.g., Renewables, China's FYP Underpin Metals Demand, which we published 26 November 2020. It is available at ces.bcaresearch.com. 2 Please see RPT-COLUMN-Copper smelter terms at rock bottom as mine squeeze hits: Andy Home published by reuters.com 14 April 2021. The report notes direct transactions between miners and smelters were reported as low as $10/MT, in a sign of just how tight the physical supply side of the copper market is at present. 3 Please see Column: Supercycle or China cycle? Funds wait for Dr Copper's call, published by reuters.com 20 April 2021. Investment Views and Themes Recommendations Strategic Recommendations Tactical Trades Commodity Prices and Plays Reference Table Trades Closed in 2021 Summary of Closed Trades
Higher Inflation On The Way
Higher Inflation On The Way
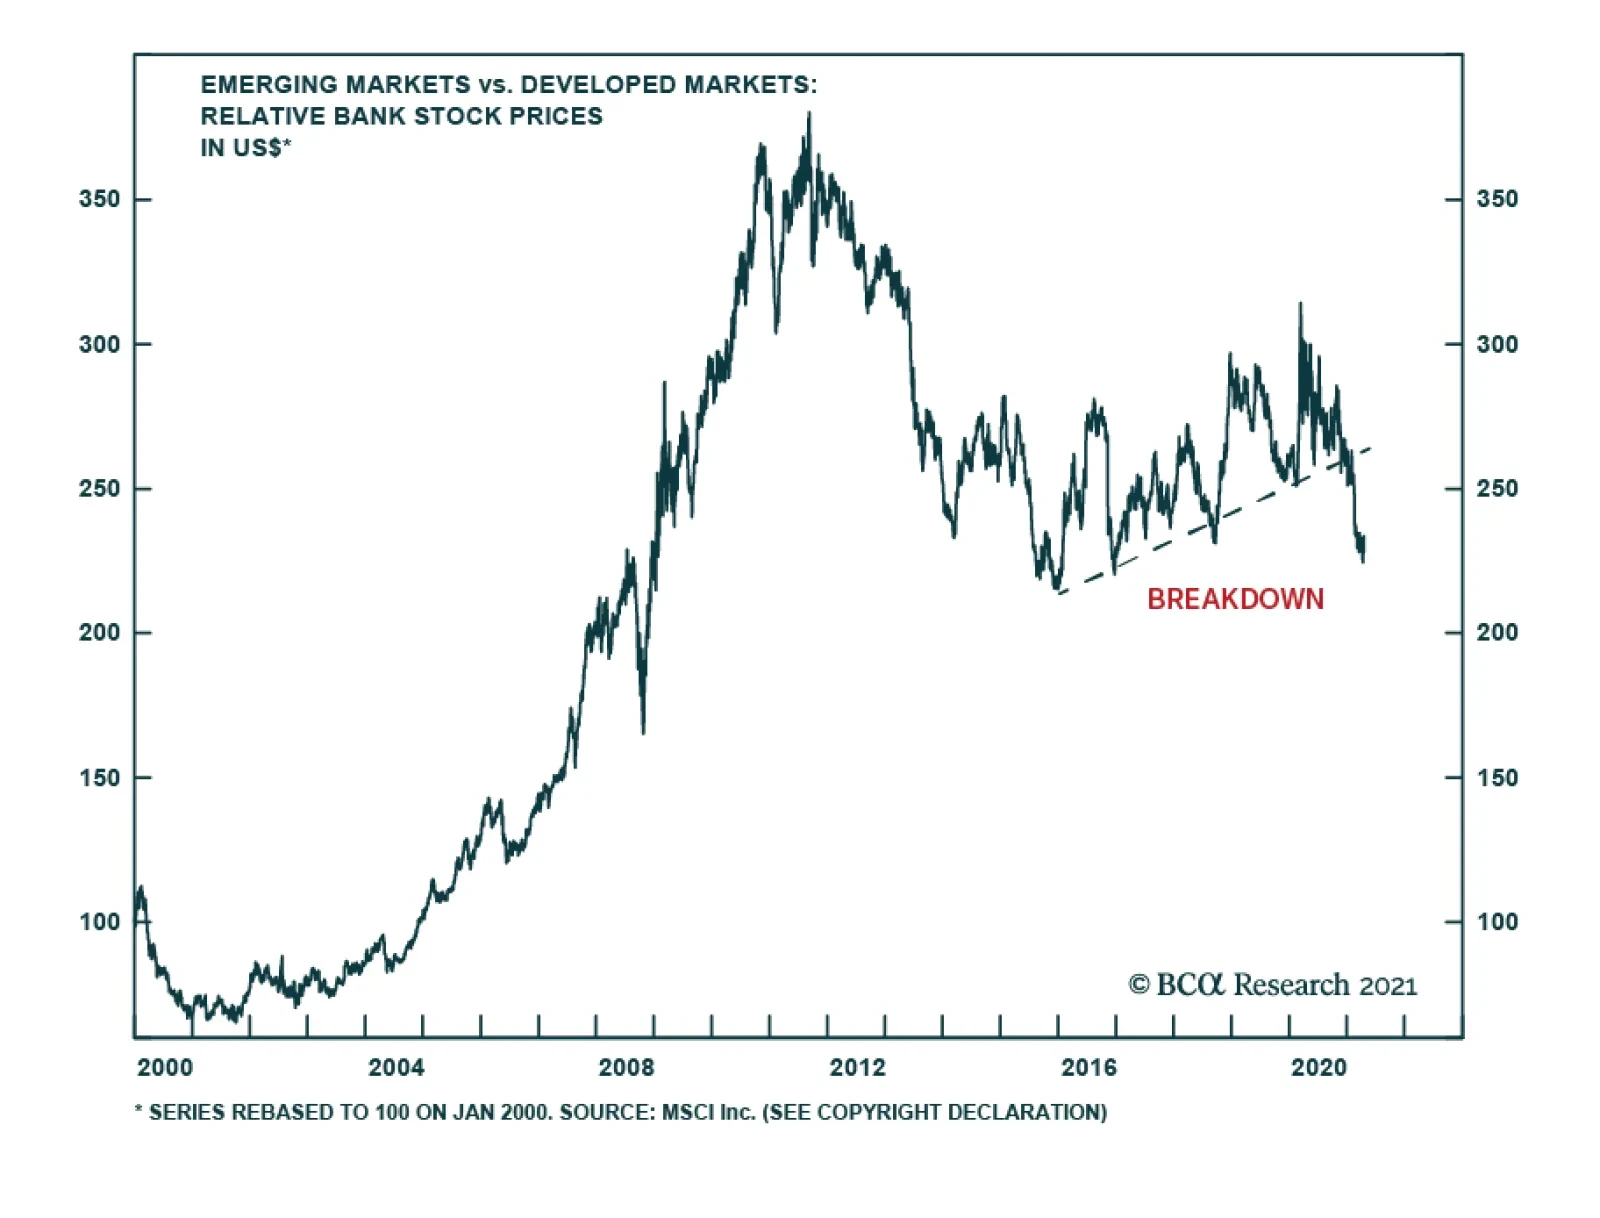
Highlights EM banks will underperform their DM peers in the next six months due to worsening relative NPL dynamics and shrinking net interest margins. EM banks will either continue experiencing rising NPLs and moribund loan demand due to restrictive lending rates or will have to reduce their lending rates, which will considerably shrink their net interest margins. In both scenarios, EM bank profits will be damaged. Besides, EM is facing an unfriendly macro cocktail of booming US growth and a slowing China. This could cause a capital exodus from EM in the coming months depressing EM currencies and precluding many central banks from cutting interest rates proactively. Feature Chart 1EM vs. DM Banks: More Underperformance Ahead
EM vs. DM Banks: More Underperformance Ahead
EM vs. DM Banks: More Underperformance Ahead
We recommend initiating the short EM banks / long DM banks strategy. There has been a major technical breakdown in EM share prices versus DM peers (Chart 1). When discussing EM banks for the purpose of macro analysis, we separate Chinese, Korean and Taiwanese banks from their EM peers. The basis is that the banking systems in China, Korea and Taiwan1 face different cyclical and structural outlooks than in the rest of EM. Bank assets-to-GDP ratios are much more elevated and the monetary and fiscal policies have more flexibility in China, Korea and Taiwan than in EM. Chart 2Fiscal Thrust In EM And DM
Fiscal Thrust In EM And DM
Fiscal Thrust In EM And DM
Reason #1: Higher NPLs In EM Than DM As a result of the pandemic lockdowns, bank NPLs have surged both in EM and DM. However, DM banks have begun to pare down the NPL provisions they had built over the past year. By contrast, NPLs in EM economies will linger due to persisting economic weakness. In fact, EM banks might need to boost their NPL provisions, further eroding their profits. DM policymakers have provided much more fiscal support to their economies than the governments in EM (ex-China, Korea and Taiwan). The fiscal thrust in these EM economies will be negative in 2021 while it is expected to be positive in the US and neutral in the euro area (Chart 2). Chart 3 shows the fiscal thrust across individual EM economies. The fiscal thrusts in Russia and Brazil are the most negative. In EM (ex-China, Korea, Taiwan), the prime lending rates have declined but are still high both in nominal terms (around 10%) and in real terms (6.5%) (Chart 4, top and middle panels). In our opinion, these levels of prime lending rates are restrictive for EM economies and will both inhibit loan demand and undermine debtors’ ability to service debt. Consistently, bank loan growth remains very muted in EM (ex-China, Korea, Taiwan) (Chart 4, bottom panel). Chart 32021 Fiscal Thrust In Individual EM Countries
Short EM Banks / Long DM Banks
Short EM Banks / Long DM Banks
The pandemic is lingering in several developing countries and their vaccination efforts are trailing those of DM. Consequently, the pace and timing of a full economic recovery in EM will lag those in DM. Chart 5 illustrates that retail sales and auto purchases in EM (ex-China, Korea, Taiwan) remain lackluster. Chart 4EM Bank Lending Rates Are Restrictive
EM Bank Lending Rates Are Restrictive
EM Bank Lending Rates Are Restrictive
Chart 5EM Ex-China, Korea And Taiwan: Domestic Demand Is Lackluster
EM Ex-China, Korea And Taiwan: Domestic Demand Is Lackluster
EM Ex-China, Korea And Taiwan: Domestic Demand Is Lackluster
Reason #2: Net Interest Margin Squeeze For EM Banks EM banks are facing a dilemma. They have a choice between: continuing to experience rising NPLs and moribund loan demand due to restrictive lending rates, which will also undermine bank profits; and/or significantly reducing their lending rates to spur new lending and to help debtors service their loans. In such a case, their net interest margins and profits will shrink. In a nutshell, the fact that borrowers are struggling despite lending rates being much lower than they have been in the past boils down to underlying productivity and return on capital. Both have downshifted considerably in EM (ex-China, Korea, Taiwan) economies. This was true before the pandemic erupted and is also true at present. Chart 6EM Banks: Net Interest Margin And EPS
EM Banks: Net Interest Margin And EPS
EM Banks: Net Interest Margin And EPS
In brief, the only way for EM banks to avoid escalating NPLs is to reduce lending rates. Yet, the latter will erode their net interest margins and depress their profits. Chart 6 demonstrates that net interest rate margins have been an important driver of banks’ EPS growth and they currently point to weaker bank earnings. Notably, there is little room for EM (ex-China, Korea, Taiwan) central banks to cut their policy/short rates. Doing so could trigger a weakness in their currencies at a time when US growth is booming, and US bond yields are under upward pressure. Overall, any decline in prime lending rates will produce a net interest margin squeeze for banks in EM (ex-China, Korea, Taiwan). In China, authorities have been clear that they expect banks to reduce their lending rates for SMEs even though the central bank does not plan on cutting short-term rates. Such pressure on mainland banks will intensify as growth slows in H2 2021. Hence, Chinese banks are also experiencing a net interest margin contraction. Reason #3: An Unfriendly Macro Cocktail For EM Our major global theme for 2021 is an economic boom in the US and a slowdown in China. Such a global macro dynamic warrants a rebound in the US dollar and a pullback in commodities prices. The US economy will be booming in H2 2021 facilitated by the general reopening of the economy, massive fiscal stimulus, rising employment and income growth as well as the release of pent-up demand for services. The Chinese economy is about to decelerate, as foretold by the rollover in money and credit impulses (Chart 7). China’s slowdown will lead to a decline in commodities prices and EM currencies (Chart 8). Chart 7China Is Set To Slow Down
China Is Set To Slow Down
China Is Set To Slow Down
Chart 8Commodities And EM Currencies Are At Risk
Commodities And EM Currencies Are At Risk
Commodities And EM Currencies Are At Risk
Finally, one of the best leading indicators for EM EPS has been China’s narrow money growth. Chart 9 demonstrates that the latest rollover in Chinese narrow money growth heralds a slowdown in EM EPS later this year. Chart 9China's Narrow Money Heralds EM EPS Slowdown In H2
China's Narrow Money Heralds EM EPS Slowdown In H2
China's Narrow Money Heralds EM EPS Slowdown In H2
EM’s business cycle is very sensitive to China’s growth because many emerging economies sell to China as much if not more than to the US. An impending slowdown in China will cause a meaningful setback in commodities prices and will depress terms of trade for many EM (ex-China, Korea, Taiwan) economies. In turn, a booming US economy will herald higher US bond yields. Together, these dynamics will likely precipitate a rebound in the US dollar. In sum, such a macro cocktail could cause a capital exodus from EM in the coming months, depressing EM currencies and precluding many central banks from cutting interest rates proactively. As a result, EM local currency bond yields will not fall much, especially in vulnerable EM countries. Chart 10EM Ex-China, Korea And Taiwan: Banks Perform Poorly When Local Yields Rise
EM Ex-China, Korea And Taiwan: Banks Perform Poorly When Local Yields Rise
EM Ex-China, Korea And Taiwan: Banks Perform Poorly When Local Yields Rise
Chart 10 demonstrates that the rise in EM local currency yields (shown inverted on the chart) is typically negative for EM (ex-China, Korea, Taiwan) bank stocks. This is opposite to the dynamics in the US and in Europe where bank share prices rally when bond yields rise. Reason #4: Chinese Bank Stocks Remain A Value Trap Market cap of Chinese bank stocks represents 25% of the MSCI EM bank index. Hence, the performance of Chinese bank share prices contributes significantly to the MSCI EM bank stock index. Chinese commercial banks’ assets have expanded 1.5-fold since early 2009 (Chart 11). The overwhelming part of this expansion has been driven by loan origination, purchases of corporate bonds and various claims on local governments and their affiliated vehicles. We have written often and at length that there is no link between trends in bank assets and national or household savings. Critically, banks do not intermediate deposits into loans or savings into credit. This holds true in all countries around the world. Following such an epic credit boom in China since 2009, one would typically expect creditors in general and banks in particular to undertake a profound cleansing of their balance sheets, and for the amounts involved to be colossal. However, Chinese banks have not yet done this on a meaningful scale. We estimate that banks have disposed – written-off and sold – RMB 9.4 trillion in loans since 2012, which is equivalent to 6.6% of all loans originated since January 2009 (when the credit boom commenced). In addition, banks’ NPL provisions remain very low at 3.4% of their loan book. In a nutshell, Chinese banks have not yet sufficiently cleansed their balance sheets and carry a lot of non-recognized bad loans/assets. Investors doubt the quality of the banks’ books. As a result, Chinese banks’ share prices have been in limbo over the last ten years (Chart 12, top panel). Chart 11Chinese Bank Assets: An Epic Boom
Chinese Bank Assets: An Epic Boom
Chinese Bank Assets: An Epic Boom
Chart 12Bank Stocks Have Been In Limbo In China, Japan, Korea And Taiwan
Bank Stocks Have Been In Limbo In China, Japan, Korea And Taiwan
Bank Stocks Have Been In Limbo In China, Japan, Korea And Taiwan
Provided that this issue of mainland bank asset quality is well known, the government will not allow a full-fledged banking crisis. However, authorities will also not recapitalize banks without current shareholders experiencing losses. Overall, Chinese bank share prices might share the fate of Japanese bank stocks. The latter has been in a secular bear market even though Japan has never had an acute credit crisis (Chart 12, second panel). In a nutshell, Korean and Taiwanese bank share prices have also delivered very poor returns over the past 20 years, even though these banks have not had an acute crisis and the credit-to-GDP ratios in these economies have been rising (Chart 12, third and fourth panels). The upshot is that a rising credit penetration is not sufficient to produce value for bank shareholders. The quality of credit assets, profit margins and the starting points of both equity valuation and bank capital adequacy matter for forward returns on bank stocks. A Word On Bank Stock Valuations Chart 13EM Ex-China, Korea And Taiwan: Banks Price-To-Book Value Ratio
EM Ex-China, Korea And Taiwan: Banks Price-To-Book Value Ratio
EM Ex-China, Korea And Taiwan: Banks Price-To-Book Value Ratio
Even though Chinese bank stocks trade at very low multiples – the price-to-book value (PBV) ratio is presently 0.6, the latter represents a value trap. For comparison, the PBV ratio is 0.5 in Korea and 1.2 in Taiwan. Excluding China, Korea and Taiwan, the EM bank PBV ratio is well below its historical mean (Chart 13). However, this aggregate conceals the wide disparity among EM banks. Chart 14 plots banks’ return on equity (RoE) over the past 12 months on the X-axis and their PBV ratio on the Y-axis. There is a clear positive correlation between RoE and the PBV ratio. Chart 14A Comparative Valuation Matrix For Global Bank Stocks
Short EM Banks / Long DM Banks
Short EM Banks / Long DM Banks
Combining bank equity valuations and country macro fundamentals, within the EM bank space we favor banks in India, Mexico, Korea, the Czech Republic, Russia (barring a major military conflict in Ukraine) and Singapore. On the other hand, the most vulnerable are bank share prices in Brazil, Peru, Turkey, the Philippines, Malaysia and Indonesia. Concerning Chinese banks, we continue advocating the long large banks/short small and medium bank stocks strategy. The rationale is that a lot of bad news is already discounted in large bank stocks and little in listed small and medium bank stocks. In particular, the PBV ratio is 0.7 for large banks and 1.3 for small and medium banks. More so than large banks, small and medium banks are at risk from the new asset management regulation that will be implemented by the end of this year. Investment Recommendations We initiate a short EM banks / long DM banks position. This is a medium-term strategy for the next six months. This strategy is consistent with our tactical underweight in EM stocks versus DM stocks that we recommended on March 25. From a structural perspective, we continue recommending a neutral allocation to EM within a global equity portfolio. Today we are also publishing a report on India that highlights near-term downside risks to this bourse due to surging COVID-19 cases. Worryingly, the number of new cases in India might stay exceptionally high for a while due to several potential super-spreader events. As a result, we recommend that asset allocators with less tolerance for volatility tactically downgrade India to neutral in an EM equity portfolio. Long-term investors should continue overweighting the Indian bourse. Chart 15Move Peruvian Stocks From Neutral To Underweight
Move Peruvian Stocks From Neutral To Underweight
Move Peruvian Stocks From Neutral To Underweight
Finally, Peruvian bank stocks have been plunging on the heels of left-wing candidate Pedro Castillo lead in the presidential electionspolls ahead of the second round on June 6th. Chart 15 shows that surging NPLs (shown inverted) herald more downside in bank share prices. Consequently, in the context of political uncertainty, rising NPLs and a potential decline in metal prices, we are downgrading Peruvian equities from neutral to underweight. Arthur Budaghyan Chief Emerging Markets Strategist arthurb@bcaresearch.com Footnotes 1 We refer to Taiwan (Province of China) herein in the report as Taiwan. Equities Recommendations
Short EM Banks / Long DM Banks
Short EM Banks / Long DM Banks
Currencies, Credit And Fixed-Income Recommendations
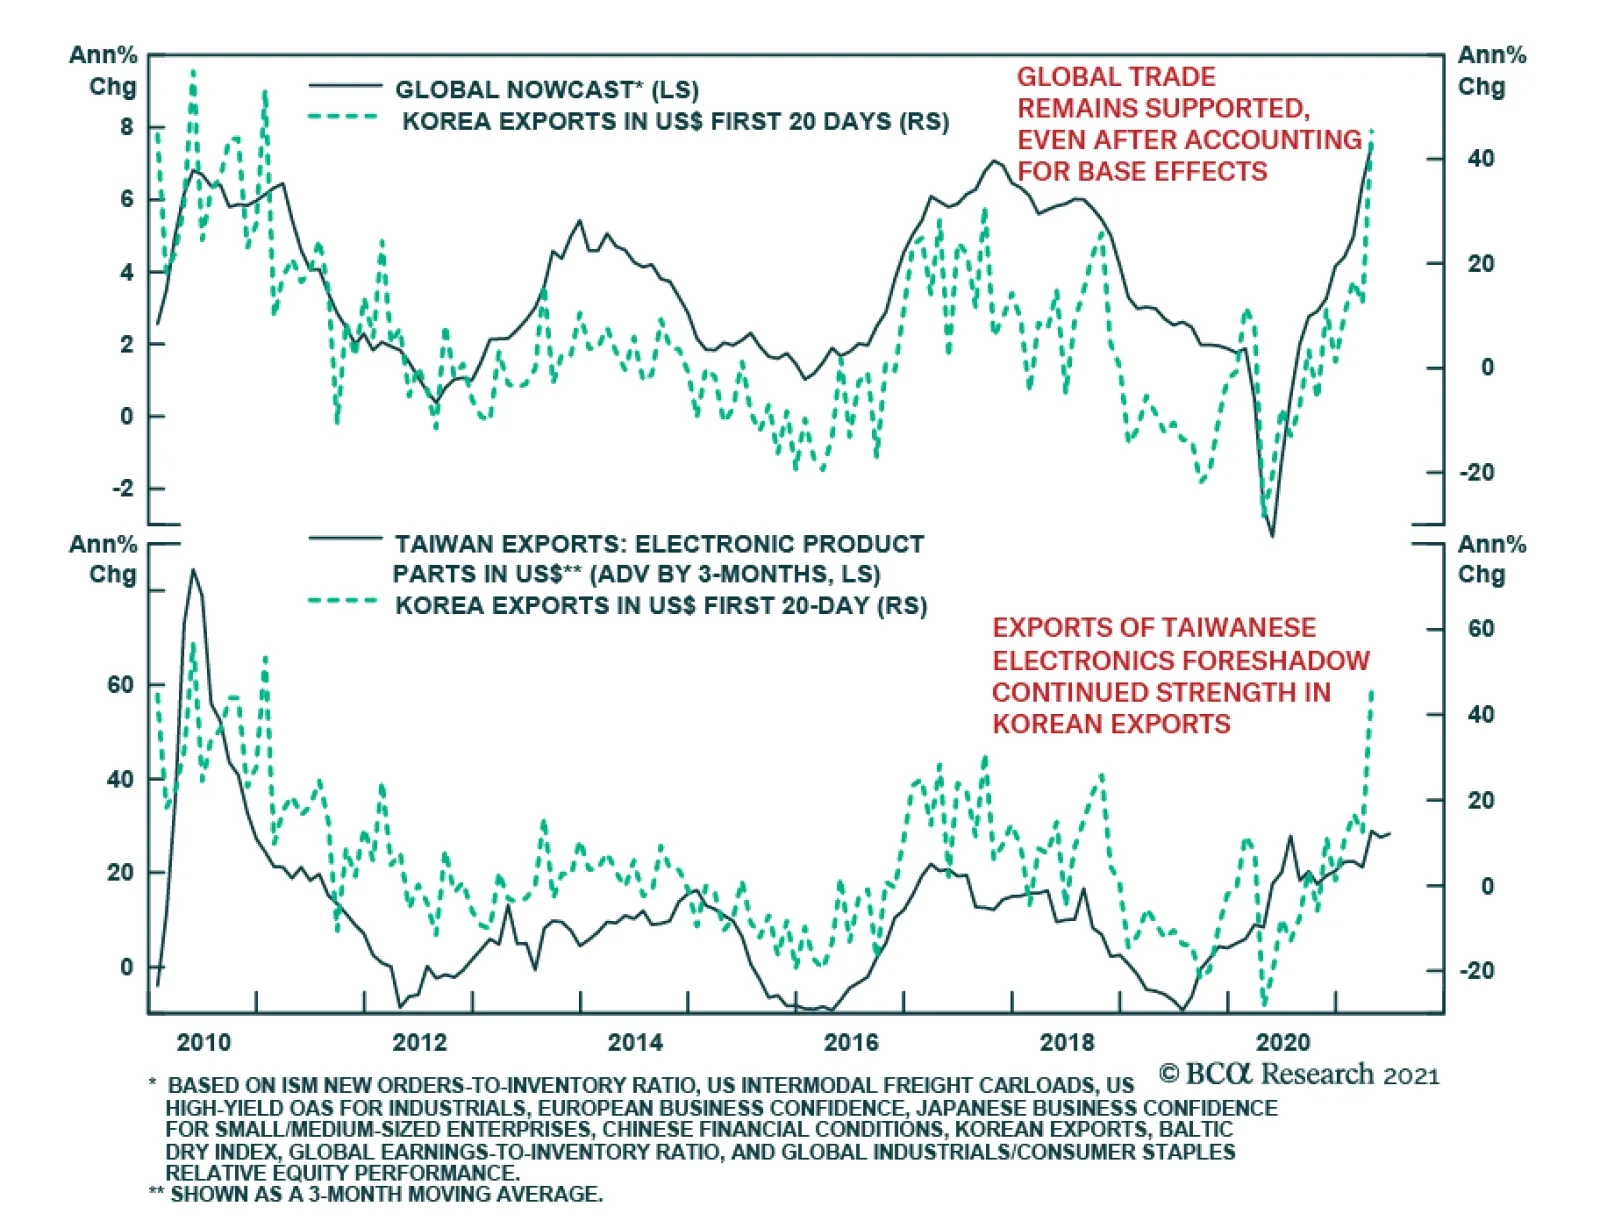
South Korea’s exports suggest that the global trade recovery is intact. Exports surged 45.4% y/y for the first 20 days in April following a 12.5% y/y increase in March. On an average working day basis, export increased by 36% y/y increase. The y/y…
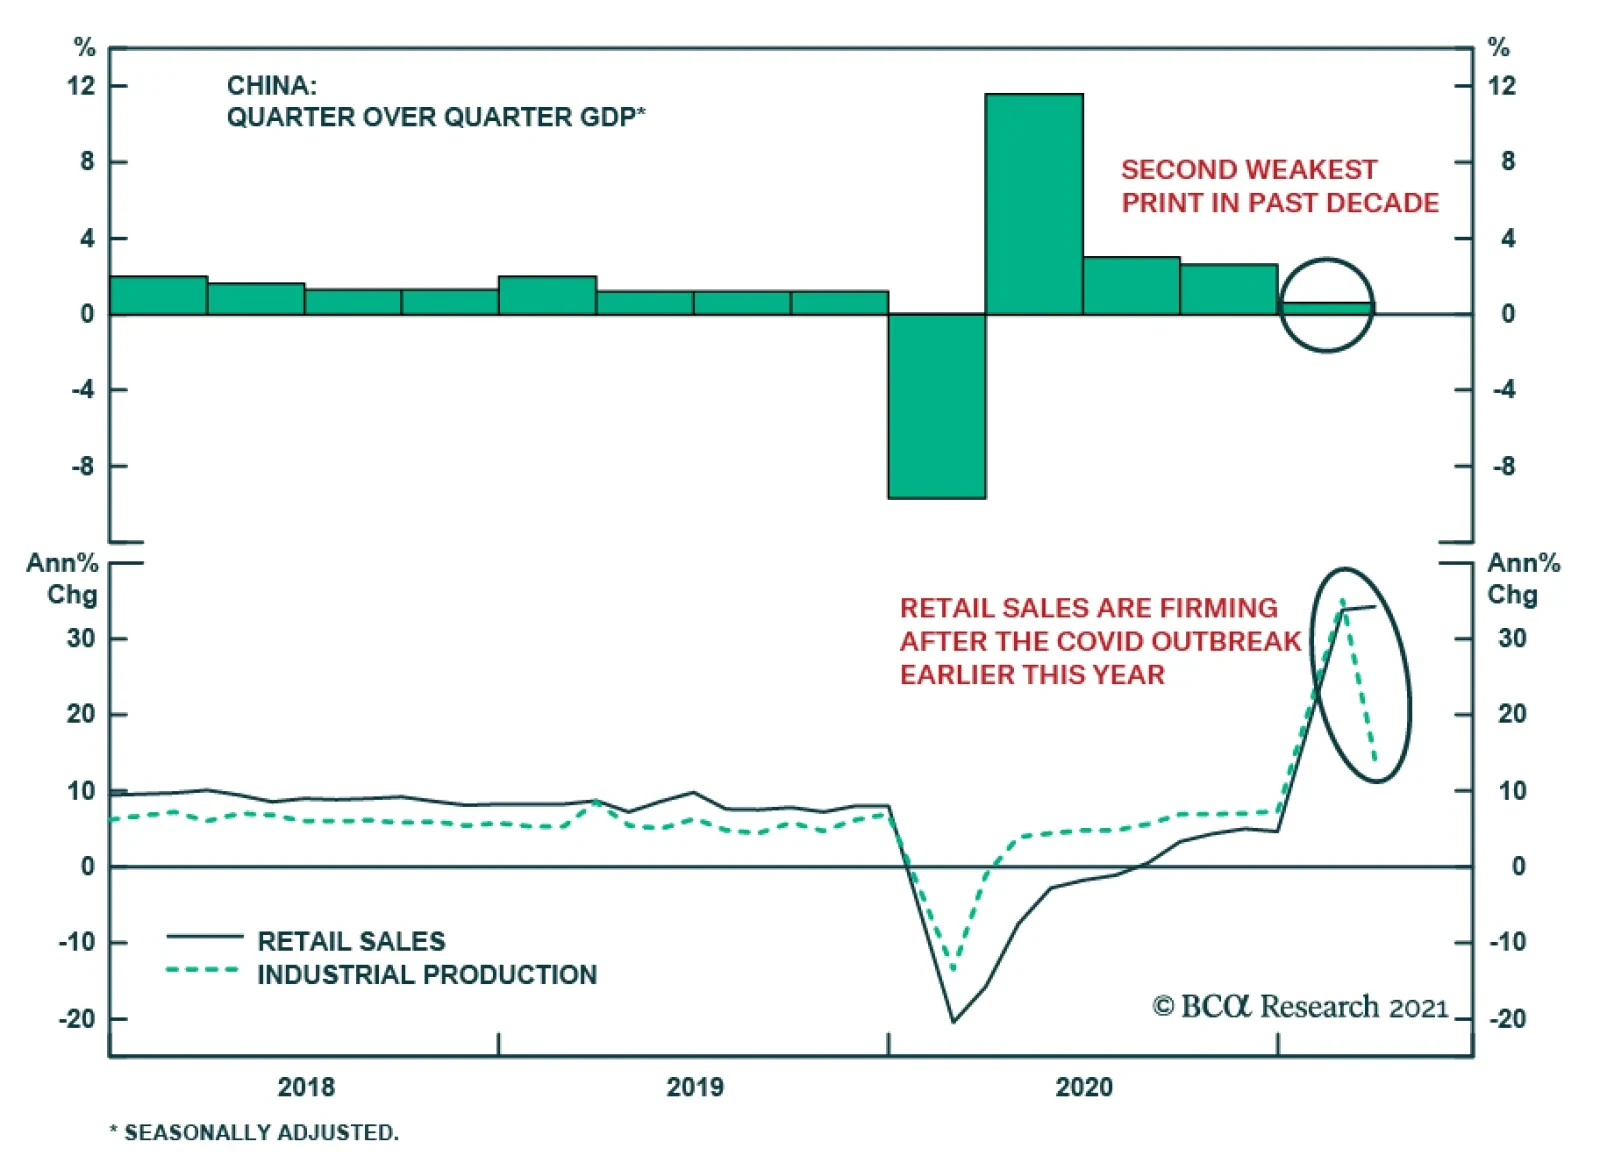
China’s GDP release shows the economy growing by a colossal 18.3% y/y in Q1. However, this figure is highly distorted by the pandemic-induced economic collapse last year. Instead, the quarter-on-quarter comparison reveals a sharp deceleration in activity last…