Emerging Markets

Highlights Geopolitical risk is rising once again after a big drop-off in risk during the pandemic and snapback. The Biden administration faces three critical foreign policy tests: China/Taiwan, Russia/Ukraine, and Israel/Iran. Russia could stage a military incursion into Ukraine that would cause a risk-off event. However, global markets would get over it relatively quickly since a total invasion of all Ukraine is unlikely. Iran is nearing the “breakout” threshold of uranium enrichment which will prompt more Israeli demonstrations of its red line against nuclear weaponization. Iran will retaliate. So far our view is on track that tensions will escalate prior to the resolution of a US-Iran deal by August. Taiwan is the most market relevant of all geopolitical risks – but the South China Sea is another scene of US-China saber-rattling. A crisis here is most important if connected to Taiwan. Go long CAD-RUB and CHF-GBP. Feature Chart 1Traffic In The World’s Most Dire Straits
Jaw-Jaw Or War-War?
Jaw-Jaw Or War-War?
British Prime Minister Harold Macmillan, quoting Sir Winston Churchill, once said, “Jaw-jaw is better than war-war.”1 President Joe Biden would undoubtedly prefer jaw-jaw as he faces three imminent foreign policy tests that raise tail-risks of war: Chinese military intimidation of Taiwan, a Russian military build-up on the Ukrainian border, and Iranian acceleration of its nuclear program. All of these areas are heating up simultaneously and a crisis incident could easily occur, causing a pullback in bond yields and equity markets. One way of illustrating the seriousness of these conflicts is to look at the volume of global trade that goes through the relevant geographic chokepoints: the Taiwan Strait, the Strait of Malacca, the Strait of Hormuz, and the Bosphorus Strait (Chart 1). Oil and petroleum products serve as a proxy for overall traffic. The recent, short-lived blockage of the Suez Canal provides an inkling of the magnitude of disruption that is possible if conflict erupts in one of these global bottlenecks. In this report we review recent developments in Biden’s foreign policy tests. Our views are mostly on track. Investors should prepare tactically for more geopolitical risk to be priced into global financial markets, motivating safe-haven flows and potentially a general equity pullback. Cyclically the bull market will continue, barring the worst-case scenarios. Biden’s Three Foreign Policy Tests Biden’s three foreign policy tests are all intensifying as we go to press: China/Taiwan: China is continuing a high-intensity pace of “combat drills” and live-fire drills around the island of Taiwan.2 The US is sending a diplomatic delegation to Taiwan against Beijing’s wishes and is set to deliver a relatively large arms sale to the island. Yet Washington has sent John Kerry, its “climate czar,” to Beijing to set up a bilateral summit between Presidents Biden and Xi Jinping for Earth Day, in a bid to find common ground. Biden’s overarching review of US China policy is due sometime in May. Russia/Ukraine: Russia has amassed more than 85,000 troops on its border with Ukraine and in Crimea, the largest build-up since it invaded Ukraine in 2014-15. Russia has withdrawn its ambassador to Washington and warned that it will retaliate if the US imposes any new sanctions. The US is doing just that, with new sanctions leveled in response to Russian cyberattacks and election interference, including a block on sales of Russian ruble-denominated sovereign bonds from June. Hence Russian retaliation is looming. Israel/Iran: Shortly after the March 23 election, Israel sabotaged the underground Natanz Fuel Enrichment Plant in Iran, prompting the Iranians to declare that they will retaliate on Israeli soil. They also claim they will now enrich uranium to a 60% level, which pushes them close to the 90%-plus levels needed to make a nuclear device. American and Israeli officials had previously signaled that Iran would reach “breakout” levels of weapons-grade uranium between April and August. Negotiations are underway but the process will be beset by attacks. We have written extensively on the Taiwan dynamic this year as it is the most relevant for global investors. In this report we will update the Russian and Iranian situations first and then proceed to China. Bottom Line: Geopolitical risk is back after a reprieve during the pandemic. The new US administration faces three serious foreign policy tests at once. Financial markets have mostly ignored the rise in tensions but we expect safe-haven assets to catch a bid in the near term. However, we have not yet altered our bullish cyclical view. So far we are still in the realm of “jaw-jaw” rather than “war-war,” as we explain in the rest of this report. Stay Short Russia And EM Europe The return of the Democratic Party to power in Washington has led to an immediate increase in US-Russian tensions. The Biden administration is eschewing a diplomatic reset and instead pursuing great power competition. The US is increasing its arms sales and NATO military drills with Ukraine. It is imposing sanctions over Russian cyberattacks and election interference, including taking a long-awaited step against the purchase of ruble bonds. Washington could also force Germany to cancel the Nord Stream II pipeline. However, there are also mitigating signs. President Biden has offered to hold a bilateral summit with President Vladimir Putin in a third country and the two may meet at his Earth Day summit. The US Navy also called back the USS Donald Cook and USS Roosevelt destroyers from going into the Black Sea, after Moscow warned that any American warships in that sea would be in danger, especially if they go near Crimea. Washington’s new volley of sanctions are not truly tantamount to Russian interference in American elections and they do not include new measures on Nord Stream II. An American move to insist that Germany cancel Nord Stream before construction ends would provoke Russia to retaliate. The purpose of Nord Stream is to bypass Ukraine and cement direct economic ties between Russia and Germany. Germany’s government continues to support the project despite Russia’s build-up on the border with Ukraine and suppression of political dissidents. If the US vetoes the pipeline then it is denying Russia access to legitimate trade and restricting Russia’s export options to the Ukrainian route. If the US simultaneously increases military cooperation with Ukraine then it is implicitly trying to control Russia’s energy access to Europe. Russia will likely retaliate by punishing Ukraine. Russia could take aggressive action in Ukraine or elsewhere regardless of what the US does on Nord Stream or in its Ukraine outreach. Russia is struggling with a weak domestic economy and social unrest. Moscow has a record of foreign adventurism when popular support wanes. Moreover legislative elections loom in September. Thus Russia may have an independent reason to stir up conflict in Ukraine, at least for the next half year, that cannot be deterred. Judging by capabilities, Russia has deployed enough troops to stage a military incursion into the breakaway Donbass region of Ukraine. The Russian army build-up on the border is the largest since 2014 – large enough to put most of Russian-speaking Ukraine at risk. A full-scale Russian invasion of all of Ukraine is unlikely but not impossible. It would be extremely costly both in blood and treasure – not only in occupying a hostile Ukraine but also in unifying the West against Russia, the opposite of what Moscow is trying to accomplish (Chart 2). Moscow will want to avoid this outcome unless the US shuts down Nord Stream or tries to bring Ukraine into NATO. Chart 2Russia’s Constraints Over Ukraine
Jaw-Jaw Or War-War?
Jaw-Jaw Or War-War?
From the market’s point of view, intensified fighting in Ukraine between the government and Russian-backed rebels is status quo. This is inevitable and will not have a major impact on global equities. The invasion of Crimea in 2014 led to a maximum 2% drawdown in the S&P 500. It was the shooting down of Malaysian Airline 17, not Russia’s invasion of Ukraine, that shook up financial markets in 2014. Global equities fell by 2.7%, Eurostoxx 500 by 6.2% and Russian equities by 10.7%. Note that the Russian military did ultimately participate in the fighting in 2014-15, it was not only Russian-backed separatists, so global financial markets can stomach that kind of conflict fairly well as long as it is limited to Ukraine, especially disputed regions, and as long as the US and NATO do not get involved. They are disinclined to fight for Ukraine, leaving it vulnerable. A larger flight to safety would occur if Russia pursued the total conquest of all of Ukraine. This is small probability but high impact. It would cause a major global risk-off because it would raise the risk of a larger war on the continent for the first time since World War II. Russia is obsessed with Ukraine from the point of view of grand strategy and national security and will take at least some military action if it deems it necessary. Investors should be prepared for escalation – though neither Washington nor Moscow has yet taken a fatal step. It is important to watch for any aggressive Ukrainian actions but Ukraine is not the main driver of action. The current situation is reminiscent of that in the Republic of Georgia in 2008, when Russia provoked President Mikhail Saakashvili into taking action against separatists that Russia then used as a pretext for intervening and breaking away Abkhazia and South Ossetia. While Ukrainian President Volodymyr Zelenskiy could be baited into a conflict, it is also true that fear of getting baited could result in hesitation that allows Russia to seize the initiative, as occurred in Ukraine in 2014. So for the Ukrainians it is “damned if you do, damned if you don’t.” Russia’s actions will largely depend on its own interests. So far Russian equities have lagged other emerging market equities and the commodity rally, which may partly reflect elevated political and geopolitical risk (Chart 3). The trend for Russian equities can easily get worse from here. Given Russia’s interest in conflict with the West ahead of the September elections, Russian-Ukrainian tensions could persist for most of this year. A major military campaign becomes more probable after mid-May when the weather improves. Russian currency and assets will remain under pressure. We recommend going long the Canadian dollar relative to the Russian ruble. The ruble will underperform commodity currencies as a whole, including the Mexican peso, if Russia intervenes militarily, judging by the Crimea conflict in 2014 (Chart 4). Meanwhile Canadian and Mexican currencies should benefit from the fact that the US economy is hyper-stimulated and rapidly vaccinating. Chart 3Russia Lagged Commodity Rally
Russia Lagged Commodity Rally
Russia Lagged Commodity Rally
Chart 4Favor Loonie And Peso Over Ruble
Favor Loonie And Peso Over Ruble
Favor Loonie And Peso Over Ruble
Chart 5Long DM Europe / Short EM Europe
Long DM Europe / Short EM Europe
Long DM Europe / Short EM Europe
We continue to overweight developed Europe and underweight emerging Europe (Chart 5). Poland, Hungary, the Czech Republic, Romania, and the Baltic states will see a risk premium due to current tensions. The Czech Republic faces considerable political uncertainty surrounding its legislative election in October, an opportunity for Russia to interfere or for anti-establishment (albeit pro-EU) parties to rise to power. What would it take for Biden and Putin to de-escalate? The US and NATO could diminish Ukraine relations, downgrade democracy promotion and psychological counter-warfare, and allow Nord Stream to be completed. Russia could reduce its troop presence on the border and lend a helping hand on the Iranian nuclear deal and Afghanistan withdrawal. This is a risk to our view. Bottom Line: Russia and emerging European markets are some of the few truly cheap markets in the emerging market equity universe (Table 1). Yet the current geopolitical context looks to keep them cheap. For now investors should be prepared for the West’s conflict with Russia to escalate in a major way. At minimum we need to know whether the US will halt Nord Stream II’s construction before taking a more bullish view on EM Europe. Table 1Geopolitical Risk Helps Keep Russia And EM Europe Cheap
Jaw-Jaw Or War-War?
Jaw-Jaw Or War-War?
The worst-case scenario of a full-blown Russian conquest of Ukraine has a small probability but cannot be ruled out. Iran Negotiations: First Explosions, Then A Nuclear Deal Israel has not put together a government after its March 23 election, although Prime Minister Benjamin Netanyahu has the opportunity to lead a government again which means no change in national policy so far. Moreover the Israeli public and political establishment are unified in their opposition to Iran’s regional and nuclear ambitions. Immediately after the Iranians inaugurated new centrifuges at the Natanz nuclear facility, on April 11, the Israelis allegedly sabotaged the facility underground facility in an attack that was supposedly not limited to cyber means and that deactivated a range of centrifuges. An Iranian scientist fell into a crater and hurt himself. The Iranians have vowed retaliation on Israeli soil. More fundamentally their politics are shifting in a hardline direction, to be confirmed with the election of a hawkish president in June, which will exacerbate the mutual antagonism. This power transition is a major reason we have identified the inauguration in August as a key deadline for the US to rejoin the 2015 nuclear deal (the Joint Comprehensive Plan of Action). If the Biden administration cannot get it done by that time then a much more dangerous, multi-year negotiation will get underway. The Israeli attack has not stopped negotiations in the short term, however. The second round of talks begins in Vienna as we go to press. The US has also confirmed it will withdraw from Afghanistan on September 11, which says to Iran that Biden is determined to reduce the US’s strategic footprint in the region, reinforcing the US desire for a deal. The Israelis will continue to underscore their red line against the Iranian nuclear and missile programs in the coming months through clandestine attacks. However, they were not able to stop the US from signing a nuclear deal with Iran in 2015 and they are not likely to stop the US today. They are still bound by a fundamental constraint. Israel needs to maintain its alliance with the United States, which ensures its long-term security against both Iran and the Middle East’s general instability (Chart 6). The Iranians will retaliate against Israel, making it likely that this summer will feature tit-for-tat attacks. These could include critical infrastructure. Iran may also continue its campaign against enemies in Iraq and Saudi Arabia, thus triggering unplanned oil outages and pushing up the oil price. A glance at Israeli, Saudi Arabian, and UAE stock markets suggests that global investors have largely ignored the geopolitical risks so far but may be starting to respond to the likely escalation in conflict prior to any US-Iran deal (Chart 7). Chart 6Israel’s Constraints Over Iran
Jaw-Jaw Or War-War?
Jaw-Jaw Or War-War?
The US, Germany, France, Russia, and China are all officially on board with getting the Iranians back into compliance with the deal. A return to compliance would need to be phased with US sanctions relief. The Iranians demand that the US ease sanctions first, since it was the US that unilaterally walked away from the deal and re-imposed sanctions in 2018. Chart 7Saudi, UAE, Israeli Stocks Signal Danger
Saudi, UAE, Israeli Stocks Signal Danger
Saudi, UAE, Israeli Stocks Signal Danger
Ultimately Biden is capable of making the first move since the American public shows very little concern about Iran. Biden himself is acting on behalf of a strong consensus in Washington that an Iranian deal is necessary to stabilize the region and enable the US to devote more strategic attention to Asia Pacific. Will Russia and China support the Iranian deal, given their simultaneous conflicts with the United States? As long as the US and Iran are satisfied with returning to the existing deal – which begins to expire in 2025 – there is little need for Russia or China to do anything. However, if Washington wants a better deal, then it will have to make major concessions to Moscow and Beijing. A new and better deal would require years to negotiate. Chart 8Russo-Chinese Cooperation Grows
Jaw-Jaw Or War-War?
Jaw-Jaw Or War-War?
Russia and China supported the original nuclear deal because they saw an opportunity to limit the proliferation of nuclear weapons, which dilutes their own power. A Middle Eastern nuclear arms race is not in their interest. Iran is also a useful strategic partner for Russia and China in the Middle East and they are not averse to seeing Iran’s economy grow stronger in order to perpetuate its regime. They are wagering that liberalization of the Iranian economy will not result in liberalization of its politics – it certainly did not in the case of Russia or China – and therefore they will still have an ally but it will be more economically sound and influential. The Russo-Chinese strategic partnership has grown dramatically over the past decade. Both countries share an interest in undermining US global leadership and stoking American internal divisions. Both share an interest in reducing the US military presence near their borders, particularly in strategic territories and seas that they consider essential to their security and political legitimacy. Russia increasingly depends on Chinese demand for its exports and Chinese investment for developing its resources. Neither country trusts the other’s currency for trade but both have a shared interest in diversifying away from the US dollar (Chart 8). Chart 9China Offers Helping Hand On Iran?
China Offers Helping Hand On Iran?
China Offers Helping Hand On Iran?
In cooperating with the US on Iran, Russia and China will expect the US to respect their demands on strategic areas much closer to their core interests. If the Biden administration continues to upgrade its trade and defense relations with Ukraine and Taiwan then Moscow and Beijing will push back aggressively and could at that point prevent or undermine any deal with Iran. China is at least officially enforce sanctions on Iran (Chart 9). Its strategic partnership with Iran is constantly in a state of negotiation – until the US clarifies its sanctions regime. Clearly China hopes to extract concessions from the Americans for cooperation on nuclear threats. This is also the case with North Korea, where a missile crisis would be useful for China’s purposes in creating the need for Chinese arbitration. China sees a chance to persuade Biden to remove restrictions imposed by President Trump. If the Biden administration’s hawkishness on China is confirmed in the coming months, then China’s willingness to cooperate will presumably change. Bottom Line: Israel is underscoring its red lines against Iranian nuclear weaponization and this will cause an increase in conflict this spring and summer. But it is not yet preventing the US and Iran from renegotiating the 2015 nuclear deal. We still expect Biden to agree to a deal by August. Taiwan And The South China Sea For global financial markets the most important test facing Biden lies in the US-China relationship and tensions over the Taiwan Strait. We will not rehash our recent research and arguments on this issue. Suffice it to say that we see a 60% chance of some kind of crisis over the next 12-24 months, including a 5% chance of full-scale war. The odds of total war can rise rapidly in the event of domestic Chinese instability, a game-changing US arms sale, or a Taiwanese declaration of independence. The greatest deterrent to a full Chinese attack on Taiwan – the reason for our current 5% odds – is that it would result in a devastating blowback against the Chinese economy. China’s trade with the developed world, in addition to Taiwan, makes up 63% of exports, or 11% of GDP (Chart 10). Beijing is ultimately willing to pay this price – or any price – to “unify” the country. But it will not do so frivolously. Each passing year gives China greater global economic leverage and greater military capability over Taiwan. Chart 10China’s Constraints Over Taiwan
Jaw-Jaw Or War-War?
Jaw-Jaw Or War-War?
China is increasing its purchases of US treasuries, which waned during the trade war (Chart 11). China often increases purchases when interest rates rise and markets have seen a rapid increase in treasury yields since the vaccine discovery in November. There is no indication from this point of view that China is preparing for outright war with the United States, although this is admittedly a limited measure that could be misleading. What about a crisis other than war? What do we mean when we say “some kind of crisis” over Taiwan? A major gray zone would be economic sanctions or an economic embargo. While China cut back on tourism after Taiwan’s nominally pro-independence party won the election in 2016, and all tourism ground to a halt with COVID-19, there is no evidence of a broader embargo so far (Chart 12). This could change overnight. While US law forbids an embargo on Taiwan, this is precisely an area where Beijing might wish to test the US’s commitment. Chart 11China Buys More US Treasuries
China Buys More US Treasuries
China Buys More US Treasuries
The current high pressure on Taiwan stems in large part from the confluence of new US export controls and the global semiconductor shortage. China cannot yet meet its domestic demand for semiconductors and it cannot develop advanced computer chips fast enough without the US and its allies (Chart 13). Chart 12No Embargo On Taiwan (Yet)
No Embargo On Taiwan (Yet)
No Embargo On Taiwan (Yet)
If the Biden administration pursues a full technological blockade then China may be forced to take tougher action on Taiwan. But if Biden pursues a more defensive strategy then a new equilibrium will develop that spares China the risks of war. Chart 13China's Demand For Semiconductors
China's Demand For Semiconductors
China's Demand For Semiconductors
The US and China are simultaneously escalating their naval confrontation in the South China Sea, particularly around the Philippines. US and Chinese aircraft carrier groups and other ships have been circling each other as Beijing attempts to intimidate the Philippines and shake its trust in the defense treaty with the US. China claims the South China Sea as its own – and its efforts to deny the US access will be met with US assertions of freedom of navigation, which could lead to sunken ships. The strategic importance of the South China Sea is similar to that of the Taiwan Strait: Chinese control of these bodies of water would threaten Taiwan’s, Japan’s, and South Korea’s supply security while weakening America’s strategic position in the region. We have long highlighted the elevated risks of proxy war for Vietnam and the Philippines but these are hardly issues of global concern compared with Northeast Asia’s security. While Taiwan is far more relevant to global investors, due to the semiconductor issue, there are ample opportunities for a crisis to erupt in the South China Sea. A crisis in this sea cannot be dismissed as marginal because it could involve direct US-China conflict or, worst case, it could be a prelude to action on Taiwan, as China would seek to control the approaches to the island. The final risk in this region is that North Korea has restarted ballistic missile tests. As stated above, a crisis would be well-timed from China’s point of view. For investors, however, North Korea is largely a distraction from the critical Taiwan Strait. It could feed into any risk-off sentiment. Bottom Line: US-China relations are still unsettled and a clash could emerge over the South China Sea and Korean peninsula just as it could emerge over the Taiwan Strait. The Taiwan Strait remains the most significant geography. A direct US-China clash in the South China Sea could cause a global selloff but the markets would recover quickly, unless it is linked to a conflict over Taiwan. Investment Takeaways Geopolitical risk is reviving after a reprieve during the COVID-19 pandemic. That does not mean that frictions will lead straight into war. Diplomacy is possible. If the US, China, Russia, and Iran choose “jaw-jaw” over “war-war” then the global equity rally will see another leg up. From a tactical point of view, however, our arguments above should demonstrate that at least one of Biden’s early foreign policy tests is likely to escalate into a geopolitical incident that prompts negative impacts either in regional or global equity markets. Markets are not prepared for these risks to materialize. Standard measures of global policy uncertainty have fallen sharply for most countries. It is notable that two of the few countries in the world seeing rising policy uncertainty are China and Russia. The latter is likely due to domestic instability – which is a major motivator for an aggressive foreign policy (Chart 14). Chart 14AGlobal Policy Uncertainty Will Revive
Global Policy Uncertainty Will Revive
Global Policy Uncertainty Will Revive
Chart 14BGlobal Policy Uncertainty Will Revive
Global Policy Uncertainty Will Revive
Global Policy Uncertainty Will Revive
Global fiscal stimulus remains exceedingly strong – it is likely to peak this year. Chart 15 shows the latest update in fiscal stimulus for select countries, comparing the COVID-19 crisis to the 2008 financial crisis. There are some notable changes to previous versions of this chart, mostly due to revisions in GDP after last year’s shock, revisions in tax revenues due to the rapid economic snapback, and revisions to the timing and size of stimulus packages. The Biden administration’s $2.3 trillion infrastructure plan is obviously not included. The second panel of Chart 15 shows the changes in the IMF’s estimates from October 2020 to April 2021. Essentially the fiscal stimulus in 2020 was overestimated, as many measures did not kick in and the economic snapback was better than expected, whereas the 2021 stimulus is larger than expected. Russia and China are notable for tightening policy sooner than others – leading to a reduction in IMF estimates of fiscal stimulus for both years. Chart 15Revising Our Global Fiscal Stimulus Chart
Jaw-Jaw Or War-War?
Jaw-Jaw Or War-War?
Commodities have been a major beneficiary of the global recovery (Chart 16). Chinese growth is likely to decelerate this year which will spark a pullback, even aside from geopolitical crises. However, from a cyclical perspective commodities, especially industrial metals, should benefit from limited supply and surging demand. Geopolitical crises and even wars would first be negative but then positive for metals. Chart 16Commodities To Benefit From Geopolitical Conflict
Commodities To Benefit From Geopolitical Conflict
Commodities To Benefit From Geopolitical Conflict
Notably the US is embracing industrial policy alongside China and the EU. In particular the US is joining the green energy race with Biden’s $2.3 trillion American Jobs Plan containing about $370 billion in green initiatives and likely to pass Congress later this year. Symbolically Biden will emphasize the US’s attempt to catch up with Chinese and European green initiatives via his hosting of a global summit on April 22-23 for Earth Day. A brief word on the British pound. We took a tactical pause on our cyclically bullish view of the pound in February in anticipation of the Scottish parliamentary election on May 6. A strong showing by the Scottish National Party could lead to a second independence referendum. This party is flagging in the polls but independence sentiment has ticked back up, reinforcing our point that a nationalist surprise could take place at the ballot box (Chart 17). Once we have clarity on the prospect of a second referendum we will have a clearer view on the pound over the medium term. Chart 17Pound Sees Short-Term Risk From Scots Election
Pound Sees Short-Term Risk From Scots Election
Pound Sees Short-Term Risk From Scots Election
Chart 18Long CHF-GBP For A Tactical Trade
Long CHF-GBP For A Tactical Trade
Long CHF-GBP For A Tactical Trade
In the near term, we continue to pursue tactical safe-haven trades and hedges. Our tactical long Swiss franc trade was stopped out at 5% on March 25. But our Foreign Exchange Strategist Chester Ntonifor has since highlighted that the franc is excessively cheap (Chart 18). This time we recommend a tactical long CHF-GBP, which has an attractive profile in the context of geopolitical risk, taken together with the British political risk highlighted above. Matt Gertken Vice President Geopolitical Strategy mattg@bcaresearch.com Footnotes 1 “Jaw-Jaw Is Best, Macmillan Finds,” New York Times, January 30, 1958, nytimes.com. 2 Taiwan – Province of China.
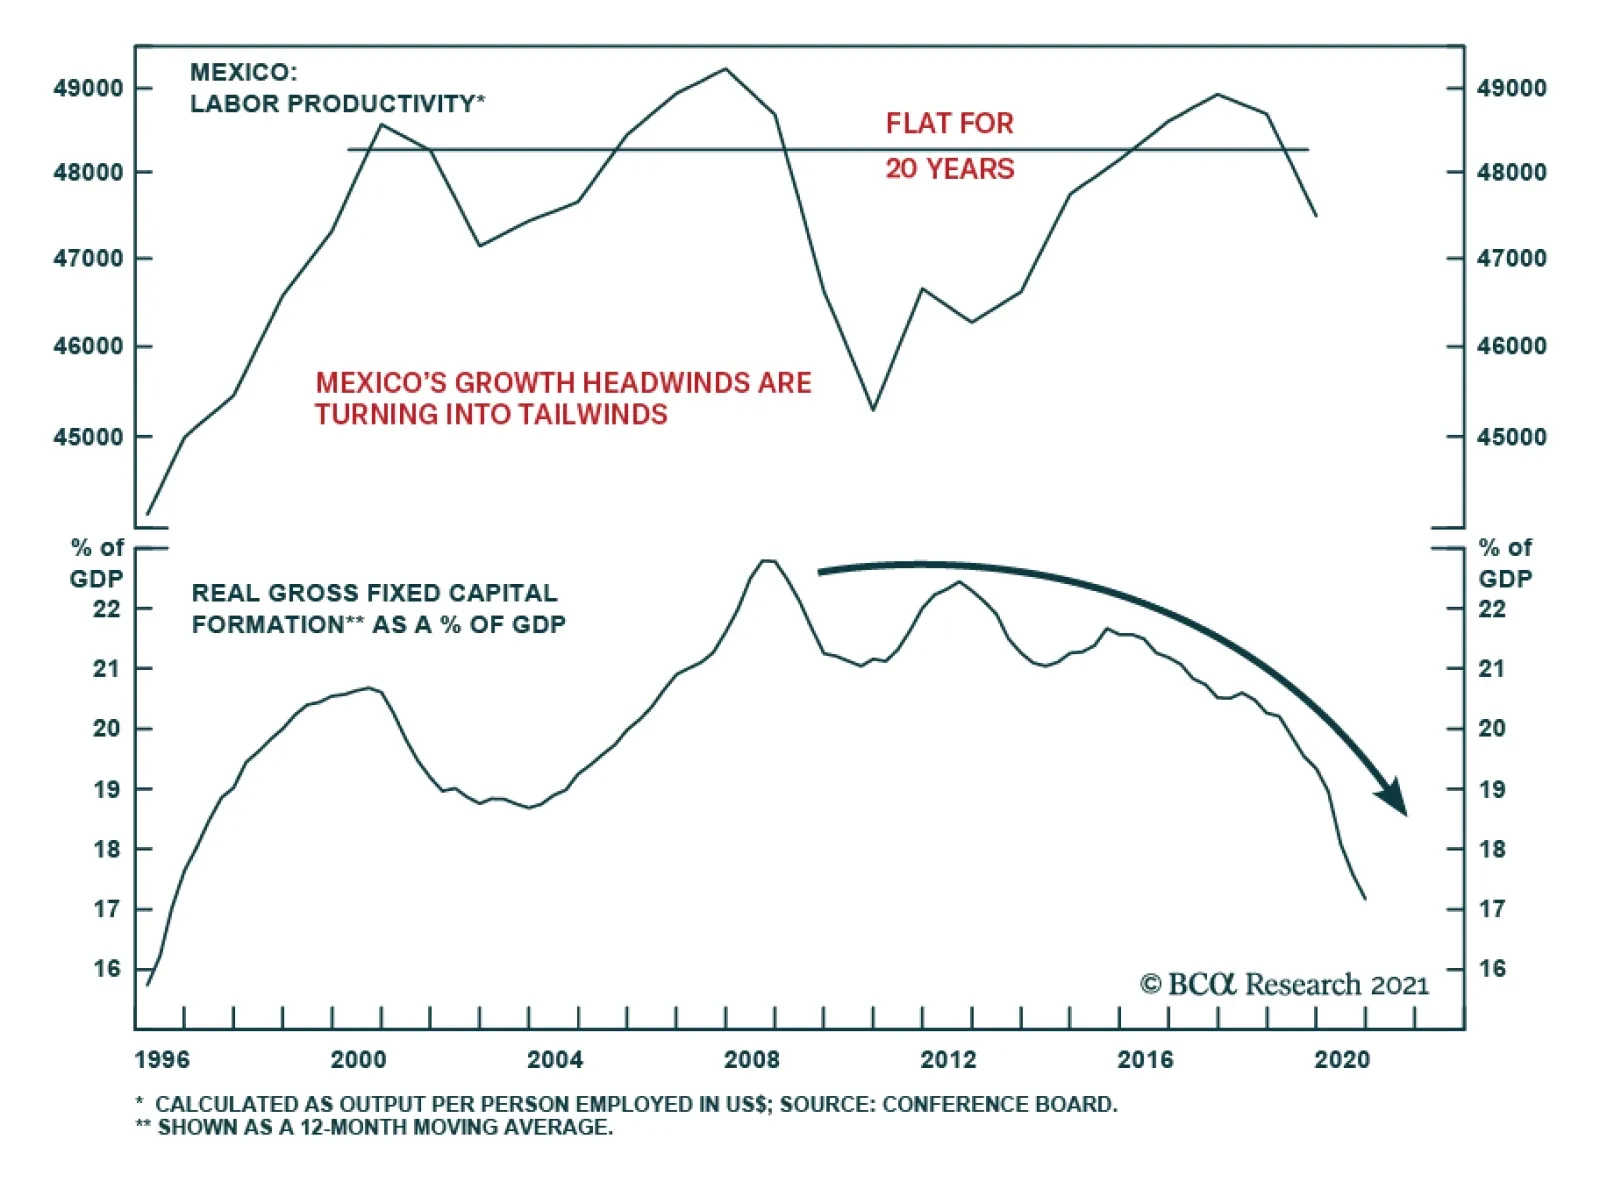
The Mexican economy was hit by a perfect storm in the last few years. But the stars are now beginning to align. The country’s growth headwinds – sluggish productivity, lack of investment, tight fiscal and monetary policies and manufacturing competition from…
Highlights The prevalence of oligopolies and monopolies in a number of industries as well as lack of investment in hard and soft infrastructure have been the underlying cause of sluggish productivity growth in Mexico. This has weighed on per capita income growth. Mexico’s growth headwinds – manufacturing competition from China, tight fiscal and monetary policies – are now turning into tailwinds. A boom in the US economy in general and manufacturing in particular bode well for Mexico. On the domestic front, Mexico needs to adopt a more inclusive growth model. This requires dismantling monopolies/oligopolies, promoting SMEs, reducing the cost of doing business, spending considerably more on vocational training and university education, as well as reducing violence. Mexican financial markets stand to outperform other emerging markets because they are the most leveraged to booming US growth and the least exposed to China’s slowdown Investors should use a potential correction in the coming weeks/months to buy Mexican assets in absolute terms. Feature Chart 1Mexican Markets Are Facing A Technical Resistance
The Stars Are Aligning For Mexico
The Stars Are Aligning For Mexico
Domestic and external factors have aligned to produce a period of economic and financial market outperformance for Mexico over the next several years. We expect Mexican equities, the peso as well as local bonds and sovereign credit to outperform their EM peers. Further, Mexican share prices in US dollar terms and the peso will eventually break above their major technical resistance lines (Chart 1). Growth Diagnostics It is tempting to blame Mexico’s economic underperformance on the election of leftist president Andrés Manuel López Obrador (or AMLO). Yet, the economy was already performing poorly long before 2019 when AMLO assumed office. Chart 2 illustrates productivity in Mexico has been stagnant since 2000. Inferior productivity growth has been the critical factor explaining Mexico’s structural growth stagnation. Lack of investment in hard and soft infrastructure is the underlying cause of sluggish productivity growth. As the top panel of Chart 3 demonstrates, capital spending in Mexico has been dwindling since 2014. Chart 2Mexico: Productivity Has Been Stagnant For The Past 20 Years...
The Stars Are Aligning For Mexico
The Stars Are Aligning For Mexico
Chart 3...Due To Lack Of Investments
The Stars Are Aligning For Mexico
The Stars Are Aligning For Mexico
First, net FDI inflows into Mexico have been stagnant since the US credit crisis in 2008 (Chart 3, bottom panel). Multinational businesses have been reluctant to expand their capacity to supply US consumers. Besides, China and Vietnam have been more attractive destinations than Mexico for multinational companies. In addition, Chinese manufacturing companies’ rising share of global trade and a preference to source production in Asia rather than Mexico has played a role in lackluster FDI inflows into Mexico’s maquiladora sector. Unlike Chinese producers, Mexican manufacturers have not upgraded their competitiveness on the global manufacturing stage. In brief, there has been little “leakage” of manufacturing expertise from multinationals to local companies in Mexico. Second, the capital spending drought has also hurt domestic industries, including service sectors. The high cost of doing business, lack of affordable financing for SMEs, and high barriers to entry have thwarted enterprise formation and innovation in Mexico, ultimately undermining productivity growth. Critically, the high cost of starting and doing business - particularly for small and medium enterprises (SMEs) - inhibits new investment, employment, and income growth. Mexican SMEs face some of the highest borrowing costs in the OECD, trailing only Brazil (Chart 4). This is due to the highly oligopolistic banking sector. Chart 4Mexican SMEs Face High Borrowing Costs…
The Stars Are Aligning For Mexico
The Stars Are Aligning For Mexico
The three largest banks in Mexico control over half of all commercial banking assets. Therefore, these banks possess the pricing power to enjoy abnormally high fees and interest rate margins (Chart 5). As a result, banks earn excess profits while limiting the amount of financing, i.e., loan origination. This in turn curbs domestic demand in general and investment in particular. Chart 5…Partially Due To Banks’ Wide Interest Rate Margins
The Stars Are Aligning For Mexico
The Stars Are Aligning For Mexico
Chart 6Certain Costs Are Higher In Mexico Than In The US
The Stars Are Aligning For Mexico
The Stars Are Aligning For Mexico
Another issue hindering the investment and creation of new businesses is high operating costs. Compared to the US, Mexican consumers face higher prices for electricity, gasoline and internet. Chart 6 shows gas and electricity prices in US dollars in Mexico and in the US. A big driver of this large discrepancy is the uncompetitive and state-dominated energy market in Mexico. On the whole, the prevalence of monopolies and oligopolies in several major Mexican industries has depressed capital spending. Monopolies and oligopolies are not interested in expanding their volume and rely on price hikes to secure decent profit growth and return on capital. This, along with other factors, curbs productivity growth and keeps inflation above what it would have been in a more competitive economy. Third, stagnant capital spending has been reinforced by the crash in oil prices in 2015 and ensuing fiscal tightening. Public gross fixed capital formation has plunged from 6.6% in 2008 to 3% of GDP presently. Trump’s threat in 2018 to impose tariffs on US imports from Mexico as well as the election of left-wing President AMLO have depressed business confidence and caused a major selloff in the peso. Currency depreciation led the central bank (Banxico) to hike interest rates by 525 basis points from December 2015 to July 2019. Remarkably, AMLO has pursued an even tighter fiscal policy than his predecessor. This resulted in primary fiscal surpluses during AMLO’s first two years of government. Besides, the President’s anti-neoliberal rhetoric against big businesses and foreign corporations (particularly in the oil and gas sector) has not fallen on deaf ears. Business confidence has plummeted since 2018. Bottom Line: The structural decline in capital spending in Mexico has depressed productivity growth. This structural malaise was complemented by several negative shocks such as the oil price crash of 2014-15, Trump’s threats to limit bi-lateral trade with Mexico, the collapse in investor and business confidence, extremely tight fiscal and monetary policies and most recently by the pandemic. However, all these headwinds have either already begun to abate or will reverse going forward. The Stars Are Beginning To Align Chart 7The Mexican Peso Is Cheap
The Stars Are Aligning For Mexico
The Stars Are Aligning For Mexico
Exchange Rate: The Mexican peso is cheap according to its real effective exchange rate based on unit labor costs (Chart 7). The latter is the best valuation measure for any currency because it incorporates both wages and productivity, i.e., it is the proper measure of labor cost-driven competitiveness. The peso will also benefit from orthodox monetary and fiscal policies. Contrary to the consensus view, AMLO has proved be an extremely frugal president.1 He has run one of most conservative fiscal policies in the world. Finally, Mexico is presently running large trade and current account surpluses (Chart 8). Going forward, the Mexican peso will be supported by booming exports to the US, robust remittances from the US (Chart 8, bottom panel), and FDI inflows by multinational companies adding new capacity or shifting capacity from China to Mexico to service the US economy. Easing Monetary Policy: Very tight fiscal and monetary policies on the heels of negative confidence shocks have produced subdued consumer price inflation (Chart 9). Chart 8Mexico: Record Current Account Surplus
The Stars Are Aligning For Mexico
The Stars Are Aligning For Mexico
Chart 9Mexico: Service Inflation Is Low
The Stars Are Aligning For Mexico
The Stars Are Aligning For Mexico
Besides, the prime lending is still reasonably high at 4.8%. Meanwhile, consumer and business credit are contracting (Chart 10). All these warrant Banxico to deliver more rate cuts. Lower lending rates will stimulate investment and consumption (Chart 11). Chart 10Mexico: Loans Are Contracting
The Stars Are Aligning For Mexico
The Stars Are Aligning For Mexico
Chart 11Monetary Easing Should Boost Demand
The Stars Are Aligning For Mexico
The Stars Are Aligning For Mexico
Waning Fiscal Austerity: Fiscal policy will ease relative to the past two years. The government’s targets for primary and overall fiscal balances in 2021 are 0% and -2.9% of GDP, respectively (Chart 12, top panel). In contrast with many other emerging economies, the fiscal thrust – the change in the cyclically-adjusted primary budget deficit – will only be mildly negative in Mexico in 2021 (Chart 12, bottom panel). The basis is that Mexico provided little fiscal support to the economy (only 3% of GDP) amid the pandemic in 2020 and therefore unlike many other EM economies is not facing a fiscal cliff. Critically, the nation budget’s reliance on oil revenues has diminished substantially. Oil revenues presently account for 12% of government revenues compared with 40% in 2012. Further, the public debt burden remains low at 40% of GDP. Even if one includes the debt of Pemex and all other SOEs into government debt, the ratio is still below 50% of GDP2 (Chart 13). Chart 12AMLO Has Been Very Frugal
The Stars Are Aligning For Mexico
The Stars Are Aligning For Mexico
Chart 13Mexico's Public Debt Is Not A Concern
The Stars Are Aligning For Mexico
The Stars Are Aligning For Mexico
Re-Configuring Global Supply Chains: Externally, Mexico has much to gain from the US’s reshoring of global manufacturing supply chains as well as fruitful trade and diplomatic relations with its northern neighbor. Mexico, and in particular its maquiladora industry,3 is very well positioned to attract a rising share of global manufacturing that plans to service North American and Latin American markets. It is an optimal candidate for reshoring operations due to its proximity and trade agreements with the US, a growing labor force and government support for the sector. Chart 14The Maquiladora Sector Is Set To Boom
The Stars Are Aligning For Mexico
The Stars Are Aligning For Mexico
Maquiladora revenue comprises over 25% of national GDP. Further, the number of maquiladoras has been rising steadily in the past five years after the major shrinkage in the 2009-2015 period (Chart 14, top panel). The share of employment in the maquila sector have also been steadily rising in the past 10 years (Chart 14, bottom panel). There are a number of factors as to why maquiladora manufacturing is poised to experience another boom in the coming years and benefit from reshoring global supply chains. The geographical proximity and favorable trade agreements with the US and Canada. The newly ratified USMCA trade agreement between the US, Canada and Mexico has bi-partisan support in the US. Moreover, the election of Joe Biden will reduce the investment and trade risks from Trump’s unpredictable behavior. Biden has stated that his relationship with Mexico will be based on cooperation, not confrontation. Mexico offers competitive cost advantages over many other emerging economies. In terms of wages, Mexican manufacturing wages in US dollar terms are below those in China (Chart 15). Given that multinational companies deploy the same or similar technology and processes to all their factories worldwide, worker productivity in all plants will be the same. In nutshell, Mexico offers cheaper unit labor and shipping costs than China. Mexico has favorable demographics to support an influx of foreign factories. While the share of the working force population (ages 15 to 64) has rolled over in China and Vietnam, it is still rising in Mexico (Chart 16). Chart 15Mexican Wages Are Below Chinese Ones
The Stars Are Aligning For Mexico
The Stars Are Aligning For Mexico
Chart 16Mexico Enjoys A Demographic Tailwind
The Stars Are Aligning For Mexico
The Stars Are Aligning For Mexico
Booming US Demand and Manufacturing: Mexico stands to benefit from the US economic boom via higher remittances and the US industrial renaissance. The US industrial sector will experience a boom in the coming years due to fiscal stimulus in general, and infrastructure stimulus in particular, as well as industrial policies to favor national producers. This industrial boom will benefit Mexico’s maquiladora sector. Positive relations with the US have also helped Mexico in its fight against COVID-19. The US has prioritized its neighbors for the donation of surplus vaccines due to the close economic and diplomatic ties and movements of people across the border. Mexico has thus already received 2.7 million doses of the AstraZeneca vaccine from the US, and is set to receive millions more once the US has vaccinated its entire adult population. Combined with the vaccines Mexico has already purchased and the contract to produce AstraZeneca vaccines domestically by mid-year, Mexico’s economy is poised to fully open up well before its Latin American peers. Bottom Line: Mexico’s growth headwinds – i.e. manufacturing competition from China/Asia, and tight fiscal and monetary policies – are largely turning into tailwinds. Mexico Needs More Inclusive Growth While Mexico’s cyclical outlook appears rosy, the structural picture is less certain. Authorities have progressed in their tax evasion and banking concentration reforms, but such efforts against oligopoly powers and violence remain insufficient. Oligopolies Oligopolies dominate a number of industries in Mexico including telecom, banks, oil and gas, electricity, bread and flour, alcoholic beverages, and entertainment, to list just a few. Oligopolies have adverse effects on the real economy. Incumbent companies have pricing power and can extract excessive rents using their market dominance. Ceteris paribus, inflation is higher in economies where monopolies and oligopolies are prevalent than in economies with more competitive industry structures. In turn, elevated inflation keeps interest rates higher than what economic agents other than oligopolies and monopolies can handle. Another outcome of an oligopolistic and monopolistic industry structure is lopsided income distribution. Because of the prevalence of oligopolies and monopolies in domestic industries, Mexico’s national income has historically been skewed toward corporate profits at the expense of labor income. Chart 17Labor Is In A Much Better Position in The US Than In Mexico
The Stars Are Aligning For Mexico
The Stars Are Aligning For Mexico
The top panel of Chart 17 reveals that operating profits of enterprises make 64% of national income while wages and salaries amount to 30%. By comparison, in the US where the share of company profits has risen at the expense of labor in the past several decades, the former stands at 25% and the latter at 54% of national income (Chart 17, bottom panel). In brief, Mexican corporates’ earning power supersedes that of employees and the outcome is considerable income inequality. Further, cash-rich incumbent companies use their powers to preclude the entry of new competitors. Consequently, the supply side of the economy lags, with negative ramifications for productivity, efficiency, and potential growth. AMLO’s stance against oligopolies has been mixed. On the one hand, he has advocated for higher taxes for large domestic and international corporations – as a way to reduce their excess profits – and has advocated for more competition in the private industry. On the other hand, he has doubled down on state-owned enterprises in the oil and gas and electricity sector. In the private sector, AMLO has been cracking down on tax evasion by large corporations. While this has been seen as excessively harsh by the business community, it has yielded positive results in terms of tax collection: income tax has increased by 2.4% of GDP due to this initiative. This figure underestimates the progress achieved given that recessions tend to weigh down on tax collection as a share of GDP. Moreover, the central bank and the government are aligned in the need to expand the accessibility of the banking system and introduce competition to lower sky-high banking rates and fees (Chart 5 above). In particular, Banxico introduced a free-to-use mobile app for financial transactions between customers and business owners that does not charge any fees. This will force downward pressure on bank transaction fees. While AMLO is positioning himself as a guardian of small businesses, SMEs’ sentiment towards the government is mixed. The only financial support SMEs have received from the government during the pandemic lockdowns was a one-time loan of 25 thousand pesos (equivalent at the time to just one thousand US dollars). Further, there was a 10% net drop in the number of SME companies last year. On a positive note, the government has announced plans this year to drastically reduce bureaucracy in the process of starting and getting permits for new businesses, as well as to simplify the tax regime for SMEs. Knowledge Economy Mexico has seen little improvement in educational standards, which is essential for the advancement toward a knowledge-based economy. The shares of students enrolled in tertiary education and vocational training have been stagnant (Chart 18, top and middle panels). Government spending on education has plummeted as a share of GDP (Chart 18, bottom panel). A substantial increase in the number of enrolled students and an improvement in the quality of vocational training and university education are necessary for long-run productivity gains. Chart 18Mexico Needs To Ramp Up Investment In Education
The Stars Are Aligning For Mexico
The Stars Are Aligning For Mexico
Chart 19Violence Remains High In Mexico
The Stars Are Aligning For Mexico
The Stars Are Aligning For Mexico
Violence The other electoral mandate for AMLO was to tackle rising violence by drug cartels. Homicides have remained flat in the last two years. Yet, the level of violence is so high that just a maintenance of previous years’ levels is not acceptable to the population (Chart 19). Hence, AMLO has yet to fulfill his election promise to reduce violence. In all fairness, AMLO’s signature policy to fight crime and gang violence was put on pause due to Trump’s insistence on curbing Central American migrants via Mexico to the US. The government was forced in 2019 to relocate and repurpose the newly created National Guard to stem immigration flows at the south of the border as President Trump threatened Mexico with tariffs. With no such pressure from the Biden administration, the National Guard will be deployed for its original purpose, we feel the need to give AMLO the benefit of the doubt on this issue for the next 12 months. Bottom line: Mexico needs to boost productivity and adopt a more inclusive growth model. This requires curbing and dismantling monopolies/oligopolies, promoting micro-enterprises and SMEs, reducing the cost of doing business, considerably increasing both the number of students enrolled in and the quality of vocational training and university education as well as reducing violence. All of these changes, if implemented, will not only boost aggregate national income but will also lead to a more equitable income distribution. As the share of income allocated to wages and small entrepreneurs rises, so will household spending. Investment Recommendations Our major global economic theme for next six-to-nine months is a booming US economy amid a Chinese economic slowdown. Consequently, Mexico and its financial markets stand to benefit and outperform their EM peers, as its economy is the most leveraged to US growth and the least exposed to China among EM economies. On another matter, as Mexico’s political stability and economic outlook is contrasted with other Latin American countries (particularly Brazil), regional investors will reallocate funds into Mexican financial markets. Investors should use a potential correction in the coming weeks or months to buy Mexican assets in absolute terms too. Equities: The underperformance of Mexican stocks versus the EM equity index is very late. We were too early in overweighting this bourse but reiterate our overweight stance. Mexican equities will benefit from monetary easing, improving domestic demand and reasonable valuations (Chart 20). Mexican local bond yields have dropped relative to EM aggregate bond yields heralding Mexican equity outperformance versus its EM peers (Chart 21). Chart 20Mexican Equities Are Attractively Valued
The Stars Are Aligning For Mexico
The Stars Are Aligning For Mexico
Chart 21Mexican Stocks Will Outperform The EM Benchmark
The Stars Are Aligning For Mexico
The Stars Are Aligning For Mexico
Besides, the Mexican bourse has no exposure to TMT stocks. If TMT stocks underperform as we expect, the Mexican stock market will outshine the EM benchmark that is heavy in TMT stocks. The Exchange Rate: The Mexican peso is cheap (Chart 7 above), and investors should favor the peso among EM currencies. Fixed-Income Markets: Orthodox fiscal and monetary policies as well as the public debt profile prompt us to continue recommending an overweight allocation to Mexico in both local currency bonds and sovereign credit portfolios. We also recommend investors continue receiving 10-year swap rates in Mexico. For credit investors, we reiterate short Mexican CDS / long Brazilian and South African CDS. Juan Egaña Research Analyst juane@bcaresearch.com Arthur Budaghyan Chief Emerging Markets Strategist arthurb@bcaresearch.com Footnotes 1We have argued since June 28th 2018 that AMLO will not be a fiscally irresponsible president. 2We discussed this topic in detail in our past report. 3Maquiladoras are foreign-owned manufacturers operating in Mexico, mostly in municipalities along the northern border. They are distinct from other businesses in the country as they are specifically set up to export manufacturing goods. In return they do not pay duties on imported materials and equipment and face lower tax rates as well as subsidies for workers’ benefits.
Highlights Stronger global growth in the wake of continued and expected fiscal and monetary stimulus, and progress against COVID-19 are boosting oil demand assumptions by the major data suppliers for this year. We lifted our 2021 global demand estimate by 640k b/d to 98.25mm b/d, and assume OPEC 2.0 will make the necessary adjustments to keep Brent prices closer to $60/bbl than not, so as not to disrupt a fragile recovery. We are maintaining our 2022 and 2023 Brent forecasts at $65/bbl and $75/bbl. Commodity markets are ignoring the rising odds of armed conflict involving the US, Russia and China and their clients and allies. Russia has massed troops on Ukraine’s border and warned the US not to interfere. China has massed warships off the coast of the Philippines, and continues its incursions in Taiwan’s air-defense zone, keeping US forces on alert. Intentional or accidental engagement would spike oil prices. Two-way price risk abounds. In addition to the risk of armed hostilities, faster distribution of vaccines would accelerate recovery and boost prices above our forecasts. Downside risk of a resurgence in COVID-19-induced lockdowns remains, as rising death and hospitalization rates in Brazil, India and Europe attest (Chart of the Week). Feature Oil-demand estimates – ours included – are reviving in the wake of measurable progress in combating the COVID-19 pandemic in major economies, and an abundance of fiscal and monetary stimulus, particularly out of the US.1 On the back of higher IMF GDP projections, we lifted our 2021 global demand estimate by 640k b/d to 98.25mm b/d in this month’s balances. In our modeling, we assume OPEC 2.0 will make the necessary adjustments to keep Brent prices closer to $60/bbl than not, so as not to disrupt a fragile recovery. In an unusual turn of events, the early stages of the recovery in oil demand will be led by DM markets, which we proxy using OECD oil consumption (Chart 2). Thereafter, EM economies, re-take the growth lead next year and into 2023. Chart of the WeekCOVID-19 Deaths, Hospitalizations Threaten Global Recovery
Upside Oil Price Risks Are Increasing
Upside Oil Price Risks Are Increasing
Chart 2DM Demand Surges This Year
DM Demand Surges This Year
DM Demand Surges This Year
Absorbing OPEC 2.0 Spare Capacity We continue to model OPEC 2.0, the producer coalition led by the Kingdom of Saudi Arabia (KSA) and Russia, as the dominant producer in the market. The growth we are expecting this year will absorb a significant share of OPEC 2.0’s spare capacity, most of which – ~ 6mm b/d of the ~ 8mm b/d – is to be found in KSA (Chart 3). The core producers’ spare capacity allows them to meet recovering demand faster than the US shale producers can mobilize rigs and crews and get new supply into gathering lines and on to main lines. We model the US shale producers as a price-taking cohort, who will produce whatever the market allows them to produce. After falling to 9.22mm b/d in 2020, we expect US production to recover to 9.56mm b/d this year, 10.65mm b/d in 2022, and 11.18mm in 2023 (Chart 4). Lower 48 production growth in the US will be led by the shales, which will account for ~ 80% of total US output each year. Chart 3Core OPEC 2.0 Spare Capacity Will Respond First To Higher Demand
Core OPEC 2.0 Spare Capacity Will Respond First To Higher Demand
Core OPEC 2.0 Spare Capacity Will Respond First To Higher Demand
Chart 4Shale Is The Marginal Barrel In The Price Taking Cohort
Shale Is The Marginal Barrel In The Price Taking Cohort
Shale Is The Marginal Barrel In The Price Taking Cohort
OPEC 2.0’s dominant position on the supply side allows it to capture economic rents before non-coalition producers, which will remain a disincentive to them until the spare capacity is exhausted. Thereafter, the price-taking cohort likely will fund much of its E+P activities out of retained earnings, given their limited ability to attract capital. Equity investors will continue to demand dividends that can be maintained and grown, or return of capital via share buybacks. This will restrain production growth to those firms that are profitable. We expect the OPEC 2.0 coalition’s production discipline will keep supply levels just below demand so that inventories continue to fall, just as they have done during the COVID-19 pandemic, despite the demand destruction it caused (Chart 5). These modeling assumptions lead us to continue to expect supply and demand will continue to move toward balance into 2023 (Table 1). Chart 5Supply-Demand Balances in 2021
Supply-Demand Balances in 2021
Supply-Demand Balances in 2021
Table 1BCA Global Oil Supply - Demand Balances (MMb/d, Base Case Balances)
Upside Oil Price Risks Are Increasing
Upside Oil Price Risks Are Increasing
We continue to expect this balancing to induce persistent physical deficits, which will keep inventories falling into 2023 (Chart 6). As inventories are drawn, OPEC 2.0’s dominant-producer position will allow it to will keep the Brent and WTI forward curves backwardated (Chart 7).2 We are maintaining our 2022 and 2023 Brent forecasts at $65/bbl and $75/bbl (Chart 8). Chart 6OPEC 2.0 Policy Continues To Keep Supply Below Demand...
OPEC 2.0 Policy Continues To Keep Supply Below Demand...
OPEC 2.0 Policy Continues To Keep Supply Below Demand...
Chart 7OECD Inventories Fall to 2023
OECD Inventories Fall to 2023
OECD Inventories Fall to 2023
Chart 8Brent Forecasts Rise As Global Economy Recovers
Brent Forecasts Rise As Global Economy Recovers
Brent Forecasts Rise As Global Economy Recovers
Two-Way Price Risk Abounds Risks to our views abound on the upside and the downside. To the upside, the example of the UK and the US in mobilizing its distribution of vaccines is instructive. Both states got off to a rough start, particularly the US, which did not seem to have a strategy in place as recently as January. After the US kicked its procurement and distribution into high gear its vaccination rates soared and now appear to be on track to deliver a “normal” Fourth of July holiday in the US. The UK has begun its reopening this week. Both states are expected to achieve herd immunity in 3Q21.3 The EU, which mishandled its procurement and distribution likely benefits from lessons learned in the UK and US and achieves herd immunity in 4Q21, according to McKinsey’s research. Any acceleration in this timetable likely would lead to stronger growth and higher oil prices. The next big task for the global community will be making vaccines available to EM economies, particularly those in which the pandemic is accelerating and providing the ideal setting for mutations and the spread of variants that could become difficult to contain. The risk of a resurgence in large-scale COVID-19-induced lockdowns remains, as rising death and hospitalization rates in Brazil, India and Europe attest. Cry Havoc The other big upside risk we see is armed conflict involving the US, Russia, China and their clients and allies. Commodity markets are ignoring these risks at present. Even though they do not rise to the level of war, the odds of kinetic engagement – planes being shot down or ships engaging in battle in the South China Sea – are rising on a daily basis. This is not unexpected, as our colleagues in BCA Research’s Geopolitical Strategy pointed out recently.4 Indeed, our GPS service, led by Matt Gertken, warned the Biden administration would be tested in this manner by Russia and China from the get-go. Russia has massed troops on Ukraine’s border and warned the US not to interfere. China has massed warships off the coast of the Philippines, and continues its incursions in Taiwan’s air-defense zone, keeping US forces on alert. Political dialogue between the US and Russia and the US and China is increasingly vitriolic, with no sign of any leavening in the near future. Intentional or accidental engagement could let slip the dogs of war and spike oil prices briefly. Finally, OPEC 2.0 is going to have to accommodate the “official” return of Iran as a bona fide oil exporter, if, as we expect, it is able to reinstate its nuclear deal – i.e., the Joint Comprehensive Plan of Action (JCPOA) – with Western states, which was abrogated by then-President Donald Trump in 2018. This may prove difficult, given our view that the oil-price collapse of 2014-16 was the result of the Saudis engineering a market-share war to tank prices, in an effort to deny Iran $100+ per-barrel prices that had prevailed between end-2010 and mid-2014. OPEC 2.0, particularly KSA, has not publicly involved itself in the US-Iran negotiations. However, it is worthwhile recalling that following the disastrous market-share war launched in 2014, KSA and the rest of OPEC 2.0 did accommodate Iran’s return to markets post-JCPOA. Robert P. Ryan Chief Commodity & Energy Strategist rryan@bcaresearch.com Ashwin Shyam Research Associate Commodity & Energy Strategy ashwin.shyam@bcaresearch.com Commodities Round-Up Energy: Bullish Brent and WTI prices rallied sharply following the release of the EIA’s Weekly Petroleum Status Report showing a 9.1mm-barrel decline in US crude and product stocks for the week ended 9 April 2021. This was led by a huge draw in commercial crude and distillate inventories (5.9mm barrels and 2.1mm barrels, respectively). These draws came on the back of generally bullish global demand upgrades by the major data services (EIA, IEA and OPEC) over the past week. These assessments were supported by EIA data showing refined-product demand – i.e., “product supplied” – jumped 1.1mm b/d for the week ended 9 April. With vaccine distributions picking up steam, despite setbacks on the Johnson & Johnson jab, the storage draws and improved demand appear to have catalyze the move higher. Continued weakness in the USD also provided a tailwind, as did falling real interest rates in the US. Base Metals: Bullish Nickel prices fell earlier this week, as China’s official Xinhua news agency reported that Chinese Premier, Li Keqiang stressed the need to strengthen raw materials’ market regulation, amidst rising commodities prices, which been pressuring corporate financial performance (Chart 9). This statement came after China’s top economic advisor, Liu He also called for authorities to track commodities prices last week. Nickel prices fell by around $500/ ton earlier this week on this news, and were trading at $16,114.5/MT on the London Metals exchange as of Tuesday’s close. Other base metals were not affected by this news. Precious Metals: Bullish The US dollar and 10-year treasury yields fell after March US inflation data was released earlier this week. US consumer prices rose by the most in nearly nine years. The demand for an inflation hedge, coupled with the falling US dollar and treasury yields, which reduce the opportunity cost of purchasing gold, caused gold prices to rise (Chart 10). This uncertainty, coupled with the increasing inflationary pressures due to the US fiscal stimulus will increase demand for gold. Spot COMEX gold prices were trading at $1,746.20/oz as of Tuesday’s close. Ags/Softs: Neutral The USDA reported ending stocks of corn in the US stood at 1.35 billion bushels, well below market estimates of 1.39 billion and the 1.50 billion-bushel estimate by the Department last month, according to agriculture.com’s tally. Global corn stocks ended at 283.9mm MT vs a market estimate of 284.5mm MT and a Department estimate of 287.6mm MT. Chart 9Base Metals Are Being Bullish
Base Metals Are Being Bullish
Base Metals Are Being Bullish
Chart 10Gold Prices To Rise
Gold Prices To Rise
Gold Prices To Rise
Footnotes 1 Please see US-Russia Pipeline Standoff Could Push LNG Prices Higher, which we published on 8 April 2021 re the IMF’s latest forecast for global growth. Briefly, the Fund raised its growth expectations for this year and next to 6% and 4.4%, respectively, nearly a full percentage-point increase versus its January forecast update for 2021 2 A backwardated forward curve – prompt prices trading in excess of deferred prices – is the market’s way of signaling tightness. It means refiners of crude oil value crude availability right now over availability a year from now. This is exactly the same dynamic that drives an investor to pay $1 today for a dollar bill delivered tomorrow than for that same dollar bill delivered a year from now (that might only fetch 98 cents today, e.g.). 3 Please see When will the COVID-19 pandemic end?, published 26 March 2021 by McKinsey & Co. 4 Please see The Arsenal Of Democracy, a prescient analysis published 2 April 2021 by BCA’s Geopolitical Strategy. The report notes the Biden administration “still faces early stress-tests on China/Taiwan, Russia, Iran, and even North Korea. Game theory helps explain why financial markets cannot ignore the 60% chance of a crisis in the Taiwan Strait. A full-fledged war is still low-probability, but Taiwan remains the world’s preeminent geopolitical risk.” Investment Views and Themes Recommendations Strategic Recommendations Tactical Trades Commodity Prices and Plays Reference Table Trades Closed in 2021 Summary of Closed Trades
Higher Inflation On The Way
Higher Inflation On The Way
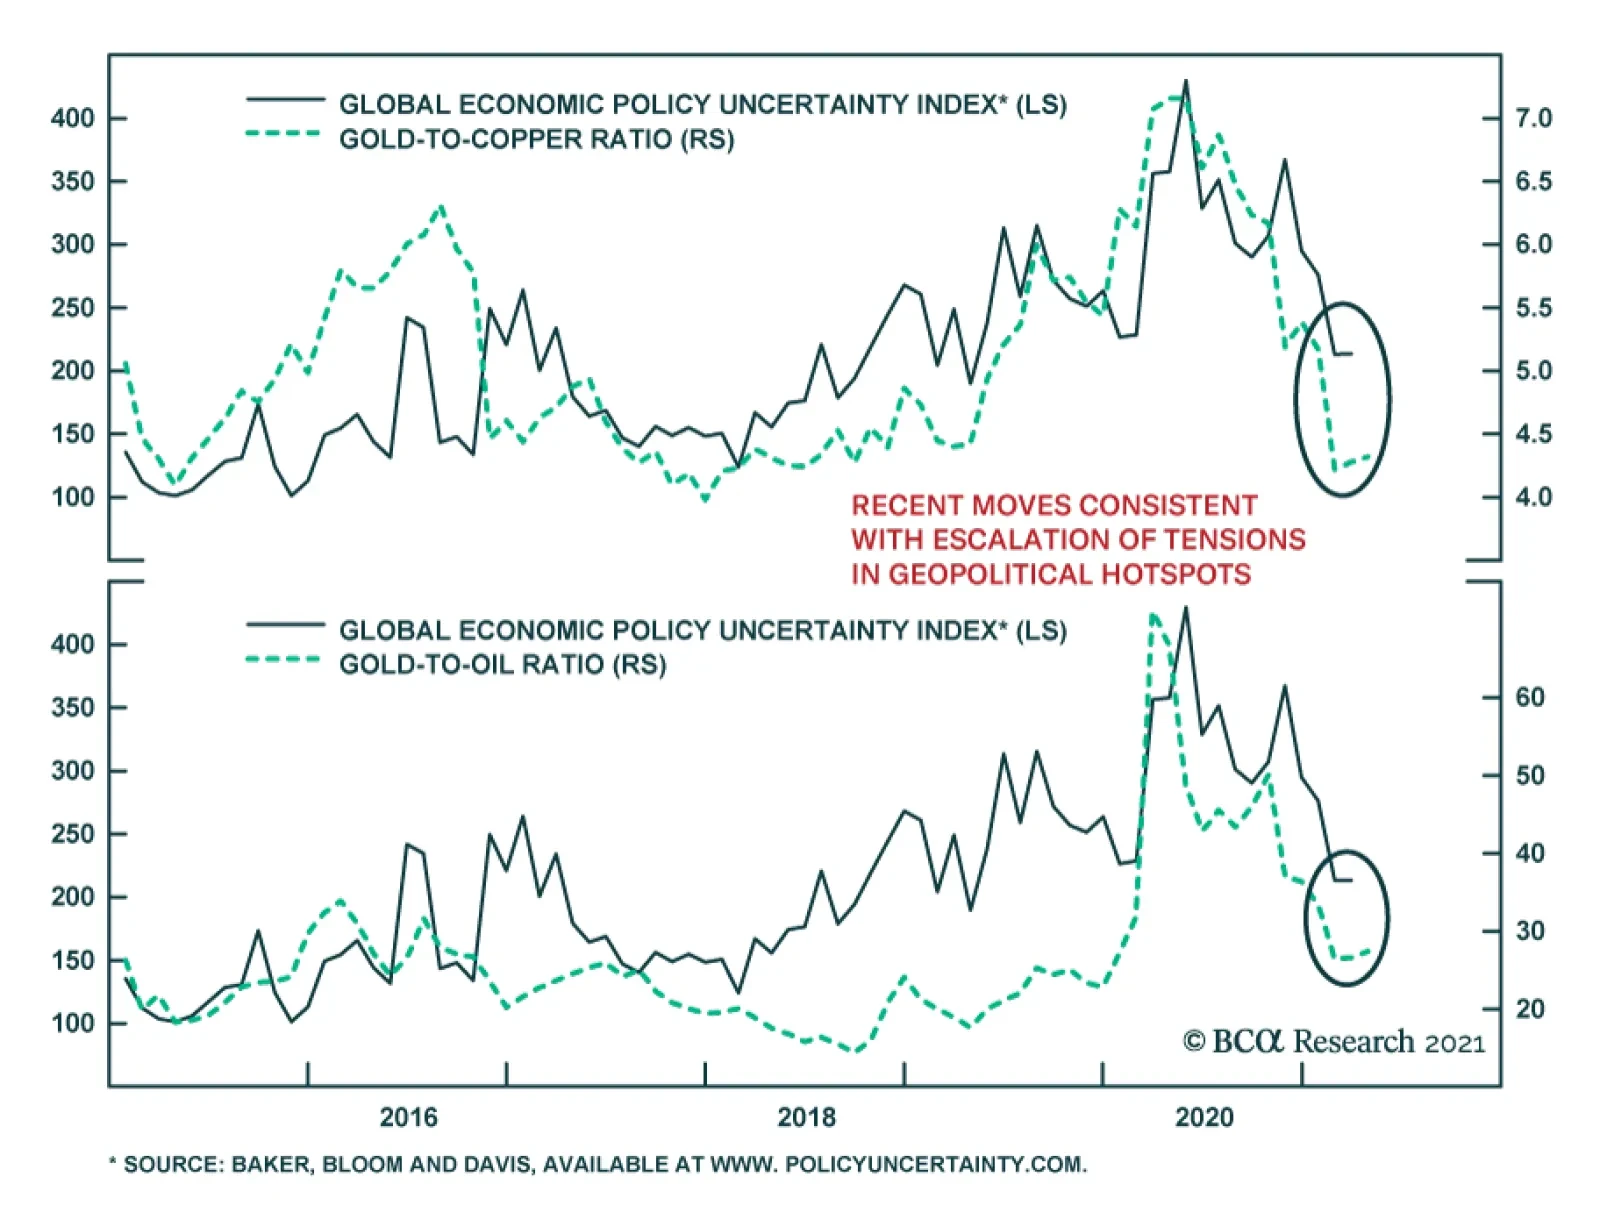
The Global Economic Policy Uncertainty Index’s sharp descent has stopped for now. Market instruments that are sensitive to geopolitical risk corroborate the signal from the global uncertainty index. For example, gold has been outperforming industrial…
Dear Client, Next week I will be hosting a series of Roundtable discussions with BCA’s clients in both Europe and Asia. Our next report published on April 28th will be a recap of my observations from these meetings. Best regards, Jing Sima China Strategist Highlights The sharp uptick in Chinese producer prices should be transitory, unlikely to trigger a policy response. There are two scenarios under which Chinese manufacturers’ profit margins will benefit: either Chinese exporters will raise export prices and pass input costs onto American customers, or the RMB will depreciate versus the US dollar and commodities prices will experience a setback. The second scenario is more likely in the next 3-6 months. After a pandemic-driven boost in 2020, US imports from China will likely moderate in the second half of 2021 and into 2022. President Biden’s grand infrastructure spending plan, even if approved later this year, will not be a game changer for China’s exports or economy. The strength in the USD may intensify in the near term, and Chinese policymakers will be happy to allow the RMB to depreciate mildly. Stay underweight Chinese stocks. Feature Last week’s China’s producer price index (PPI) was more elevated than the market expected. However, it does not warrant a policy response, given that the increase was mostly driven by supply constraints rather than an overheating domestic economy. Chinese manufacturers have had a tough time passing on mounting input prices to customers, which raises the question about how profit margins will be maintained. For exporters, the answer may be a combination of increasing export prices in USD terms and depreciating the RMB. The rate of growth in US demand for Chinese export goods may moderate in the second half of 2021 and into 2022 after a pandemic-driven boost in 2020. China’s economic growth and interest rate differentials with the US will continue to narrow in the rest of this year. We expect the RMB to face headwinds against the USD, at least in the next quarter or two. Meanwhile, global investors should continue to underweight Chinese stocks. The PBoC Will Not React To Supply-Side Price Pressures Chart 1Marchs Strong PPI Does Not Reflect An Overheating Domestic Economy
Marchs Strong PPI Does Not Reflect An Overheating Domestic Economy
Marchs Strong PPI Does Not Reflect An Overheating Domestic Economy
Despite above-expectation readings in China’s PPI, the domestic economy shows no signs of overheating. The upside pressure on producer prices reflects the impact of both the global rally in commodities and base effects (Chart 1). In March, strength in the PPI was also accentuated by seasonality due to a resumption in construction and real estate activity following the Chinese New Year holiday. While base effects and global supply bottlenecks will continue to buoy PPI prints throughout Q2, these effects are likely transitory and would not justify a policy response. At 0.4% year-over-year in March, core CPI remains significantly below the central bank’s 3% target and does not indicate any demand-side pressure. Instead, the inability for Chinese producers to pass on higher input prices to consumers highlights the relatively subdued state of domestic demand (Chart 1, bottom panel). Chart 2Current Macro Policy Works To Cap The Upsides In Both The Price And Quantity Of Money
Current Macro Policy Works To Cap The Upsides In Both The Price And Quantity Of Money
Current Macro Policy Works To Cap The Upsides In Both The Price And Quantity Of Money
At this point there are little signs that rising producer prices are spilling over to consumer prices. We expect Chinese authorities to continue its current policy trajectory, which intends to keep a steady interbank rate while keeping money supply growth at or below the rate of nominal GDP expansion (Chart 2). China’s Deteriorating Terms Of Trade Chinese export prices climbed slightly in USD terms, but not by enough to offset the RMB’s relentless appreciation from the second half of last year, as indicated by falling export prices in RMB terms (Chart 3). A deteriorating terms of trade (ToT), defined as export prices relative to import costs, means that Chinese producers must export a greater number of units to purchase the same number of imports (Chart 4). The declining ToT can be a powerful deflationary force for China’s manufacturing sector. Chart 3Chinese Export Prices Are Rising In USD Terms But Falling In Local Currency Terms
Chinese Export Prices Are Rising In USD Terms But Falling In Local Currency Terms
Chinese Export Prices Are Rising In USD Terms But Falling In Local Currency Terms
Chart 4Terms Of Trade Have Been Falling
Terms Of Trade Have Been Falling
Terms Of Trade Have Been Falling
Chart 5Chinese Output Prices Lead US Consumer Inflation By A Year
Chinese Output Prices Lead US Consumer Inflation By A Year
Chinese Output Prices Lead US Consumer Inflation By A Year
While there are limited choices for China to improve its ToT, manufacturers could raise export prices in USD terms and “recycle” cost-push inflation back to the US. Chinese PPI normally leads US consumer inflation by 12 to 18 months (Chart 5). Hence, it is possible that the US will see import prices from China picking up more momentum by the middle of next year. The RMB’s performance is a key macro driver for manufacturing-related output prices. A depreciation in the RMB can be a meaningful reflationary force for manufacturers. There has been a clear negative correlation between the trade-weighted RMB and Chinese manufacturers' output prices and industrial profits, as shown in Chart 6. In this scenario, the USD will continue to appreciate against the RMB and possibly emerging market currencies, a headwind to global trade (Chart 7). Chart 6A Falling RMB Can Be Reflationary To Chinese Producers
A Falling RMB Can Be Reflationary To Chinese Producers
A Falling RMB Can Be Reflationary To Chinese Producers
Chart 7A Stronger USD Will Be Headwinds For Global Trade
A Stronger USD Will Be Headwinds For Global Trade
A Stronger USD Will Be Headwinds For Global Trade
Maintaining a strong RMB can partly mitigate the pain stemming from escalating commodity import prices. However, in our view it is the least preferred option by policymakers. In previous cycles a rapidly strengthening RMB did not have a major impact on Chinese exporters' competitiveness, mainly because declines in commodities prices effectively offset a rising RMB (Chart 8 and Chart 9). Therefore, Chinese exporters did not need to boost prices in USD terms to maintain their profit margins. Chart 8RMB Appreciations Did Not Hurt Chinas Share In Global Trade
RMB Appreciations Did Not Hurt Chinas Share In Global Trade
RMB Appreciations Did Not Hurt Chinas Share In Global Trade
Chart 9...Because Declines In Commodities Prices Were Able To Offset A Rising RMB
...Because Declines In Commodities Prices Were Able To Offset A Rising RMB
...Because Declines In Commodities Prices Were Able To Offset A Rising RMB
Bottom Line: Chinese exporters can either raise prices and pass the inflation onto American customers, or the PBoC will allow further depreciation in the RMB to maintain Chinese producers’ competitiveness. Appreciating the RMB is the least preferred option. Don’t Count On A US Buying Spree Market participants in China are pricing in large windfalls from the US$1.9 trillion American Rescue Plan and proposed US$2.4 trillion American Jobs Plan.1 A positive export tailwind in Q1 this year boosted China’s economic activity beyond what measures of domestic money and credit would have predicted, as shown in Chart 10. However, given the strongly positive relationship between the export sector and real investment in China, it is concerning that any deceleration in US demand for Chinese export goods would seriously challenge the sanguine view for China’s economy this year (Chart 11). Chart 10Export Strength Appears To Be Propping Up The LKI
Export Strength Appears To Be Propping Up The LKI
Export Strength Appears To Be Propping Up The LKI
Chart 11China's Export Sector Is Highly Investment-Intensive
From Deflation To Inflation … What’s Next?
From Deflation To Inflation … What’s Next?
Moreover, US demand for Chinese export goods is subject to several countervailing forces, at least in the second half of 2021: The USD currently benefits from widening real interest differentials and stronger US growth relative to the rest of the world. For the next quarter or two, persistent strength in the USD and US Treasury yields will be headwinds to global trade and may cause a temporary setback for the global manufacturing sector (Chart 7 on Page 4). Residential and business investment in the US may not regain much vigor despite large stimulus checks. Our colleagues at BCA US Investment Strategy expect US residential investment to match the long-run trend growth, but the increase will be largely offset by below-trend growth in non-residential investment. More working-from-home options will continue to drive demand for single-family homes in the suburbs and beyond. On the other hand, demand will suffer for office space in central business districts and dwellings in urban centers. Brick-and-mortar retail construction is also going to crater. Consumption for goods in the US may also see below-trend growth in the second half of 2021 and into 2022, whereas the service sector will benefit most from the coming recovery in US business and social activities. Table 1 shows that goods spending rose in 2020 despite an overall decline in consumption, because households dramatically shifted their consumption into goods from services. As such, 2020’s pandemic-driven dividend for Chinese exporters is likely to become a drag on tradeable goods exports to the US in 2021 and/or 2022. Table 1US Consumer Spending Gap Is Almost Entirely On The Services Side
From Deflation To Inflation … What’s Next?
From Deflation To Inflation … What’s Next?
It is also important for investors to put the US$2.4 trillion infrastructure spending budget proposed in the American Jobs Plan into prospective. The US lags far behind China in infrastructure spending. In the past 10 years, US public infrastructure investment (federal and state combined) has declined to an average of about $450 billion.2 This compares with China’s US $1.9 trillion yearly spending on infrastructure (Chart 12). China currently consumes seven to eight times more industrial metals than the US (Chart 13). As such, even if the US infrastructure investment plan will be approved later this year, it is unlikely to be a game changer for global commodity prices or Chinese exports. Chart 12Infrastructure Spending, China Vs. The US
From Deflation To Inflation … What’s Next?
From Deflation To Inflation … What’s Next?
Chart 13US Consumption Of Industrial Metals Is Too Small Relative To China
From Deflation To Inflation … What’s Next?
From Deflation To Inflation … What’s Next?
The proposed US$1.2 trillion spending on the US nation’s roads, bridges, green spaces, water, electricity, and universal broadband will be spread over the next eight years. The additional $150 billion per annum to the US public infrastructure investment will only boost the US spending from 24% to about 32% of China’s annual infrastructure investment. Furthermore, the fiscal multiplier effect from the extra public spending on investment from the US private sector and overall economy may not be as positive as the market has priced in, depending on the size of corporate tax hikes in the final bill. Bottom Line: After a pandemic-driven boost in 2020, growth in US imports from China will likely moderate in the second half of 2021 and into 2022. The proposed infrastructure spending plan in the US will benefit Chinese exports, but the magnitude of the windfall may be disappointing. Investment Implications As discussed in a previous report, rising US bond yields will have a muted effect on their Chinese counterparts. Tightened regulations on the real estate industry and a new round of environmental protection laws in China will continue to suppress the domestic credit demand. As a result, interest rate differentials between China and the US will continue to narrow. The strength in the USD has not run its course and the RMB will face slight depreciation pressures in Q2 and possibly into Q3. A declining RMB will provide reflationary benefits to China’s industrial profits, but with about a six-month time lag. In the meantime, we recommend global investors to continue underweighting Chinese stocks (Chart 14A and 14B). Chart 14AContinue Underweighting Chinese Stocks
Continue Underweighting Chinese Stocks
Continue Underweighting Chinese Stocks
Chart 14BContinue Underweighting Chinese Stocks
Continue Underweighting Chinese Stocks
Continue Underweighting Chinese Stocks
Jing Sima China Strategist jings@bcaresearch.com Footnotes 1According to the OECD, recent US stimulus will boost US GDP growth by almost 3 percentage points in the first full year (from 2021Q2 to 2022Q2). The knock-on effect from the stimulus on other economies is projected to be significant, including a half percentage point addition to China’s GDP during the same period. 2The Congressional Budget Office estimated that combined federal, state and local spending on infrastructure was (in 2019 dollars) $441 billion as of 2017. Cyclical Investment Stance Equity Sector Recommendations
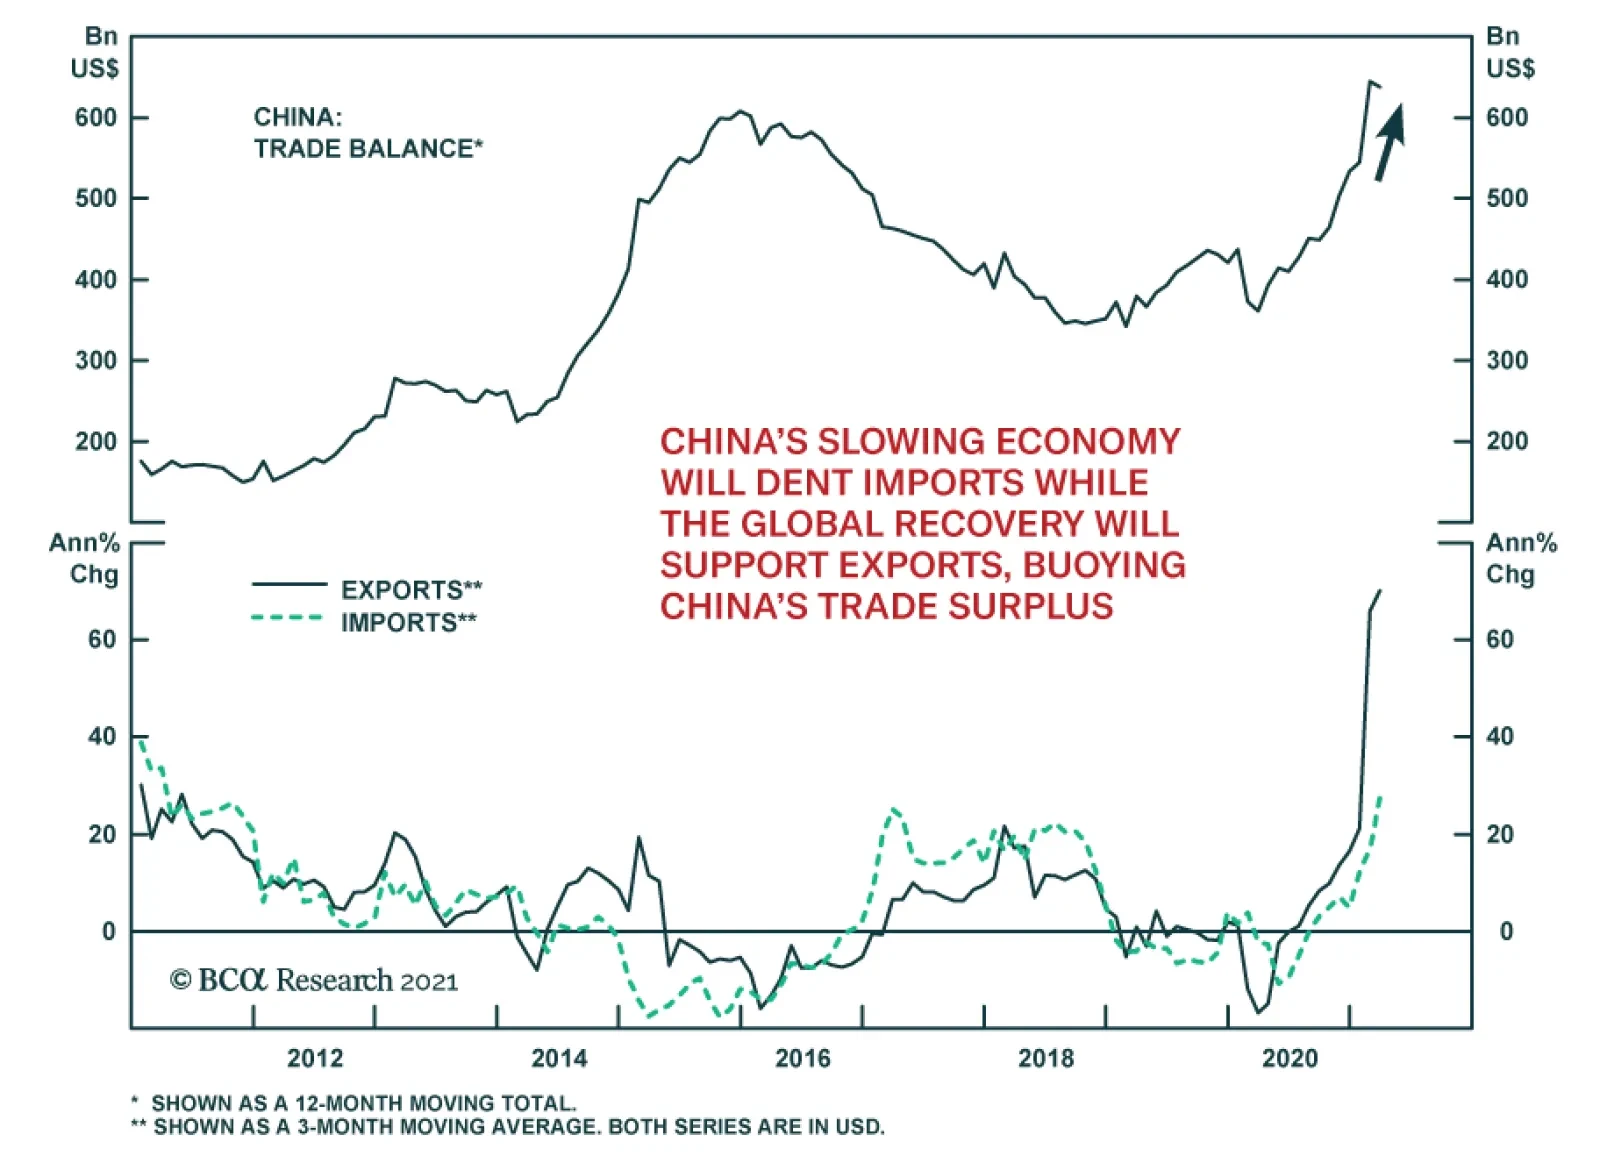
China’s trade surplus contracted significantly in March, falling to $13.8 billion from $37.8 billion. The narrower surplus reflects both a deceleration in exports and an acceleration in imports. Exports were weaker than expected, easing to 30.6% y/y from…
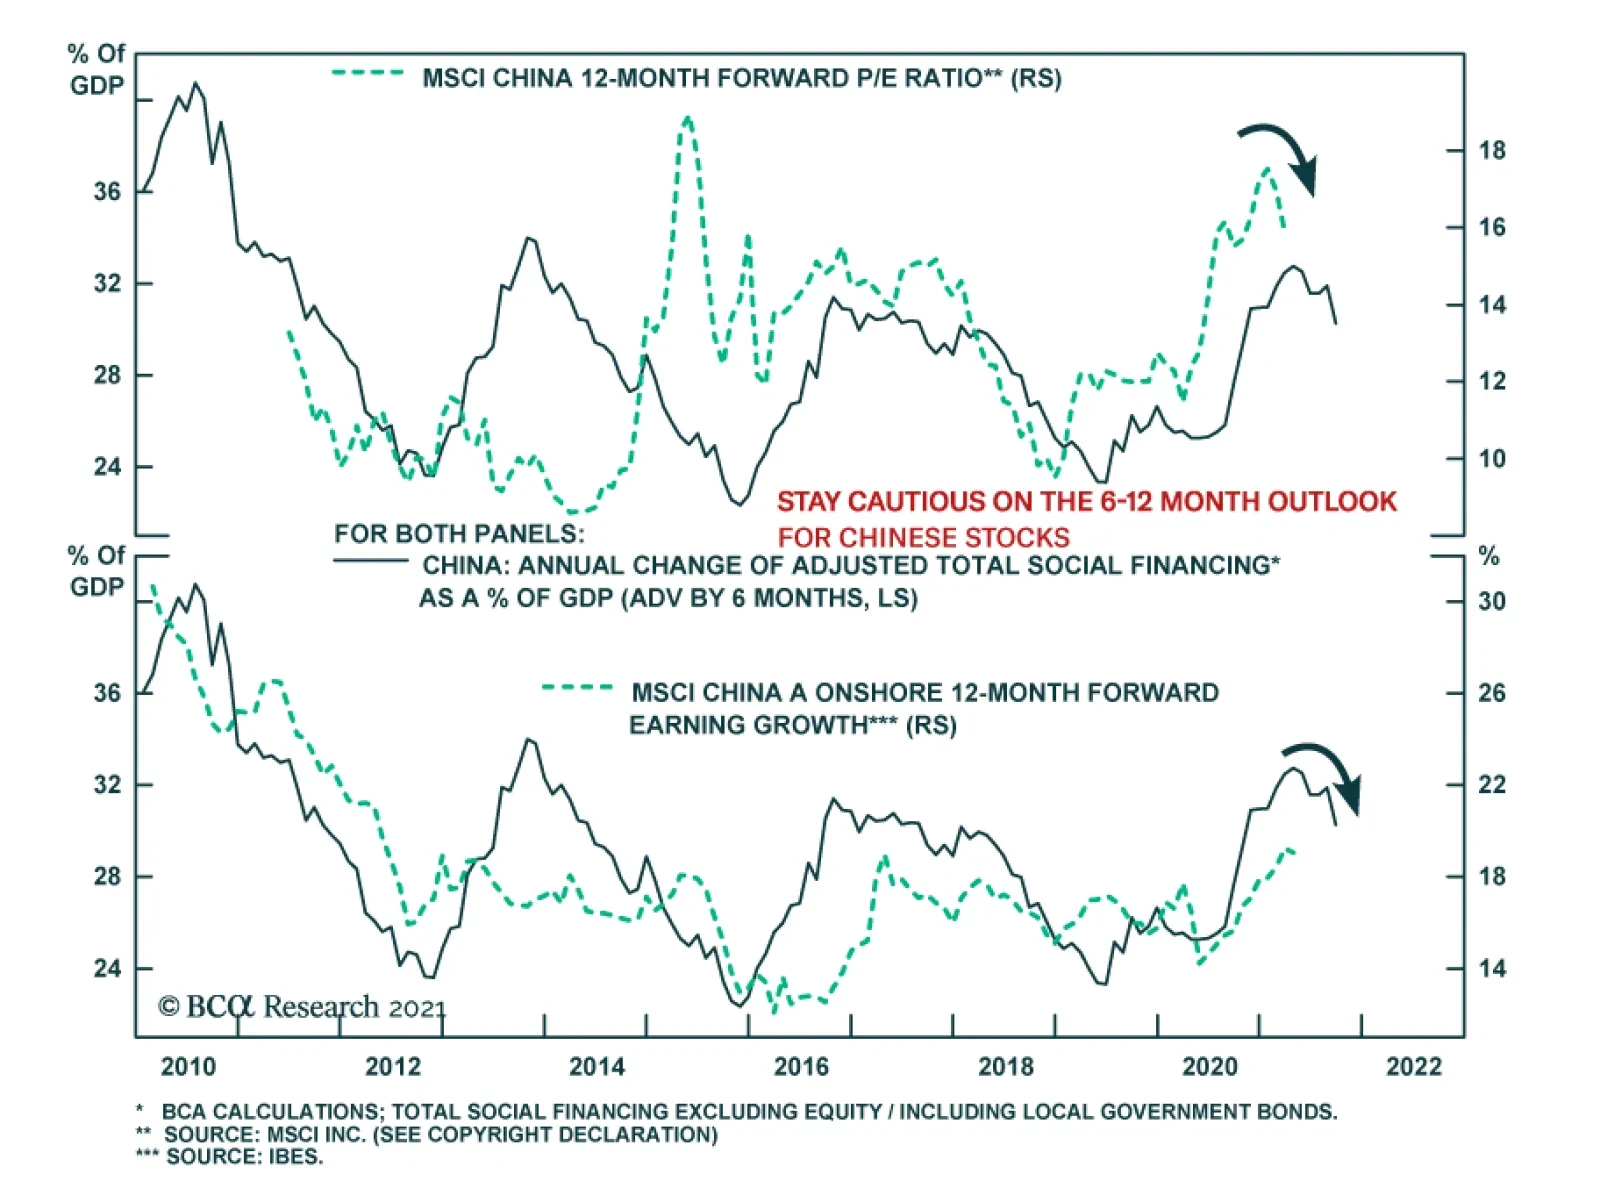
China’s credit trends continue to point to a winding down of last year’s massive stimulus. Although new loans of CNY 2.7 trillion in March exceeded the CNY 2.3 trillion anticipated by the consensus, the annual growth rate has slowed to 12.6% y/y from…
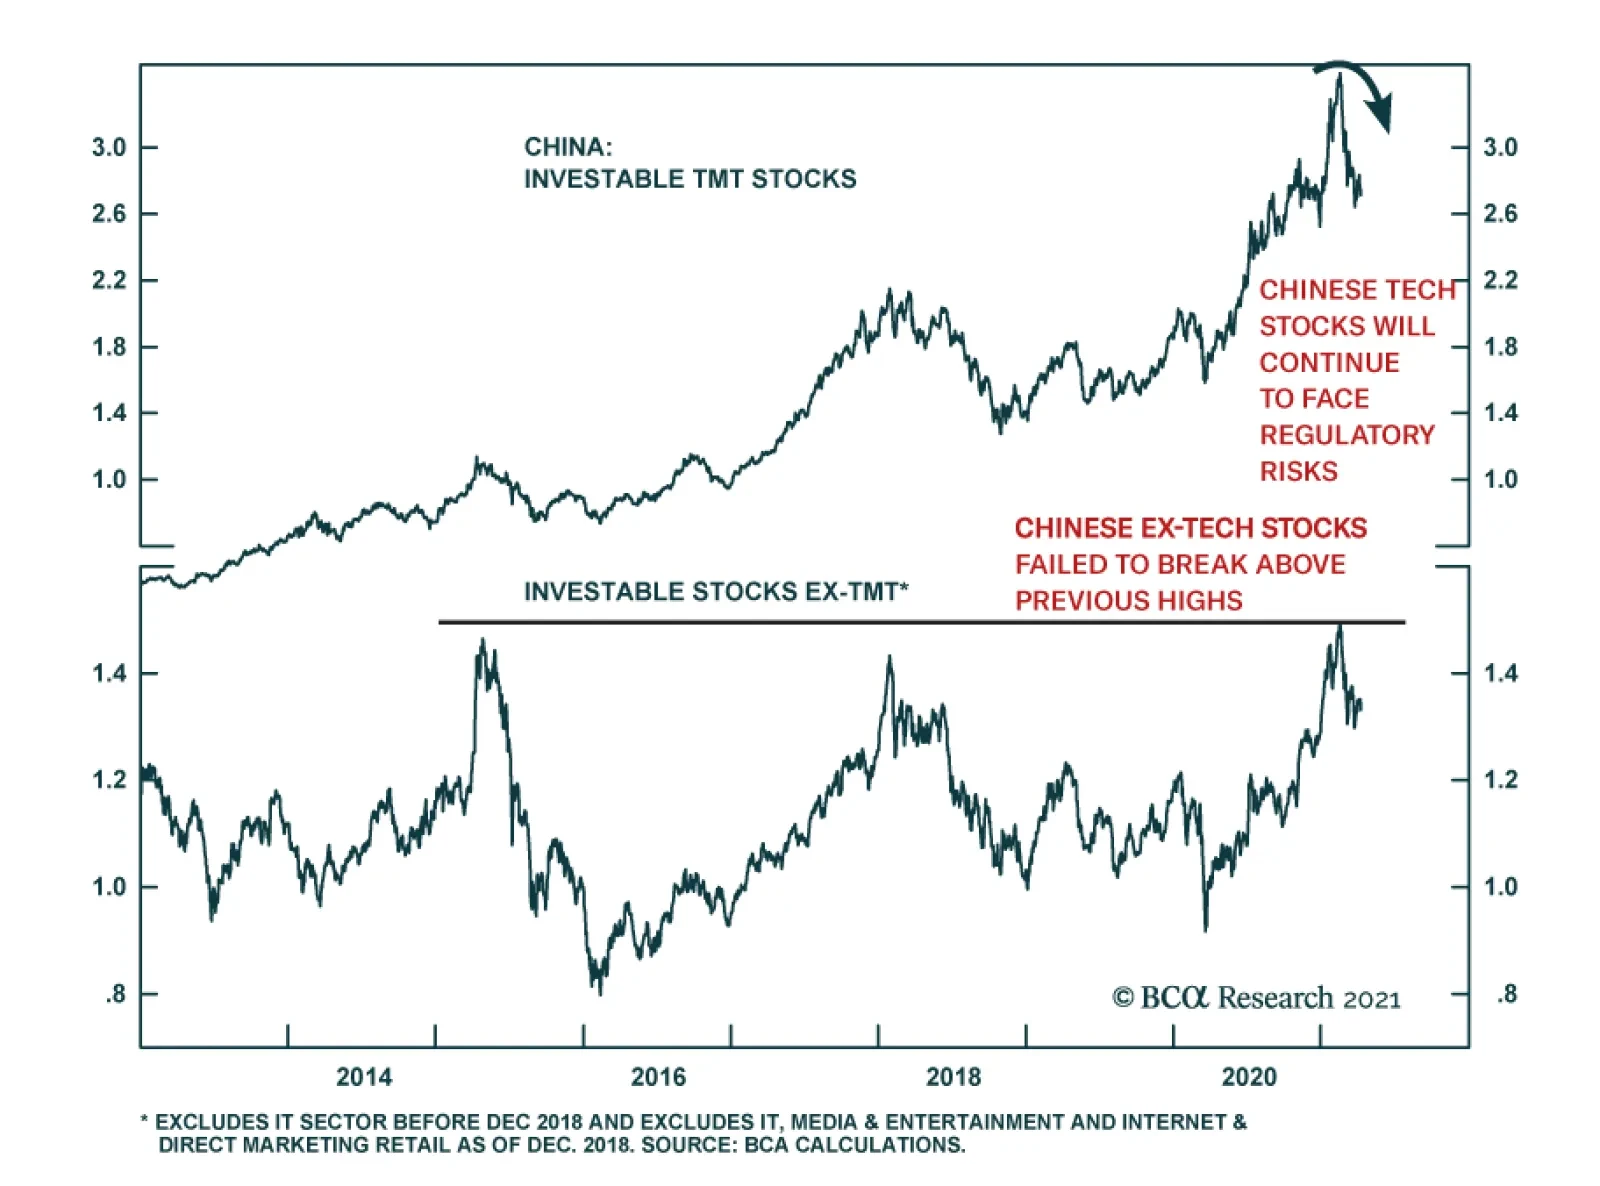
Chinese stocks are increasingly unattractive amid both policy tightening (see The Numbers) and a regulatory clampdown targeting real estate, banking, and tech. Regarding the latter, an anti-monopoly probe on e-commerce giant Alibaba concluded on Friday with a…
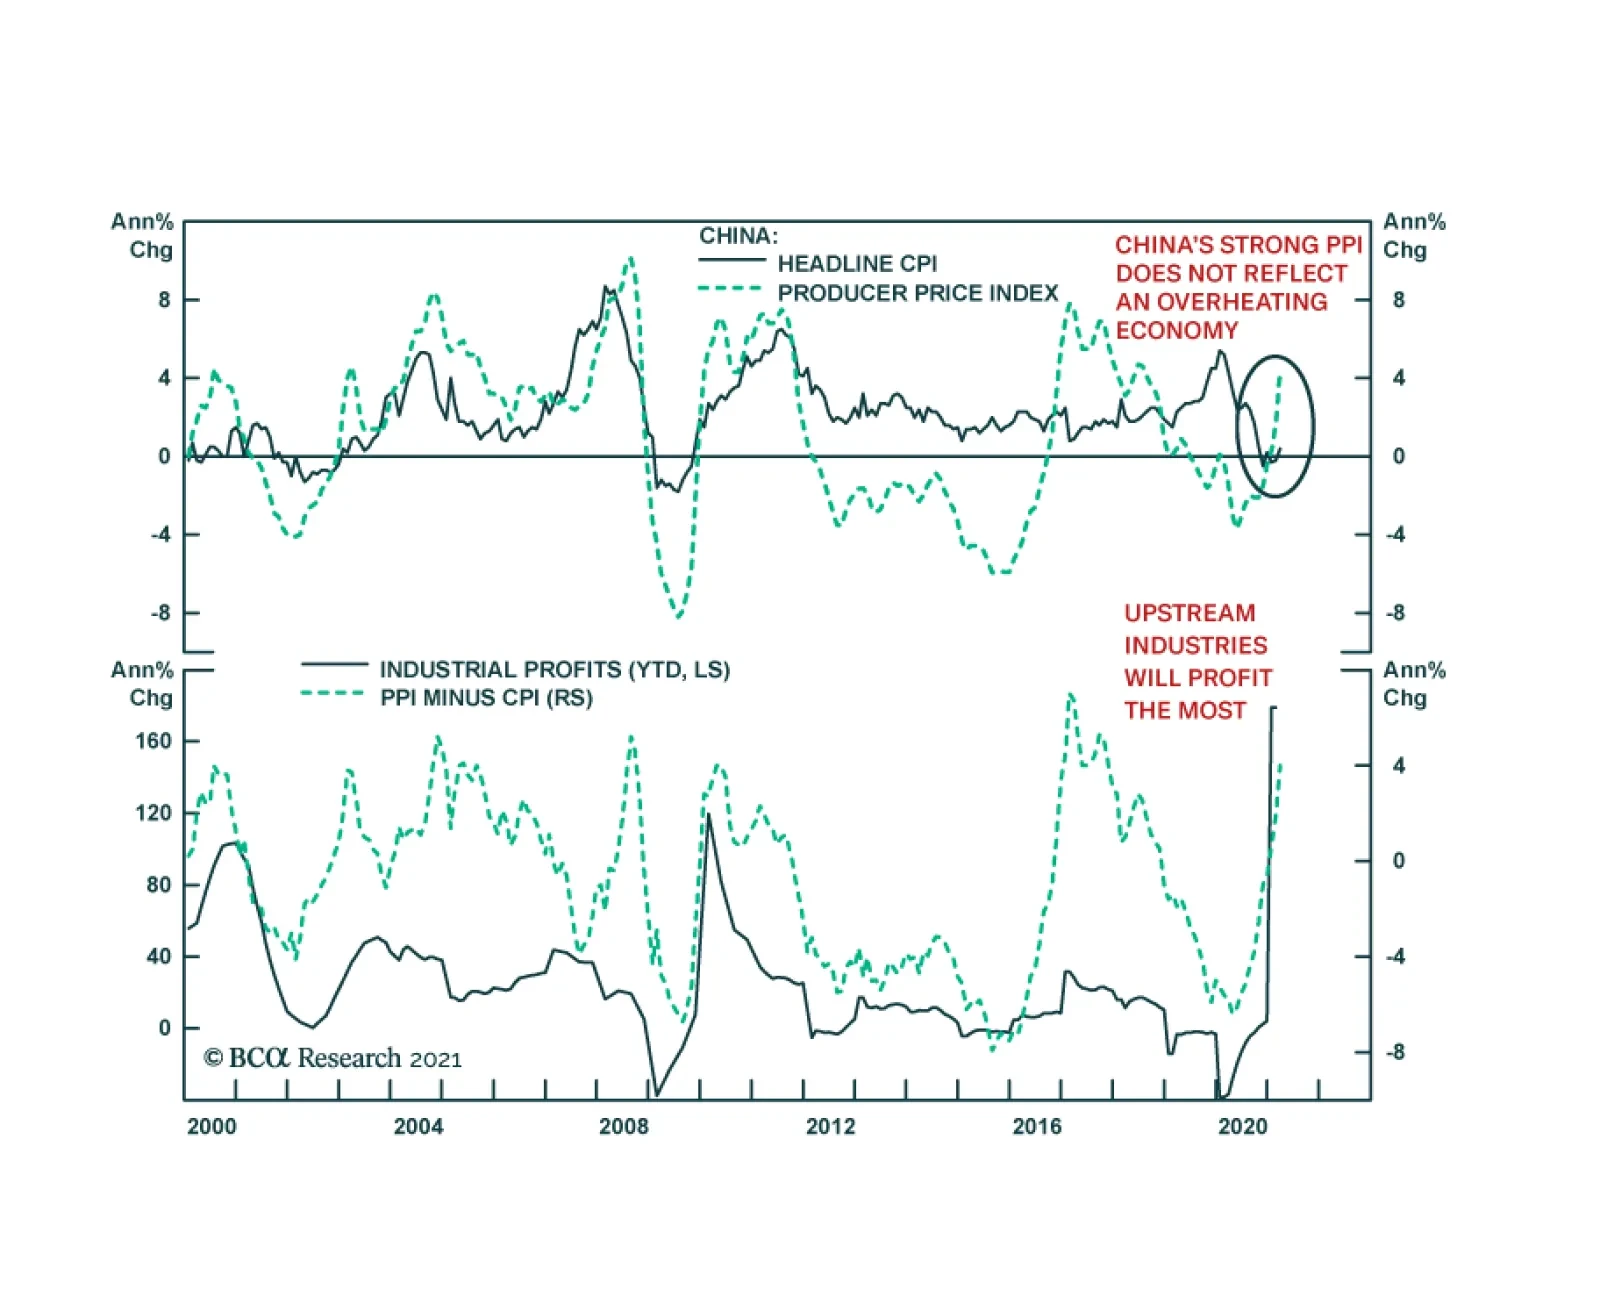
China’s Producer Price Index jumped from 1.7% y/y to 4.4% y/y in March, above consensus expectations of 3.6% y/y. The acceleration is in line with the trend in recent months, raising the risk that the PBoC will respond hawkishly. This is unlikely to be the…