Emerging Markets

Highlights Continued upgrades to global economic growth – most recently by the IMF this week –will support higher natgas prices. In our estimation, gas for delivery at Henry Hub, LA, in the coming withdrawal season (November – March) is undervalued at current levels at ~ $2.90/MMBtu. Inventory demand will remain strong during the current April-October injection season, following the blast of colder-than-normal weather in 1Q21 that pulled inventories lower in the US, Europe and Northeast Asia. The odds the US will succeed in halting completion of the final leg of the Russian Nord Stream 2 natural gas pipeline into Germany are higher than the consensus expectation. Our odds the pipeline will not be completed this year stand at 50%, which translates into higher upside risk for natural gas prices. We are getting long 1Q22 calls on CME/NYMEX Henry Hub-delivered natgas futures struck at $3.50/MMBtu vs. short 1Q22 $3.75/MMBtu calls at tonight's close. The probability of Nord Stream 2 cancellation is underpriced, which means European TTF and Asian JKM prices will have to move higher to attract LNG cargoes next winter from the US, if the pipeline is cancelled (Chart of the Week). Feature As major forecasting agencies continue to upgrade global growth prospects, expectations for industrial-commodity demand – energy, bulks, and base metals – also are moving higher. This week, the IMF raised its growth expectations for this year and next to 6% and 4.4%, respectively, nearly a full percentage-point increase versus its January forecast update for 2021.1 This upgrade follows a similar move by the OECD last month.2 In the US, the EIA is expecting industrial demand for natural gas to rise 1.35 Bcf/d this year to 23.9 Bcf/d; versus 2019 levels, industrial demand will be 0.84 Bcf/d higher in 2021. For 2022, industrial demand is expected to be 24.2 Bcf/d. US industrial demand likely will recover faster than the EU's, given the expectation of a stronger recovery on the back of massive fiscal and monetary stimulus. Overall natgas demand in the US likely will move lower this year, given higher natgas prices expected this year and next will incentivize electricity generators to switch to coal at the margin, according to the EIA. Total demand is expected to be 82.9 Bcf/d in the US this year vs. 83.3 Bcf/d last year, owing to lower generator demand. Pipeline-quality gas output in the US – known as dry gas, since its liquids have been removed for other uses – is expected to average 91.4 Bcf/d this year, essentially unchanged. Lower consumption by the generators and flat production will allow US gas inventories to return to their five-year average levels of 3.7 Tcf by the end of October, in the EIA's estimation (Chart 2). Chart of the WeekUS-Russia Geopolitical Risk Underpriced
US-Russia Pipeline Standoff Could Push LNG Prices Higher
US-Russia Pipeline Standoff Could Push LNG Prices Higher
Chart 2US Natgas Inventories Return To Five-Year Average
US-Russia Pipeline Standoff Could Push LNG Prices Higher
US-Russia Pipeline Standoff Could Push LNG Prices Higher
US Liquified Natural Gas (LNG) exports are likely to expand, as Asian and European demand grows (Chart 3). Prior to the boost in US LNG demand from colder weather, exports set monthly records of 9.4 Bcf/d and 9.8 Bcf/d in November and December of last year, respectively, with Asia accounting for the largest share of exports (Chart 4). This also marked the first time LNG exports exceeded US pipeline exports to Mexico and Canada. The EIA is forecasting US LNG exports will be 8.5 bcf/d and 9.2 Bcf/d this year and next, versus pipeline exports of 8.8 Bcf/d and 8.9 Bcf/d in 2021 and 2022, respectively. Chart 3US LNG Exports Continue Growing
US-Russia Pipeline Standoff Could Push LNG Prices Higher
US-Russia Pipeline Standoff Could Push LNG Prices Higher
Chart 4US LNG Exports Set Records In November And December 2020
US-Russia Pipeline Standoff Could Push LNG Prices Higher
US-Russia Pipeline Standoff Could Push LNG Prices Higher
US LNG exports – and export potential given the size of the resource base at just over 500 Tcf – now are of a sufficient magnitude to be a formidable force in global markets, particularly in Europe. This puts it in direct conflict with Russia, which has targeted Europe as a key market for its pipeline natural gas exports. US-Russia Standoff Looming Over Nord Stream 2 Given the size and distribution of global oil and gas production and consumption, it comes as no surprise national interests can, at times, become as important to pricing these commodities as supply-demand fundamentals. This is particularly true in oil, and increasingly is becoming the case in natural gas. That the same dramatis personae – the US and Russia – should feature in geopolitical contests in oil and gas markets also should not come as a surprise. In an attempt to circumvent transporting its natural gas through Ukraine, Russia is building a 1,230 km underwater pipeline from Narva Bay in the Kingisepp district of the Leningrad region of Russia to Lubmin, near Greifswald, in Germany (Map 1). The Biden administration, like the Trump administration and US Congress, is officially attempting to halt the final leg of the pipeline from being built, although Biden has not yet put America’s full weight into stopping it. Biden claims it will be up to the Europeans to decide what to do. At the same time, any major Russian or Russian-backed military operation in Ukraine could trigger an American action to halt the pipeline in retaliation. Map 1Nord Stream 2 Route
US-Russia Pipeline Standoff Could Push LNG Prices Higher
US-Russia Pipeline Standoff Could Push LNG Prices Higher
In our estimation, there is a 50% chance that the Nord Stream 2 natural gas pipeline will not be completed this year or go into operation as planned given substantial geopolitical risks. The $11 billion pipeline would connect Russia directly to Germany with a capacity of about 55 billion cubic meters, which, combined with the existing Nord Stream One pipeline, would equal 110 BCM in offshore capacity, or 55% of Russia's natural gas exports to Europe in 2019. The pipeline’s construction is 94% complete, with the Russian ship Akademik Cherskiy entering Danish waters in late March to begin laying pipes to finish the final 138-kilometer stretch, according to Reuters. The pipeline could be finished in early August at the pace of 1 kilometer per day.3 The Russian and German governments are speeding up the project to finish it before US-Russia tensions, or the German elections in September, interrupt the construction process again. It is not too late for the US to try to halt the pipeline through sanctions. But for the Americans to succeed, the Biden administration would have to make an aggressive effort. Notably the Biden administration took office with a desire to sharpen US policy toward Russia.4 While Biden seeks Russian engagement on arms reduction treaties and the Iranian nuclear negotiations, he mainly aims to counter Russia, expand sanctions, provide weapons to Ukraine, and promote democracy in Russia’s sphere of influence. The result will almost inevitably be a new US-Russia confrontation, which is already taking shape over Russia’s buildup of troops on the border with Ukraine, where US and Russian meddling could cause civil war to reignite (Map 2). Map 2Russia’s Military Tensions With The West Escalate In Wake Of Biden’s Election And Ukraine’s Renewed Bid To Join NATO
US-Russia Pipeline Standoff Could Push LNG Prices Higher
US-Russia Pipeline Standoff Could Push LNG Prices Higher
Tensions in Ukraine are directly tied to US military cooperation with Ukraine and any possibility that Ukraine will join the NATO military alliance, a red line for Putin. Nord Stream 2 is Russia’s way of bypassing Ukraine but a new US-Russia conflict, especially a Russian attack on Ukraine, would halt the pipeline. The pipeline’s completion would improve Russo-German strategic relations, undercut US liquefied natural gas exports to Germany and the EU, and reduce the US’s and eastern Europe’s leverage over Russia (and Germany). Biden says his administration is planning to impose new sanctions on firms that oversee, construct, or insure the pipeline, and such sanctions are required under American law.5 Yet Biden also wants a strong alliance with Germany, which favors the pipeline and does not want to escalate the conflict with Russia. The American laws against Nord Stream have big loopholes and give the president discretion regarding the use of sanctions, which means Biden would have to make a deliberate decision to override Germany and impose maximum sanctions if he truly wanted to halt construction.6 This would most likely occur if Russia committed a major new act of aggression in Ukraine or against other European democracies. The German policy, under the current ruling coalition led by Chancellor Angela Merkel’s Christian Democratic Union, is to finish the pipeline despite Russia’s conflicts with the West and political repression at home. Russia provides more than a third of Germany’s natural gas imports and this pipeline would bypass eastern Europe’s pipeline network and thus secure Germany’s (and Austria’s and the EU’s) natural gas supply whenever Russia cuts off the flow to Ukraine (through which roughly 40% of Russian natural gas still must pass to reach Europe). Germany's Election And Natgas Politics Germany wants to use natural gas as a bridge while it phases out nuclear energy and coal. Natural gas has grown 2.2 percentage points as a share of Germany’s total energy mix since the Fukushima disaster of 2011, and renewable energy has grown 7.7ppt, while coal has fallen 7.3ppt and nuclear has fallen 2.5ppt (Chart 5). The German federal election on September 26 complicates matters because Merkel and the Christian Democrats are likely to underperform their opinion polls and could even fall from power. They do not want to suffer a major foreign policy humiliation at the hands of the Americans or a strategic crisis with Russia right before the election. They will insist that Biden leave the pipeline alone and will offer other forms of cooperation against Russia in compensation. Therefore, the current German government could push through the pipeline and complete the project even in the face of US objections. But this outcome is not guaranteed. The German Greens are likely to gain influence in the Bundestag after the elections and could even lead the German government for the first time – and they are opposed to a new fossil fuel pipeline that increases Russia’s influence. Chart 5Germany Sees Nord Stream 2 Gas As Bridge To Low-Carbon Economy
US-Russia Pipeline Standoff Could Push LNG Prices Higher
US-Russia Pipeline Standoff Could Push LNG Prices Higher
Hence there is a fair chance that the pipeline does not become operational: either Americans halt it out of strategic interest, or the German Greens halt it out of environmental and strategic interest, or both. True, there is a roughly equal chance that Merkel’s policy status quo survives in Germany, which would result in an operational pipeline. The best case for Germany might be that the current government completes the pipeline physically but the next government has optionality on whether to make it operational. But 50/50 odds of cancellation is a much higher risk than the consensus holds. The Russian policy is to finish Nord Stream 2 while also making an aggressive military stance against the West’s and NATO’s influence in Ukraine. This would expand Russian commodity and energy exports and undercut Ukraine’s natgas transit income. It would also increase Russian leverage over Germany – and it would divide Germany from the eastern Europeans and Americans. A preemptive American intervention would elicit Russian retaliation. The Russians could respond in the strategic sphere or the economic sphere. Economically they could react by cutting off natural gas to Europe, but that would undermine their diplomatic goals, so they would more likely respond by increasing production of natural gas or crude oil to steal American market share. In any scenario Russian retaliation would likely cause global price volatility in one or more energy markets, in addition to whatever volatility is induced by the cancellation of Nord Stream 2 itself. US-Russia tensions are likely to escalate but only Ukraine and Nord Stream 2, or the separate Iranian negotiations, have a direct impact on global energy supply. If Germany goes forward with the pipeline, then Russia would need to be countered by other means. The Americans, not the Germans, would provide these “other means,” such as military support to ensure the integrity of Ukraine and other nations’ borders. The Russians may gain a victory for their energy export strategy but they will never compromise on Ukraine and they will still need to focus on the broader global shift to renewable energy, which threatens their economic model and hence ultimately their regime stability. So, the risk of a market-moving US-Russia conflict can be delayed but probably not prevented (Chart 6). Chart 6US-Russia Conflit Likely
US-Russia Conflit Likely
US-Russia Conflit Likely
Bottom Line: The Nord Stream 2 pipeline is not guaranteed to be completed this year as planned. The US is more likely to force a halt to the Nord Stream 2 pipeline than the consensus holds, especially if Russia attacks Ukraine. If the US fails to do so, then the German election will become the next signpost for whether the pipeline will become operational. If the Americans halt the pipeline, then US-Russian conflict either already erupted or will occur sooner rather than later and will likely impact global oil or natural gas prices. Investment Implications Our subjective assessment of 50% odds the US will succeed in halting completion of the final leg of Nord Stream 2 are higher than the consensus expectation. This translates directly into higher upside risk for natural gas prices in the US and Europe later this year and next. Given our view, we are getting long 1Q22 calls on CME/NYMEX Henry Hub-delivered natgas futures struck at $3.50/MMBtu vs. short 1Q22 $3.75/MMBtu calls at tonight's close. The probability of Nord Stream 2 cancellation is underpriced, which means the odds of higher prices in the LNG market are underpriced (Chart 7). The immediate implication of our view is European TTF prices will have to move higher to attract LNG cargoes next winter from the US, if the Nord Stream 2 pipeline's final leg is cancelled. This also would tighten the Asian markets, causing the JKM to move higher as well (Chart 8). Any indication of colder-than-normal weather in the US, Europe or Asian markets would mean a sharper move higher. Chart 7Natgas Tails Are Too Narrow For Next Winter
US-Russia Pipeline Standoff Could Push LNG Prices Higher
US-Russia Pipeline Standoff Could Push LNG Prices Higher
Chart 8Nord Stream 2 Cancellation Would Boost JKM Prices
Nord Stream 2 Cancellation Would Boost JKM Prices
Nord Stream 2 Cancellation Would Boost JKM Prices
Robert P. Ryan Chief Commodity & Energy Strategist rryan@bcaresearch.com Matt Gertken Vice President Geopolitical Strategy mattg@bcaresearch.com Commodities Round-Up Energy: Bullish The US and Iran began indirect talks earlier this week in Vienna aimed at restoring the Joint Comprehensive Plan of Action (JCPOA), otherwise known as the "Iran nuclear deal." All of the other parties of the deal – Britain, China, France, Germany and Russia – are in favor of restoring the deal. BCA Research believes this is most likely to occur prior to the inauguration of a new president who is expected to be a hardliner willing to escalate Iran’s demands. US President Biden can unilaterally ease sanctions and bring the US into compliance with the deal, and Iran could then reciprocate. If a deal is not reached by August it could take years to resolve US-Iran tensions. China could offer to cooperate on sanctions and help to broker negotiations following the signing of its 25-year trade deal with Iran last week. Russia likely would demand the US not pressure its allies to cancel the Nord Stream 2 deal, in return for its assistance in brokering a deal. Base Metals: Bullish Iron ore prices continue to be supported by record steel prices in China, trading at more than $173/MT earlier this week. Even though steel production reportedly is falling in the top steel-producer in China, Tangshan, as a result of anti-pollution measures, for iron ore remains stout. As we have previously noted, we use steel prices as a leading indicator for copper prices. We remain long Dec21 copper and will be looking for a sell-off to get long Sep21 copper vs. short Sep21 copper if the market trades below $4/lb on the CME/COMEX futures market (Chart 9). Precious Metals: Bullish Gold held support ~ $1,680/oz at the end of March, following an earlier test in the month. We remain long the yellow metal, despite coming close to being stopped out last week (Chart 10). The earlier sell-off appeared to be caused by a need to raise liquidity to us. We continue to expect the Fed to hold firm to its stated intent to wait for actual inflation to become manifest before raising rates, and, therefore, continue to expect real rates to weaken. This will be supportive of gold and commodities generally (Chart 10). Ags/Softs: Neutral Corn continues to be well supported above $5.50/bu, following last week's USDA report showing farmers intend to increase acreage planted to just over 91mm acres, which is less than 1% above last year's level. Chart 9
Copper Prices Surge As Global Storage Draws
Copper Prices Surge As Global Storage Draws
Chart 10
Gold Disconnected From US Dollar And Rates
Gold Disconnected From US Dollar And Rates
Footnotes 1 Please see the Fund's April 2021 forecast Managing Divergent Recoveries. 2 We noted last week these higher growth expectations generally are bullish for industrial commodities – energy, metals, and bulks. Please see Fundamentals Support Oil, Bulks, And Metals, which we published 1 April 2021. It is available at ces.bcaresearch.com. 3 For the rate of construction see Margarita Assenova, “Clouds Darkening Over Nord Stream Two Pipeline,” Eurasia Daily Monitor 18: 17 (February 1, 2021), Jamestown Foundation, jamestown.org. For the current status, see Robin Emmott, “At NATO, Blinken warns Germany over Nord Stream 2 pipeline,” Reuters, March 23, 2021, reuters.com. 4 The Democratic Party blames Russia for what it sees as a campaign to undermine the democratic West and recreate the Soviet sphere of influence. See for example the 2008 invasion of Georgia, the failure of the Obama administration’s 2009-11 diplomatic “reset,” the Edward Snowden affair, the seizure of Crimea and civil war in Ukraine, the survival of Syria’s dictator, and Russian interference in US elections in 2016 and 2020. 5 The Countering Russian Influence in Europe and Eurasia Act of 2017, and the Protecting Europe’s Energy Security Act of 2019/2020, contain provisions requiring sanctions on firms that have contributed in any way a minimum of $1 million to the project, or provide pipe-laying services or insurance. There are exceptions for services provided by the governments of the EU member states, Norway, Switzerland, or the UK. The president has discretion over the implementation of sanctions as usual. 6 The German state of Mecklenburg-Vorpommern is creating a shell foundation to enable the completion of the pipeline. It can shield companies from American sanctions aimed at private companies, not sovereigns. Investment Views and Themes Recommendations Strategic Recommendations Tactical Trades Commodity Prices and Plays Reference Table Summary of Closed Trades
Higher Inflation On The Way
Higher Inflation On The Way
We calculate sector and country effects for an Emerging Market portfolio. We then use our results to make conclusions on EM equity allocations. Although sector effects increased significantly over the past three years in EM, country effects continue to play a larger role. This means that EM equity investors should continue incorporating country macro views into their portfolio construction. Sector composition is more important for countries like Colombia, Mexico, and Russia whose composition is substantially different from the EM benchmark.
As expected, the Reserve Bank of India kept the benchmark repurchase rate unchanged at 4% at its Wednesday meeting. Nonetheless, the RBI managed to surprise investors by announcing plans to purchase up to one trillion rupees ($14 billion) of bonds this…
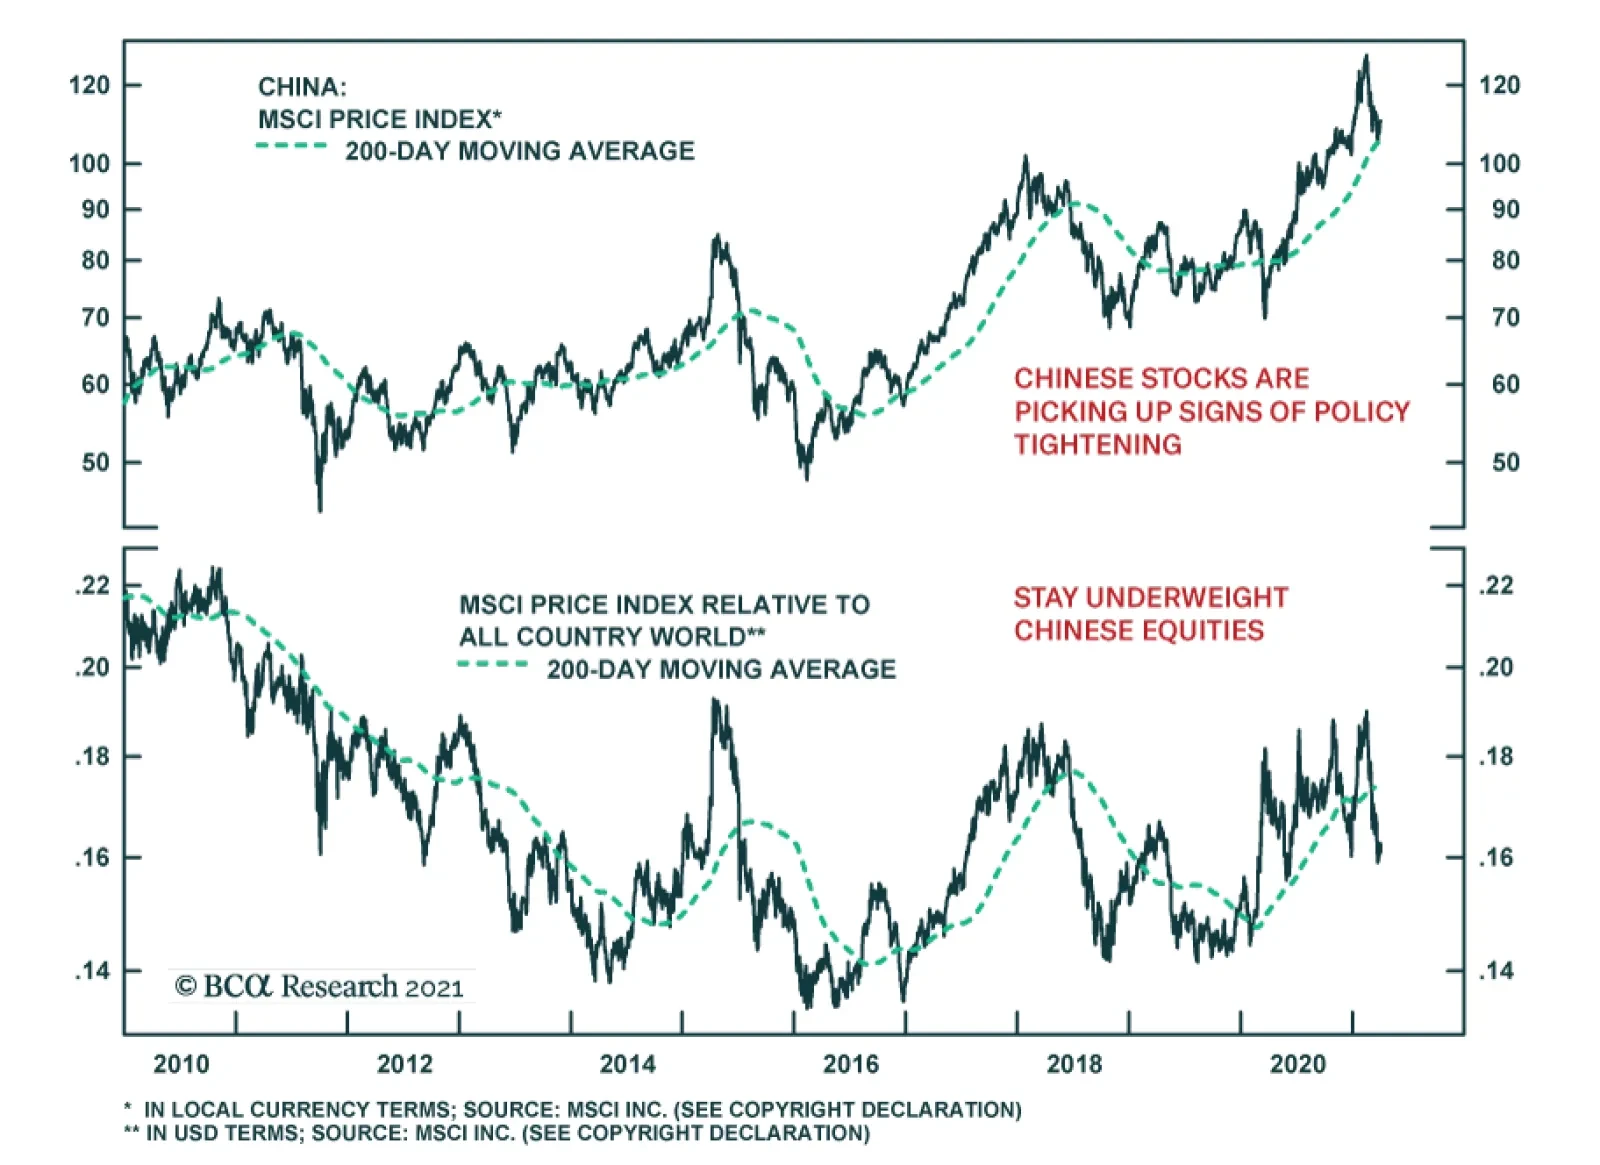
Feature The selloff in Chinese stocks since mid-February reflects a rollover in earnings growth and multiples. Lofty valuations in Chinese equities driven by last year’s massive stimulus means that stock prices are vulnerable to any pullback in policy supports (Chart 1A and 1B). Chart 1AGrowth In Chinese Investable Earnings And Multiple Expansions Has Rolled Over
Growth In Chinese Investable Earnings And Multiple Expansions Has Rolled Over
Growth In Chinese Investable Earnings And Multiple Expansions Has Rolled Over
Chart 1BEarnings Outlook Still Looks Promising In The Onshore Market, But May Soon Peak
Earnings Outlook Still Looks Promising In The Onshore Market, But May Soon Peak
Earnings Outlook Still Looks Promising In The Onshore Market, But May Soon Peak
After diverging in the past seven to eight months, Chinese stocks have started to gravitate towards deteriorating monetary conditions index. The market may be beginning to price in a peak in economic as well as corporate profit growth (Chart 2). Defensive stocks in China’s onshore and offshore equity markets have also outperformed cyclicals since February, which confirms that investors expect earnings growth will slow in the coming months (Chart 3). A tighter monetary policy stance, coupled with increased regulations targeting the real estate, banking, and tech sectors have further dampened investors’ appetite for Chinese stocks. Chart 2A-Share Prices Start To Gravitate Towards Tightening Monetary Conditions
A-Share Prices Start To Gravitate Towards Tightening Monetary Conditions
A-Share Prices Start To Gravitate Towards Tightening Monetary Conditions
Chart 3Defensives Have Prevailed Over Cyclicals In Both Onshore And Offshore Markets
Defensives Have Prevailed Over Cyclicals In Both Onshore And Offshore Markets
Defensives Have Prevailed Over Cyclicals In Both Onshore And Offshore Markets
The official PMIs bounced back smartly in March following three consecutive months of decline. However, the strong PMI readings do not change our view that the speed of China’s economic recovery is near its zenith. PMIs in the first two months of the year are typically lower due to the Lunar New Year (LNY), and the improvement in March’s PMI did not exceed seasonal rebounds experienced in previous years. Weakening fixed-asset investments also indicate that economic activity is moderating. We remain cautious on the 6 to 12-month outlook for Chinese stocks, in both absolute and relative terms. Qingyun Xu, CFA Associate Editor qingyunx@bcaresearch.com Jing Sima China Strategist jings@bcaresearch.com China’s NBS manufacturing and non-manufacturing PMIs in March beat market expectations with sharp rebounds after moderating in the previous three months. The improvement in the PMIs will likely provide authorities with confidence to stay the course on policy normalization. The methodology calculating PMI indexes reflects the net reported improvement in business activities relative to the previous month and there was a notable decline in PMIs in February, due to the LNY holiday and travel restrictions related to the spread of COVID-19. Additionally, the average reading of China’s official composite PMI in Q1 this year was 2.2 percentage points lower than in Q4 last year and weaker than the Q1 PMI figures in most of the pre-pandemic years. Moreover, Chinese Caixin manufacturing PMI, which focuses on smaller and private corporates, declined further in March as it continued its downward trend started in December 2020. Chart 4Q1 PMIs Slowed By More Than Seasonal Factors
Q1 PMIs Slowed By More Than Seasonal Factors
Q1 PMIs Slowed By More Than Seasonal Factors
Chart 5Caixin PMI Shows Further Deterioration Among Private-Sector Manufacturers
Caixin PMI Shows Further Deterioration Among Private-Sector Manufacturers
Caixin PMI Shows Further Deterioration Among Private-Sector Manufacturers
Growth in credit expansions in February was better than expected, supported by a substantial increase in corporates’ demand for medium- and long-term loans. Travel restrictions during this year’s LNY led to a shorter holiday, a faster resumption in manufacturing activity after the break and stronger credit demand in February. China’s Monetary Policy Committee meeting last week reiterated the authorities’ hawkish policy tone and removed dovish language prevalent in last month’s National People’s Congress, such as “maintaining the consistency, stability, and sustainability in monetary policy” and “not making a sudden turn in policymaking.” Given the strong headline economic and credit data in January and February, the authorities will be unlikely to slow normalizing monetary policy. Therefore, the risk of a policy-tightening overshoot remains high. The PBoC has continued to drain net liquidity in the interbank system since early this year, evidenced by falling excess reserves at the central bank. Excess reserves normally lead the credit impulse by about six months, signaling that the latter will continue to decelerate in the months ahead. In turn, the credit impulse normally leads the business cycle by six to nine months, meaning that China’s cyclical economic recovery will likely peak in the first half of 2021. Chart 6Corporates Demand For Longer-Term Bank Loans Resumed Their Upward Trend Early This Year
Corporates Demand For Longer-Term Bank Loans Resumed Their Upward Trend Early This Year
Corporates Demand For Longer-Term Bank Loans Resumed Their Upward Trend Early This Year
Chart 7Falling Excess Reserves Leads To A Deceleration In Credit And Economic Growth
Falling Excess Reserves Leads To A Deceleration In Credit And Economic Growth
Falling Excess Reserves Leads To A Deceleration In Credit And Economic Growth
Robust industrial activities and improving profitability helped to boost profit growth in January and February. The bounce in producer prices also drove up returns in industrial output, particularly in upstream industries loaded with commodity producers. Nevertheless, weak final demand is limiting the ability of Chinese producers to pass on higher prices to domestic consumers, highlighted in the divergence between Chinese PPI and CPI. In addition, China’s domestic demand for commodities and industrial metals may reach its cyclical peak in mid-2021, following ongoing credit tightening and reduced economic activity. Commodity inventories have surged to historical highs due to soaring imports (which far exceeded consumption) during 2H20. Inventory destocking pressures will weigh on commodity prices with China’s domestic demand reaching its cyclical peak. Disinflation/deflation pressures may re-emerge in 2H21, which will pose downside risks to China’s industrial profits. Chart 8Industrials Posted A Strong Rebound In The First Two Months of 2021
Industrials Posted A Strong Rebound In The First Two Months of 2021
Industrials Posted A Strong Rebound In The First Two Months of 2021
Chart 9Surging Commodity Prices Helped To Boost Upstream Industry Profits
Surging Commodity Prices Helped To Boost Upstream Industry Profits
Surging Commodity Prices Helped To Boost Upstream Industry Profits
Chart 10Domestic Final Demand Remains Sluggish
Domestic Final Demand Remains Sluggish
Domestic Final Demand Remains Sluggish
Chart 11Decelerating Chinese Credit Growth Poses Downside Risks To Global Commodity Prices
Decelerating Chinese Credit Growth Poses Downside Risks To Global Commodity Prices
Decelerating Chinese Credit Growth Poses Downside Risks To Global Commodity Prices
Chart 12Chinas Raw Material Inventory Restocking Cycle May Be Near A Cyclical Peak
Chinas Raw Material Inventory Restocking Cycle May Be Near A Cyclical Peak
Chinas Raw Material Inventory Restocking Cycle May Be Near A Cyclical Peak
Chart 13Real Estate And Infrastructure Investment Losing Steam In 2021
Real Estate And Infrastructure Investment Losing Steam In 2021
Real Estate And Infrastructure Investment Losing Steam In 2021
Investments in infrastructure and real estate drove China’s economic recovery in the second half of 2020. However, growth momentum in both sectors has slowed because of retreating government spending in infrastructure and tightening regulations in the property sector. Both home sales and housing prices, especially in tier-one cities, rose significantly in January-February this year, deepening authorities’ concerns over bubble risks in the property market. The share of mortgages, deposits and advanced payments as a source of funds for property developers reached an all-time high in February. Following the LNY, the authorities introduced a slew of new restrictions on the housing market to curb excessive demand. These were in addition to placing limits on bank lending to both property developers and household mortgages. All of these measures will weigh on housing supply and demand, and the impact is already evident in falling land purchases and housing starts. At the same time, property developers are rushing to complete existing projects. The tighter regulations on real estate financing will likely weaken growth in real estate investment and construction activities in the second half of this year. Chart 14Housing Prices In Top-Tier Cities Have Been On A Tear …
Housing Prices In Top-Tier Cities Have Been On A Tear
Housing Prices In Top-Tier Cities Have Been On A Tear
Chart 15… But Bank Lending To Developers And Mortgage Loans Continue Downward Trend
But Bank Lending To Developers And Mortgage Loans Continue Downward Trend
But Bank Lending To Developers And Mortgage Loans Continue Downward Trend
Chart 16Property Developers Are Rushing To Sell And Complete Existing Projects
Property Developers Are Rushing To Sell And Complete Existing Projects
Property Developers Are Rushing To Sell And Complete Existing Projects
Chart 17Forward-Looking Indicators Suggest A Slowdown In Housing And Construction Activities
Forward-Looking Indicators Suggest A Slowdown In Housing And Construction Activities
Forward-Looking Indicators Suggest A Slowdown In Housing And Construction Activities
Table 1China Macro Data Summary
China Macro And Market Review
China Macro And Market Review
Table 2China Financial Market Performance Summary
China Macro And Market Review
China Macro And Market Review
Footnotes Cyclical Investment Stance Equity Sector Recommendations
China’s Caixin PMI showed an expansion in economic activity in March, in line with the message from the official PMI released last week. The Caixin Services PMI rebounded to 54.3 from 51.5, exceeding expectations of a 52.1 print. This offset the impact of the…
Our long Russian equities / short EM tactical recommendation is up 6.28% since initiation on February 5. However, risks to this trade are now rising. On Monday, President Putin signed a law allowing him to run for two more six-year terms, raising the…
Highlights Global manufacturing activity will soon peak due to growing costs and China’s policy tightening. This process will allow the dollar’s rebound to continue. EUR/USD’s correction will run further. This pullback in the euro is creating an attractive buying opportunity for investors with a 12- to 24-month investment horizon. Eurozone banks will continue to trade in unison with the euro. Feature The correction in the euro has further to run. The dollar currently benefits from widening real interest differentials, but a growing list of headwinds will cause a temporary setback for the global manufacturing sector, which will fuel the greenback rally further. Nonetheless, EUR/USD will stabilize between 1.15 and 1.12, after which it will begin a new major up-leg. Consequently, investors with a 12- to 24-month investment horizon should use the current softness to allocate more funds to the common currency. A Hiccup In Global Industrial Activity Global manufacturing activity is set to decelerate on a sequential basis and the Global Manufacturing PMI will soon peak. The first problem for the global manufacturing sector is the emergence of financial headwinds. The sharp rebound in growth in the second half of 2020 and the optimism created by last year’s vaccine breakthrough as well as the rising tide of US fiscal stimulus have pushed US bond yields and oil prices up sharply. These financial market moves are creating a “growth tax” that will bite soon. Mounting US interest rates have lifted global borrowing costs while the doubling in Brent prices has increased the costs of production and created a small squeeze on oil consumers. Thus, even if the dollar remains well below its March 2020 peak, our Growth Tax Indicator (which incorporates yields, oil prices and the US dollar) warns of an imminent top in the US ISM Manufacturing and the Global Manufacturing PMI (Chart 1). Already, the BCA Global Leading Economic Indicator diffusion index has dipped below the 50% line, which usually ushers in downshifts in global growth. A deceleration in China’s economy constitutes another problem for the global manufacturing cycle. Last year’s reflation-fueled rebound in Chinese economic activity was an important catalyst to the global trade and manufacturing recovery. However, according to BCA Research’s Emerging Market Strategy service, Beijing is now tightening policy, concerned by a build-up in debt and excesses in the real estate sector. Already, the PBoC’s liquidity withdrawals are resulting in a decline of commercial bank excess reserves, which foreshadows a slowing of China’s credit impulse (Chart 2). Chart 1The Global Growth Tax Will Bite
The Global Growth Tax Will Bite
The Global Growth Tax Will Bite
Chart 2Chinese Credit Will Slow
Chinese Credit Will Slow
Chinese Credit Will Slow
In addition to liquidity withdrawals, Chinese policymakers are also tightening the regulatory environment to tackle excessive debt buildups and real estate speculation. The crackdown on property developers and house purchases will cause construction activity to shrink in the second half of 2021. Meanwhile, tougher rules for both non-bank lenders and the asset management divisions of banks will further harm credit creation. BCA’s Chief EM strategist, Arthur Budaghyan, notes that consumer credit is already slowing. Chinese fiscal policy is unlikely to create a counterweight to the deteriorating credit impulse. China’s fiscal impulse will be slightly negative next year. Chinese financial markets are factoring in these headwinds, and on-shore small cap equities are trying to break down while Chinese equities are significantly underperforming global benchmarks. Chart 3Deteriorating Surprises
Deteriorating Surprises
Deteriorating Surprises
Bottom Line: The combined assault from the rising “growth tax” and China’s policy tightening is leaving its mark. Economic surprises in the US, the Eurozone, EM and China have all decelerated markedly (Chart 3), which the currency market echoes. Some of the most pro-cyclical currencies in the G-10 are suffering, with the SEK falling relative to the EUR and the NZD and AUD both experiencing varying degrees of weakness. The Euro Correction Will Run Further… Until now, the euro’s decline mostly reflects the rise in US interest rate differentials; however, the coming hiccup in the global manufacturing cycle is causing a second down leg for the euro. First, the global economic environment remains consistent with more near-term dollar upside, due to: Chart 4Commodities Are Vulnerable
Commodities Are Vulnerable
Commodities Are Vulnerable
A commodity correction that will feed the dollar’s rebound. Aggregate speculator positioning and our Composite Technical Indicator show that commodity prices are technically overextended (Chart 4). With this backdrop, the coming deceleration in Chinese economic activity is likely to catalyze a significant pullback in natural resources, which will hurt rates of returns outside the US and therefore, flatter the dollar. The dollar’s counter-cyclicality. The expected pullback in the Global Manufacturing PMI is consistent with a stronger greenback (Chart 5). The dollar’s momentum behavior. Among G-10 FX, the dollar responds most strongly to the momentum factor (Chart 6). Thus, the likelihood is high that the dollar’s recent rebound will persist, especially because our FX team’s Dollar Capitulation Index has only recovered to neutral from oversold levels and normally peaks in overbought territory. Chart 5The Greenback's Counter-Cyclicality
The Greenback's Counter-Cyclicality
The Greenback's Counter-Cyclicality
Chart 6The Dollar Is A High Momentum Currency
The Euro Dance: One Step Back, Two Steps Forward
The Euro Dance: One Step Back, Two Steps Forward
Second, the euro’s specific dynamics remain negative for now. Based on our short-term valuation model, the fair value of EUR/USD has downshifted back to 1.1, which leaves the euro 7% overvalued (Chart 7). Until now, real interest rate differentials and the steepening of the US yield curve relative to Germany’s have driven the decline in the fair value estimate. However, the deceleration in global growth also hurts the euro’s fair value because the US is less exposed than the Eurozone to the global manufacturing cycle. Chart 7The Euro's Short-Term Fair Value Is At 1.1
The Euro's Short-Term Fair Value Is At 1.1
The Euro's Short-Term Fair Value Is At 1.1
Chart 8Speculators Have Not Capitulated
Speculators Have Not Capitulated
Speculators Have Not Capitulated
The euro is also technically vulnerable, similar to commodities. Speculators are still massively net long EUR/USD and the large pool of long bets in the euro suggests that a capitulation has yet to take place (Chart 8). The euro responds very negatively to a weak Chinese economy. The Eurozone has deeper economic ties with China than the US. Exports to China account for 1.7% of the euro area’s GDP, and 2.8% of Germany’s compared to US exports to China at 0.5% of GDP. Indirect financial links are also larger. Credit to EM accounts for 45% of the Eurozone’s GDP compared to 5% for the US. Thus, the negative impact of a Chinese slowdown on EM growth has greater spillovers on European than on US ones rates of returns. A weak CNY and sagging Chinese capital markets harm the euro. The euro’s rebound from 1.064 on March 23 2020 to 1.178 did not reflect sudden inflows into European fixed-income markets. Instead, the money that previously sought higher interest rates in the US left that country for EM bonds and China’s on-shore fixed-income markets, the last major economies with attractive yields. These outflows from the US to China and EM pushed the dollar down, which arithmetically helped the euro. Thus, the recent EUR/USD correlates closely with Sino/US interest rate and with the yuan because the euro’s strength reflects the dollar demise (Chart 9). Consequently, a decelerating Chinese economy will also hurt EUR/USD via fixed-income market linkages. Finally, the euro will depreciate further if global cyclical stocks correct relative to defensive equities. Deep cyclicals (financials, consumer discretionary, energy, materials and industrials) represent 59% of the Eurozone MSCI benchmark versus 36% of the US index. Cyclical equities are exceptionally overbought and expensive relative to defensive names. They are also very levered to the global business cycle and Chinese imports. In this context, the expected deterioration in both China’s economic activity and the Global Manufacturing PMI could cause a temporary but meaningful pullback in the cyclicals-to-defensives ratio and precipitate equity outflows from Europe into the US (Chart 10). Chart 9EUR/USD And Chinese Rates
EUR/USD And Chinese Rates
EUR/USD And Chinese Rates
Chart 10EUR/USD Will Follow Cyclicals/Defensives
EUR/USD Will Follow Cyclicals/Defensives
EUR/USD Will Follow Cyclicals/Defensives
Bottom Line: A peak in the global manufacturing PMI will hurt the euro, especially because China will meaningfully contribute to this deceleration in global industrial activity. Thus, the euro’s pullback has further to run. An important resistance stands at 1.15. A failure to hold will invite a rapid decline to EUR/USD 1.12. Nonetheless, the euro’s depreciation constitutes nothing more than a temporary pullback. … But The Long-Term Bull Market Is Intact We recommend buying EUR/USD on its current dip because the underpinnings of its cyclical bull market are intact. Chart 11Investors Structurally Underweight Europe
Investors Structurally Underweight Europe
Investors Structurally Underweight Europe
First, investors are positioned for a long-term economic underperformance of the euro area relative to the US. The depressed level of portfolio inflows into Europe relative to the US indicates that investors already underweight European assets (Chart 11). This pre-existing positioning limits the negative impact on the euro of the current decrease in European growth expectations (Chart 11, bottom panel). Second, as we wrote last week, European growth is set to accelerate significantly this summer. Considering the absence of ebullient investor expectations toward the euro, this process can easily create upside economic surprises later this year, especially when compared to the US. Moreover, the deceleration in Chinese and global growth will most likely be temporary, which will limit the duration of their negative impact on Europe. Third, the US stimulus measure will create negative distortions for the US dollar. The addition of another long-term stimulus package of $2 trillion to $4 trillion to the $7 trillion already spent by Washington during the crisis implies that the US government deficit will not narrow as quickly as US private savings will decline. Therefore, the US current account deficit will widen from its current level of 3.5% of GDP. As a corollary, the US twin deficit will remain large. Meanwhile, the Fed is unlikely to increase real interest rates meaningfully in the coming two years because it believes any surge in inflation this year will be temporary. Furthermore, the FOMC aims to achieve inclusive growth (i.e. an overheated labor market). This policy combination forcefully points toward greater dollar weakness. The US policy mix looks particularly dollar bearish when compared to that of the Eurozone. To begin with, the balance of payment dynamics make the euro more resilient. The euro area benefits from the underpinning of a current account surplus of 1.9% of GDP. Moreover, the European basic balance of payments stands at 1.5% of GDP compared to a 3.6% deficit for the US. Additionally, FDI into Europe are rising relative to the US. The divergence in the FDI trends will continue due to the high probability that the Biden administration will soon increase corporate taxes. Chart 12The DEM In The 70s
The DEM In The 70s
The DEM In The 70s
The combination of faster vaccine penetration and much larger fiscal stimulus means that the US economy will overheat faster than Europe’s. Because the Fed seems willing to tolerate higher inflation readings, US CPI will rise relative to the Eurozone. In the 1970s, too-easy policy in Washington meant that the gap between US and German inflation rose. Despite the widening of interest rate and growth differentials in favor of the USD or the rise in German relative unemployment, the higher US inflation dominated currency fluctuations and the deutschemark appreciated (Chart 12). A similar scenario is afoot in the coming years, especially in light of the euro bullish relative balance of payments. Fourth, valuations constitute an additional buttress behind the long-term performance of the euro. Our FX strategy team Purchasing Power Parity model adjusts for the different composition of price indices in the US and the euro area. Based on this metric, the euro is trading at a significant 13% discount from its long-term fair value, with the latter being on an upward trend (Chart 13). Furthermore, BCA’s Behavioral Exchange Rate Model for the trade-weighted euro is also pointing up, which historically augurs well for the common currency. Lastly, even if the ECB’s broad trade-weighted index stands near an all-time high, European financial conditions remain very easy. This bifurcation suggests that the euro is not yet a major hurdle for the continent and can enjoy more upside (Chart 14). Chart 13EUR/USD Trades Well Below Long-Term Fair Value
EUR/USD Trades Well Below Long-Term Fair Value
EUR/USD Trades Well Below Long-Term Fair Value
Chart 14Easy European Financial ##br##Conditions
Easy European Financial Conditions
Easy European Financial Conditions
Chart 15Make Room For the Euro!
Make Room For the Euro!
Make Room For the Euro!
Finally, the euro will remain a beneficiary from reserve diversification away from the USD. The dollar’s status as the premier reserve currency is unchallenged. However, its share of global reserves has scope to decline while the euro’s proportion could move back to the levels enjoyed by legacy European currencies in the early 1990s (Chart 15). Large reserve holders will continue to move away from the dollar. BCA Research’s Geopolitical Strategy team argues that US tensions with China transcend the Trump presidency. Meanwhile, the current administration’s relationship with Russia and Saudi Arabia will be cold. For now, their main alternative to the dollar is the euro because of its liquidity. Moreover, the NGEU stimulus program creates an embryonic mechanism to share fiscal risk within the euro area. The Eurozone is therefore finally trying to evolve away from a monetary union bereft of a fiscal union. This process points toward a lower probability of a break up, which makes the euro more attractive to reserve managers. Bottom Line: Despite potent near-term headwinds, the euro’s long-term outlook remains bright. Global investors already underweight European assets, yet balance of payment and policy dynamics point toward a higher euro. Moreover, valuations and geopolitical developments reinforce the cyclical tailwinds behind EUR/USD. Thus, investors with a 12- to 24-month investment horizon should use the current euro correction to gain exposure to the European currencies. Any move in EUR/USD below 1.15 will generate a strong buy signal. Sector Focus: European Banks And The Istanbul Shake The recent decline in euro area bank stocks coincides with the 14% increase in USD/TRY and the 17% decline in the TUR Turkish equities ETF following the sacking of Naci Ağbal, the CBRT governor. President Erdogan is prioritizing growth over economic stability because his AKP party is polling poorly ahead of the 2023 election. The Turkish economy is already overheating, and the lack of independence of the CBRT under the leadership of Şahap Kavcıoğlu promises a substantial increase in Turkish inflation, which already stands at 16%. Hence, foreign investors will flee this market, creating further downward pressures on the lira and Turkish assets. European banks have a meaningful exposure to Turkey. Turkish assets account for 3% of Spanish bank assets or 28% of Tier-1 capital. For France, this exposure amounts to 0.7% and 5% respectively, and for the UK, it reaches 0.3% and 2%. As a comparison, claims on Turkey only represent 0.3% and 0.5% of the assets and Tier-1 capital of US banks. Unsurprisingly, fluctuations in the Turkish lira have had a significant impact one the share prices of European banks in recent years, even after controlling for EPS and domestic yield fluctuations (Table 1). Table 1TRY Is Important To European Banks…
The Euro Dance: One Step Back, Two Steps Forward
The Euro Dance: One Step Back, Two Steps Forward
Nonetheless, today’s TRY fluctuations are unlikely to have the same lasting impact on European banks share prices as they did from 2017 to 2019 because European banks have already shed significant amounts of Turkish assets (Chart 16). This does not mean that European banks are out of the woods yet. The level of European yields remains a key determinant of the profitability of Eurozone’s banks, and thus, of their share prices (Chart 17, top panel). Moreover, the euro still tightly correlates with European bank stocks as well (Chart 17, bottom panel). As a result, our view that the global manufacturing cycle will experience a temporary downshift and the consequent downside in EUR/USD both warn of further underperformance of European banks. Chart 16… But Less Than It ##br##Once Was
The Euro Dance: One Step Back, Two Steps Forward
The Euro Dance: One Step Back, Two Steps Forward
Chart 17Higher Yields And A stronger Euro, These Are Few Of My Favorite Things
Higher Yields And A stronger Euro, These Are Few Of My Favorite Things
Higher Yields And A stronger Euro, These Are Few Of My Favorite Things
These same views also suggest that this decline in bank prices is creating a buying opportunity. Ultimately, we remain cyclically bullish on the euro and the transitory nature of the manufacturing slowdown implies that global yields will resume their ascent. The cheap valuations of European banks, which trade at 0.6-times book value, make them option-like vehicles to bet on these trends, even if the banking sectors long-term prospects are murky. Moreover, they are a play on Europe’s domestic recovery this summer. We will explore banks in greater detail in future reports. Mathieu Savary, Chief European Investment Strategist Mathieu@bcaresearch.com
Highlights The Biden administration is combining Trumpian nationalism with a renewed push for US innovation in a major infrastructure bill that is highly likely to become law. Populism and Great Power struggle with China and Russia are structural forces that give enormous momentum to this effort. Don’t bet against it. President Biden’s $2.4 trillion infrastructure and green energy plan has a subjective 80% chance of passing into law by the end of the year, as infrastructure is popular and Democrats control Congress. The net deficit increase will range from $700 billion to $1.3 trillion depending on the size of corporate tax hikes in the final bill. The second part of Biden’s plan, the roughly $2 trillion American Families Plan, has a much lower chance of passage – at best 50/50 – as the 2022 midterm elections will loom and fiscal fatigue will set in. While the US infrastructure package is a positive cyclical catalyst, it was largely expected, and the Biden administration still faces early stress-tests on China/Taiwan, Russia, Iran, and even North Korea. Game theory helps explain why financial markets cannot ignore the 60% chance of a crisis in the Taiwan Strait. A full-fledged war is still low-probability but Taiwan remains the world’s preeminent geopolitical risk. In emerging markets, stay short Russian and Brazilian currency and assets – and continue favoring Indian stocks over Chinese. Feature The “arsenal of democracy” is a phrase that President Franklin Delano Roosevelt used to describe the full might of US government, industry, and labor in assisting the western allies in World War II. The US is reviving this combination of productive forces today, with President Joe Biden’s $4 trillion-plus American Jobs and Families Plan unveiled in Pittsburgh on March 31. The context is once again a global struggle among the Great Powers, albeit not world war (at least not yet … more on that below). The US is reviving its post-WWII pursuit of global liberal hegemony – symbolized by its role, growing once again, as the world’s chief consumer and chief warrior (Chart 1). Biden promoted his plan to build up the US’s infrastructure and social safety net explicitly as a historic and strategic investment – “in 50 years, people are going to look back and say this was the moment that American won the future.”1 It is critical for investors to realize that they are not witnessing another round of COVID-19 fiscal relief. That task is already completed with the Republican spending of 2020 and Biden’s own $1.9 trillion American Rescue Plan Act (ARPA), which together with the vaccine rollout are delivering a jolt to growth (Chart 2). Chart 1America Pursues Hegemony Anew
America Pursues Hegemony Anew
America Pursues Hegemony Anew
Chart 2Consensus Expects 6.5% US GDP Growth After American Rescue Plan
Consensus Expects 6.5% US GDP Growth After American Rescue Plan
Consensus Expects 6.5% US GDP Growth After American Rescue Plan
Our own back-of-the-envelope estimates of growth suggest that there is considerable upside risk even under current law (Chart 3). The output gap is also guesstimated here, and it will tighten faster than expected, especially as the service sector revives on economic reopening. Chart 3Back-Of-Envelope: US GDP And Output Gap Show Upside Risk After American Rescue Plan Act (ARPA)
The Arsenal Of Democracy
The Arsenal Of Democracy
A growth overshoot is even more likely considering that the first part of Biden’s proposal, the $2.4 trillion American Jobs Plan consisting mostly of infrastructure and green energy, is highly likely to pass Congress (by July at earliest and December at latest, most likely late fall). Our revised estimates for the US budget deficit show that this bill will add considerably to the deficit in the coming years, peaking in three or four years, thus averting the “fiscal cliff” in 2022-23 and adding to aggregate demand in the years after the short-term COVID-era cash handouts dry up (Chart 4). The net deficit increase will be $700 billion if Biden gets all of his tax hikes and $1.3 trillion if he only gets half of them, according to our sister US Political Strategy. Chart 4US Budget Deficit Will Remain Fat In Coming Years
The Arsenal Of Democracy
The Arsenal Of Democracy
We give Biden’s $2.4 trillion American Jobs Plan an 80% chance of passing through Congress by the end of the year. Infrastructure is broadly popular – as President Trump’s own $2 trillion infrastructure campaign proposal revealed – and Democrats have just enough votes to push it through the Senate via budget reconciliation, which requires zero votes from Republicans. Biden’s political capital is still strong given that his approval rating will stay above 50% as long as Trump is the obvious alternative and the Republicans are deeply divided over their own future (Chart 5).2 The second part of his plan, the $1.95 trillion American Families Plan, is much less likely to pass before the 2022 midterm elections – we would say 50/50 odds at best, if the infrastructure deal passes quickly. Chart 5Biden’s Political Capital Is Sufficient To Pass Another Major Law
The Arsenal Of Democracy
The Arsenal Of Democracy
Of course there are very important differences between Biden’s $2.4 trillion infrastructure plan and the similarly sized proposal that Trump would have unveiled this month had he been re-elected: Biden’s proposal is probably heavier on innovation and research and development, and certainly heavier on unionization and labor regulation, than Trump’s would have been. Biden’s plan integrates infrastructure with sustainability, renewable energy, and climate change initiatives that will help the US catch up with Europe and China on the green front. The plan will consist of direct government spending – rather than government seed money to promote private investment. It will be partially offset by repealing the corporate tax cuts in Trump’s signature Tax Cuts and Jobs Act. Most importantly – from a geopolitical point of view – Biden is making a bid for the US to resume its post-WWII quest for global liberal hegemony. He argued that the US stands at the crossroads of a global choice between “democracies and autocracies” and that rebuilding US infrastructure is ultimately about proving that democracies can create consensus and “deliver for their people.” Autocratic regimes, fairly or not, routinely call attention to the divisiveness of modern party politics in the West and the resulting policy gridlock which produces bad outcomes for many citizens, resulting in greater domestic dysfunction and “chaos.” It is important to note that this bid for hegemony will be more, not less, destabilizing for global politics as it will make the US economy more self-sufficient and insulated from the world. It will intensify the US-China and US-Russia strategic competition while making it more difficult for Biden to conduct bilateral diplomacy with these states given their differences in moral values and frequent human rights violations. What is happening now is the culmination of political shifts that pre-date the pandemic, but were galvanized by the pandemic, and it is of global, geopolitical significance for the coming decade and beyond.3 Biden and the establishment Democrats – embattled by populism on their right and left flanks – are shamelessly coopting President Trump’s “Make America Great Again” nationalism with a larger-than-life, infrastructure-and-manufacturing initiative that emphasizes productivity as well as “Buy American” protectionism. Biden explicitly argued that Americans need to boost innovation to “put us in a position to win the global competition with China in the upcoming years.” At Biden’s first press conference on March 25, he made a similar point about China: So I see stiff competition with China. China has an overall goal, and I don’t criticize them for the goal, but they have an overall goal to become the leading country in the world, the wealthiest country in the world, and the most powerful country in the world. That’s not going to happen on my watch because the United States are going to continue to grow and expand.4 The US trade deficit is set to widen a lot further under this massive domestic buildout. It aims to be the largest government investment program since Dwight Eisenhower’s building of the highways or the Kennedy-Johnson-Nixon space race. But it explicitly aims to diminish China’s role as a supplier of US goods and materials and the US trade deficit already shows evidence of economic divorce (Chart 6). The US is bound to have a larger trade deficit due to its own savings-and-investment imbalances but it has a powerful interest in redistributing this trade deficit to its allies and reducing over-dependency on China, which is itself pursuing strategic self-sufficiency and military modernization in anticipation of an ongoing rivalry this century. Chart 6Biden's Coopts Trump's Trade And Manufacturing Agenda
Biden's Coopts Trump's Trade And Manufacturing Agenda
Biden's Coopts Trump's Trade And Manufacturing Agenda
Bottom Line: Biden’s $2.4 trillion American Jobs Plan has an 80% chance of passing Congress later this year with a net increase to the fiscal thrust of between $700 billion and $1.3 trillion, depending on how many and how high the corporate tax hikes. The other $2 trillion social spending part of Biden’s plan has only a 50/50 chance of passage. The infrastructure and green energy rebuild should be understood as a return of Big Government motivated by populism and Great Power competition – it is a geopolitical theme with enormous momentum. The result will be faster US growth and higher inflation expectations, with the upside risk of a productivity boom (or boomlet) from the combination of public and private sector innovation. Investors should not bet against the cyclical bull market even though any increase in long-term potential GDP is speculative. A Fourth Taiwan Strait Crisis And The Cuban Missile Crisis Biden’s American Jobs Plan reserves $50 billion for US semiconductor manufacturing, a vast sum, larger than expectations and far larger than the relatively small public investments that helped revolutionize the US chip industry in the 1980s. But it will take a long time for these investments to pay off in the form of secure and redundant supply chains, while a semiconductor shortage is raging today that is already entangled with the US-China rivalry and tensions over the Taiwan Strait. The risk of a diplomatic or military incident is urgent because the chip shortage exacerbates China’s vulnerabilities at a time when the Biden administration is about to make critical decisions regarding the tightness of new export controls that cut off China’s access to US semiconductor chips, equipment, and parts. If the Biden administration appears to pursue a full-fledged tech blockade, as the Trump administration seemed bent on doing, then China will retaliate economically or militarily. Before going further we should point out that there are still areas of potential US-China cooperation under the Biden administration that could reduce tensions this year (though not over the long run). Biden and Xi Jinping might meet virtually as early as this month to discuss carbon emission reduction targets. Meanwhile China is positioning itself to serve as power-broker on two major foreign policy challenges – Iran and North Korea. Biden expressly seeks Chinese and Russian assistance based on the mutual interest in nuclear non-proliferation. Notably, Beijing’s renewed strategic dealings with Iran over the past month highlight its confidence that Biden does not have the appetite to stick with Trump’s “maximum pressure” but rather will seek to reduce sanctions and restore the 2015 nuclear deal. Hence China will seek to parlay influence over Tehran in exchange for reduced US pressure on its trade and economy (Chart 7). Beijing is making a similar offer on North Korea. Chart 7China Holds The Key To Iran, As With North Korea?
China Holds The Key To Iran, As With North Korea?
China Holds The Key To Iran, As With North Korea?
Ironically both Iranian and North Korean geopolitical tensions should skyrocket in the short term since high-stakes negotiations are beginning, even though they are ultimately more manageable risks than the mega-risk of US-China conflict over Taiwan. China cannot gain the advanced technology it needs to achieve a strategic breakthrough if the US should impose a total tech blockade, e.g. draconian export controls enforced on US allies. Yet it is highly unlikely to gain the tech by seizing Taiwan, since war would likely destroy the computer chip fabrication plants and provoke global sanctions that would crush its economy. The result is that China is launching a massive campaign of domestic production and indigenous innovation while circumventing US restrictions through cyber and other means. Still, a dangerous strategic asymmetry is looming because the US will retain access to the most advanced computer chips via its alliances and on-shoring, whereas China will remain vulnerable to a tech blockade via Taiwan. This brings us to our chief global geopolitical risk: a US-China showdown in the Taiwan Strait. Highlighting the urgency of the risk, Admiral John Aquilino, the nominee for Commander of the US Indo-Pacific Command, told the Senate Armed Services Committee that China might not wait six years to attack Taiwan: “My opinion is that this problem is much closer to us than most think and we have to take this on.”5 To illustrate the calculus of such a showdown – and our reasons for maintaining an alarmist tone and building up market hedges and safe-haven investments – we turn to game theory. Game theory is not a substitute for empirical analysis but a tool to formalize complex international systems with multiple decision-makers. An obvious yet fair analogy to a US-China-Taiwan crisis is the Cuban missile crisis of 1962.6 The standard construction of the Cuban missile crisis in game theory goes as follows: if the US maintains a blockade and the Soviets withdraw their missiles a compromise is achieved and war is averted; if the US conducts air strikes and the Soviets maintain or use their missiles then war ensues. The payouts to each player are shown in the matrix in Diagram 1. Diagram 1Cuban Missile Crisis, 1962
The Arsenal Of Democracy
The Arsenal Of Democracy
One concern about this construction is that the payouts may underestimate the costs of war since nuclear arms could be used. We insert a comment into the diagram highlighting that the payouts could be altered to account for nuclear war. Note that this alteration does not change the final outcome: the equilibrium scenario is still US blockade and Soviet withdrawal, which is what happened in reality. If we model a US-China-Taiwan conflict along similar lines, the US takes the role of the Soviet Union while China stands where the US stood in 1962 (Diagram 2). This is a theoretical scenario in which the US offers Taiwan a decisive improvement in its security or offensive military capabilities. However, because of the unique circumstances of the Chinese civil war, in which the victors established the People’s Republic of China in Beijing in 1949 and the defeated forces retreated to Taiwan, China’s regime legitimacy is at stake in any showdown over Taiwan. If Beijing suffered a defeat that secured Taiwan’s independence while degrading Beijing’s regime legitimacy and security, the Chinese regime might not survive the domestic blowback.7 Diagram 2Fourth Taiwan Strait Crisis – What Happens If The US Offers Game-Changing Military Support To Taiwan?
The Arsenal Of Democracy
The Arsenal Of Democracy
Thus we reduce the Chinese payout in the case of American victory. In the top right cell of Diagram 2, the row player’s payout falls from two points (2ppt) in the first diagram to one point (1ppt) in this diagram. This seemingly slight change entirely alters the outcome of the game. Beijing now faces equally bad outcomes in the event of defeat, whereas victory remains preferable to a tie. Therefore as long as China believes that the US will not resort to nuclear weapons to defend Taiwan (a reasonable assessment) then it may make the mistake of opting for military force to ensure victory. Fortunately for global investors the US is not providing Taiwan with game-changing military capabilities, although it is ultimately up to China to decide what threatens its security and the US is in the process of upgrading Taiwan’s defense in an effort to deter Beijing from forceful reunification. Thus the exercise demonstrates why we do not expect immediate war – no game-changer yet – but at the same time it shows why war is much likelier than the consensus holds if the military or political status quo changes in a way that China deems strategically unacceptable. A lower-degree Taiwan crisis should be expected – i.e. one in which the US maintains tech restrictions, offers arms sales or military training that do not upend the military balance, or signs free trade agreements or other significant upgrades to the US-Taiwan relationship.8 We would give a 60% probability to some kind of crisis over the next 12-24 months. The global equity market could at least suffer a 10% correction in a standard geopolitical crisis and it could easily fall 20% if US-China war appears more likely. What would trigger a full-fledged Taiwan war? We would grow even more alarmed if we saw one of three major developments: Chinese internal instability giving rise to a still more aggressive regime; the US providing Taiwan with offensive military capabilities; or Taiwan seeking formal political independence. The first is fairly likely, the second lends itself to miscalculation, and the third is unlikely. But it would only take one or two of these to increase the war risk dramatically. Bottom Line: The Taiwan Strait is still the critical geopolitical risk and Biden’s policy on China is still unclear. Iranian and North Korean tensions will escalate in the short run but the fundamental crisis lies in Taiwan. Since some kind of showdown is likely and war cannot be ruled out we advise clients to accumulate safe-haven assets like the Japanese yen and otherwise not to bet headlong against the US dollar until it loses momentum. Emerging Markets Round-Up In this section we will briefly update some important emerging market themes and views: Chart 8Favor USMCA Over Putin's Russia
Favor USMCA Over Putin's Russia
Favor USMCA Over Putin's Russia
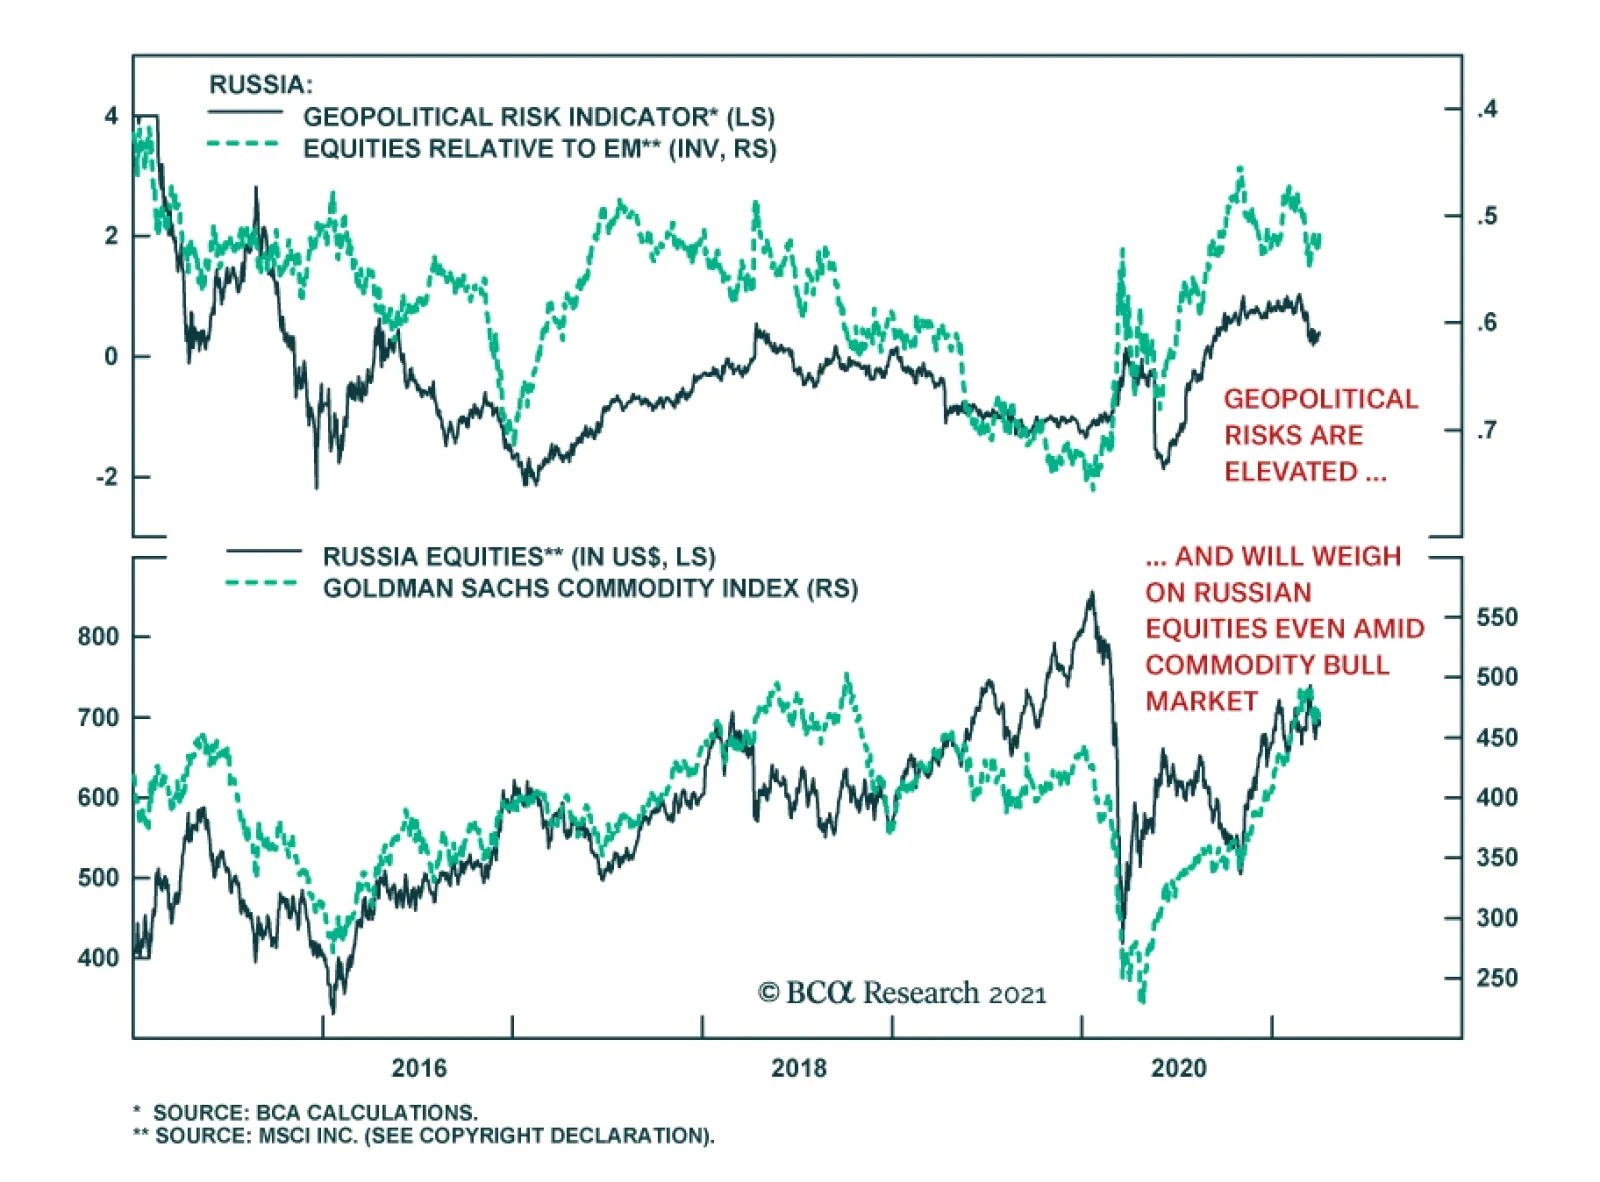
Russia: US-Russia tensions are escalating in the face of Biden’s reassertion of the US bid for liberal hegemony, which poses a direct threat to Russia’s influence in eastern Europe and the former Soviet Union. Ukraine is expected to see a renewed conflict this spring. The top US and Russian military commanders spoke on the phone for the second time this year after Ukrainian military reports indicated that Russia is amassing forces on the border. We also assign a 50/50 chance that the US will use sanctions to prevent the completion of the NordStream II pipeline from Russia to Germany, an event that would shake up the German election as well as provoke a Russian backlash. The Russian ruble has suffered a long slide since Putin’s invasion of Georgia in 2008 and Crimea in 2014 and the country’s currency and equities have not staged much of a comeback amid the global cyclical upswing and commodity price rally post-COVID. We recommend investors favor the Canadian dollar and Mexican peso as oil plays in the context of American stimulus and persistent Russian geopolitical risk (Chart 8). We also favor developed market European stocks over emerging Europe, which will suffer from renewed US-Russia tensions. Brazil: Brazilian President Jair Bolsonaro’s domestic political troubles are metastasizing as expected – the rally-around-the-flag effect in the face of COVID-19 has faded and his popular approval rating now looks dangerously like President Trump’s did, relative to previous presidents, which is an ominous warning for the “Trump of the South,” who faces an election in October 2022 (Chart 9). The COVID-19 deaths are skyrocketing, with intensive care units reaching critical levels across the country. The president has reshuffling his cabinet, including all three heads of the military in an unprecedented disruption that compounds fears about his willingness to politicize the military.9 Meanwhile the judicial system looks likely (but not certain) to clear former President Luiz Inácio Lula da Silva to run against Bolsonaro for the presidency, a potent threat (Chart 10). Bolsonaro’s three pillars of political viability have cracked under the pandemic: the country remains disorderly, the systemic corruption and the “Car Wash” scandal under the former ruling party are no longer at the center of public focus, and fiscal stimulus has replaced structural reform. Chart 9Brazil: Will ‘Trump Of The South’ Face Trump’s Fate?
The Arsenal Of Democracy
The Arsenal Of Democracy
Our Brazilian GeoRisk Indicator has reached a peak with Bolsonaro’s crisis – and likely breaking of the fiscal spending growth cap put in place at the height of the political crisis in 2016 – while Brazilian equities relative to emerging markets have hit a triple bottom (Chart 11). It is too soon for investors to buy into Brazil given that the political upheaval can get worse before it gets better and a Lula administration is no cure for Brazil’s public debt crisis, though a short-term technical rally is at hand. Chart 10Brazil’s Lula Looks To Be A Contender In 2022?
The Arsenal Of Democracy
The Arsenal Of Democracy
Chart 11Brazil: Policy Risk Peaks, Equities Hit Triple-Bottom Versus EM
Brazil: Policy Risk Peaks, Equities Hit Triple-Bottom Versus EM
Brazil: Policy Risk Peaks, Equities Hit Triple-Bottom Versus EM
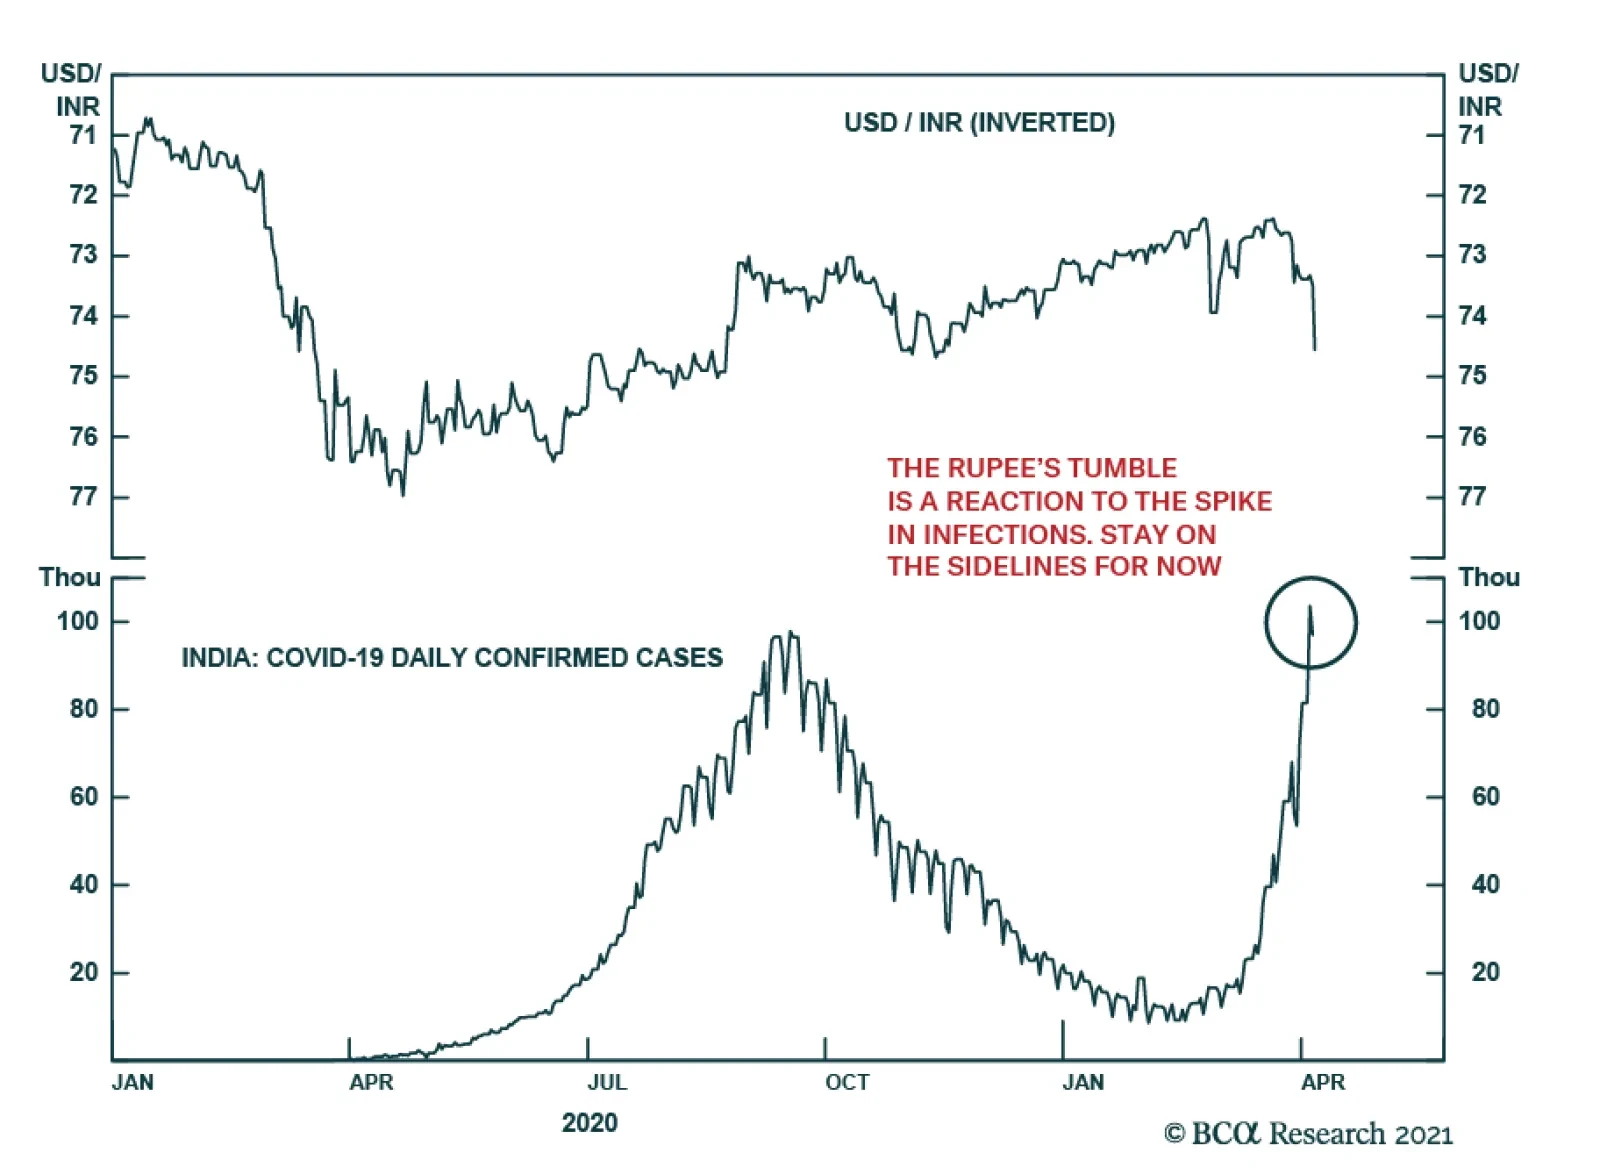
India: A lot has happened since we last updated our views on India, South Asia, and the broader Indian Ocean basin. Farmer protests broke out in India, forcing Prime Minister Narendra Modi to temporarily suspend his much-needed structural reforms to the agricultural sector, while China-backed military coup broke out in Myanmar, and the US election set up a return to negotiations with Iran and the Taliban in Afghanistan. Perhaps the biggest surprise was the Indo-Pakistani ceasefire, despite boiling tensions over India’s decision to make Jammu and Kashmir a federal union territory. The ceasefire is temporary but it does highlight a changing geopolitical dynamic in the region. India and Pakistan ceased fire along the Line of Control where they have fought many times. The ceasefire does not resolve core problems – Pakistan will not stop supporting militant proxies and India will not grant Kashmir autonomy – but it does show their continued ability to manage the intensity of disputes while dealing with the global pandemic. An earlier sign of coordination occurred after the exchange of air strikes in early 2019, which preceded the Indian election and suggested that India and Pakistan had the ability to control their military encounters. India’s move to revoke the autonomy of Jammu and Kashmir in August 2019, along with various militant operations, created the basis for another major conflict this year. After all, the Kargil war in 1999 followed nuclear weaponization, while the 2008 conflict followed the Mumbai attack. But instead India and Pakistan have agreed to a temporary truce. A major India-Pakistan conflict would be a “black swan” as nobody is expecting it at this point. Not coincidentally, India and China also reduced tensions after the flare-up in their Himalayan territorial disputes in 2020. China may be reducing tensions now that it no longer has to distract its population from Trump and the US election. China is shifting its focus to the Myanmar coup, another area where it hopes to parlay its influence with a Biden administration preoccupied with democracy and human rights. Sino-Indian tensions will resume later, especially as China continues its infrastructure construction at the farthest reaches of its territory for the sake of economic stimulus, internal control, and military logistics. The Biden administration is adopting the Trump administration’s efforts to draw India into a democratic alliance. But more urgently it is trying to withdraw from Afghanistan and cut a deal with Iran, which means it will need Indian and Pakistani cooperation and will want India to play a supportive role. Typically India eschews alliances and it will disapprove of Biden’s paternalism. For both China and Pakistan, making a temporary truce with India discourages it from synching up relations with the US immediately. Still, we expect India to cooperate more closely with the US over time, both on economic and security matters. This includes a beefed up “Quad” (Quadrilateral Security Dialogue) with Japan and Australia, which already have strong economic ties with India. Biden’s attempt to frame US foreign policy as a global restoration of democracy and liberalism will not go very far if he alienates the largest democracy in the world and in Asia. Nor will his attempt to diversify the US economy away from China or counter China’s regional assertiveness. Therefore Biden will have to take a supportive role on US-India ties. We are sticking with our contrarian long India / short China equity trade (Chart 12). India cannot achieve its geopolitical goals without reforming its economy and for that very reason it will redouble its structural reform drive, which is supported by changing voting patterns in favor of accelerating nationwide economic development. India will also receive a tailwind from the US and its allies as they seek to diversify production sources and reduce supply chain dependency on China, at least for health, defense, and tech. Meanwhile China’s government is pursing import substitution, deleveraging, and conflict with its neighbors and the United States. While Chinese equities are much cheaper than Indian equities on a P/E basis, they are not as pricey on a P/B and P/S basis (Chart 13) – and valuation trends can continue under the current macro and geopolitical backdrop. Indian equities are more volatile but from a long-term and geopolitical point of view, India’s moment has arrived. Chart 12Contrarian Trade: Stick To Long India / Short China
Contrarian Trade: Stick To Long India / Short China
Contrarian Trade: Stick To Long India / Short China
Bottom Line: Stay long Indian equities relative to Chinese and stay short Russian and Brazilian currencies and assets. These views are based on political and geopolitical themes that will remain relevant over the long run but are also seeing short-term confirmation. Chart 13Indian Stocks Not As Over-Priced On Price-To-Book, Price-To-Sales
Indian Stocks Not As Over-Priced On Price-To-Book, Price-To-Sales
Indian Stocks Not As Over-Priced On Price-To-Book, Price-To-Sales
Investment Takeaways To conclude we want to highlight two investment takeaways. First, while the market has rallied in expectation of the US stimulus package, Biden must now get the package passed. This roller coaster process, combined with the inevitable European recovery once the vaccine rollout gets on its feet (Chart 14), will power an additional rally in cyclicals, value stocks, and commodities. This is true as long as China does not tighten monetary and fiscal policy too abruptly, a risk we have highlighted in previous reports. Chart 14Europe's Vaccination Problem
Europe's Vaccination Problem
Europe's Vaccination Problem
While the US is pursuing “Buy American” provisions within its stimulus package, its growing trade deficit shows that it will be forced to import goods and services to meet its surging demand. This is beneficial for its nearest trade partners, Canada and Mexico, and Europe – as well as China substitutes further afield in some cases. Our European Investment Strategist Mathieu Savary has pointed out the opportunities lurking in Europe at a time when vaccine troubles and lockdowns are clouding the medium-term economic view, which is brightening. He recommends going long the “laggard” sectors and sub-sectors that have not benefited much relative to “leaders” that rallied sharply in the wake of last year’s stimulus, vaccine discovery, and defeat of President Trump (Chart 15). The laggard sectors are primed to outperform on rising US interest rates and decelerating Chinese economy as well (Chart 16). Therefore we recommend going long his basket of Euro Area laggards and short the leaders. Chart 15Europe’s Laggards And Leaders
The Arsenal Of Democracy
The Arsenal Of Democracy
Chart 16Macro Forces Favor The Laggards over the Leaders
Macro Forces Favor The Laggards over the Leaders
Macro Forces Favor The Laggards over the Leaders
Chart 17Will OPEC 2.0 Maintain Production Discipline To Keep Oil Supplies Tight?
Will OPEC 2.0 Maintain Production Discipline To Keep Oil Supplies Tight?
Will OPEC 2.0 Maintain Production Discipline To Keep Oil Supplies Tight?
Commodities – especially base metals – will continue to benefit from the global and European reopening as well as the US infrastructure buildout, assuming that China does not shoot its economy in the foot. Our Commodity & Energy Strategy highlights that global oil prices should remain in a $60-$80 per barrel range over the coming years on the back of tight supply/demand balances and ongoing OPEC 2.0 production management (Chart 17). We continue to see upside oil price risks in the first half of the year but downside risks in the second half. The US pursuit of a deal with Iran may trigger sparks initially – i.e. unplanned supply outages – but this will be followed by increased supply from Iran and/or OPEC 2.0 as a deal becomes evident. Matt Gertken Vice President Geopolitical Strategy mattg@bcaresearch.com Footnotes 1 White House, "Remarks by President Biden on the American Jobs Plan," Pittsburgh, Pennsylvania, March 31, 2021, whitehouse.gov. 2 A bipartisan bill is conceivably, barely, since Republicans face pressure to join with such a popular bill, but they cannot accept the corporate tax hikes, unionization, or green boondoggles that will inevitably occur. 3 The pandemic and President Trump’s hands-off attitude toward it helped galvanize this revival of Big Government, but the revival was already well on its way prior to the pandemic. 4 White House, "Remarks by President Biden in Press Conference," March 25, 2021, whitehouse.gov. 5 Again, "the most dangerous concern is that of a military force against Taiwan," though he implied that Beijing would wait until after the February 2022 Winter Olympics before taking action. He requested that the US urgently increase regional military defense. See Senate Armed Services Committee, "Nomination – Aquilino," March 23, 2021, armed-services.senate.gov. 6 At that time the Soviet Union stationed nuclear missiles in Cuba that threatened the US homeland directly and sent a convoy to make the missile installation permanent. The US imposed a blockade. A showdown ensued, at great risk of war, until the Soviets withdrew and the Americans made some compromises regarding missiles in Turkey. 7 Note that this was not the case for the US in 1962: Cuba did not have special significance for the legitimacy of the American republic and the American regime would have survived a defeat in the showdown, although its security would have been greatly compromised. 8 Taiwan is proposing to buy a missile segment enhancement for its Patriot Advanced Capability-3 missile defense system for delivery in 2025, though this is not yet confirmed by the Biden administration. See for example Yimou Lee, "Taiwan To Buy New U.S. Air Defence Missiles To Guard Against China," Reuters, March 31, 2021, reuters.com. 9 See Monica Gugliano, "I Will Intervene! The Day Bolsonaro Decided To Send Troops To The Supreme Court," Folha de São Paulo, August 2020, piaui.folha.uol.com.br.
Highlights The Biden Administration's $2.25 trillion infrastructure plan rolled out yesterday will, at the margin, boost global demand for energy and base metals more than expected later this year and next. Global GDP growth estimates – and the boost supplied by US stimulus – once again will have to be adjusted higher (Chart of the Week). Energy and metals fundamentals continue to tighten. OPEC 2.0's so-far-successful production management strategy will keep the level of supply just below demand, which will keep Brent crude oil on either side of $60/bbl. Base-metals output will struggle to meet higher demand from the ongoing buildout of renewables infrastructure and growing electric-vehicle sales. Of late, concerns that speculative positioning suggests prices will head lower – or, at other times, higher – are entirely misplaced: Spec positioning conveys no information on price levels or direction. Energy and metals prices, on the other hand, do convey useful information on spec positioning, demonstrating specs do not lead the news or prices, they follow them. Short-term headwinds caused by halting recoveries and renewed lockdowns – particularly in the EU – will fade in 2H21 as vaccines roll out, if the experience of the UK and US are any guide. Continued USD strength, however, would remain a headwind. Feature If the Biden administration is successful in getting its $2.25 trillion infrastructure-spending bill through Congress, the US will join the rest of the world in the race to re-build – in some cases, build anew – its long-neglected bridges, roads, schools, communications and high-speed transportation networks, and, critically, its electric-power grid. There's a lot of game left to play on this, but our Geopolitical Strategy group is giving this bill an 80% of passage later this year, after all the wrangling and log-rolling in Congress is done. In and of itself, the infrastructure-directed spending coming out of Biden's plan will be a catalyst for higher US industrial commodity demand – energy, metals and bulks. In addition, it will support the lift in the demand boost coming out of higher GDP growth globally, which will be pushed higher by US fiscal spending, as the Chart of the Week shows. Of note is the extremely robust growth expected in India, China and the US, which are among the largest consumers of industrial commodities globally. Overall growth in the G20 and globally will be expansive in 2022 as well. Chart of the WeekBiden's $2.25 Trillion Infrastructure Bill Will Boost Global Commodity Demand
Fundamentals Support Oil, Bulks, And Metals
Fundamentals Support Oil, Bulks, And Metals
Higher GDP growth translates directly into higher demand for commodities, all else equal, as can be seen in the relationship between EM and DM GDP, supply and inventories and Brent crude oil prices in Chart 2. While we have reduced our Brent forecast for this year to $60/bbl on the back of renewed demand-side weakness in the EU due to problems in acquiring and distributing COVID-19 vaccines, we expect this to be reversed next year and into 2025, with prices trading between $60-$80/bbl (Chart 3). OPEC 2.0, the oil-producer coalition led by the Kingdom of Saudi Arabia (KSA) and Russia, has done an excellent job of keeping the level of oil supply below demand over the course of the pandemic, which we expect to continue to the end of 2025.1 Chart 2Higher GDP Growth Presages Higher Commodity Demand
Higher GDP Growth Presages Higher Commodity Demand
Higher GDP Growth Presages Higher Commodity Demand
Chart 3Brent Crude Oil Prices Will Average - / bbl to 2025
Brent Crude Oil Prices Will Average $60 - $80 / bbl to 2025
Brent Crude Oil Prices Will Average $60 - $80 / bbl to 2025
As the Biden plan makes its way through Congress, markets will get a better idea of how much diesel fuel, copper, steel, iron ore, etc., will be required in the US alone. What is important to note here that the US is just moving to the starting line, whereas other economies like China and the EU already have begun their investment cycles in renewables and EVs. At present, key markets already are tight, particularly copper (Chart 4) and aluminum (Chart 5). In both markets, we expect physical deficits this year and next, which inclines us to believe the metals leg of this renewables buildout is just beginning – higher prices will be required to incentivize the development of new supply.2 Chart 4Copper Will Post Physical Deficit...
Copper Will Post Physical Deficit...
Copper Will Post Physical Deficit...
Chart 5...As Will Aluminum
...As Will Aluminum
...As Will Aluminum
This is particularly important in copper, where growth in mining output of ore has been flat for the past two years. Copper is the one metal that spans all renewables technologies, and is a bellwether commodity for global growth. We expect copper to trade to $4.50/lb (up ~ $0.50/lb vs spot) on the COMEX in 4Q21 on the back of increasing demand and tight supplies – i.e., falling mining supply and refined copper output growth (Chart 6). Worth noting also is steel rebar and hot-rolled coil prices traded at record highs this week on Chinese futures markets. Stronger steel markets continue to support iron ore prices, although the latter is trading off its recent highs and likely will move lower toward the end of the year as Brazilian supply returns to the market.3 We use steel prices as a leading indicator for copper prices – steel leads copper prices by ~ 9 months. This makes sense when one considers steel is consumed early in infrastructure and construction projects, while copper consumption occurs later as airports and houses are fitted with copper for electric, plumbing and communications applications. Chart 6Copper Ore Output Flat
Copper Ore Output Flat
Copper Ore Output Flat
Does Speculative Positioning Matter? Of late, media pundits and analysts have cited an unwinding of speculative positions in oil and metals markets following sharp run-ups in net long positions as a harbinger of weaker prices in the near future (Chart 7).4 At other times, speculation has been invoked as a reason for price surges – e.g., when oil rocketed toward $150/bbl in mid-2008, which was followed by a price collapse at the start of the Global Financial Crisis (GFC).5 Brunetti et al note, "The role of speculators in financial markets has been the source of considerable interest and controversy in recent years. Concern about speculative trading also finds support in theory where noise traders, speculative bubbles, and herding can drive prices away from fundamental values and destabilize markets." (p. 1545) Chart 7Speculative Positioning Lower In Brent Than WTI
Speculatives Positioning Lower in Brent Than WTI
Speculatives Positioning Lower in Brent Than WTI
We recently re-tested earlier findings in our research, which found that knowledge of how specs are positioned – either on the long or the short side of the market – conveys no information on the level of prices or the change that should be expected given that knowledge. However, knowledge of the price level does convey useful information on how speculators are positioned in futures markets.6 In cointegrating regressions of speculative positions in crude oil, natural gas and copper futures on price levels for these commodities, we find the level of prices to be a statistically significant determinant of spec positions. We find no such relationship using spec positions as an explanatory variable for prices.7 On the other hand, Chart 2 above is an example of statistically significant relationships for Brent and WTI price as a function of supply-demand fundamentals displaying coefficients of determination (r-squares) of close to 90% in the post-GFC period (2010 to now). This supports our earlier findings regarding spec behavior: They follow prices, they don't lead them.8 We are not dismissive of speculation. It plays a critical role in markets, by providing the liquidity that enables commodity producers and consumers to hedge their price exposures, and to investors seeking to diversify their portfolios with commodity exposures that are uncorrelated to their equity and bond holdings. Short-Term Headwinds Likely Dissipate COVID-19 remains the largest risk to markets generally, commodities in particular. The mishandling of vaccine rollouts in the EU has pushed back our assumption for demand recovery deeper into 2H21, but it has not derailed it. We expect COVID-related deaths and hospitalizations to fall in the EU as they have in the UK and the US following the widespread distribution of vaccines, which should occur in the near future as Brussels organizes its pandemic response (Chart 8). Making vaccines available for other states in dire straits will follow, which will allow the global re-opening to progress as lockdowns are lifted (Chart 9). Chart 8EU Vaccination Rollouts Will Boost Global Economic Recovery
Fundamentals Support Oil, Bulks, And Metals
Fundamentals Support Oil, Bulks, And Metals
Chart 9Global Re-Opening Has Slowed, But Will Resume In 2H21
Fundamentals Support Oil, Bulks, And Metals
Fundamentals Support Oil, Bulks, And Metals
The other big risk we see to commodities is persistent USD strength (Chart 10). The dollar has rallied for the better part of 2021, largely on the back of improving US economic prospects relative to other states, and success in its vaccination efforts. The resumption of the USD's bear market may have to wait until the rest of the world catches up with America's public-health response to the pandemic, and the global economy ex-US and -China enters a stronger expansionary mode. Bottom Line: We remain bullish industrial commodities expecting demand to improve as the EU rolls out vaccines and begins to make progress in arresting the pandemic and removing lockdowns. Global fiscal and monetary policy, which likely will be bolstered by a massive round of US infrastructure spending beginning in 4Q21 will catalyze demand growth for oil and base metals. This will prompt another round of GDP revisions to the upside. The dollar remains a headwind for now, but we expect it to return to a bear market in 2H21. Chart 10The USD's Evolution Remains Important
The USD's Evolution Remains Important
The USD's Evolution Remains Important
Robert P. Ryan Chief Commodity & Energy Strategist rryan@bcaresearch.com Ashwin Shyam Research Associate Commodity & Energy Strategy ashwin.shyam@bcaresearch.com Commodities Round-Up Energy: Bullish Going into the April 1 meeting of OPEC 2.0 today, we are not expecting any increase in production. OPEC earlier this week noted demand had softened, mostly due to the slow recovery from the COVID-19 pandemic in the EU, which, based on their previous policy decisions, suggests the producer coalition will not be increasing production. The coalition led by KSA and Russia will have to address Iran's return as a major exporter to China this year, which appears to have been importing ~ 1mm b/d of Iranian crude this month (Chart 11). This puts Iran in direct competition with KSA as a major exporter to China, in defiance of the US re-imposition of sanctions against Iranian exports. China and Iran over the weekend signed a 25-year trade pact that also could include military provisions, which could, over time, alter the balance of power in the Persian Gulf if Chinese military assets – naval and land warfare – deploy to Iran under their agreement. Details of the deal are sparse, as The Guardian noted in its recent coverage. Among other things, government officials in Tehran have come under withering criticism for entering the deal, which they contend was signed with a "politically bankrupt regime." The Guardian also noted US President Joe Biden " is prepared to make a new offer to Iran this week whereby he will lift some sanctions in return for Iran taking specific limited steps to come back into compliance with the nuclear agreement, including reducing the level to which it enriches uranium," in the wake of the signing of this deal. Base Metals: Bullish Copper fell this week, initially on an inventory build, and has now settled right under the $4/lb mark, as investors await details on the US infrastructure bill unveiled in Pittsburgh, PA, on Wednesday. According to mining.com, a major chunk of the proposed bill will be devoted to investments in infrastructure, which will be metals-intensive. Precious Metals: Bullish Gold fell further this week, as US treasury yields rose, buoyed by the increased US vaccine efforts and President Biden’s proposed spending plans (Chart 12). USD strength also worked against the yellow metal, which has been steadily declining since the beginning of this year. COMEX gold fell below the $1,700/oz mark for the third time this month and settled at $1,683.90/oz on Tuesday. Chart 11
Sporadic Producers Will Be Accomodated
Sporadic Producers Will Be Accomodated
Chart 12
Gold Trading Lower On The Back of A Strong Dollar
Gold Trading Lower On The Back of A Strong Dollar
Footnotes 1 Please see Five-Year Brent Forecast Update: Expect Price Range of $60 - $80/bbl, which we published 25 March 2021. It is available at ces.bcaresearch.com. 2 Please see Industrial Commodities Super-Cycle Or Bull Market?, which we published 4 March 2021 for additional discussion, particularly regarding the need for additional capex in energy and metals markets. 3 Please see UPDATE 1-Strong industrial activity, profit lift China steel futures, published by reuters.com 29 March 2021. 4 See, e.g., Column: Frothy oil market deflates as virus fears return published 23 March 2021. 5 Brunetti, Celso, Bahattin Büyüksahin, and Jeffrey H. Harris (2016), " Speculators, Prices, and Market Volatility," Journal of Financial and Quantitative Analysis, 51:5, pp. 1545-74, for further discussion. 6 Please see Specs Back Up The Truck For Oil, which we published 26 April 2018, and Feedback Loop: Spec Positioning & Oil Price Volatility published 10 May 2018. Both are available at ces.bcaresearch.com. 7 We group money managers (registered commodity trading advisors, commodity pool operators and unregistered funds) and swap dealers (banks and trading companies providing liquidity to hedgers and speculators) together to test these relationships. 8 In our earlier research, we also noted our results generally were supported in the academic literature. See, e.g., Fattouh, Bassam, Lutz Kilian and Lavan Mahadeva (2012), "The Role of Speculation in Oil Markets: What Have We Learned So Far?" published by The Oxford Institute For Energy Studies. Investment Views and Themes Strategic Recommendations Commodity Prices and Plays Reference Table Summary of Closed Trades
Higher Inflation On The Way
Higher Inflation On The Way
Feature The global macro landscape over the next six months or so will be characterized by a booming US economy and decelerating growth in China. Financial markets will move accordingly. US Treasury yields will remain under upward pressure, the US dollar will rebound, commodities prices will experience a setback and EM equities will continue underperforming DM stocks. The upcoming US economic boom is a well-known narrative and does not require much elaboration. China’s slowdown, on the other hand, is a matter of debate among investors and commentators. We have been arguing that macro policy tightening and a resumption of regulatory clampdowns on the financial system and property market are bound to result in a growth deceleration in China. There are already leading indicators that point to an impending growth slowdown: Chart 1China Is Set To Decelerate
China Is Set To Decelerate
China Is Set To Decelerate
The latest datapoint for domestic orders from the PBOC’s survey of 5000 industrial enterprises has relapsed in Q1. It leads A-share companies EPS growth by six months (Chart 1, top panel). The message is that industrial companies’ profit growth will once again slow in H2 2021. The recent setback in Chinese A-shares is evidence that markets are already beginning to price in a profit deceleration in H2. The bottom panel of Chart 1 indicates that banks’ claims on enterprises and households have rolled over and will continue downshifting. This is consistent with easing bank loan approvals and reflects policymakers’ guidance for banks. In Charts 3, 4, 6, 7, 8, 9, 10, 11 and 13 below, we illustrate more indicators and evidence of a forthcoming peak in the Chinese business cycle in general and commodities prices in particular. Weakening growth in China will hurt EM stocks and currencies more than those in DM, as many emerging economies are exposed to industrial commodities that are much more sensitive to demand in China versus trends in the US. Also, many Asian economies export more to China than they do to the US and Europe. Besides, the growth outlook in EM (ex-China, Korea and Taiwan) remains sub-par, especially relative to the US and DM more broadly. The reasons for this are slower vaccination rates and by extension economic reopening, a lack of fiscal stimulus and unhealthy banking systems. Notably, Chart 39 below demonstrates that EM bank stocks are breaking down relative to DM bank stocks. This potential breakdown reflects the state of EM fundamentals relative to those of DM. This week we recommend a new trade: short EM banks / long DM banks. In the US, the feature story will be the brisk pace of its reopening, an economic boom and intensifying inflationary pressures. So long as US bond yields continue rising, the US dollar will be supported. The next downleg in the greenback will occur when inflation rises but the Fed explicitly refuses to tackle it. Odds are that we are several months away from that. Hence, rising US bond yields will prop up the US dollar for now. The rebound in the US dollar and rising US bond yields will weigh on EM fixed income. The bottom panel of Chart 30 below illustrates that EM credit spreads negatively correlate with commodity prices. All in all, EM credit spreads will likely widen. Together with ascending US Treasury yields, this means higher EM sovereign and corporate dollar bond yields. The latter have always been associated with lower EM share prices (Chart 2, top panel). Chart 2Rising Corporate Bond Yields Are A Threat To Stocks
Rising Corporate Bond Yields Are A Threat To Stocks
Rising Corporate Bond Yields Are A Threat To Stocks
Strategy: As a tactical strategy (three to six months), last week we recommended downgrading the allocation to EM within global equity and credit portfolios from neutral to underweight. We also recommended shorting a basket of the following EM currencies versus the US dollar for the next several months: HUF, PLN, PHP, TRY, CLP, ZAR, KRW, BRL and THB. Strategic portfolios should maintain neutral allocations to EM equities, credit, local bonds and currencies. Arthur Budaghyan Chief Emerging Markets Strategist arthurb@bcaresearch.com Chinese Share Prices Point To A Top In Commodities Prices The recent underperformance of Chinese onshore cyclical stocks relative to defensive stocks heralds a slowdown in growth and has historically been a good indicator for raw materials prices. Consistently, the latest pullback in share prices of materials companies included in the MSCI China Investable Index also signals a drop in industrial metals prices. Chart 3Chinese Share Prices Point To A Top In Commodities Prices
Chinese Share Prices Point To A Top In Commodities Prices
Chinese Share Prices Point To A Top In Commodities Prices
Chart 4Chinese Share Prices Point To A Top In Commodities Prices
Chinese Share Prices Point To A Top In Commodities Prices
Chinese Share Prices Point To A Top In Commodities Prices
Commodities: New Secular Bull Market Or A Trading Range? Various Chinese liquidity and money measures have historically led the CRB Raw Materials Price Index and presently signal a relapse in commodities. The 200-year chart showing raw materials (excluding oil and gold) prices in real (inflation-adjusted) terms suggests that commodities prices have not undershot their long-term time-trend (Chart 5). We do not argue for a continuation of a structural bear market in commodities, but a medium-term setback is likely in the next three to six months. Chart 5Commodities: New Secular Bull Market Or A Trading Range?
Commodities: New Secular Bull Market Or A Trading Range?
Commodities: New Secular Bull Market Or A Trading Range?
Chart 6Commodities: New Secular Bull Market Or A Trading Range?
Commodities: New Secular Bull Market Or A Trading Range?
Commodities: New Secular Bull Market Or A Trading Range?
Chart 7Commodities: New Secular Bull Market Or A Trading Range?
Commodities: New Secular Bull Market Or A Trading Range?
Commodities: New Secular Bull Market Or A Trading Range?
EM Share Prices Are Beginning To Price A Profit Slowdown In H2 2021 The rally in EM share prices last year has priced the ongoing profit recovery. However, the apex in Chinese money/credit measures entails an EM profit slowdown in H2 this year (Chart 8). Besides, the considerable pullback in Chinese cyclicals-to-defensive stock prices implies further drawdown in EM share prices. Chart 8EM Share Prices Are Beginning To Price A Profit Slowdown In H2 2021
EM Share Prices Are Beginning To Price A Profit Slowdown In H2 2021
EM Share Prices Are Beginning To Price A Profit Slowdown In H2 2021
Chart 9EM Share Prices Are Beginning To Price A Profit Slowdown In H2 2021
EM Share Prices Are Beginning To Price A Profit Slowdown In H2 2021
EM Share Prices Are Beginning To Price A Profit Slowdown In H2 2021
The Chinese Economy: Shifting Into Low Gear In China, liquidity and money measures portend a peak business cycle. Excluding TMT companies, Chinese investable stocks have failed to break above their trading range of the past ten years. Notably, the slowdown is not limited to the old economy. The Caixin New Economy Index has dropped to its early 2019 level. Chart 10The Chinese Economy: Shifting Into Low Gear
The Chinese Economy: Shifting Into Low Gear
The Chinese Economy: Shifting Into Low Gear
Chart 11The Chinese Economy: Shifting Into Low Gear
The Chinese Economy: Shifting Into Low Gear
The Chinese Economy: Shifting Into Low Gear
Chart 12The Chinese Economy: Shifting Into Low Gear
The Chinese Economy: Shifting Into Low Gear
The Chinese Economy: Shifting Into Low Gear
Chart 13The Chinese Economy: Shifting Into Low Gear
The Chinese Economy: Shifting Into Low Gear
The Chinese Economy: Shifting Into Low Gear
Peak Growth And Equity Sentiment We have been showing Chart 14 for the past several months. The record high sentiment on EM equities in January preceded with an apex in EM share prices in February. This measure of sentiment is not yet low enough to expect a bottom in EM stocks. Chart 15 shows a similar indicator for euro area equities. Will it play out in the euro area as it did with EM? Chart 14Peak Growth And Equity Sentiment
Peak Growth And Equity Sentiment
Peak Growth And Equity Sentiment
Chart 15Peak Growth And Equity Sentiment
Peak Growth And Equity Sentiment
Peak Growth And Equity Sentiment
Booming IPOs And Secondary Issues = Peak Investor Sentiment The numbers of IPOs and secondary issuances have risen to a record high in China and EM. Often, this development is consistent with peak investor sentiment that coincides with some sort of top in share prices. Chart 16Booming IPOs And Secondary Issues = Peak Investor Sentiment
Booming IPOs And Secondary Issues = Peak Investor Sentiment
Booming IPOs And Secondary Issues = Peak Investor Sentiment
Chart 17Booming IPOs And Secondary Issues = Peak Investor Sentiment
Booming IPOs And Secondary Issues = Peak Investor Sentiment
Booming IPOs And Secondary Issues = Peak Investor Sentiment
Chart 18Booming IPOs And Secondary Issues = Peak Investor Sentiment
Booming IPOs And Secondary Issues = Peak Investor Sentiment
Booming IPOs And Secondary Issues = Peak Investor Sentiment
Equity Risk Premium: EM Equities Are Not Cheaper Than European And Japanese Equities Equity earnings yield minus interest rates (a proxy for equity risk premium) in EM is similar to that of the US. Hence, adjusted for local interest rates, EM stocks are not cheap. In fact, European and Japanese stocks are cheaper than EM stocks. Chart 19Equity Risk Premium: EM Equities Are Not Cheaper Than European And Japanese Equities
Equity Risk Premium: EM Equities Are Not Cheaper Than European And Japanese Equities
Equity Risk Premium: EM Equities Are Not Cheaper Than European And Japanese Equities
Chart 20Equity Risk Premium: EM Equities Are Not Cheaper Than European And Japanese Equities
Equity Risk Premium: EM Equities Are Not Cheaper Than European And Japanese Equities
Equity Risk Premium: EM Equities Are Not Cheaper Than European And Japanese Equities
A US Dollar Rebound = EM Setback Both EM equity recent selloffs and relative underperformance versus DM occur alongside US dollar strength. Besides, EM equity relative performance often moves counter to US stocks relative performance against the global benchmark (Chart 23). Finally, emerging Asian stocks’ relative performance versus the global index has hit a major technical resistance. The path of least resistance is, for now, on the downside. Chart 21A US Dollar Rebound = EM Setback
A US Dollar Rebound = EM Setback
A US Dollar Rebound = EM Setback
Chart 22A US Dollar Rebound = EM Setback
A US Dollar Rebound = EM Setback
A US Dollar Rebound = EM Setback
Chart 23A US Dollar Rebound = EM Setback
A US Dollar Rebound = EM Setback
A US Dollar Rebound = EM Setback
Chart 24A US Dollar Rebound = EM Setback
A US Dollar Rebound = EM Setback
A US Dollar Rebound = EM Setback
EM Stocks Have Formed A Medium-Term Top The EM overall equity benchmark (shown in Chart 20) as well as EM ex-TMT stocks, EM (ex-China, Korea and Taiwan) share prices, EM small caps and the EM equal-weighted index have so far failed to break out. The forthcoming slowdown in China, rising US Treasury yields, the US dollar rebound and poor fundamentals in EM (ex-China, Korea and Taiwan) are consistent with these technical patterns and warrant caution for now. Chart 25EM Stocks Have Formed A Medium-Term Top
EM Stocks Have Formed A Medium-Term Top
EM Stocks Have Formed A Medium-Term Top
Chart 26EM Stocks Have Formed A Medium-Term Top
EM Stocks Have Formed A Medium-Term Top
EM Stocks Have Formed A Medium-Term Top
Chart 27EM Stocks Have Formed A Medium-Term Top
EM Stocks Have Formed A Medium-Term Top
EM Stocks Have Formed A Medium-Term Top
Chart 28EM Stocks Have Formed A Medium-Term Top
EM Stocks Have Formed A Medium-Term Top
EM Stocks Have Formed A Medium-Term Top
Rising US Treasury Yields Are A Bad Omen For EM Fixed-Income Investor sentiment on US Treasurys is neutral, as is JP Morgan’s duration survey. Major market moves do not halt when sentiment is neutral but rather persist until sentiment becomes extreme. This and the economic boom and rising inflationary pressures in the US are the basis for higher US bond yields. The latter will push up both EM local currency and US dollar bond yields. In turn, a relapse in commodities prices will lead to a widening EM credit spread. Chart 29Rising US Treasury Yields Are A Bad Omen For EM Fixed-Income
Rising US Treasury Yields Are A Bad Omen For EM Fixed-Income
Rising US Treasury Yields Are A Bad Omen For EM Fixed-Income
The US Dollar Rebound Is In The Making The US dollar will continue its rebound as the US economic growth outpaces others and US yields rise relative to their peers. In turn, a rollover in commodities prices is a harbinger of EM currency weakness. Chart 30The US Dollar Rebound Is In The Making
The US Dollar Rebound Is In The Making
The US Dollar Rebound Is In The Making
Chart 31The US Dollar Rebound Is In The Making
The US Dollar Rebound Is In The Making
The US Dollar Rebound Is In The Making
Chart 32The US Dollar Rebound Is In The Making
The US Dollar Rebound Is In The Making
The US Dollar Rebound Is In The Making
Chart 33The US Dollar Rebound Is In The Making
The US Dollar Rebound Is In The Making
The US Dollar Rebound Is In The Making
A Strong Dollar Will Redistribute Inflation From The US To The Rest Of the World US import prices are rising in US dollar terms but not enough to offset exporters’ currency appreciation of the past 12 months. In fact, export prices in local currency terms have been tame in China and Korea. The greenback might appreciate in the near term to redistribute inflationary pressures from the US to the rest of the world, where the risk remains deflation/disinflation. Chart 34A Strong Dollar Will Redistribute Inflation From The US To The Rest Of the World
A Strong Dollar Will Redistribute Inflation From The US To The Rest Of the World
A Strong Dollar Will Redistribute Inflation From The US To The Rest Of the World
Chart 35A Strong Dollar Will Redistribute Inflation From The US To The Rest Of the World
A Strong Dollar Will Redistribute Inflation From The US To The Rest Of the World
A Strong Dollar Will Redistribute Inflation From The US To The Rest Of the World
EMs’ Poor Fundamentals In recent weeks, Brazil and Russia have hiked their policy rates. However, core consumer price inflation in both countries remains well behaved. Both economies are sluggish. In short, economic growth and inflation did not herald higher policy rates. Higher borrowing costs will jeopardize growth in these and other EM economies. Critically, the breakdown in EM relative to DM bank share prices (Chart 39) is a sign of poor health of EM banks and their inability to finance the economic recovery. Chart 36EMs' Poor Fundamentals
EMs' Poor Fundamentals
EMs' Poor Fundamentals
Chart 37EMs' Poor Fundamentals
EMs' Poor Fundamentals
EMs' Poor Fundamentals
Chart 38EMs' Poor Fundamentals
EMs' Poor Fundamentals
EMs' Poor Fundamentals
Investment Ideas A few of our investment recommendations outside our main strategy are: (1) long Chinese A-shares / short investable stocks; (2) long global value / short Chinese investable value stocks; (3) long global industrials / short global materials; (4) short a basket of EM currencies versus the US dollar or go long EM currency volatility. This week we are adding a new recommendation: short EM banks / long DM banks (Chart 39). Chart 39Investment Ideas
Investment Ideas
Investment Ideas
Chart 40Investment Ideas
Investment Ideas
Investment Ideas
Chart 41Investment Ideas
Investment Ideas
Investment Ideas
Footnotes Equities Recommendations
Growth Divergence: Booming US, Slowing China
Growth Divergence: Booming US, Slowing China
Currencies, Credit And Fixed-Income Recommendations