Emerging Markets

The BCA Research Global Asset Allocation (GAA) Forum will take place online on May 18th. We have put together a great lineup of speakers to discuss issues of importance to CIOs and asset allocators. These include the latest thinking on portfolio construction, factor investing, alternatives, and ESG. Our keynote speaker will be Keith Ambachtsheer, founder of KPA Advisory and author of many books on investment management including "The Future of Pension Management: Integrating Design, Governance and Investing" (2016). His presentation will be followed by a panel discussion of top CIOs including Maxime Aucoin of CDPQ, James Davis of OPTrust, and Catherine Ulozas of the Drexel University Endowment. The event is complimentary for all GAA subscribers, who can see a full agenda and register here. Others can sign up here. We hope you can join us on May 18th for what should be a stimulating and informative day of ideas and discussion. Highlights Recommended Allocation
Quarterly Portfolio Outlook: What Higher Rates Mean For Asset Allocation
Quarterly Portfolio Outlook: What Higher Rates Mean For Asset Allocation
Global growth will rebound later this year, fueled by an end of lockdowns and generous fiscal stimulus. Despite that, central banks will not move towards tightening until 2023 at the earliest. This remains a very positive environment for risk assets like equities, though the upside is inevitably limited given stretched valuations. We continue to recommend a risk-on position, with overweights in equities and higher-risk corporate bonds. It is unlikely that long-term rates will rise much further over the coming months. But there is a risk that they could, and so we become more wary on interest-sensitive assets. Accordingly, we cut our overweight on the IT sector to neutral, and go overweight Financials. We continue to prefer cyclical sectors, and stay overweight Industrials and Energy. Chinese growth is slowing and so we cut our recommendation on Chinese equities to underweight. Some Emerging Markets will suffer from tighter US financial conditions, so we would be selective in our positions in both EM equity and debt. We stay firmly underweight government bonds, and recommend an underweight on duration, and favor linkers. Within alternatives, we raise Private Equity to overweight. The return to normality will give PE funds a wider range of opportunities, and allow them to pick up distressed assets at attractive valuations. Overview What Higher Rates Mean For Asset Allocation The past few months have seen a sharp rise in long-term interest rates everywhere (Chart 1). These have reflected better growth prospects, but also a greater appreciation of the risk of inflation over the next few years (Chart 2). Our main message in this Quarterly Portfolio Outlook is that we do not expect long-term rates to rise much further over the coming months, but that there is a risk that they could. This would be unlikely to undermine the positive case for risk assets overall, but it would affect asset allocation towards interest-rate sensitive assets such as growth stocks and Emerging Markets, and could have an impact on the US dollar. Chart 1Rates Are Rising Everywhere
Rates Are Rising Everywhere
Rates Are Rising Everywhere
Chart 2...Because Of Both Growth And Inflation Expectations
Quarterly Portfolio Outlook: What Higher Rates Mean For Asset Allocation
Quarterly Portfolio Outlook: What Higher Rates Mean For Asset Allocation
We accordingly keep our recommendation for an overweight on equities and riskier corporate credit on the 12-month investment horizon, but are tweaking some of our other allocation recommendations. The macro environment for the rest of the year continues to look favorable. Pent-up consumer demand will be released once lockdowns end. In the US, this should be mid-July by when, at the current rate, the US will have vaccinated enough people to achieve herd immunity (Chart 3). Excess household savings in the major developed economies have reached almost $3 trillion (Chart 4). At least a part of that will be spent when consumers can go out for entertainment and travel again. Chart 3US On Track To Hit Herd Immunity By July
US On Track To Hit Herd Immunity By July
US On Track To Hit Herd Immunity By July
Chart 4Global Excess Savings Total Trillion
Global Excess Savings Total $3 Trillion
Global Excess Savings Total $3 Trillion
Fiscal stimulus remains generous, especially in the US after the passing of the $1.9 trillion package in March (with another $2 trillion dedicated towards infrastructure spending likely to be approved within the next six months). The OECD estimates that the recent US stimulus alone will boost US GDP growth by almost 3 percentage points in the first full year and have a significant knock-on effect on other economies (Chart 5). Central banks, too, remain wary of the uneven and fragile nature of the recovery and so will not move towards tightening in the next 12 months. The Fed is not signalling a rate hike before 2024 – and it is likely to be the first major central bank to raise rates. In this environment, it is not surprising that long-term rates have risen. We showed in March’s Monthly Portfolio Update that, since 1990, equities have almost always performed strongly when rates are rising. This is likely to continue unless there is either (1) an inflation scare, or (2) the Fed turns more hawkish than the market believes is appropriate. Inflation could spike temporarily over the coming months, which might spook markets (see What Our Clients Are Asking on page 9 for more discussion of this). But sustained inflation is improbable until the labor market recovers to a level where significant wage increases come through (Chart 6). This is unlikely before 2023 at the earliest. Chart 5US Fiscal Stimulus Will Help Everyone
Quarterly Portfolio Outlook: What Higher Rates Mean For Asset Allocation
Quarterly Portfolio Outlook: What Higher Rates Mean For Asset Allocation
Chart 6Labor Market Still Well Away From Full Employment
Labor Market Still Well Away From Full Employment
Labor Market Still Well Away From Full Employment
BCA Research’s fixed-income strategists do not see the US 10-year Treasury yield rising much above 1.8% this year.1 Inflation expectations should settle down around the current level (shown in Chart 2, panel 2) which is consistent with the Fed achieving its 2% PCE inflation target on average over the cycle. Treasury yields are largely driven by whether the Fed turns out to be more or less hawkish than the market expects (Chart 7). The market is already pricing in the first Fed rate hike in Q3 2022 (Chart 8). We think it unlikely that the market will start to price in an earlier hike than that. Chart 7The Fed Unlikely To Hike Ahead Of What Market Expects...
The Fed Unlikely To Hike Ahead Of What Market Expects...
The Fed Unlikely To Hike Ahead Of What Market Expects...
Chart 8...Since This Is As Early As Q3 2022
...Since This Is As Early As Q3 2021
...Since This Is As Early As Q3 2021
How much would a further rise in rates hurt the economy and stock market? Rates are still well below a level that would trigger problems. First, long-term rates are considerably below trend nominal GDP growth, which is around 3.5% (Chart 9). Second, short-term real rates are well below r* – hard though that is to measure at the moment given the volatility of the economy in the past 12 months (Chart 10). Finally, one of the best indicators of economic pressure is a decline in cyclical sectors (consumer spending on durables, corporate capex, and residential investment) as a percentage of GDP (Chart 11). This is because these are the most interest-rate sensitive parts of the economy. But, at the moment, consumers are so cashed up they do not need to borrow to spend. The same is true of corporates, which raised huge amounts of cash last year. The only potential problem is real estate, buoyed last year by low rates which are now reversing (Chart 12). But mortgage rates are still very low and this is not a big enough sector to derail the broader economy. Chart 9Long-Term Rates Well Below Damaging Levels...
Long-Term Rates Well Below Damaging Levels...
Long-Term Rates Well Below Damaging Levels...
Chart 10...Such As The R-Star
Fed Still Below Neutral ...Such As The R-Star
Fed Still Below Neutral ...Such As The R-Star
Chart 11Interest-Rate Sensitive Sectors Are Robust...
Interest-Rate Sensitive Sectors Are Robust...
Interest-Rate Sensitive Sectors Are Robust...
Chart 12...With The Possible Exception Of Housing
...With The Possible Exception Of Housing
...With The Possible Exception Of Housing
Chart 13Debt Levels Are High In Emerging Markets...
Debt Levels Are High In Emerging Markets...
Debt Levels Are High In Emerging Markets...
Chart 14...Which Makes Them Vulnerable To Tightening Financial Conditions
...Which Makes Them Vulnerable To Tightening Financial Conditions
...Which Makes Them Vulnerable To Tightening Financial Conditions
This sanguine view may not apply to Emerging Markets, however. Given the amount of foreign-currency debt they have built up in the past decade (Chart 13), they are very sensitive to US financial conditions, particularly a rise in rates and an appreciation of the US dollar (Chart 14). Accordingly, we have become more cautious on the outlook for both EM equity and debt over the next 6-12 months. Garry Evans, Senior Vice President Chief Global Asset Allocation Strategist garry@bcaresearch.com What Our Clients Are Asking What will happen to inflation? How can we tell if it is trending up? Chart 15Watch The Trimmed Mean Inflation Measure
Watch The Trimmed Mean Inflation Measure
Watch The Trimmed Mean Inflation Measure
How much inflation rises will be a key driver of asset performance over the next 12-18 months. Too much inflation will push up long-term rates and undermine the case for risk assets. But the picture is likely to be complicated. US inflation will rise sharply in year-on-year terms in March and April because of the base effect (comparison with the worst period of the pandemic in 2020), pricier gasoline, rising import prices due to the weaker dollar, and supply-chain bottlenecks that are pushing up manufacturing costs. Core PCE inflation could get close to 2.5% year-on-year (Chart 15, panel 1). In the second half, too, an end to lockdowns could push up service-sector inflation – which has unsurprisingly been weak in the past nine months – as consumers rush out to restaurants and on vacation (panel 3). The Fed has signalled that it will view these as temporary effects. But they may spook the market for a while. Next year, however, it would be surprising to see strong underlying inflation unless employment makes a miraculous recovery. Payrolls would have to increase by 420,000 a month to get back to “maximum employment” by end-2022.2 Absent that, wage growth is likely to stay muted. Conventional inflation gauges may not be very useful at indicating underlying inflation pressures, in a world where consumers switch their spending depending on what is currently allowed under pandemic regulations. The Dallas Fed’s Trimmed Mean Inflation indicator (which excludes the 31% of the 178 items in the consumer basket with the highest price rises each month, and the 24% with the lowest) may be the best true measure. Research shows that historically it has been closer to trend headline PCE inflation in the long run than the core inflation measure, and predicts future inflation better (panel 4). Currently it is at 1.6% year-on-year and trending down. Investors should focus on this measure to see whether rising inflation is becoming a risk. How can investors best protect against rising inflation? In May 2019 we released a report describing how to best to hedge against inflation.3 In that report, we analyzed every period of rising inflation dating back to the 1970s. Our conclusions were the following: The level of inflation will determine how rising inflation affects assets. When inflation goes from 1% to 2%, the macro environment is entirely different from when it goes from 5% to 6%. Thus, inflation hedging should not be thought of as a static exercise but a dynamic one (Table 1). Table 1Winners During Different Inflationary Regimes
Quarterly Portfolio Outlook: What Higher Rates Mean For Asset Allocation
Quarterly Portfolio Outlook: What Higher Rates Mean For Asset Allocation
As long as the annual inflation rate is below about 3%, equities tend to be the best performing asset during high inflation periods, surpassing even commodities. This is because monetary policy tends to stay accommodative and cost pressures remain benign for most companies. However, as inflation passes this threshold, things start to change. Central banks start to become restrictive as they seek to curb inflation. This rise in policy rates starts to choke off the bull market. Meanwhile cost pressures become more significant and, as a result, equities begin to suffer. It is at this time when commodities – particularly oil and industrial metals – and US TIPS become a much better asset to hold. Finally, if the central bank fails to quash inflation, inflation expectations become unanchored, creating a toxic cocktail of rising prices and poor growth. During such periods, the best strategy is to hold the most defensive securities in each asset class, such as Health Care or Utilities within the equity market, or gold within commodities. Can the shift to renewables drive a new commodities supercycle? Chart 16The Shift To Renewables Is Likely To Be A Tailwind For Metal Prices...
The Shift To Renewables Is Likely To Be A Tailwind For Metal Prices...
The Shift To Renewables Is Likely To Be A Tailwind For Metal Prices...
The rise in commodity prices in H2 2020 has made investors ask whether we are on the verge of a new commodities “supercycle” (Chart 16). Our Commodity & Energy strategists argue that the fundamental drivers of each commodities segment differ. Here we focus on industrial metals – particularly those pertaining to renewable energy and transport electrification. Prices of metals used in electric vehicles (EVs) have risen by an average 53% since July 2020, reflecting strong demand that is outstripping supply (Chart 16). In the short-term, metals markets are likely to be in deficit, especially as demand recovers after the pandemic. Modelling longer-term demand is tricky since it relies on assumptions for the emergence of new technologies, metals’ efficiency, recycling rates, and the share of renewables. A study by the Institute for Sustainable Futures showed that, in the most positive scenarios, demand for some metals will exceed available resources and reserves (Table 2).4 The most pessimistic scenarios – which, for example, assume no major electrification of the transport system – show demand at approximately half of available resources. It is likely that demand will lay somewhere between those scenarios. Table 2...As Future Demand Exceeds Supply
Quarterly Portfolio Outlook: What Higher Rates Mean For Asset Allocation
Quarterly Portfolio Outlook: What Higher Rates Mean For Asset Allocation
Supply is concentrated in a handful of countries: For example, the DR Congo is responsible for more than 65% of cobalt production and 50% of the world’s reserves;5 Australia supplies almost 50% of the world’s lithium and has 22% of its reserves.6 Production bottlenecks could therefore put significant upside pressures on prices. Factoring in supply/demand dynamics, as well as an assessment of future technological advancements, we conclude that industrial metals might be posed for a bull market over the upcoming years. How can we add alpha in the bond bear market? Chart 17Government Bond Yield Sensitivities To USTs
Government Bond Yield Sensitivities To USTs
Government Bond Yield Sensitivities To USTs
For a portfolio benchmarked to the global Treasury index, one way to add alpha is through country allocation. BCA’s Fixed Income Strategy recommends overweighting low yield-beta countries (Germany, France, and Japan) and underweighting high yield-beta countries (Canada, Australia, and the UK).7 The yield beta is defined as the sensitivity of a country’s yield change to changes in the US 10-year Treasury yield, as shown in Chart 17. BCA’s view is that the Fed will be the first major central bank to lift interest rate, therefore investors' underweights should be concentrated in the US Treasury index. It’s worth noting, however, that yield beta is influenced by many factors, and can change over time. When applying this approach, it’s important to pay attention to key factors in each country, especially those that are critical to central bank policy decisions (Table 3). Table 3A Watch List For Bond Investors
Quarterly Portfolio Outlook: What Higher Rates Mean For Asset Allocation
Quarterly Portfolio Outlook: What Higher Rates Mean For Asset Allocation
Global Economy Chart 18US Growth Already Looks Strong...
US Growth Already Looks Strong...
US Growth Already Looks Strong...
Overview: Growth continues to recover from the pandemic, although the pace varies. Manufacturing has rebounded strongly, as consumers spend their fiscal handouts on computer and household equipment, but services remain very weak, especially in Europe and Japan. Successful vaccination programs and the end of lockdowns in many countries should lead to strong growth in H2, as consumers spend their accumulated savings and companies increase capex to meet this demand. Perhaps the biggest risk to growth is premature tightening in China, but the authorities there are very aware of this risk and so it is unlikely to drag much on global growth. US: Although the big upside surprises to economic growth are over (Chart 18, panel 1), the US continues to expand more strongly than other major economies, due to its relatively limited lockdowns and large fiscal stimulus (which last year and this combined reached 25% of GDP, with another $2 trillion package in the works). Fed NowCasts suggest that Q1 GDP will come in at around 5-6% quarter-on-quarter annualized, with the OECD’s full-year GDP growth forecast as high as 6.5%. Nonetheless, there is still some way to go: Consumer expenditure and capex remain weak by historical standards, and new jobless claims in March still averaged 727,000 a week. Euro Area: More stringent pandemic regulations and slow vaccine rollout mean that the European service sector has been slow to recover. The services PMI in March was still only 48.4, though manufacturing has rebounded strongly to 64.2 (Chart 19, panel 1). Fiscal stimulus is also much smaller than in the US, with the EUR750 billion approved in December to be spent mostly on infrastructure over a period of years. Growth should rebound in H2 if lockdowns end and the vaccination program accelerates. But the OECD forecasts full-year GDP growth of only 3.9%. Chart 19...But Chinese Growth Has Probably Peaked
...But Chinese Growth Has Probably Peaked
...But Chinese Growth Has Probably Peaked
Japan has seen the weakest rebound among the major economies, slightly puzzlingly so given its heavy weight in manufacturing and large exposure to the Chinese economy. Industrial production still shrank 3% year-on-year in February (Chart 19, panel 2), exports were down 4.5% YoY in February, and the manufacturing PMI is barely above 50. The main culprit remains domestic consumption, with confidence very weak and wages still declining, leading to a 2.4% YoY decline in retail sales in January. The OECD full-year GDP growth forecast is just 2.4%. Emerging Markets: The Chinese authorities have been moderately tightening policy for six months and this is starting to impact growth. Both the manufacturing and services PMIs have peaked, though they remain above 50 (panel 3). The policy tightening is likely to be only moderate and so growth this year should not slow drastically. Nonetheless, there remains the risk of a policy mistake. Elsewhere, many EM central banks are struggling with the dilemma of whether to cut rates to boost growth, or raise rates to defend a weakening currency. Real policy rates range from over 2% in Indonesia to below -2% in Brazil and the Philippines. This will add to volatility in the EM universe. Interest Rates: Policy rates in developed economies will not rise any time soon. The Fed is signalling no rise until 2024 (although the futures are now pricing in the first hike in Q3 2022). Other major central banks are likely to wait even longer. A crucial question is whether long-term rates will rise further, after the jump in the US 10-year Treasury yield to a high of 1.73%, from 0.92% at the start of the year. We see only limited upside in yields over the next nine months, as underlying inflation pressures should remain weak and central banks will remain highly reluctant to bring forward the pace of monetary policy normalization. Global Equities Chart 20Has The Equity Market Priced In All The Earnings Growth?
Has The Equity Market Priced In All The Earnings Growth?
Has The Equity Market Priced In All The Earnings Growth?
The global equities index eked out a 4% gain in Q1 2021, completely driven by a rebound in the profit outlook, since the forward PE multiple slightly contracted by 4%. Forward EPS has now recovered to the pre-pandemic level, while both the index level and PE multiple are 52% and 43% higher than at the end of March 2020 (Chart 20). While BCA’s global earnings model points to nearly 20% earnings growth over the next 12 months and analysts are still revising up earnings forecasts, the key question in our mind is whether the equity market has priced in all the earnings growth. Equity valuations are still not cheap by historical standards despite the small contraction in PEs in Q1. In addition, the VIX index has come down to 19.6, right at its historical average since January 1990, and profit margins in both EM and DM have come under pressure. As an asset class, however, stocks are still attractively valued compared to bonds (panel 5). Given our long-held approach of taking risk where risk will most likely be rewarded, we remain overweight equities versus bonds at the asset-class level, but we are taking some risk off the table in our country and sector allocations by downgrading China to underweight (from overweight) and upgrading the UK to overweight (from neutral), and by taking profits in our Tech overweight and upgrading Financials to overweight (see next two pages). To sum up, we are overweight the US and UK, underweight Japan, the euro area, and China, while neutral on Canada, Australia, and non-China EM. Sector-wise, we are overweight Industrials, Financials, Energy, and Health Care; underweight Consumer Staples, Utilities, and Real Estate; and neutral on Tech, Consumer Discretionary, Communication Services, and Materials. Country Allocation: Downgrade China To Underweight From Overweight Chart 21China Is Risking Overtightening
China Is Risking Overtightening
China Is Risking Overtightening
We started to separate the overall EM into China and Other EM in the January Monthly Portfolio Update this year. We initiated China with an Overweight and “Other EM” with a Neutral weighting in the global equity portfolio. The key rationale was that Chinese growth would remain strong in H1 2021 due to its earlier stimulus, while some EM countries would benefit from Chinese growth but others were still suffering from structural issues. In Q1, China underperformed the global benchmark by 4.5%, while the other EM markets underperformed slightly. China’s National People’s Congress (NPC) indicated that Chinese policymakers will gradually pull back policy support this year. BCA’s China Investment Strategists think that fiscal thrust will be neutral in 2021 while credit expansion will be at a lower rate compared to 2020. The Chinese economy should remain strong in H1 but will slow to a benign and managed growth rate afterwards. Therefore, the risk of policy overtightening is not trivial and could threaten China’s economic growth and corporate profit outlook. The outperformance of Chinese stocks since the end of 2019 has been largely driven by multiple expansion (Chart 21, panel 1), but the slowdown in the credit impulse implies that the recent underperformance of Chinese equities has not run its course because multiple contraction will likely have to catch up and will therefore put more downward pressure on price (panels 2 and 3). We remain neutral on the non-China EM countries, implying an underweight for the overall EM universe. We use the proceeds to fund an upgrade of the UK to Overweight from Neutral because the UK index is comprised largely of globally exposed companies and because we have upgraded GBP to overweight (see page 21). Sector Allocation: Upgrade Financials To Overweight By Downgrading Tech To Neutral Chart 22Financials And Tech: Trading Places
Financials And Tech: Trading Places
Financials And Tech: Trading Places
One year ago, we upgraded Tech to overweight and downgraded Financials to neutral given our views on the impact of the pandemic and interest rates.8 This position has netted out an alpha of 1123 basis points in one year. BCA Research’s House View now calls for somewhat higher global interest rates and steeper yield curves (especially in the US) over the next 9-12 months. Accordingly, we are downgrading Tech to neutral and upgrading Financials to overweight. Financials have outperformed the broad market by about 20% since September 2020 after global yields bottomed in July 2020. We do not expect yields to rise significantly from the current level, nor do we expect Tech earnings growth to slow significantly (Chart 22, panel 5). So why do we make such shift between Financials and Tech? There are three key reasons: First, the Tech sector is a long-duration asset with high sensitivity to changes in the discount rate. In contrast, Financials’ earnings benefit from steepening yield curves. If history is any guide, we should see more aggressive analyst earnings revisions going forward in favor of Financials (Chart 22, panel 3). Second, the performance of Financials relative to Tech has been on a long-term structural downtrend since the Global Financial Crisis. A countertrend rebound to the neutral zone from the currently very oversold level would imply further upside (Chart 22, panel 1). Last, Financials are trading at an extremely large discount to the Tech sector (Chart 22, panel 2). In an environment where overall equity valuations are stretched by historical standards, it is prudent to rotate into an extremely cheap sector from an extremely expensive sector. Government Bonds Chart 23Policy Mix Is Bond-Bearish
Policy Mix Is Bond-Bearish
Policy Mix Is Bond-Bearish
Maintain Below-Benchmark Duration. Global bond yields have climbed sharply in Q1, supported by strong economic growth, mostly smooth rollout of vaccination and the Biden Administration’s very stimulative fiscal package of USD1.9 trillion. The US stimulus package changes the trajectory of the 2021 US fiscal impulse from a $0.8 trillion contraction to a $0.3 trillion expansion, according to estimates from the US Committee for a Responsible Federal Budget. Going forward, the path of least resistance for global yields is still up, though the upside will be limited given the resolve of central banks to maintain accommodative monetary policies (Chart 23). Chart 24Stay Long TIPS
Stay Long TIPS
Stay Long TIPS
Still Favor Linkers Vs. Nominal Bonds. Our overweight position in inflation-linked bonds relative to nominal bonds has panned out well so far this year, as has our positioning for a flattening inflation-protection curve. Even though inflation expectations have run up quickly, the 5 year-5 year forward inflation breakeven rate is still below 2.3-2.5%, the range that is consistent with core PCE reaching the Fed’s 2% target in a sustainable fashion (Chart 24). The US TIPS 5/10-year curve is inverted already, but our fixed income strategists are still reluctant to exit the curve-flattening position for two key reasons: 1) The Fed has indicated that it will tolerate core PCE overshooting the 2% target because it will try to hit the target from above rather than from below; and 2) the short end of the inflation expectation curve is more sensitive to actual inflation than the long end. There are signs (core producer prices, prices paid in the ISM manufacturing survey, and NFIB reported prices are all rising) that core PCE will reach 2% in the next 12 months. Corporate Bonds Chart 25High-Yield Offers Best Value In Fixed Income
Quarterly Portfolio Outlook: What Higher Rates Mean For Asset Allocation
Quarterly Portfolio Outlook: What Higher Rates Mean For Asset Allocation
Since the beginning of the year, investment-grade bonds have outperformed duration-matched Treasurys by 62 basis points, while high-yield bonds have outperformed duration-marched Treasurys by 232 basis points. In the current reflationary environment, we believe that the best strategy within fixed-income portfolios is to overweight low-duration assets and maximize credit exposure where the spread makes a large portion of the yield. Thus, we remain overweight high-yield bonds. We believe that high yield offers much better value than higher quality credits. Currently spreads for high-yield bonds are in the middle of their historical distribution – a stark contrast from their investment-grade counterparts, which are trading at very expensive levels (Chart 25, panel 1). Moreover, the reopening of the economy should help the more cyclical sectors of the bond market, where the lower credit qualities are concentrated. But could a rise in yields start hurting sub-investment-grade companies and increase their borrowing costs? We do not think this is likely for now. Most of the bonds in the US high-yield index mature in more than three years, which means that high-risk corporates will not have to finance themselves with higher rates yet (Chart 25, panel 2). On the other hand, we remain underweight investment-grade credit. Not only are these bonds expensive, but they offer very little upside in any scenario. On the one hand, these bonds should underperform further if raise continue to rise – a result of their high duration. On the other hand, if a severe recession were to hit, spreads would most likely widen, which will also result in underperformance. Commodities Chart 26Limited Upside For Oil From Here
Limited Upside For Oil From Here
Limited Upside For Oil From Here
Energy (Overweight): Despite the recent mid-March selloff, which was most likely triggered by profit taking, oil prices are still up 25% since the beginning of the year. This happened on the back of the restoration of some economic activity, the OPEC 2.0 coalition maintaining production discipline and therefore keeping supply in check, and the recovery in crude demand drawing down inventory. However, earlier forecasts of the 2021 oil demand recovery were a bit too optimistic amid continuing pandemic uncertainty. There is now, therefore, only limited upside for the oil price, at least this year. Our Commodity & Energy strategists expect the Brent crude price to average $65/bbl this year (Chart 26, panels 1 & 2). Industrial Metals (Neutral): We have previously highlighted that Chinese restocking activity in 2020 was a big factor behind the rally in industrial metals prices. As this eases, and Chinese growth slows, commodity prices might correct somewhat in the short term. However, fundamental changes in demand for alternative energy makes us ask whether we are now entering a new commodities “supercycle” for certain metals (for more analysis of this, see What Our Clients Are Asking on page 11). If history is any guide, however, the commodities bear market may have a little longer to run. Historically, commodity bear cycles lasted 17 years on average and we are only 10 years into this one (panel 3). On balance, therefore, we remain neutral on industrial metals for now. Precious Metals (Neutral): After peaking last August, the gold price has continued to tumble, down almost 19% since and 11% since the beginning of the year. We have been wary of the metal’s lofty valuation – the real price of gold remains near a historical high. The recent rise in real rates put more downside pressure on gold. However, the pullback in prices should provide investors who see gold as a long-term inflation hedge and do not buy the metal with a view to strong absolute performance over the next 12 months, with an attractive entry point. We maintain a slight overweight position to hedge against inflation and unexpected tail risks (panel 4). Currencies US Dollar Chart 27Vaccinations will help USD and GBP in 2021
Vaccinations will help USD and GBP in 2021
Vaccinations will help USD and GBP in 2021
While we still believe that the dollar is in a major bear market, the current environment could see a significant dollar countertrend. Thanks to its gargantuan fiscal stimulus as well as its relatively fast vaccination campaign, the US is likely to grow faster than the rest of the world during 2021 (Chart 27, panel 1). This dynamic should put further upward pressure on US real rates relative to the rest of the world, helping the dollar in the process. To hedge this risk, we are upgrading the US dollar from underweight to neutral in our currency portfolio. Euro The euro should experience a temporary pullback. Economic activity in Europe, particularly in the service sector is lagging the US – a consequence of Europe’s slow vaccination campaign. This sluggishness in economic activity will translate into a worse real rate differential vis-a-vis the US, dragging the euro lower in the process. Thus, we are downgrading the euro from overweight to neutral. British Pound One currency that might perform well in this environment is the British pound. Consumer spending in the UK was particularly hard hit during the pandemic, since such a high share of it is geared towards social activities like restaurants and hotels (Chart 27, panel 2). However, thanks to Britain’s successful vaccination campaign, UK consumption is likely to experience a sharp snapback. As growth expectations improve, real rates should grind higher vis-à-vis the rest of the world, pushing the pound higher. Moreover, valuations for this currency are attractive: The pound currently trades at a 10% discount to purchasing power parity fair value. As a result, we are upgrading the GBP from neutral to overweight. Alternatives Chart 28Turning More Positive On Private Equity
Turning More Positive On Private Equity
Turning More Positive On Private Equity
Return Enhancers: In last October’s Quarterly Outlook, we advised investors to prepare for new opportunities in Private Equity (PE) as fund managers look to deploy record high dry power. A gradual return to normality is likely to provide PE funds with a wider range of opportunities, while still allowing them to pick up distressed assets at attractive valuations. This is illustrated by the annualized quarterly returns of PE funds in Q2 and Q3 2020, which reached 43% and 56% respectively. PE funds raised in recession and early-cycle years tend to have a higher median net IRR than those raised in the latter stages of bull markets. This suggests that returns from the 2020 and 2021 vintages should be strong. In recent years, capital flows have increasingly gone to the longer established and larger funds, which tend to have better access to the most attractive deals and therefore record the strongest returns. This trend is likely to continue. Given the time it takes to shift allocations in private assets, we increase our recommended allocation in PE to overweight. Inflation Hedges: It is not clear that inflation will come roaring back in the next couple of years. But what is certain is that market participants are concerned about this risk, which should give a boost to inflation-hedge assets. Given this backdrop, we continue to favor commodity futures (Chart 28, panel 2). In other circumstances, real estate would also have been a beneficiary in this environment. But the slowdown in commercial real estate, as many corporate tenants review whether they need expensive city-center space, makes us remain cautious on real estate. Volatility Dampeners: We continue to favor farmland and timberland over structured products, particularly mortgage-backed securities (MBS). Farmland offers attractive yields and should continue to provide the best portfolio protection in the event of any market distress (Chart 28, panel 3). Risks To Our View The main risks to our central view are to the downside. Because global equities have risen by 55% over the past 12 months, and with the forward PE of the MSCI ACWI index at 19.5x (Chart 29), the room for price appreciation over the next 12 months is inevitably limited. There are several things that could undermine the economic recovery and equity bull market. The COVID-19 pandemic remains the greatest unknown. The vaccination rollout has been very uneven (Chart 30). New strains, especially the one first identified in Brazil, are highly contagious and people who previously had COVID-19 do not seem to have immunity against them. Behavior once COVID cases decline is also hard to predict. Will people be happy again to fly, attend events in large stadiums, and socialize in crowded bars, or will many remain wary for years? This would undermine the case for a strong rebound in consumption. Chart 29Is Perfection Priced In?
Is Perfection Priced In?
Is Perfection Priced In?
Chart 30Vaccination Has Been Spotty Vaccination Has Been Spotty
Vaccination Has Been Spotty Vaccination Has Been Spotty
Vaccination Has Been Spotty Vaccination Has Been Spotty
Chart 31China Slowing Again?
China Slowing Again?
China Slowing Again?
As often, a slowdown in China is a risk. The authorities there have signalled a pullback in stimulus, and the credit impulse has begun to slow (Chart 31). Our China strategists think the authorities will be careful not to tighten too drastically (with the fiscal thrust expected to be neutral this year), and that growth will slow only to a benign and moderate rate in the second half.9 But there is a lot of room for policy error. Finally, inflation. As we argue elsewhere in this Quarterly, it will inevitably pick up for technical reasons in March and April, and then again in late 2021 as renewed consumer demand for services (especially travel and entertainment) pushes up prices. The Fed has emphasized that these phenomena are temporary and that underlying inflation will not emerge until the economy returns to full employment. But the market might get spooked for a while when inflation jumps, pushing up long-term interest rates and triggering an equity market correction. Footnotes 1 Please see US Bond Strategy Report, “The Fed Looks Backward While Markets Look Forward,” dated March 23, 2021. 2 Please see US Bond Strategy Report, “The Fed Looks Backward While Markets Look Forward,” dated March 23, 2021, 3 Please see Global Asset Allocation Special Report, “Investors’ Guide To Inflation Hedging: How To Invest When Inflation Rises,” dated May 22, 2019. 4 Dominish, E., Florin, N. and Teske, S., 2019, Responsible Minerals Sourcing for Renewable Energy. Report prepared for Earthworks by the Institute for Sustainable Futures, University of Technology Sydney. The optimistic scenario is referred to as “total metals demand” scenario, which assumed current materials intensity and market share continues into the future without recycling or efficiency improvements. This study is based on 2018 production levels and therefore expansion of future production may vary results. 5US Geological Survey, Mineral Commodity Summaries 2021. 6 Chile is estimated to have the largest reserve of lithium. 7 Please see Global Fixed Income Strategy Report, “Harder, Better, Faster, Stronger,” dated March 16, 2021. 8 Please see Global Asset Allocation, “Quarterly Portfolio Outlook: Playing The Optionality,” dated April 1, 2020. 9 Please see China Investment Strategy Report, “National People’s Congress Sets Tone For 2021 Growth,” dated March 17, 2021. GAA Asset Allocation
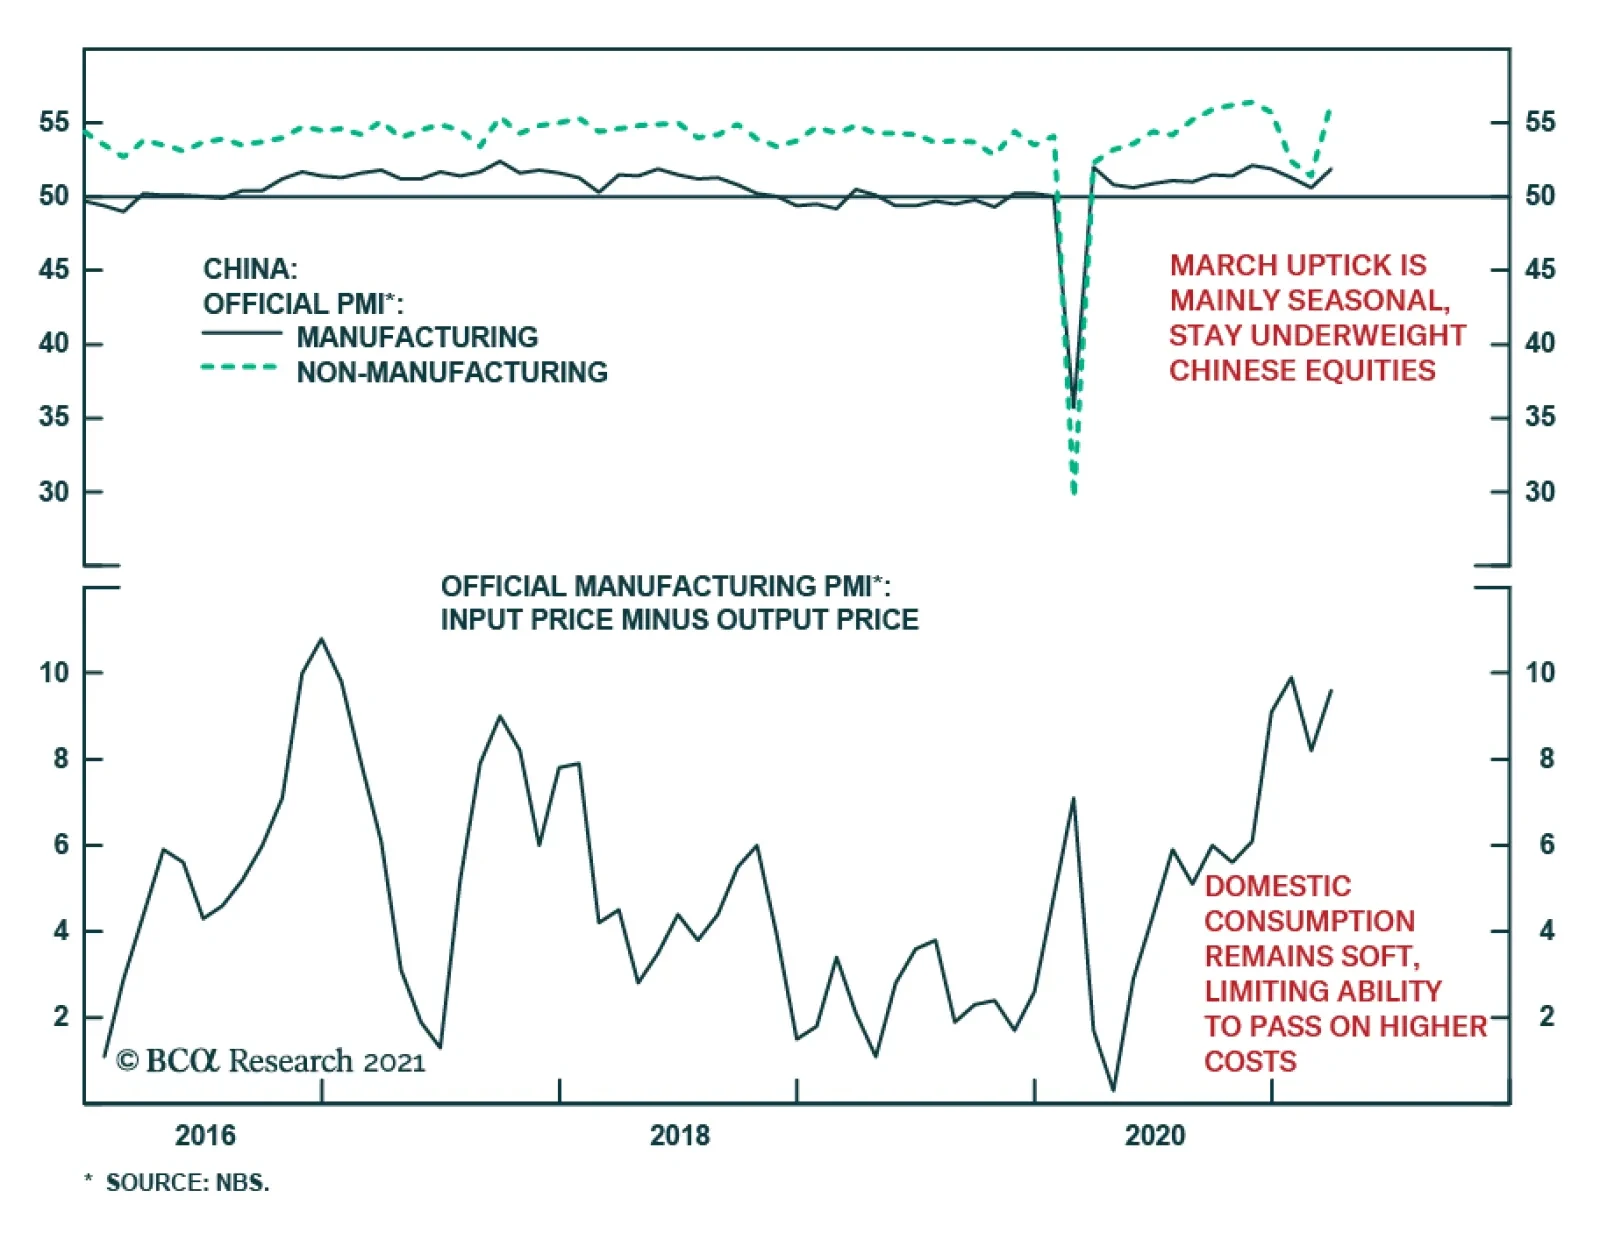
China’s official PMIs moved higher in March, pointing to an expansion in economic activity following three consecutive months of decline. The Manufacturing PMI inched up to 51.9 from 50.6, beating expectations by 0.7 points while the Non-Manufacturing PMI…
Highlights Extremely accommodative fiscal policy and a rapid pace of vaccination puts the US on track to close its output gap by the end of the year. The situation is different in Europe, and the euro area economy will likely continue to underperform the US until at least the summer. Investors are now unusually more hawkish than the Fed, whose caution is driven by the expectation of some lingering and persistent slack in the labor market even once the pandemic is over. The Fed’s rate projections, coupled with the extraordinary size of the American Rescue Plan, have stoked investor concerns about a significant rise in inflation. For inflation to rise dangerously above the Fed’s target, the US would likely need to see a persistently strong and positive output gap, and/or a major upward shift in expectations among consumers and firms. We expect a meaningful recovery in inflation this year, perhaps to above-target levels even without factoring in transitory supply-chain effects, but probably not to levels that investors deem to be “out of control.” Over the coming 6 to 12 months, a comparatively sanguine perspective on inflation supports a bullish view on stocks and an overweight stance towards equities within a multi-asset portfolio. We recommend that investors maintain below-benchmark portfolio duration, and overweight US speculative over investment-grade corporate bonds. The fact that Europe may lag growth-wise for a few months could continue to impact regional equity performance as well as the trend in the dollar over the coming 0-3 months. But over a 6-12 month time horizon, we continue to favor global ex-US vs. US stocks, and expect the dollar to be lower than it is today. A Brighter Light At The End Of The Tunnel Chart I-1Even Better Than Some Optimists Would Have Predicted
Even Better Than Some Optimists Would Have Predicted
Even Better Than Some Optimists Would Have Predicted
Over the past 4-6 weeks, the US has continued to make incredible progress in vaccinating its population against COVID-19. Chart I-1 highlights that the pace of vaccination is now well within the range required for herd immunity to be in place by the end of the third quarter. If this pace continues at an average of 2.5 million doses per day, the US will have vaccinated 90% of its population by the end of September (if it is determined that the vaccine is safe to give to children). And these calculations assume the continuation of a two-dose regime, meaning that the eventual rollout of Johnson & Johnson's Janssen vaccine – which requires only one dose and has shown to be extremely effective at preventing severe illness and death – could shorten the time to herd immunity rates of vaccination among adults even further. The situation is clearly different in Europe. The vaccination progress in several European countries is woefully behind that of the US and the UK (Chart I-2), and per capita cases in the euro area have again risen significantly above that of the US (Chart I-3). This reality motivated last week’s news that the European Union is reportedly planning on banning exports of the AstraZeneca vaccine for a period of time, as European policymakers grow increasingly concerned about the potential economic consequences of lengthened or additional pandemic control measures over the coming few months. Chart I-2Europe Is Badly Lagging The Vaccine Race…
April 2021
April 2021
There was at least some positive economic news from Europe this month, as reflected by the flash manufacturing and services PMIs (Chart I-4). The euro area manufacturing PMI surpassed that of the US this month, reflecting that the prospects for goods-producing companies in Europe remain solidly linked to the strong global manufacturing cycle. Services, on the other hand, have been the weak spot in Europe, having remained below the boom/bust line since last summer (in contrast to the US). The March services PMI highlighted that this gap is now starting to narrow, although the euro area economy will likely continue to underperform the US until at least the summer. Chart I-3...And It Is Starting To Show
...And It Is Starting To Show
...And It Is Starting To Show
Chart I-4Some Closure Of The Services Gap, But Still A Ways To Go
Some Closure Of The Services Gap, But Still A Ways To Go
Some Closure Of The Services Gap, But Still A Ways To Go
The underperformance of the European services sector over the past nine months has been due in part to more severe pandemic control measures, but also a comparatively timid fiscal policy. The IMF’s October Fiscal Monitor highlighted that the US had provided roughly eight percentage points more of GDP in above-the-line fiscal measures versus the European Union as a whole, and that was before the US December 2020 relief bill and this month’s $1.9 trillion American Rescue Plan (ARP) act were passed. The CBO estimates that the ARP will result in about US$1 trillion in outlays in 2021, which is roughly 5% of nominal GDP. Consequently, Chart I-5 highlights that consensus expectations now suggest that the output gap will be marginally positive by the end of the year, with the Fed’s most recent forecast implying that real GDP will be more than 1% above the CBO’s estimate of potential output. Chart I-5The US Output Gap Will Likely Be Closed By The End Of This Year
The US Output Gap Will Likely Be Closed By The End Of This Year
The US Output Gap Will Likely Be Closed By The End Of This Year
The Fed Versus The Market Despite this, the Fed held pat during this month’s FOMC meeting and did not validate market expectations of rate hikes beginning in early 2023. Chart I-6 highlights the Fed funds rate path over the coming years as implied by the OIS curve, alongside the Fed’s median projection of the Fed funds rate. This means that investors are now more hawkish than the Fed, which is the opposite of what has typically prevailed since the global financial crisis. Chart I-6The Market Is Now, Unusually, More Hawkish Than The Fed
The Market Is Now, Unusually, More Hawkish Than The Fed
The Market Is Now, Unusually, More Hawkish Than The Fed
Fed Chair Jerome Powell implied during the March 17 press conference that some FOMC participants were unwilling to change their projections for the path of interest rates based purely on a forecast, which argues that the median dot in the Fed’s “dot plot” will shift higher in the second half of the year if participants’ growth and inflation forecasts come to fruition. But Charts I-7A and I-7B suggest that the Fed’s caution is also driven by the expectation of some lingering and persistent slack in the labor market even once the pandemic is over. Chart I-7AA Positive Output Gap Implies…
April 2021
April 2021
Chart I-7B…An Unemployment Rate Below NAIRU
April 2021
April 2021
The charts highlight the historical relationship between the output gap and the deviation of NAIRU from the unemployment rate, from 2000 and 2010. In both cases, the charts show that the unemployment rate would be below the CBO’s estimate of NAIRU at the end of this year (roughly 4.5%) given the CBO’s estimate for potential (i.e. full employment) GDP and the Fed's forecast for growth. However, the Fed is forecasting that the unemployment rate will essentially be at NAIRU, which is itself above the Fed’s longer-run unemployment rate projection of 4%. As such, the Fed does not see the unemployment rate falling to “full employment” levels this year, a precondition for the onset of rate normalization. Investors should note that the relationships shown in Charts I-7A and I-7B suggest that the unemployment rate will be closer to 3-3.5% at the end of this year if the Fed’s growth forecast is correct, which would constitute full employment based on the Fed’s 4% unemployment rate target. The difference between a 3-3.5% unemployment rate and the Fed’s estimate of 4.5% translates to a gap of roughly 1.5-2.5 million jobs at the end of this year, which underscores that the Fed expects either a significant shift in temporary to permanent unemployment or an influx of unemployed workers back into the labor force who don’t quickly find jobs once social distancing ends and pandemic restrictions are no longer required. Chart I-8The Full Employment Level Of GDP Has Not Been Significantly Revised
The Full Employment Level Of GDP Has Not Been Significantly Revised
The Full Employment Level Of GDP Has Not Been Significantly Revised
There are three possible circumstances that would resolve this seeming contradiction. The first is that the Fed’s estimate for growth this year is simply too high, and that the output gap will be close to zero at the end of the year (i.e., more in line with consensus market expectations). The second is that the CBO is understating the level of GDP that is consistent with full employment, namely that potential GDP is higher than what they currently project. But Chart I-8 shows that the CBO’s current estimate for potential output at the end of this year is only 0.4% below what it had estimated prior to the pandemic, which is smaller than the positive gap implied by the Fed’s growth estimate for this year (roughly 1.2%). The third possibility is that the Fed is overestimating the extent to which the pandemic will cause permanent damage to the labor market. As we noted in our February report, even once social distancing is no longer required, it does seem likely that some portion of the spending on services that has been “missing” over the past year will never return. While it seems reasonable to expect that the gap in spending on hospitality and travel will close quickly once the health situation allows, it also seems reasonable to expect that some service areas, particularly retail, will experience a permanent loss in demand owing to durable shifts in consumer behavior that occurred during the pandemic (greater familiarity and use of online shopping, a permanent reduction of some magnitude in commuting, etc). A gap of 1.5-2.5 million jobs accounts for roughly 10-15% of pre-pandemic employment in retail trade, or 4-7% of the sum of retail trade, leisure & hospitality, and other services. It is possible that permanent job losses or significantly deferred job recovery of this size will occur, but it is far from clear that it will. Were job losses / deferred jobs recovery of this magnitude to not materialize, it would suggest that the US will reach full employment earlier than the Fed is currently projecting, and would significantly increase the odds that the Fed will begin to taper its asset purchases and/or raise interest rates at some point next year – which is earlier than investors currently expect. For Now, Dangerously Above-Target Inflation Is Unlikely Fed projections of a 0% Fed funds rate for the next 2 1/2 years, coupled with the extraordinary size of the American Rescue Plan, have understandably stoked investor concerns about a significant rise in inflation. Larry Summers’ recent interview with Bloomberg was emblematic of the concern, during which he criticized the Biden administration’s fiscal policy as the “least responsible” that the US has experienced in four decades and warned of the potential inflationary consequences of overheating the economy.1 It is true that the Federal Reserve is explicitly aiming to generate a temporary overshoot of inflation relative to its target, the Biden administration’s fiscal plan is legitimately large, and there is a tremendous pool of excess savings that could be deployed later this year once the pandemic is essentially over. Clearly, the risks of overheating must be higher than they have been in the past. But from our perspective, out-of-control inflation over the coming 12-24 months would very likely necessitate one of two things to occur, and possibly both: US consumers decide to spend an overwhelmingly large amount of the excess savings that have been accumulated. Main street expectations for consumer prices rise sharply, prompted by a public discussion about the likelihood of a shifting inflation regime. Our view is rooted in the examination of the modern-day Phillips Curve that we presented in our January report, which considers both the impact of economic/labor market slack and inflation expectations as a driver of actual inflation. The modern-day Phillips Curve posits that expectations act as the trend for inflation, and slack in the economy determines whether actual inflation is above or below that baseline. Chart I-9 highlights that the output gap worked well prior to the global financial crisis at explaining the difference between actual and exponentially-smoothed inflation, the latter acting as a long-history proxy for expectations. Pre-GFC, the chart highlights that there have been only two exceptions to the relationship that concerned the magnitude rather than the direction of inflation. Post-GFC, the relationship deviated substantially, but in a way that implied that actual inflation was too strong during the last expansion, not too weak – particularly during the early phase of the economic recovery. This likely occurred because expectations initially stayed very well anchored due to the Fed’s strong record of maintaining low and stable inflation, but ultimately declined due to a persistently negative output gap as well as in response to the 2014 collapse in oil prices (Chart I-10). Chart I-9Pre-GFC, The Output Gap Generally Explained Inflation Surprises
Pre-GFC, The Output Gap Generally Explained Inflation Surprises
Pre-GFC, The Output Gap Generally Explained Inflation Surprises
Chart I-10Inflation Expectations Eventually Succumbed Post-GFC To Collapsing Energy Prices
Inflation Expectations Eventually Succumbed Post-GFC To Collapsing Energy Prices
Inflation Expectations Eventually Succumbed Post-GFC To Collapsing Energy Prices
Thus, for inflation to rise dangerously above the Fed’s target, the US would likely need to see a persistently strong and positive output gap, and/or a major upward shift in expectations among consumers and firms. Chart I-11 highlights that the amount of excess savings that have accumulated as a percentage of GDP does indeed significantly exceed the magnitude of the output gap, but some of those savings have been and will be invested in financial markets (boosting valuation), some will be used to pay down debt, some will eventually be spent on international travel (boosting services imports), and some will likely be permanently held as deposits in anticipation of future tax increases. And while long-term household expectations for prices have risen since the passing of the CARES act last year, the rise has merely unwound the decline that took place following the 2014 oil price collapse (Chart I-12). Chart I-11A Huge Pool Of Savings Exists, But Not All Of It Will Be Spent
A Huge Pool Of Savings Exists, But Not All Of It Will Be Spent
A Huge Pool Of Savings Exists, But Not All Of It Will Be Spent
Chart I-12Long-Term Consumer Inflation Expectations Have Risen From A Very Low Base
Long-Term Consumer Inflation Expectations Have Risen From A Very Low Base
Long-Term Consumer Inflation Expectations Have Risen From A Very Low Base
For now, this framework points to a meaningful recovery in inflation this year, perhaps to above-target levels even without factoring in transitory supply-chain effects, but probably not to levels that investors deem to be “out of control.” Investment Conclusions Over the coming 6 to 12 months, a comparatively sanguine perspective on inflation supports a bullish view on stocks and an overweight stance towards equities within a multi-asset portfolio. While the Fed is likely to shift in a hawkish direction compared with its current projections, it is highly unlikely to become meaningfully more hawkish than current market expectations unless economic growth and the recovery in the labor market is much stronger than the Fed or the market is projecting. In fact, even if the market’s expectations for the first Fed rate hike shift to mid-2022 over the coming several months, Chart I-13 highlights that the impact on the equity market is likely to be minimal unless investors shift up their expectations for the terminal Fed funds rate. The chart presents a fair value estimate for the 10-year Treasury yield based on the OIS-implied path of the Fed funds rate out to December 2024, and assumes that short rates ultimately rise to the Fed’s long-term Fed funds rate projection of 2.5%. The second fair value series assumes that the shape of the OIS curve stays the same, but shifts closer by 6 months. Chart I-13The Market’s Assumed Rate Hike Path And Terminal Rate Are Not Threatening For Stocks
April 2021
April 2021
The chart underscores that the 10-year yield will rise to at most between 2-2.2% by the end of the year based on these scenarios. A shift forward in the timing of Fed rate hikes will impact the short end of the curve, but the long end will remain relatively unchanged if terminal rate expectations stay constant and the term premium on long-term bonds remains near zero. These levels would in no way be economically damaging nor threatening to stock market valuation. It is possible, however, that investor expectations for the neutral rate of interest (“r-star”) will shift higher once the pandemic is over, and we explore this risk to stocks in Section 2 of our report. For now, this remains a risk to our view rather than our expectation, but it is likely to remain an important possibility to monitor as the decisive end to social distancing and other pandemic control measures draws nearer. Within fixed income, we recommend that investors maintain below-benchmark portfolio duration even though investors are already pricing in a more hawkish path for the Fed funds rate. First, Chart I-13 highlighted that yields at the long end of the curve are likely to continue to move modestly higher this year even if the projected path for the Fed funds rate remains relatively unchanged. But more importantly, barring a substantially negative development on the health or vaccine front that prolongs the pandemic, the risk appears to be clearly to the upside in terms of the timing of the first Fed rate hike and the terminal Fed funds rate. As such, from a risk-reward perspective, a long duration stance remains unattractive. We would also recommend overweighting US speculative over investment-grade corporate bonds, as spreads are not as historically depressed for the former than the latter (Chart I-14). Finally, in terms of the dimensions of equity market performance and the dollar, we recommend that investors overweight global ex-US equities vs. the US, overweight value vs. growth, overweight cyclicals vs. defensives, and overweight small vs. large caps. We are also bearish on the dollar on a 12-month time horizon. However, there are two caveats that investors should bear in mind. First, global cyclicals versus defensives (especially in equally-weighted terms) as well as small versus large caps have already mostly normalized not just the impact of the pandemic but as well that of the 2018-2019 Trump trade war (Chart I-15). We would expect, at best, modest further gains from both positions this year. Chart I-14Speculative-Grade Corporate Bonds Are Less Expensive Than Investment-Grade
Speculative-Grade Corporate Bonds Are Less Expensive Than Investment-Grade
Speculative-Grade Corporate Bonds Are Less Expensive Than Investment-Grade
Chart I-15Going Forward, Expect More Modest Gains From Cyclicals And Small Caps
Going Forward, Expect More Modest Gains From Cyclicals And Small Caps
Going Forward, Expect More Modest Gains From Cyclicals And Small Caps
Second, the fact that Europe may lag growth-wise for a few months could continue to impact regional equity performance as well as the trend in the dollar on a 0-3 month time horizon. The US dollar is typically a counter-cyclical currency, but there have been exceptions to that rule. And historically, exceptions have tended to revolve around periods when US growth has been quite strong, as is currently the case (Chart I-16). A continued counter-trend rally in the dollar is thus possible over the course of the next few months, but we would expect USD-EUR to be lower than current levels 12 months from now. Chart I-16A Short-Term Counter-Trend Dollar Move Is Possible
A Short-Term Counter-Trend Dollar Move Is Possible
A Short-Term Counter-Trend Dollar Move Is Possible
A counter-trend dollar move could also correspond with a period of US outperformance versus global ex-US, or at a minimum, a period of flat performance when global ex-US stocks would normally outperform. Our China strategists expect that the Chinese credit impulse will decelerate later this year (Chart I-17), which would weigh on EM stocks and heighten the importance of European equities in driving global ex-US outperformance. European equity outperformance, in turn, will likely necessitate the outperformance of euro area financials. Chart I-18 highlights that euro area equity underperformance versus the US last year was mostly a tech story, but today there is little difference between the relative performance of euro area stocks overall versus indexes that exclude the broadly-defined technology sector. In both cases, the euro area index is roughly 10% below its US counterpart relative to pre-pandemic levels, which exactly matches the extent to which euro area financials have underperformed. Chart I-17A Slowing Chinese Credit Impulse Means EM Equities Will Struggle To Outperform
A Slowing Chinese Credit Impulse Means EM Equities Will Struggle To Outperform
A Slowing Chinese Credit Impulse Means EM Equities Will Struggle To Outperform
Chart I-18Euro Area Financials Need To Outperform For Europe To Outperform
Euro Area Financials Need To Outperform For Europe To Outperform
Euro Area Financials Need To Outperform For Europe To Outperform
Euro area financials have demonstrated very poor fundamental performance over the past decade, but they are likely to outperform for some period once the European vaccination campaign gains enough traction to alter the disease’s transmission and hospitalization dynamics. Chart I-19 highlights that euro area bank 12-month forward earnings have further room to recover to pre-pandemic levels than for banks in the US, and Chart I-20 highlights that euro area banks trade at their deepest price-to-book discount versus their US peers since the euro area financial crisis. Chart I-19Euro Area Bank Earnings Have Catch-Up Potential
Euro Area Bank Earnings Have Catch-Up Potential
Euro Area Bank Earnings Have Catch-Up Potential
Chart I-20Euro Area Banks Are Extremely Cheap Versus The US
Euro Area Banks Are Extremely Cheap Versus The US
Euro Area Banks Are Extremely Cheap Versus The US
Thus, while euro area and global ex-US equities may not outperform on the back of rising global stock prices over the coming few months, investors focused on a 6-12 month time horizon should respond by increasing their allocation to European stocks and to further reduce dollar exposure. Jonathan LaBerge, CFA Vice President The Bank Credit Analyst March 31, 2021 Next Report: April 29, 2021 II. R-star, And The Structural Risk To Stocks In the decade following the global financial crisis, investor concerns that the Fed’s monetary policies have artificially boosted equity market valuation have been mostly overblown. But today, it is now true that US equities are increasingly dependent on persistently low bond yields, as stocks can only avoid near bubble-like relative pricing if yields remain below trend rates of economic growth. Macroeconomic theory and the historical record both support the notion that nominal interest rates are normally in equilibrium when they are roughly equal to the trend rate of nominal income growth. A gap between interest rates and trend rates of growth was indeed justified for a few years following the global financial crisis, but in the few years prior to the pandemic, it is altogether possible that the neutral rate of interest (or “r-star”) was in fact meaningfully higher than academic estimates suggested. In a scenario where the US output gap closes quickly, inflation rises above target, and where permanent damage to the labor market from the pandemic is relatively limited, we expect the narrative of secular stagnation to be challenged and for investor expectations for the neutral rate to move closer to trend rates of economic growth. That would imply that the 5-year/5-year forward Treasury yield could hypothetically rise above 3%, and possibly as high as 4% or more. Such a shift would push the US equity risk premium back to 2002 levels based on current stock market pricing. This is not necessarily negative for equities, but it is also not clear what equity risk premium investors will require to contend with the myriad risks to the economic outlook that did not exist in the early 2000s. A low ERP that is technically not as low as that of the tech bubble era could thus still threaten stock prices, as T.I.N.A., “There Is No Alternative,” may not prevail. Many investors have questioned what asset allocation strategy should be pursued in a scenario where stock prices and bond yields are no longer positively correlated. While they are not likely to be without cost, options exist for investors to potentially earn positive absolute returns in a scenario where a significant shift in the interest rate outlook threatens both stock and bond prices. Chart II-1Equity Valuation Concerns Have Persisted For The Past Decade...
Equity Valuation Concerns Have Persisted For The Past Decade...
Equity Valuation Concerns Have Persisted For The Past Decade...
For the better part of the last decade, many investors have argued that the Fed’s monetary policies have artificially boosted equity market valuation. Based on the cyclically-adjusted P/E ratio metric originated by Robert Shiller, stocks reached pre-global financial crisis (GFC) multiples in late 2014 and early 2015 (Chart II-1). Based on metrics such as the price-to-sales ratio, stocks rose to pre-GFC valuation in late 2013, and are now even more richly valued than they were at the height of the dotcom bubble. These concerns have mostly occurred in response to absolute changes in stock multiples, but equity valuation cannot be divorced from the prevailing level of interest rates. Relative to bond yields, stocks were extraordinarily cheap for many years following the GFC. Measured by one simple approach to calculating the equity risk premium, the spread between the 12-month forward earnings yield (the inverse of the forward P/E ratio) and the real 10-year Treasury yield, stocks were the cheapest following the GFC that they had been since the mid 1980s, and remain reasonably priced today (Chart II-2). Chart II-2...But Stocks Have Actually Been Cheap Versus Bonds
...But Stocks Have Actually Been Cheap Versus Bonds
...But Stocks Have Actually Been Cheap Versus Bonds
The fact that stocks have appeared to be expensive for several years but quite cheap (or reasonably priced) relative to bonds underscores the fact that longer-term bond yields have been extraordinarily low following the global financial crisis. Still, equities were not dependent on low bond yields prior to the pandemic, as illustrated in Chart II-3. The chart highlights the range of 10-year Treasury yields that would be consistent with the pre-GFC equity risk premium range (measured from 2002-2007), alongside the actual 10-year yield and trend nominal GDP growth. The chart shows that for years following the financial crisis, bond yields could have risen to levels well above trend rates of economic growth and stocks would still have been priced in line with pre-crisis norms. This “normal pricing” range for the 10-year declined as the expansion continued, but remained consistent with trend growth rates and above the actual 10-year yield up until the beginning of the pandemic. Chart II-3 also highlights, however, that the circumstances changed last year. The equity risk premium briefly rose at the onset of the pandemic as stocks initially sold off sharply, but then quickly fell as stock prices recovered in response to aggressive fiscal and monetary easing. Today, it is true that US equities are increasingly dependent on persistently low bond yields, as stocks can only avoid bubble-like relative pricing if yields remain below trend rates of economic growth. Chart II-3Now, Stocks Are Increasingly Dependent On Low Bond Yields
Now, Stocks Are Increasingly Dependent On Low Bond Yields
Now, Stocks Are Increasingly Dependent On Low Bond Yields
Prior to the pandemic, most fixed-income investors would have viewed the risk of bond yields rising to trend nominal GDP growth, let alone above it, as minimal. Global investors have come to accept the secular stagnation narrative as described by Larry Summers in November 2013, and have gravitated to academic estimates of the neutral rate of interest (“R-star”) that show a substantial gap between the natural rate and trend real growth (Chart II-4). This view has manifested itself in a decline in surveyed estimates of the long-run Fed funds rate, but at present the 5-year/5-year forward Treasury yield has pushed well above this survey-derived fair value range (Chart II-5). It is possible that the fiscal response to the pandemic will cause investor views about r-star to evolve even further over the coming 12-24 months, and in this report we explore the potential headwind that such an evolution could present to stock prices at some point – potentially as early as next year. Chart II-4Investors Have Accepted Secular Stagnation, And The View That R-star Is Well Below Trend Rates Of Growth
Investors Have Accepted Secular Stagnation, And The View That R-star Is Well Below Trend Rates Of Growth
Investors Have Accepted Secular Stagnation, And The View That R-star Is Well Below Trend Rates Of Growth
Chart II-5The Market's Views About R-star May Be Shifting
The Market's Views About R-star May Be Shifting
The Market's Views About R-star May Be Shifting
R-star: A Brief Primer Macroeconomic theory and the historical record both support the notion that nominal interest rates are normally in equilibrium when they are roughly equal to the trend rate of nominal income growth. From the perspective of macro theory, the neutral rate of interest is determined by the supply of and demand for savings. But in practical terms, this implies that the neutral rate should normally be closely linked to the trend rate of economic growth. For example, if interest rates – and thus the cost of capital – were persistently below aggregate income growth, then demand for capital (and thus credit and likely labor demand) should increase as firms seek to profit from the gap between the interest rate and the expected rate of return from real investment. As such, the trend rate of growth acts as a good proxy for the interest rate that will balance the supply and demand for credit during normal economic circumstances. Empirically, academic estimates of r-star closely followed estimates of trend real GDP growth prior to the global financial crisis, as shown in Chart II-4 above. In addition, we noted in our January report that the stance of monetary policy, as defined by the difference between nominal GDP growth and the 10-year Treasury yield, has generally done a good job of explaining the US output gap prior to 2000. This supports the notion that monetary policy is stimulative (restrictive) when bond yields are below (above) trend growth rates. However, in the years following the GFC, investors’ estimates of r-star collapsed, as evidenced by the sharp decline in 5-year / 5-year forward Treasury yields (Chart II-6). This was followed by a decline in primary dealer and FOMC expectations for the long-term Fed funds rate, which investors took as validating their view that the neutral rate of interest has permanently declined. Chart II-6Investors Led The Fed And Others In Expecting A Lower Nominal Neutral Rate
Investors Led The Fed And Others In Expecting A Lower Nominal Neutral Rate
Investors Led The Fed And Others In Expecting A Lower Nominal Neutral Rate
R-star And Trend Growth: Is A Gap Between The Two Really Justified? Chart II-7R-star Likely Did Decline Following The GFC (For A Time)
R-star Likely Did Decline Following The GFC (For A Time)
R-star Likely Did Decline Following The GFC (For A Time)
It seems clear that r-star did indeed decline for a time after the GFC. The US and select European economies suffered a balance sheet recession in 2008/2009 that impacted credit demand for an extended period of time (Chart II-7), and extraordinarily low interest rates for several years did not fuel major credit excesses (at least in the household sector). But as we detailed in a Special Report last year,2 we doubt that the decline in r-star was permanent, for several reasons. The first, and most important, is that there have been at least four deeply impactful non-monetary shocks to both the US and global economies since 2008 that magnified the impact of prolonged household deleveraging and help explain the disconnect between growth and interest rates during the last economic cycle: The euro area sovereign debt crisis Premature fiscal austerity in the US, the UK, and euro area from 2010 – 2012/2014 The US dollar / oil price shock of 2014 The Trump administration’s aggressive use of tariffs beginning in 2018, impacting China but also other developed market economies. Chart II-8Recent Trends In US Private Sector Leverage Do Not Suggest R-star Is Very Low
Recent Trends In US Private Sector Leverage Do Not Suggest R-star Is Very Low
Recent Trends In US Private Sector Leverage Do Not Suggest R-star Is Very Low
Except for the oil price shock of 2014 (which was driven by technological developments and a price war among producers), all of these non-monetary shocks were caused or exacerbated by policymakers – often for political reasons or due to regulatory failures. Second, the trend in US private sector credit growth last cycle does not suggest that r-star fell permanently. Chart II-8 underscores two points: the first is that while US household sector credit contracted for several years following the global financial crisis, it started growing again in 2013 and had largely closed the gap with income growth prior to the pandemic. The second point is that the nonfinancial corporate sector clearly leveraged itself over the course of the last expansion, arguing that interest rates have not in any way been restrictive for businesses. Third, we disagree with a common view in the marketplace that the 2018-2019 period supported the validity of low academic estimates of the neutral rate. Chart II-9 highlights that monetary policy ceased to be stimulative in 2019 according to the Laubach & Williams r-star estimate, which some investors have argued explains the late 2018 equity market selloff, the 2019 slowdown in the US housing market, the inversion of the yield curve, and the global manufacturing recession. Chart II-9Monetary Policy Ceased To Be Stimulative In 2019, According To The LW R-star Estimate
Monetary Policy Ceased To Be Stimulative In 2019, According To The LW R-star Estimate
Monetary Policy Ceased To Be Stimulative In 2019, According To The LW R-star Estimate
But this narrative ignores other important factors that contributed to the slowdown. For example, Chart II-10 highlights that this period of economic weakness exactly coincided with the most intense phase of the Sino-US trade war, as well as a significant slowdown in Chinese credit growth. The chart highlights that the selloff in the US equity market began almost immediately after a surge in the effective tariff rates levied by the two countries against each other, and after the Chinese credit impulse fell three percentage points (from 30% to 27% of GDP). Chart II-10The 2018 Stock Market Selloff Occurred Once Sino-US Tariffs Exploded
The 2018 Stock Market Selloff Occurred Once Sino-US Tariffs Exploded
The 2018 Stock Market Selloff Occurred Once Sino-US Tariffs Exploded
Chart II-11 highlights that interest rates did likely impact the housing market, but that it was the speed at which rates rose that was damaging rather than their level. The chart shows that the rise in mortgage rates from late 2016 to late 2018 was among the largest 2-year increases that has occurred since the early 1980s, so it is unsurprising that the growth in home sales and real residential investment slowed for a time. Additionally, Chart II-12 highlights that the rise in mortgage rates during this period did not cause a downtrend in mortgage credit growth, which only occurred in Q4 2018 in response to the impact of the sharp selloff in the equity market on household net worth. Chart II-11Mortgage Rates Rose Very Significantly From Late 2016 To Late 2018
Mortgage Rates Rose Very Significantly From Late 2016 To Late 2018
Mortgage Rates Rose Very Significantly From Late 2016 To Late 2018
Chart II-12A Record Rise In Mortgage Rates Did Not Crack The Housing Market
A Record Rise In Mortgage Rates Did Not Crack The Housing Market
A Record Rise In Mortgage Rates Did Not Crack The Housing Market
In short, the late 2018 / 2019 period saw a major global aggregate demand shock occur following an already-established slowdown in Chinese credit growth and a rapid rise in interest rates in the DM world. It is these factors that were likely responsible for the 2019 slowdown in economic growth, not the fact that interest rates reached levels that restricted economic activity on their own. R-star In A Post-Pandemic World Charts II-7 – II-12 above suggest that a gap between interest rates and trend rates of growth was indeed justified for a few years following the global financial crisis, but that a decline in r-star only appeared to be permanent due to persistent, non-monetary policy shocks to aggregate demand. In the few years prior to the pandemic, it is altogether possible that r-star was in fact meaningfully higher than academic estimates suggested. But that is now a counterfactual assertion, as the pandemic has transformed the outlook for interest rates and bond yields in conflicting ways. A 10% decline in the level of real output was the most intensely negative non-monetary shock to aggregate demand since the 1930s (Chart II-13), and we agree that another depression would have occurred without extraordinary government assistance. The economic damage caused by the pandemic certainly does not work in favor of a higher neutral rate, and we highlighted in Section 1 of our report that the Fed expects there to be some lingering and persistent slack in the labor market even once the pandemic is over. Chart II-13Without Major Monetary And Fiscal Policy Support, The Pandemic Would Probably Have Caused A Depression
Without Major Monetary And Fiscal Policy Support, The Pandemic Would Probably Have Caused A Depression
Without Major Monetary And Fiscal Policy Support, The Pandemic Would Probably Have Caused A Depression
Chart II-14A Huge Increase In Government Transfers And Spending Is Underway
April 2021
April 2021
On the other hand, Larry Summers, the chief proponent of the theory of secular stagnation, has argued for several years that increased fiscal spending was warranted in order to address an imbalance between private sector savings and investment. Summers himself now characterizes US fiscal policy as the “least responsible” that he has seen over the past 40 years, because of too-large government spending that risks overheating the economy (Chart II-14). Summers’ critique rests in large part on the fact that new government spending has not occurred in the form of investment (to balance out the existence of excess savings), but is instead providing transfers to households that in many cases have already accumulated significant excess savings. But the key point for investors is that the pandemic has completely shifted the narrative about fiscal spending, from “arguably insufficient for several years following the global financial crisis” to now “risking a dramatic overheating of the economy.” Some elements of Summers’ criticism of the Biden administration’s fiscal policy are justified, particularly the policy of large direct transfer payments to workers who have suffered no loss in employment or income as a result of the pandemic. Despite this, as detailed in Section 1 of our report, we are more sanguine about the risks of aggressive overheating for three reasons: it does seem likely that some portion of the spending on services that has been “missing” over the past year will never return or will be slow to return, some of the excess savings that have accumulated will not be immediately (or ever) spent, and the rise in consumer inflation expectations that has occurred over the past year has happened from an extremely low starting point and has yet to even rise above its post-GFC range. The low odds that we assign to dangerously above-target inflation over the coming 12-24 months does not, however, mean that investors’ expectations for r-star will stay low. For right or for wrong, the US government has aggressively dis-saved over the past year, in an environment where low expectations for the neutral rate were anchored by a view of excessive private sector savings and insufficient demand from governments. In a scenario where the US output gap closes quickly, inflation rises modestly above target, and where permanent damage to the labor market from the pandemic is relatively limited, it seems reasonable to conclude that the narrative of secular stagnation will be challenged and that investor expectations for the neutral rate will converge towards trend rates of economic growth. That would imply that the 5-year/5-year forward Treasury yield could hypothetically rise above 3%, possibly as high as 4% or more. This is not our base case view, but it will be an important possibility to monitor as the decisive end to social distancing and other pandemic control measures draws nearer. Investment Conclusions A rise in the 5-year/5-year forward Treasury yield does not, in and of itself, suggest that 10-year Treasury yields will rise to levels that would threaten a significant decline in stock prices. The Fed does not control the long-end of the Treasury curve, but it does exert a very strong influence on the short-end. For example, were the Fed to follow the median current projection of FOMC participants and refrain from raising interest rates until sometime after 2023, it would limit how high current 10-year Treasury yields could rise. But it is not difficult to envision plausible scenarios where the 10-year Treasury yield rises above the range consistent with the pre-GFC US equity risk premium. Chart II-15 presents three hypothetical fair value paths for the 10-year yield assuming a mid-2022 liftoff date and a 4% terminal Fed funds rate for the following three scenarios: Chart II-1510-Year Yields Could Rise Meaningfully Further If Investors Shift Their Expectations For R-star
10-Year Yields Could Rise Meaningfully Further If Investors Shift Their Expectations For R-star
10-Year Yields Could Rise Meaningfully Further If Investors Shift Their Expectations For R-star
The Fed raises rates at a pace of 1% (4 hikes) per year, with a term premium of 10 basis points The Fed raises rates at a pace of 1% (4 hikes) per year, with a term premium of 50 basis points The Fed raises rates at a pace of 1.5% (6 hikes) per year, with a term premium of 50 basis points In the first scenario, based on the current US 12-month forward P/E ratio, the fair value of the 10-year Treasury yield would rise above the range consistent with a reasonable ERP in the middle of 2022, the liftoff point assumed in all three scenarios. In the second and third scenarios, the US equity ERP would already be quite low. When using the late 1999 / early 2000 bubble period as a reference point, even the scenarios shown in Chart II-15 are not very threatening to stock prices. Given current equity market pricing, the third scenario would take the US equity risk premium back to mid 2002 levels, which were still meaningfully higher than during the peak of the bubble. And that is assuming an earlier liftoff than the market currently expects, a faster pace of rate hikes than experienced during the last economic cycle, and a very meaningful increase in the market’s expectations for the neutral rate. But it is not clear what equity risk premium investors will require to contend with the myriad risks to the economic outlook that did not exist in the early 2000s. For example, equity investors are today faced with a riskier policy environment than existed 20 years ago in the US and in other developed economies that is at least partially driven by populist sentiment, potentially impacting earnings via lower operating margins or higher taxes. These or other risks existed at several points over the past decade and T.I.N.A. (“There Is No Alternative”) prevailed, but that occurred precisely because the equity risk premium was very elevated. A low ERP that is technically not as low as what prevailed during the tech bubble era could thus still threaten stock prices, raising the specter of negative absolute returns from stocks and nominal government bonds for a period of time, beginning potentially at or in the lead-up to the first Fed rate hike. Chart II-16There Are Alternatives To A Traditional 60/40 Portfolio In A Rising Rate Environment
There Are Alternatives To A Traditional 60/40 Portfolio In A Rising Rate Environment
There Are Alternatives To A Traditional 60/40 Portfolio In A Rising Rate Environment
Many investors have questioned what asset allocation strategy should be pursued in a scenario where stock prices and bond yields are no longer positively correlated. Chart II-16 provides some perspective on the question, by comparing the total return of a 60/40 stock/bond portfolio to a strategy involving the opportunistic redeployment of cash into stocks. The strategy rule maintains a 50/50 stock/cash allocation during normal market conditions, but it then shifts the entire cash allocation into equities following a 15% selloff in the stock market. The portfolio is shifted back to a 50/50 allocation once stocks rise to a new rolling 1-year high. The chart highlights that 60/40 balanced portfolio-style returns may be achievable with cash as the diversifier without a significant reduction in the Sharpe ratio. In fact, the strategy has the effect of lowering average volatility due to prolonged periods of comparatively lower equity exposure, although this occurs at the cost of higher volatility during periods of high market stress (precisely when investors most want protection from volatility). But the bottom line for investors is that while they are not likely to be without cost, options exist for investors to potentially earn positive absolute returns in a scenario where a significant shift in the interest rate outlook threatens both stock and bond prices. As noted above, this remains a risk to our view rather than our expectation, but we will continue to monitor the potential threat posed to stock prices as the pandemic draws to a decisive close later this year. Jonathan LaBerge, CFA Vice President The Bank Credit Analyst III. Indicators And Reference Charts BCA’s equity indicators highlight that the “easy” money from expectations of an eventual end to the pandemic have already been made. Our technical, valuation, and sentiment indicators are very extended, highlighting that investors should expect positive but more modest returns from stocks over the coming 6-12 months. Our monetary indicator has aggressively retreated from its high last year, reflecting a meaningful recovery in government bond yields. The indicator remains above the boom/bust line, however, highlighting that monetary policy remains supportive for risky asset prices. Forward equity earnings already price in a complete earnings recovery, but for now there is no meaningful sign of waning forward earnings momentum. Net revisions remain very strong, and positive earnings surprises have ticked slightly lower from their strongest levels on record. Within a global equity portfolio, US stocks have recently risen versus global ex-US, reflecting a countertrend rise in the US dollar and a lagging vaccination campaign in Europe. We expect a deceleration in the Chinese credit impulse later this year, which will weigh on EM stocks and heighten the importance of European equities in driving global ex-US outperformance. European equity outperformance, in turn, will likely necessitate the outperformance of euro area financials. The US 10-Year Treasury yield has risen well above its 200-day moving average. Long-dated yields are technically stretched to the upside, but our valuation index highlights that bonds are still extremely expensive and that yields could move higher over the cyclical investment horizon. The recent bounce in the US dollar has reflected improved relative US growth expectations, but also previously oversold levels. The dollar may continue to strengthen on a 0-3 month time horizon, but we expect it to be lower in 12 months’ time than it is today. Commodity prices have recovered not just back to pre-pandemic levels, but also back to 2014 levels. This underscores that many commodity prices are extended, and may be due for a breather once the Chinese credit impulse begins to decline. US and global LEIs remain in a solid uptrend, and global manufacturing PMIs are strong. This underscores that the global demand for goods is robust, and that output is below pre-pandemic levels in most economies because of very weak services spending. The latter will recover significantly later this year, as social distancing and other pandemic control measures disappear. EQUITIES: Chart III-1US Equity Indicators
US Equity Indicators
US Equity Indicators
Chart III-2Willingness To Pay For Risk
Willingness To Pay For Risk
Willingness To Pay For Risk
Chart III-3US Equity Sentiment Indicators
US Equity Sentiment Indicators
US Equity Sentiment Indicators
Chart III-4Revealed Preference Indicator
Revealed Preference Indicator
Revealed Preference Indicator
Chart III-5US Stock Market Valuation
US Stock Market Valuation
US Stock Market Valuation
Chart III-6US Earnings
US Earnings
US Earnings
Chart III-7Global Stock Market And Earnings: Relative Performance
Global Stock Market And Earnings: Relative Performance
Global Stock Market And Earnings: Relative Performance
Chart III-8Global Stock Market And Earnings: Relative Performance
Global Stock Market And Earnings: Relative Performance
Global Stock Market And Earnings: Relative Performance
FIXED INCOME: Chart III-9US Treasurys And Valuations
US Treasurys And Valuations
US Treasurys And Valuations
Chart III-10Yield Curve Slopes
Yield Curve Slopes
Yield Curve Slopes
Chart III-11Selected US Bond Yields
Selected US Bond Yields
Selected US Bond Yields
Chart III-1210-Year Treasury Yield Components
10-Year Treasury Yield Components
10-Year Treasury Yield Components
Chart III-13US Corporate Bonds And Health Monitor
US Corporate Bonds And Health Monitor
US Corporate Bonds And Health Monitor
Chart III-14Global Bonds: Developed Markets
Global Bonds: Developed Markets
Global Bonds: Developed Markets
Chart III-15Global Bonds: Emerging Markets
Global Bonds: Emerging Markets
Global Bonds: Emerging Markets
CURRENCIES: Chart III-16US Dollar And PPP
US Dollar And PPP
US Dollar And PPP
Chart III-17US Dollar And Indicator
US Dollar And Indicator
US Dollar And Indicator
Chart III-18US Dollar Fundamentals
US Dollar Fundamentals
US Dollar Fundamentals
Chart III-19Japanese Yen Technicals
Japanese Yen Technicals
Japanese Yen Technicals
Chart III-20Euro Technicals
Euro Technicals
Euro Technicals
Chart III-21Euro/Yen Technicals
Euro/Yen Technicals
Euro/Yen Technicals
Chart III-22Euro/Pound Technicals
Euro/Pound Technicals
Euro/Pound Technicals
COMMODITIES: Chart III-23Broad Commodity Indicators
Broad Commodity Indicators
Broad Commodity Indicators
Chart III-24Commodity Prices
Commodity Prices
Commodity Prices
Chart III-25Commodity Prices
Commodity Prices
Commodity Prices
Chart III-26Commodity Sentiment
Commodity Sentiment
Commodity Sentiment
Chart III-27Speculative Positioning
Speculative Positioning
Speculative Positioning
ECONOMY: Chart III-28US And Global Macro Backdrop
US And Global Macro Backdrop
US And Global Macro Backdrop
Chart III-29US Macro Snapshot
US Macro Snapshot
US Macro Snapshot
Chart III-30US Growth Outlook
US Growth Outlook
US Growth Outlook
Chart III-31US Cyclical Spending
US Cyclical Spending
US Cyclical Spending
Chart III-32US Labor Market
US Labor Market
US Labor Market
Chart III-33US Consumption
US Consumption
US Consumption
Chart III-34US Housing
US Housing
US Housing
Chart III-35US Debt And Deleveraging
US Debt And Deleveraging
US Debt And Deleveraging
Chart III-36US Financial Conditions
US Financial Conditions
US Financial Conditions
Chart III-37Global Economic Snapshot: Europe
Global Economic Snapshot: Europe
Global Economic Snapshot: Europe
Chart III-38Global Economic Snapshot: China
Global Economic Snapshot: China
Global Economic Snapshot: China
Jonathan LaBerge, CFA Vice President The Bank Credit Analyst Footnotes 1 “Summers Sees ‘Least Responsible’ Fiscal Policy in 40 Years,” Bloomberg News, March 20, 2021. 2 2020-03-20 GIS SR “Revisiting The Neutral Rate Of Interest: A Contrarian View In A Time Of Crisis.”
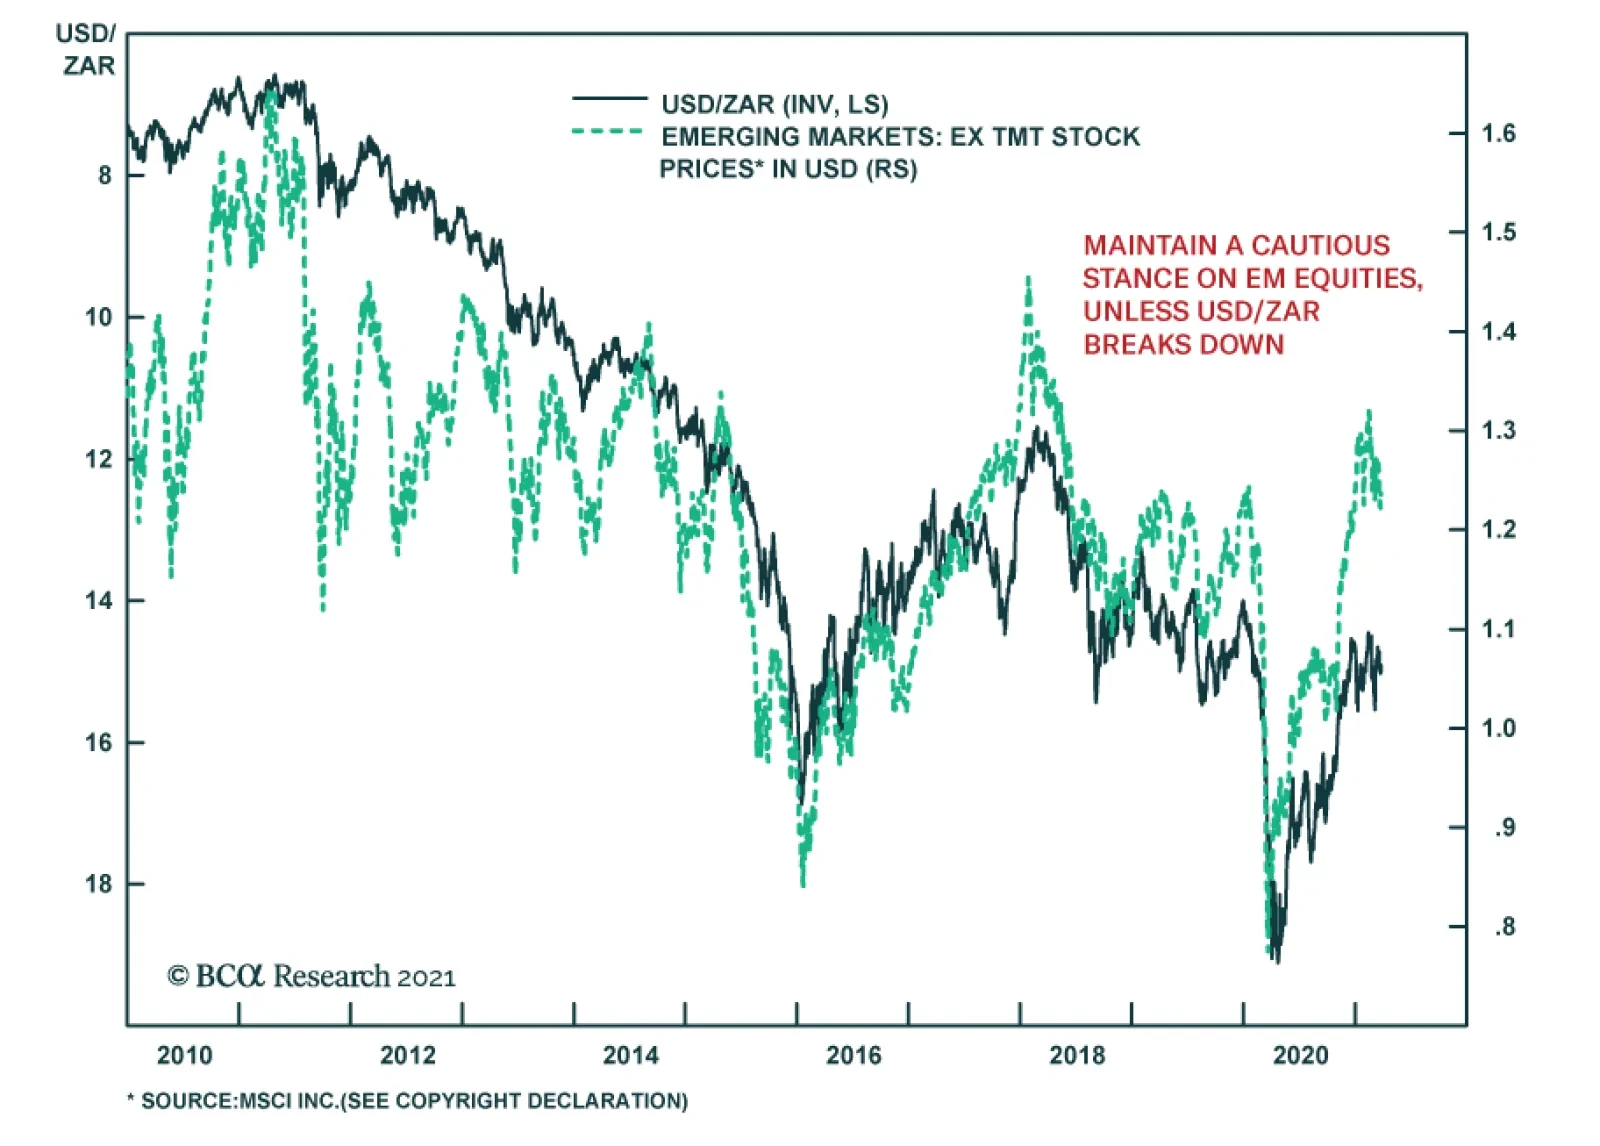
After bottoming in April 2020, the South African rand surged versus the US dollar for the remainder of the year. However, since December, the USD/ZAR has been stuck between 14.5-15.5. The ZAR’s fluctuations coincided with last year’s sharp rebound in EM…
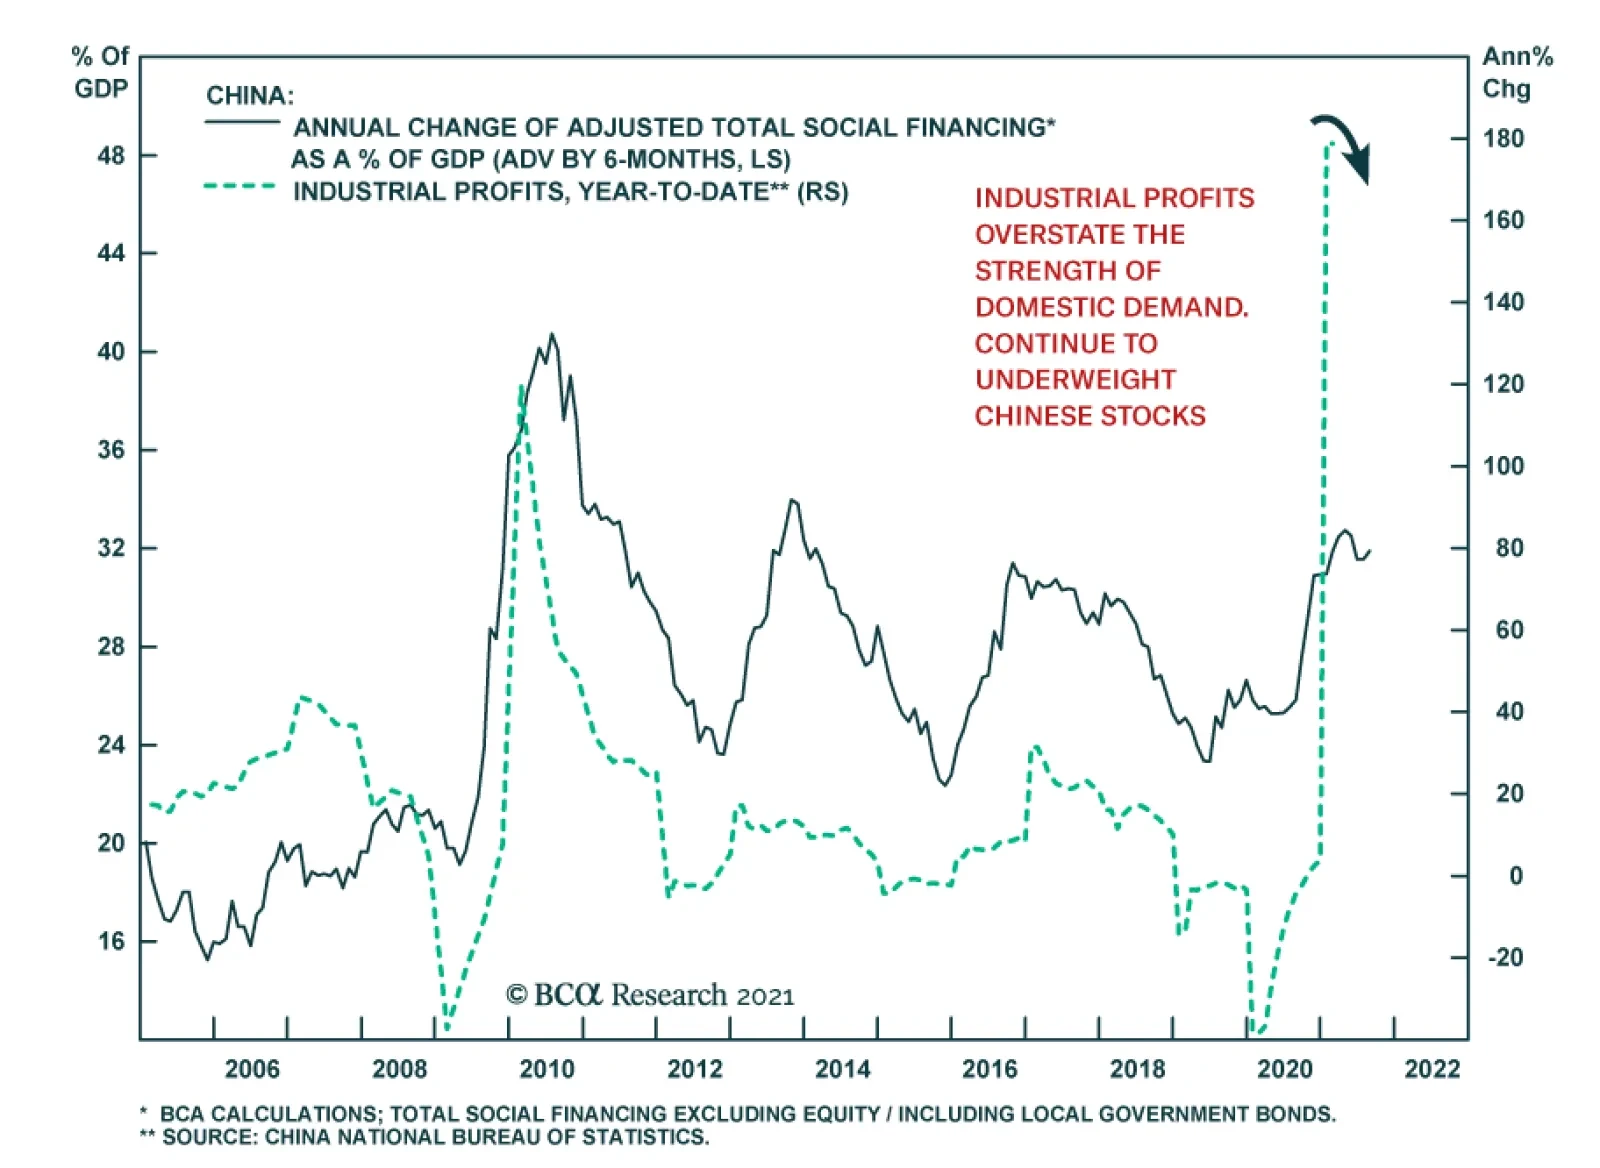
Chinese industrial profits surged 178.9% y/y in the first two months of the year, marking a significant acceleration from December’s 20.1% y/y pace. However, investors should be careful not to interpret this as a sign of underlying strength in the Chinese…
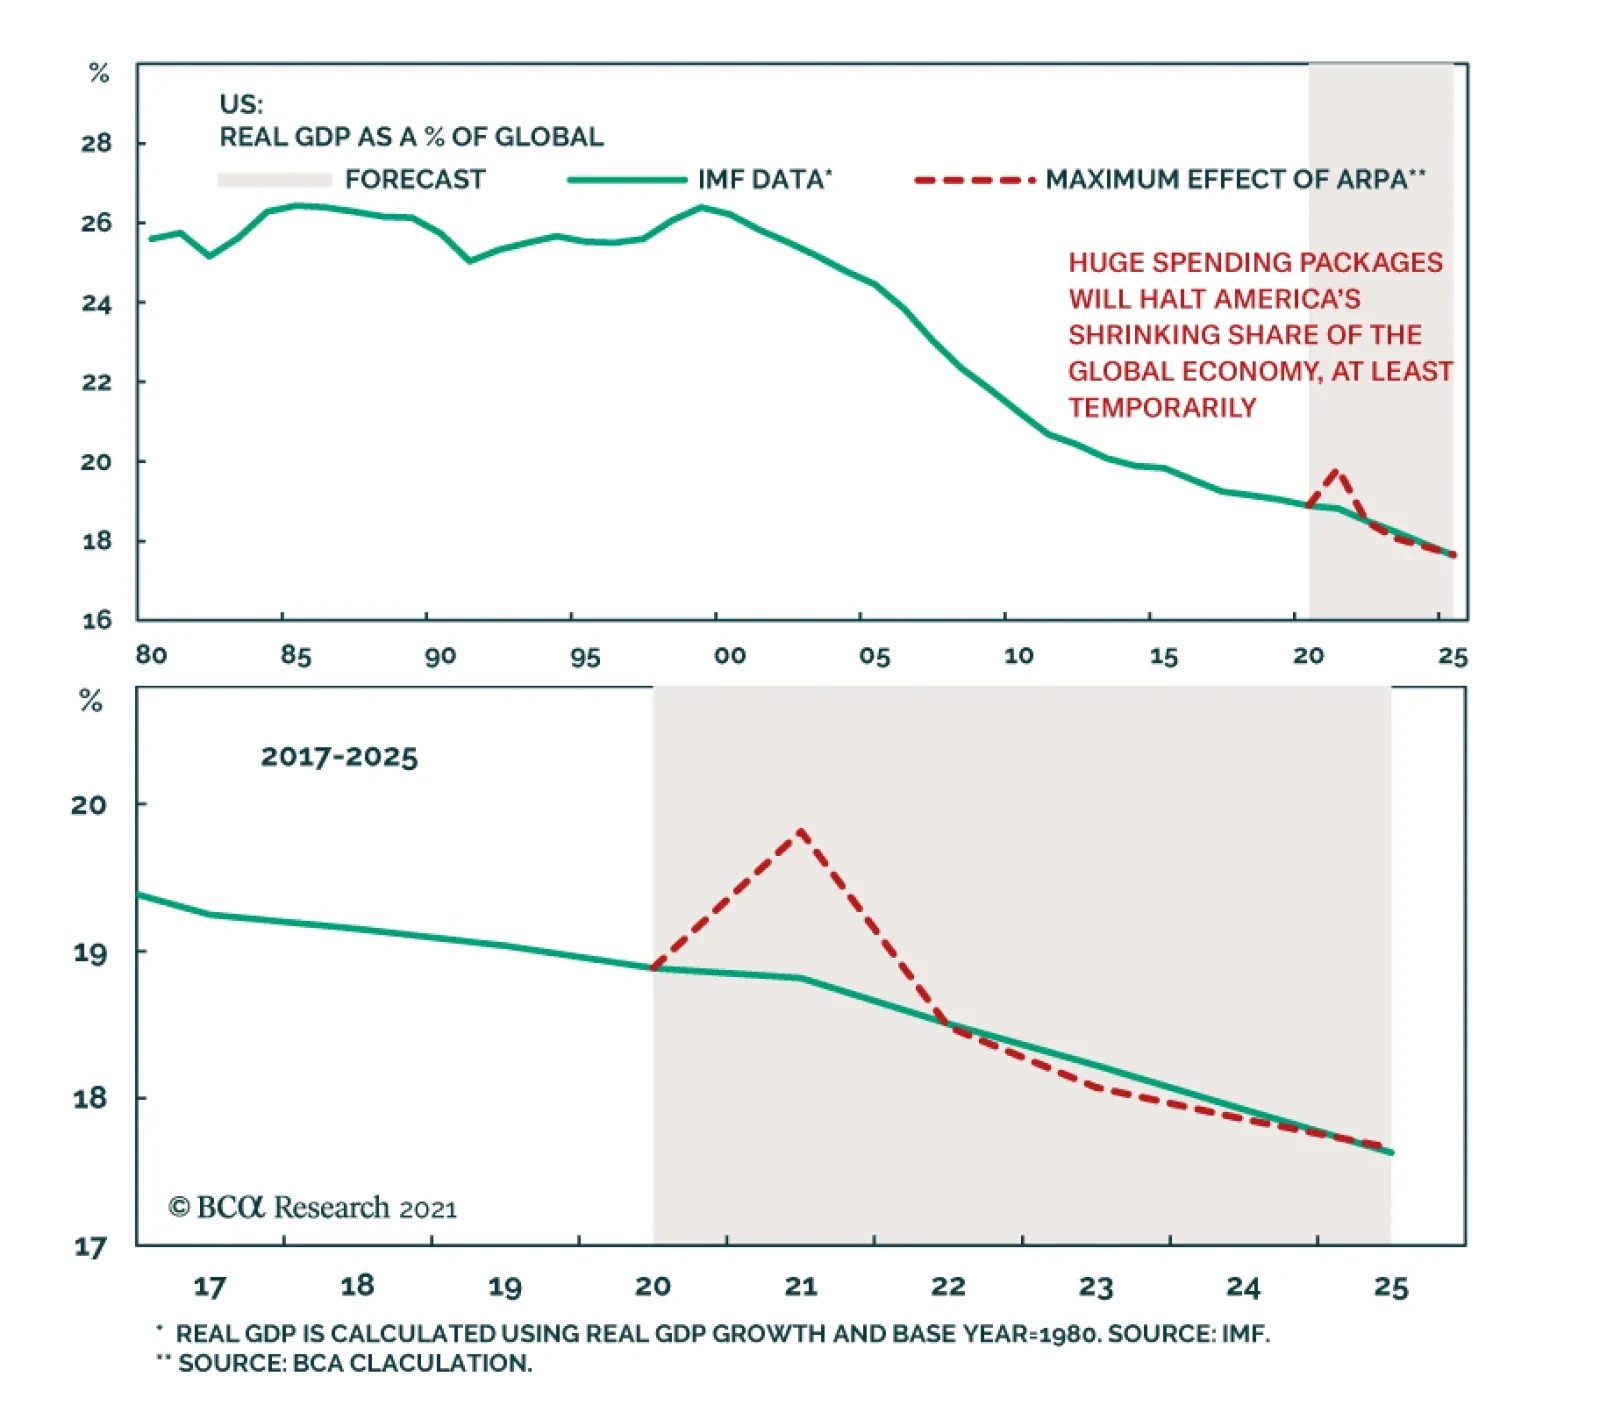
The US saw its share of the global economic decline since the accession of China to the WTO in 2001. This decline coincided with domestic ills like inequality and weak wage growth to elicit a domestic populist response, marked by the election of Donald Trump…
Highlights Global manufacturing activity will soon peak due to growing costs and China’s policy tightening. This process will allow the dollar’s rebound to continue. EUR/USD’s correction will run further. This pullback in the euro is creating an attractive buying opportunity for investors with a 12- to 24-month investment horizon. Eurozone banks will continue to trade in unison with the euro. Feature The correction in the euro has further to run. The dollar currently benefits from widening real interest differentials, but a growing list of headwinds will cause a temporary setback for the global manufacturing sector, which will fuel the greenback rally further. Nonetheless, EUR/USD will stabilize between 1.15 and 1.12, after which it will begin a new major up-leg. Consequently, investors with a 12- to 24-month investment horizon should use the current softness to allocate more funds to the common currency. A Hiccup In Global Industrial Activity Global manufacturing activity is set to decelerate on a sequential basis and the Global Manufacturing PMI will soon peak. The first problem for the global manufacturing sector is the emergence of financial headwinds. The sharp rebound in growth in the second half of 2020 and the optimism created by last year’s vaccine breakthrough as well as the rising tide of US fiscal stimulus have pushed US bond yields and oil prices up sharply. These financial market moves are creating a “growth tax” that will bite soon. Mounting US interest rates have lifted global borrowing costs while the doubling in Brent prices has increased the costs of production and created a small squeeze on oil consumers. Thus, even if the dollar remains well below its March 2020 peak, our Growth Tax Indicator (which incorporates yields, oil prices and the US dollar) warns of an imminent top in the US ISM Manufacturing and the Global Manufacturing PMI (Chart 1). Already, the BCA Global Leading Economic Indicator diffusion index has dipped below the 50% line, which usually ushers in downshifts in global growth. A deceleration in China’s economy constitutes another problem for the global manufacturing cycle. Last year’s reflation-fueled rebound in Chinese economic activity was an important catalyst to the global trade and manufacturing recovery. However, according to BCA Research’s Emerging Market Strategy service, Beijing is now tightening policy, concerned by a build-up in debt and excesses in the real estate sector. Already, the PBoC’s liquidity withdrawals are resulting in a decline of commercial bank excess reserves, which foreshadows a slowing of China’s credit impulse (Chart 2). Chart 1The Global Growth Tax Will Bite
The Global Growth Tax Will Bite
The Global Growth Tax Will Bite
Chart 2Chinese Credit Will Slow
Chinese Credit Will Slow
Chinese Credit Will Slow
In addition to liquidity withdrawals, Chinese policymakers are also tightening the regulatory environment to tackle excessive debt buildups and real estate speculation. The crackdown on property developers and house purchases will cause construction activity to shrink in the second half of 2021. Meanwhile, tougher rules for both non-bank lenders and the asset management divisions of banks will further harm credit creation. BCA’s Chief EM strategist, Arthur Budaghyan, notes that consumer credit is already slowing. Chinese fiscal policy is unlikely to create a counterweight to the deteriorating credit impulse. China’s fiscal impulse will be slightly negative next year. Chinese financial markets are factoring in these headwinds, and on-shore small cap equities are trying to break down while Chinese equities are significantly underperforming global benchmarks. Chart 3Deteriorating Surprises
Deteriorating Surprises
Deteriorating Surprises
Bottom Line: The combined assault from the rising “growth tax” and China’s policy tightening is leaving its mark. Economic surprises in the US, the Eurozone, EM and China have all decelerated markedly (Chart 3), which the currency market echoes. Some of the most pro-cyclical currencies in the G-10 are suffering, with the SEK falling relative to the EUR and the NZD and AUD both experiencing varying degrees of weakness. The Euro Correction Will Run Further… Until now, the euro’s decline mostly reflects the rise in US interest rate differentials; however, the coming hiccup in the global manufacturing cycle is causing a second down leg for the euro. First, the global economic environment remains consistent with more near-term dollar upside, due to: Chart 4Commodities Are Vulnerable
Commodities Are Vulnerable
Commodities Are Vulnerable
A commodity correction that will feed the dollar’s rebound. Aggregate speculator positioning and our Composite Technical Indicator show that commodity prices are technically overextended (Chart 4). With this backdrop, the coming deceleration in Chinese economic activity is likely to catalyze a significant pullback in natural resources, which will hurt rates of returns outside the US and therefore, flatter the dollar. The dollar’s counter-cyclicality. The expected pullback in the Global Manufacturing PMI is consistent with a stronger greenback (Chart 5). The dollar’s momentum behavior. Among G-10 FX, the dollar responds most strongly to the momentum factor (Chart 6). Thus, the likelihood is high that the dollar’s recent rebound will persist, especially because our FX team’s Dollar Capitulation Index has only recovered to neutral from oversold levels and normally peaks in overbought territory. Chart 5The Greenback's Counter-Cyclicality
The Greenback's Counter-Cyclicality
The Greenback's Counter-Cyclicality
Chart 6The Dollar Is A High Momentum Currency
The Euro Dance: One Step Back, Two Steps Forward
The Euro Dance: One Step Back, Two Steps Forward
Second, the euro’s specific dynamics remain negative for now. Based on our short-term valuation model, the fair value of EUR/USD has downshifted back to 1.1, which leaves the euro 7% overvalued (Chart 7). Until now, real interest rate differentials and the steepening of the US yield curve relative to Germany’s have driven the decline in the fair value estimate. However, the deceleration in global growth also hurts the euro’s fair value because the US is less exposed than the Eurozone to the global manufacturing cycle. Chart 7The Euro's Short-Term Fair Value Is At 1.1
The Euro's Short-Term Fair Value Is At 1.1
The Euro's Short-Term Fair Value Is At 1.1
Chart 8Speculators Have Not Capitulated
Speculators Have Not Capitulated
Speculators Have Not Capitulated
The euro is also technically vulnerable, similar to commodities. Speculators are still massively net long EUR/USD and the large pool of long bets in the euro suggests that a capitulation has yet to take place (Chart 8). The euro responds very negatively to a weak Chinese economy. The Eurozone has deeper economic ties with China than the US. Exports to China account for 1.7% of the euro area’s GDP, and 2.8% of Germany’s compared to US exports to China at 0.5% of GDP. Indirect financial links are also larger. Credit to EM accounts for 45% of the Eurozone’s GDP compared to 5% for the US. Thus, the negative impact of a Chinese slowdown on EM growth has greater spillovers on European than on US ones rates of returns. A weak CNY and sagging Chinese capital markets harm the euro. The euro’s rebound from 1.064 on March 23 2020 to 1.178 did not reflect sudden inflows into European fixed-income markets. Instead, the money that previously sought higher interest rates in the US left that country for EM bonds and China’s on-shore fixed-income markets, the last major economies with attractive yields. These outflows from the US to China and EM pushed the dollar down, which arithmetically helped the euro. Thus, the recent EUR/USD correlates closely with Sino/US interest rate and with the yuan because the euro’s strength reflects the dollar demise (Chart 9). Consequently, a decelerating Chinese economy will also hurt EUR/USD via fixed-income market linkages. Finally, the euro will depreciate further if global cyclical stocks correct relative to defensive equities. Deep cyclicals (financials, consumer discretionary, energy, materials and industrials) represent 59% of the Eurozone MSCI benchmark versus 36% of the US index. Cyclical equities are exceptionally overbought and expensive relative to defensive names. They are also very levered to the global business cycle and Chinese imports. In this context, the expected deterioration in both China’s economic activity and the Global Manufacturing PMI could cause a temporary but meaningful pullback in the cyclicals-to-defensives ratio and precipitate equity outflows from Europe into the US (Chart 10). Chart 9EUR/USD And Chinese Rates
EUR/USD And Chinese Rates
EUR/USD And Chinese Rates
Chart 10EUR/USD Will Follow Cyclicals/Defensives
EUR/USD Will Follow Cyclicals/Defensives
EUR/USD Will Follow Cyclicals/Defensives
Bottom Line: A peak in the global manufacturing PMI will hurt the euro, especially because China will meaningfully contribute to this deceleration in global industrial activity. Thus, the euro’s pullback has further to run. An important resistance stands at 1.15. A failure to hold will invite a rapid decline to EUR/USD 1.12. Nonetheless, the euro’s depreciation constitutes nothing more than a temporary pullback. … But The Long-Term Bull Market Is Intact We recommend buying EUR/USD on its current dip because the underpinnings of its cyclical bull market are intact. Chart 11Investors Structurally Underweight Europe
Investors Structurally Underweight Europe
Investors Structurally Underweight Europe
First, investors are positioned for a long-term economic underperformance of the euro area relative to the US. The depressed level of portfolio inflows into Europe relative to the US indicates that investors already underweight European assets (Chart 11). This pre-existing positioning limits the negative impact on the euro of the current decrease in European growth expectations (Chart 11, bottom panel). Second, as we wrote last week, European growth is set to accelerate significantly this summer. Considering the absence of ebullient investor expectations toward the euro, this process can easily create upside economic surprises later this year, especially when compared to the US. Moreover, the deceleration in Chinese and global growth will most likely be temporary, which will limit the duration of their negative impact on Europe. Third, the US stimulus measure will create negative distortions for the US dollar. The addition of another long-term stimulus package of $2 trillion to $4 trillion to the $7 trillion already spent by Washington during the crisis implies that the US government deficit will not narrow as quickly as US private savings will decline. Therefore, the US current account deficit will widen from its current level of 3.5% of GDP. As a corollary, the US twin deficit will remain large. Meanwhile, the Fed is unlikely to increase real interest rates meaningfully in the coming two years because it believes any surge in inflation this year will be temporary. Furthermore, the FOMC aims to achieve inclusive growth (i.e. an overheated labor market). This policy combination forcefully points toward greater dollar weakness. The US policy mix looks particularly dollar bearish when compared to that of the Eurozone. To begin with, the balance of payment dynamics make the euro more resilient. The euro area benefits from the underpinning of a current account surplus of 1.9% of GDP. Moreover, the European basic balance of payments stands at 1.5% of GDP compared to a 3.6% deficit for the US. Additionally, FDI into Europe are rising relative to the US. The divergence in the FDI trends will continue due to the high probability that the Biden administration will soon increase corporate taxes. Chart 12The DEM In The 70s
The DEM In The 70s
The DEM In The 70s
The combination of faster vaccine penetration and much larger fiscal stimulus means that the US economy will overheat faster than Europe’s. Because the Fed seems willing to tolerate higher inflation readings, US CPI will rise relative to the Eurozone. In the 1970s, too-easy policy in Washington meant that the gap between US and German inflation rose. Despite the widening of interest rate and growth differentials in favor of the USD or the rise in German relative unemployment, the higher US inflation dominated currency fluctuations and the deutschemark appreciated (Chart 12). A similar scenario is afoot in the coming years, especially in light of the euro bullish relative balance of payments. Fourth, valuations constitute an additional buttress behind the long-term performance of the euro. Our FX strategy team Purchasing Power Parity model adjusts for the different composition of price indices in the US and the euro area. Based on this metric, the euro is trading at a significant 13% discount from its long-term fair value, with the latter being on an upward trend (Chart 13). Furthermore, BCA’s Behavioral Exchange Rate Model for the trade-weighted euro is also pointing up, which historically augurs well for the common currency. Lastly, even if the ECB’s broad trade-weighted index stands near an all-time high, European financial conditions remain very easy. This bifurcation suggests that the euro is not yet a major hurdle for the continent and can enjoy more upside (Chart 14). Chart 13EUR/USD Trades Well Below Long-Term Fair Value
EUR/USD Trades Well Below Long-Term Fair Value
EUR/USD Trades Well Below Long-Term Fair Value
Chart 14Easy European Financial Conditions
Easy European Financial Conditions
Easy European Financial Conditions
Chart 15Make Room For the Euro!
Make Room For the Euro!
Make Room For the Euro!
Finally, the euro will remain a beneficiary from reserve diversification away from the USD. The dollar’s status as the premier reserve currency is unchallenged. However, its share of global reserves has scope to decline while the euro’s proportion could move back to the levels enjoyed by legacy European currencies in the early 1990s (Chart 15). Large reserve holders will continue to move away from the dollar. BCA Research’s Geopolitical Strategy team argues that US tensions with China transcend the Trump presidency. Meanwhile, the current administration’s relationship with Russia and Saudi Arabia will be cold. For now, their main alternative to the dollar is the euro because of its liquidity. Moreover, the NGEU stimulus program creates an embryonic mechanism to share fiscal risk within the euro area. The Eurozone is therefore finally trying to evolve away from a monetary union bereft of a fiscal union. This process points toward a lower probability of a break up, which makes the euro more attractive to reserve managers. Bottom Line: Despite potent near-term headwinds, the euro’s long-term outlook remains bright. Global investors already underweight European assets, yet balance of payment and policy dynamics point toward a higher euro. Moreover, valuations and geopolitical developments reinforce the cyclical tailwinds behind EUR/USD. Thus, investors with a 12- to 24-month investment horizon should use the current euro correction to gain exposure to the European currencies. Any move in EUR/USD below 1.15 will generate a strong buy signal. Sector Focus: European Banks And The Istanbul Shake The recent decline in euro area bank stocks coincides with the 14% increase in USD/TRY and the 17% decline in the TUR Turkish equities ETF following the sacking of Naci Ağbal, the CBRT governor. President Erdogan is prioritizing growth over economic stability because his AKP party is polling poorly ahead of the 2023 election. The Turkish economy is already overheating, and the lack of independence of the CBRT under the leadership of Şahap Kavcıoğlu promises a substantial increase in Turkish inflation, which already stands at 16%. Hence, foreign investors will flee this market, creating further downward pressures on the lira and Turkish assets. European banks have a meaningful exposure to Turkey. Turkish assets account for 3% of Spanish bank assets or 28% of Tier-1 capital. For France, this exposure amounts to 0.7% and 5% respectively, and for the UK, it reaches 0.3% and 2%. As a comparison, claims on Turkey only represent 0.3% and 0.5% of the assets and Tier-1 capital of US banks. Unsurprisingly, fluctuations in the Turkish lira have had a significant impact one the share prices of European banks in recent years, even after controlling for EPS and domestic yield fluctuations (Table 1). Table 1TRY Is Important To European Banks…
The Euro Dance: One Step Back, Two Steps Forward
The Euro Dance: One Step Back, Two Steps Forward
Nonetheless, today’s TRY fluctuations are unlikely to have the same lasting impact on European banks share prices as they did from 2017 to 2019 because European banks have already shed significant amounts of Turkish assets (Chart 16). This does not mean that European banks are out of the woods yet. The level of European yields remains a key determinant of the profitability of Eurozone’s banks, and thus, of their share prices (Chart 17, top panel). Moreover, the euro still tightly correlates with European bank stocks as well (Chart 17, bottom panel). As a result, our view that the global manufacturing cycle will experience a temporary downshift and the consequent downside in EUR/USD both warn of further underperformance of European banks. Chart 16… But Less Than It Once Was
The Euro Dance: One Step Back, Two Steps Forward
The Euro Dance: One Step Back, Two Steps Forward
Chart 17Higher Yields And A stronger Euro, These Are Few Of My Favorite Things
Higher Yields And A stronger Euro, These Are Few Of My Favorite Things
Higher Yields And A stronger Euro, These Are Few Of My Favorite Things
These same views also suggest that this decline in bank prices is creating a buying opportunity. Ultimately, we remain cyclically bullish on the euro and the transitory nature of the manufacturing slowdown implies that global yields will resume their ascent. The cheap valuations of European banks, which trade at 0.6-times book value, make them option-like vehicles to bet on these trends, even if the banking sectors long-term prospects are murky. Moreover, they are a play on Europe’s domestic recovery this summer. We will explore banks in greater detail in future reports. Mathieu Savary, Chief European Investment Strategist Mathieu@bcaresearch.com Cyclical Recommendations Structural Recommendations Closed Trades Currency Performance
The Euro Dance: One Step Back, Two Steps Forward
The Euro Dance: One Step Back, Two Steps Forward
Fixed Income Performance Government Bonds
The Euro Dance: One Step Back, Two Steps Forward
The Euro Dance: One Step Back, Two Steps Forward
Corporate Bonds
The Euro Dance: One Step Back, Two Steps Forward
The Euro Dance: One Step Back, Two Steps Forward
Equity Performance Major Stock Indices
The Euro Dance: One Step Back, Two Steps Forward
The Euro Dance: One Step Back, Two Steps Forward
Geographic Performance
The Euro Dance: One Step Back, Two Steps Forward
The Euro Dance: One Step Back, Two Steps Forward
Sector Performance
The Euro Dance: One Step Back, Two Steps Forward
The Euro Dance: One Step Back, Two Steps Forward
Highlights Biden’s policy on China is hawkish so far, as expected, but temporary improvement is possible. We are cyclically bearish on the dollar but are taking a neutral tactical stance as the greenback’s bounce could go higher than expected if US-China relations take another downward dive. US-Iran tensions are on track to escalate in the second quarter as the pressure builds toward what we think will be a third quarter restoration of the 2015 nuclear deal. Oil price volatility is the takeaway. The anticipated US-Russia conflict has emerged and will bring negative surprises, especially for Russian and emerging European markets. Europe still enjoys relative political stability. A German election upset would bring upside risk to the euro and bund yields, while Scottish independence risk is contained for now. In this report we are launching the first in a new series of regular quarterly outlook reports that will supplement our annual Geopolitical Strategy strategic outlook. Feature The decline in global policy uncertainty and geopolitical risk that attended the US election and COVID-19 vaccine discovery has largely played out. Global investors have witnessed successful vaccine rollouts in the US and UK and can look forward to other countries, namely the EU-27, catching up. They have witnessed a splurge of US fiscal spending – $2.8 trillion since December – unprecedented in peacetime. And they have seen the Chinese government offer assurances that monetary tightening will not undermine the economic recovery. The risk of the US doubling down on belligerent trade protectionism has fallen by the wayside along with the Trump presidency. Going forward, there are signs that policy uncertainty and geopolitical risk will revive. First, as the global semiconductor shortage and Suez Canal blockage highlight, the world economy will sputter and strain at the sudden eruption of economic activity as the pandemic subsides and vast government spending takes effect. Financial instability is a likely consequence of the sudden, simultaneous adoption of debt monetization across a range of economies combined with a global high-tech race and energy overhaul. Second, the defeat of the Trump presidency does not reverse the secular increase in geopolitical tensions arising from America’s internal divisions and weakening hand relative to China, Russia, and others. On the contrary, large monetary and fiscal stimulus lowers the economic costs of conflict and encourages autarkic, self-sufficiency policies that make governments more likely to struggle with each other to secure their supply chains. Chart 1AThe Return Of Geopolitical Risk
The Return Of Geopolitical Risk
The Return Of Geopolitical Risk
Chart 1BThe Return Of Geopolitical Risk
The Return Of Geopolitical Risk
The Return Of Geopolitical Risk
If we look at simple, crude measures of geopolitical risk we can see the market awakening to the new wall of worry for this business cycle – Great Power struggle, the persistence of “America First” with a different figurehead, China policy tightening, and a vacuum of European leadership. The US dollar is rising, developed market equities are outperforming emerging markets, safe-haven currencies are ticking up against commodity currencies, and gold is perking back up (Charts 1A & 1B). The cyclical upswing should reverse most of these trends over the medium term but investors should be cautious in the short term. US Stimulus, Chinese Tightening, And The Greenback The US remains the world’s preponderant power despite its political dysfunction and economic decline relative to emerging markets. The US has struggled to formulate a coherent way to deal with declining influence, as shown by dramatic policy reversals toward Iraq, Iran, China, and Russia. The pattern of unpredictability will continue. The Biden administration’s longevity is unknown so foreign states will be cautious of making firm commitments, implementing deals, or taking irrevocable actions. This does not mean the Biden administration will have a small impact – far from it. Biden’s national policy seeks to fire up the American economy, refurbish alliances, export liberal democratic ideology, and compete with China and Russia. The firing up is largely already accomplished – the American Rescue Plan Act (ARPA) and Biden’s forthcoming “Build Back Better” proposals will ultimately rank with Johnson’s Great Society. The Fed estimates that US GDP growth will hit 6.5% this year, higher than the consensus of economic forecasts estimates 5.5%, driven by giant government pump-priming (Chart 2). The US, which is already an insulated economy, is virtually inured to foreign shocks for the time being. Chart 2US Injects Steroids
Second Quarter Outlook 2021: Geopolitics Upsets The "Return To Normalcy"
Second Quarter Outlook 2021: Geopolitics Upsets The "Return To Normalcy"
Next comes the courting of allies to form a united democratic front against the world’s ambitious dictatorships. This process will be very difficult as the allies are averse to taking risks, especially on behalf of an erratic America. Chart 3US Stimulus Briefly Halts Decline In Global Economic Share
Second Quarter Outlook 2021: Geopolitics Upsets The "Return To Normalcy"
Second Quarter Outlook 2021: Geopolitics Upsets The "Return To Normalcy"
The Obama administration spent six full years creating a coalition to pressure an economically miniscule Iran into signing the 2015 nuclear deal. Imagine how long it will take Biden to convince the EU-27 and small Asian states to stick their necks out against Xi Jinping’s China. Especially if they suspect that the US’s purpose is to force China to open its doors primarily for the Americans. If the US grows at the rate of consensus forecasts then its share of global GDP will be 17.6% by 2025 (Chart 3). However, the US’s decline should not be exaggerated. Consider the lesson of the past year, in which the US seemed to flounder in the face of the pandemic. The US’s death count, on a population basis, was in line with other developed markets and yet its citizens exercised a greater degree of individual freedom. It maintained the rule of law despite extreme polarization, social unrest, and a controversial election. Its development of mRNA vaccines highlighted its ongoing innovation edge. And it has rolled out the vaccines rapidly. Internal divisions are still extreme and likely to produce social instability (we are still in the zone of “peak polarization”). But the US economic foundation is now fundamentally supported – political collapse is improbable. Chart 4US Vs China: The Stimulus Impulse
US Vs China: The Stimulus Impulse
US Vs China: The Stimulus Impulse
In short, the US saw the “Civil War Lite” and has moved onto “Reconstruction Lite,” with a big expansion of the social safety net and infrastructure as well as taxes already being drafted. Meanwhile General Secretary Xi has managed to steer China into a good position for the much-ballyhooed 100th anniversary of the Communist Party on July 1. His administration is tightening monetary and fiscal policy marginally to resume the fight against systemic financial risk. China faces vast socioeconomic imbalances that, if left unattended, could eventually overturn the Communist Party’s rule. So far the tightening of policy is modest but the risk of a policy mistake is non-negligible and something global financial markets will have to grapple with in the second quarter. Comparing the US and China reveals an impending divergence in relative monetary and fiscal stimulus (Chart 4). China’s money and credit impulse is peaking – some signs of economic deceleration are popping up – even as the US lets loose a deluge of liquidity and pump-priming. The result is that the world is likely to experience waning Chinese demand and waxing US demand in the second half of the year. It is almost the mirror image of 2009-10, when China’s economy skyrocketed on a stimulus splurge while the US recovered more slowly with less policy support. The medium-to-long-run implication is that the US will have a bumpy downhill ride over the coming decade whereas China will recover more smoothly. Yet the analogy only goes so far. The structural transition facing China’s society and economy is severe and US-led international pressure on its economy will make it more severe. The short-run implication – for Q2 2021 – is that the US dollar’s bounce could run longer than consensus expects. Commodity prices, commodity currencies, and emerging market assets face a correction from very toppy levels. The global cyclical upswing will continue as long as China avoids a policy mistake of overtightening as we expect but the near-term is fraught with downside risk. Bottom Line: We are neutral on the dollar from a tactical point of view. While our bias is to expect the dollar to relapse, in line with the BCA House View and our Foreign Exchange Strategy, we are loathe to bet against the greenback given US stimulus and Chinese tightening. This is not to mention geopolitical tensions highlighted below that would reinforce the dollar. Biden’s China Policy And The Semiconductor Shortage Any spike in US-China strategic tensions in Q2 would exacerbate the above reasoning on the dollar. It would also lead to a deeper selloff in Chinese and EM Asian currencies and risk assets. A spike in tensions is not guaranteed but investors should plan for the worst. One of our core views for many years has been that any Democratic administration taking office in 2020 would remain hawkish on China, albeit less so than the Trump administration. So far this view is holding up. It may not have been the cause of the drop in Chinese and emerging Asian equities but it has not helped. However, the jury is still out on Biden’s China policy and the second quarter will likely see major actions that crystallize the relative hawkish or dovish change in policy. The acrimonious US-China meeting in Alaska meeting does not necessarily mean anything. The Biden administration has a full China policy review underway that will not be completed until around early June. The first bilateral summit between Biden and Xi could occur on Earth Day, April 22, or sometime thereafter, as the countries are looking to restart strategic dialogue and engage on nuclear non-proliferation and carbon emission reductions. Specifically China wants to swap its help on North Korea – which restarted ballistic missile launches as we go to press – for easier US policies on trade and tech. Only if and when a new attempt at engagement breaks down will the Biden administration conclude that it has a basis for pursuing a more offensive policy toward China. The problem is that new engagement probably will break down, sooner or later, for reasons we outlined last week: the areas of cooperation are limited – obviously so on health and cybersecurity, but even on climate change. Engagement on Iran and North Korea may have more success but the bigger conflicts over tech and Taiwan will persist. Ultimately China is fixated on strategic self-sufficiency and rapid tech acquisition in the national interest, leaving little room for US market access or removal of high-tech export controls. The threat that Biden will ultimately adopt and expand on Trump’s punitive measures will hang over Beijing’s head. The risk of a Republican victory in 2024 will also discourage China from implementing any deep structural concessions. The crux of the conflict remains the tech sector and specifically semiconductors.1 China is rapidly gaining market share but the US is using its immense leverage over chip design and equipment to cut off China’s access to chips and industry development. The ongoing threat of an American chip blockade is now being exacerbated by a global shortage of semiconductors as the economy recovers (Chart 5), exposing China’s long-term economic vulnerability. Chart 5Global Semiconductor Shortage
Global Semiconductor Shortage
Global Semiconductor Shortage
There is room for some de-escalation but not much – and it is not to be counted on. The Biden administration, like the Obama administration, subscribes to the view that the US should prioritize maintaining its lead in tech innovation rather than trying to compete with China’s high-subsidy model, which is gobbling up the lower end of the computer chip market. Biden’s policy will at first be defensive rather than offensive – focused on improving US supply chain security rather than curtailing Chinese supply. Biden’s proposal for domestic infrastructure program will include funds for the semiconductor industry and research. While the Biden administration likely prizes leadership and innovation over the on-shoring of US chip production, the US government must also look to supply security, specifically for the military, so some on-shoring of production is inevitable.2 Ultimately the Biden administration can continue using export controls to slow China’s semiconductor development or it can pare these controls back. If it does nothing then China’s state-backed tech program will lead to a rapid increase in Chinese capabilities and market share as has occurred in other industries. If it maintains restrictions then it will delay China’s development, especially on the highest end of chips, but not prevent China from gaining the technology through circumventing export controls, subsidizing its domestic industry, and poaching from Taiwan and South Korea. Given that technological supremacy will lead to military supremacy the US is likely to maintain restrictions. But a full chip blockade on China would require expanding controls and enforcing them on third parties, and massively increases strategic tensions, should Biden ever decide to go this ultra-hawkish route. The Biden administration can adjust the pace and intensity of export controls but cannot give China free rein. Biden will want to block China’s access to the US market, or funds, or parts when these feed its military-industrial complex but relax pressure on China’s commercial trade. This is only a temporary fix. The commercial/military distinction is hard to draw when Beijing continually pursues “civil-military fusion” to maximize its industrial and strategic capabilities. Therefore US-China strategic tensions over tech will worsen over the long run even if Biden pursues engagement in the short run. Bottom Line: Biden’s China policy has started out hawkish as expected but the real policy remains unknown. The second quarter will reveal key details. Biden could pursue engagement, leading to a reduction in tensions. Investors should wait and see rather than bet on de-escalation, given that tensions will escalate anew over the medium and long term and therefore may never really decline. Iran And Oil Price Volatility Biden’s other foreign policy challenges in the second quarter hinge on Iran and Russia. The Biden administration aims to restore the 2015 Iranian nuclear deal and is likely to move quickly. This is not merely a matter of intention but of national capability since US grand strategy is pushing the US to shift focus to Asia Pacific, and an Iranian nuclear crisis divides US attention and resources. Biden has the ability to return to the 2015 deal with a flick of his wrist. The Iranians also have that ability, at least until lame duck President Hassan Rouhani leaves office in August – beyond that, a much longer negotiation would be necessary. US-Iran talks will lead to demonstrations of credible military threats, which means that geopolitical attacks and tensions in the Middle East will likely go higher before they fall on any deal. The past several years have already seen a series of displays of military force by the Iranians and the US and its allies and this process may escalate all summer (Map 1). Map 1Military Incidents In Persian Gulf Since Abqaiq Refinery Attack, 2019
Second Quarter Outlook 2021: Geopolitics Upsets The "Return To Normalcy"
Second Quarter Outlook 2021: Geopolitics Upsets The "Return To Normalcy"
It is too soon to draw conclusions regarding the Israeli election on March 23 but it is possible that Prime Minister Benjamin Netanyahu will remain in power (Chart 6). If this is the case then Israel will oppose the American effort to rejoin the Iranian nuclear deal, culminating in a crisis sometime in the summer (or fall) in which the Israelis make a major show of force against Iran. Even if Netanyahu falls from power, the new Israeli government will still have to show Iran that it cannot be pushed around. Fundamentally, however, a change in leadership in Israel would bring the US and Israel into alignment and thus smooth the process for a deal that seeks to contain Iran’s nuclear program at least through 2025. Any better deal would require an entirely new diplomatic effort. Chart 6Israeli Ruling Coalition Share Of Knesset Shares In Recent Elections
Second Quarter Outlook 2021: Geopolitics Upsets The "Return To Normalcy"
Second Quarter Outlook 2021: Geopolitics Upsets The "Return To Normalcy"
The Russians or Saudi Arabians might reduce their oil production discipline once a deal becomes inevitable, so as not to lose market share to Iranian oil that will come back onto global markets. Thus oil markets could face unexpected oil supply outages due to conflict followed by OPEC or Iranian supply increases, implying that prices will be volatile. Our Commodity & Energy Strategy expects prices to average $65/barrel in 2021, $70/barrel in 2022, and $60-$80/barrel through 2025. Bottom Line: Oil prices will be volatile in the second quarter as they may be affected by the twists and turns of US-Iran negotiations, which may not reach a new equilibrium until July or August at earliest. Otherwise a multi-year diplomatic process will be required, which will suck away the Biden administration’s foreign policy capital, resulting either in precipitous reduction in Middle East focus or a neglect of greater long-term challenges from China and Russia. Russian Risks, Germany Elections, And Scottish Independence European politics are more stable than elsewhere in the world – marked by Italy’s sudden formation of a technocratic unity government under Prime Minister Mario Draghi. Draghi is focused on using EU recovery funds to boost Italian productivity and growth. Europe’s economic growth has underperformed that of the US so far this year. The EU is not witnessing the same degree of fiscal stimulus as the US (Chart 7). The core member states all face a fiscal drag in the coming two years and meanwhile the bloc has struggled to roll out COVID-19 vaccines efficiently. However, the vaccines are proven to be effective and will eventually be rolled out, so investors should buy into the discount in the euro and European stocks as a result of the various mishaps. Global and European industrial production and economic sentiment are bouncing back and German yields are rising albeit not as rapidly as American (Chart 8). Chart 7EU Stimulus Lags But Targets Productivity
Second Quarter Outlook 2021: Geopolitics Upsets The "Return To Normalcy"
Second Quarter Outlook 2021: Geopolitics Upsets The "Return To Normalcy"
Chart 8Global And Euro Area Production To Accelerate
Global And Euro Area Production To Accelerate
Global And Euro Area Production To Accelerate
Chart 9German Conservatives Waver in Polls
German Conservatives Waver in Polls
German Conservatives Waver in Polls
The main exceptions to Europe’s relative political stability come from Germany and Scotland. German Chancellor Angela Merkel is a lame duck and her party is falling in opinion polls with only six months to go before the general election on September 26 (Chart 9). Merkel even faced the threat of a no-confidence motion in the Bundestag this week due to her attempt to extend COVID lockdowns over Easter and sudden retreat in the face of a public backlash. Merkel apologized but her party is looking extremely shaky after recent election losses on the state level. The rise of a new left-wing German governing coalition is much more likely than the market expects. The second quarter will see the selection of a chancellor-candidate for her Christian Democratic Union and its Bavarian sister party the Christian Social Union. Table 1 highlights the likeliest chancellor-candidates of all the parties and their policy stances, from the point of view of whether they have a “hawkish,” hard-line policy stance or “dovish,” easy policy stance on the major issues. What stands out is that the entire German political spectrum is now effectively centrist or dovish on monetary and fiscal policy following the lessons of the 13 years since the global financial crisis. Table 1German Chancellor Candidates, 2021
Second Quarter Outlook 2021: Geopolitics Upsets The "Return To Normalcy"
Second Quarter Outlook 2021: Geopolitics Upsets The "Return To Normalcy"
In other words, while Germany’s conservatives will seek an earlier normalization of policy in the wake of the crisis, none of them are as hawkish as in the past, and an election upset would bring even more dovish leaders into power. Thus the German election is a political risk but not a global market risk. It should not fundamentally alter the trajectory of German equities or bond yields – which is up amid global and European recovery – and if anything it would boost the euro. The potential German chancellor candidates show more variation when it comes to immigration, the environment, and foreign policy. Germany has been leading the charge for renewable energy and will continue on that trajectory (Chart 10). However it has simultaneously pursued the NordStream II natural gas pipeline with Russia, which would bring 55 billion cubic meters of natural gas straight into Germany, bypassing eastern Europe and its fraught geopolitics. This pipeline, which could be completed as early as August, would improve Germany’s energy security and Russia’s economic security, which remain closely intertwined despite animosity in other areas (Chart 11). But the pipeline would come at the expense of eastern Europe’s leverage – and American interests – and therefore opposition is rising, including among the ascendant German Green Party. Chart 10Germany’s Switch To Renewables
Second Quarter Outlook 2021: Geopolitics Upsets The "Return To Normalcy"
Second Quarter Outlook 2021: Geopolitics Upsets The "Return To Normalcy"
Chart 11Germany Puts Multilateralism To The Test
Second Quarter Outlook 2021: Geopolitics Upsets The "Return To Normalcy"
Second Quarter Outlook 2021: Geopolitics Upsets The "Return To Normalcy"
Chart 12UK-EU Trade Deal Dampens Scots Nationalism
UK-EU Trade Deal Dampens Scots Nationalism
UK-EU Trade Deal Dampens Scots Nationalism
While Merkel and the Christian Democrats are dead-set on completing the pipeline, global investors are underrating the possibility of a major incident in which the US uses diplomacy and sanctions to halt the project. This is not intuitive because Biden is focused on restoring the US alliance with Europe, particularly Germany. But he is doing so in order to counter Russian and Chinese authoritarianism. Therefore the pipeline could mark the first real test of Biden’s – and Germany’s – understanding of multilateralism. Importantly the US is not pursuing a diplomatic “reset” with Russia at the outset of Biden’s term. This has now been confirmed with Biden’s accusation that Russian President Vladimir Putin is a “killer” and the ensuing, highly symbolic Russian withdrawal of its ambassador to the United States, unseen even in the Cold War. The Americans are imposing sanctions in retaliation for Russia’s alleged interference in the 2016 and 2020 elections. Russia is largely inured to US sanctions at this point but if the US wanted to make a difference it would insist on a stop to NordStream by cutting off access to the US market to the various European engineering and insurance companies critical to construction.3 Yet German leaders would have to be cajoled and it may be more realistic for the US to demand other concessions from Germany, particularly on countering China. The US-German arrangement will go a long way toward defining Germany’s and the EU’s risk appetite in the context of Biden’s proposal to build a more robust democratic alliance to counter revisionist authoritarian states. The Russians say they want to avoid a permanent deterioration in relations with the US, which they warn is on the verge of occurring. There is some space for engagement, such as on restoring the Iran deal, which Russia ostensibly supports. Biden may want to keep Russia pacified until he has an Iranian deal in hand. Ultimately, however, US-Russian relations are headed to new lows as the Biden administration brings counter-pressure on the Russians in retribution for the past decade of actions to undermine the United States. Germany’s place in this conflict will determine its own level of geopolitical risk. Clearly we would favor German assets over those of emerging Europe or Russian in this environment. One final risk from Europe is worth mentioning for the second quarter: the UK and Scotland. Scottish elections on May 6 could enable the Scottish National Party to push for a second independence referendum. So far our assessment is correct that Scottish independence will lose momentum after Prime Minister Boris Johnson’s post-Brexit trade deal with the European Union. Scottish nationalists are falling (Chart 12) and support for independence has dropped back toward the 45% level where the 2014 referendum ended up. Nevertheless elections can bring surprises and this narrative bears vigilance as a threat to the pound’s sharp rebound. Bottom Line: Europe’s relative political stability is challenged by US-Russia geopolitical tensions, the higher-than-expected risk of a German election upset, and the tail risk of Scottish independence. Of these only a US-Russia blowup, over NordStream or other issues, poses a major downside risk to global investors. We continue to underweight EM Europe and Russian currency and financial assets. Investment Takeaways Our three key views for 2021, in addition to coordinated monetary and fiscal stimulus, are largely on track for the year so far: China’s Headwinds: China’s renminbi and stock market are indeed suffering due to policy tightening and US geopolitical pressure. Risk to our view: if Biden and Xi make major compromises to reengage, and Xi eases monetary and fiscal policy anew, then the global reflation trade and Chinese equities will receive another boost. US-Iran Triggered Oil Volatility: The US and Iran are still in stalemate and the window of opportunity for a quick restoration of the 2015 deal is rapidly narrowing. Tensions are indeed escalating prior to any resolution, which would come in the third quarter, thus producing first upside then downside pressures for oil prices. Risk to our view: the Biden administration has no need for a new Iran deal and tensions escalate in a major way that causes a major risk premium in oil prices and forces the US to downgrade its pressure campaign against China. Europe’s Outperformance: So far this year the dollar has rallied and the EU has botched its vaccine rollout, challenging our optimistic assessment of Europe. But as highlighted in this report, we anticipated the main risks – government change in Germany, a Scots referendum – and the former is positive for the euro while the downside risk to the pound is contained. The major geopolitical problem is Russia, where we always expected substantial market-negative risks to materialize after Biden’s election. Risk to our view: A US-Russian reset that lowers geopolitical tensions across eastern Europe or a German status quo election followed by a tightening of fiscal policy sooner than the market expects. Matt Gertken Vice President Geopolitical Strategy mattg@bcaresearch.com Footnotes 1 For an excellent recent review of the issues see Danny Crichton, Chris Miller, and Jordan Schneider, "Labs Over Fabs: How The U.S. Should Invest In The Future Of Semiconductors," Foreign Policy Research Institute, March 2021, issuu.com. 2 Alex Fang, "US Congress pushes $100bn research blitz to outcompete China," Nikkei Asia, March 23, 2021, asia.nikkei.com. In anticipation of the Biden administration’s dual attempt to promote, on one hand, innovation, and on the other hand, semiconductor supply security, the US semiconductor giant Intel has announced that it will build a $20 billion chip fabrication plant in Arizona. This is in addition to TSMC’s plans to build a plant in Arizona manufacturing chips that are necessary for the US Air Force’s F-35 jets. See Kif Leswing, "Intel is spending $20 billion to build two new chip plants in Arizona," CNBC, March 23, 2021, cnbc.com. 3 See Margarita Assenova, "Clouds Darkening Over Nord Stream Two Pipeline," Eurasia Daily Monitor 18:17 (2021), Jamestown Foundation, February 1, 2021, Jamestown.org. Appendix: GeoRisk Indicator China
China: GeoRisk Indicator
China: GeoRisk Indicator
Russia
Russia: GeoRisk Indicator
Russia: GeoRisk Indicator
UK
UK: GeoRisk Indicator
UK: GeoRisk Indicator
Germany
Germany: GeoRisk Indicator
Germany: GeoRisk Indicator
France
France: GeoRisk Indicator
France: GeoRisk Indicator
Italy
Italy: GeoRisk Indicator
Italy: GeoRisk Indicator
Canada
Canada: GeoRisk Indicator
Canada: GeoRisk Indicator
Spain
Spain: GeoRisk Indicator
Spain: GeoRisk Indicator
Taiwan
Taiwan: GeoRisk Indicator
Taiwan: GeoRisk Indicator
Korea
Korea: GeoRisk Indicator
Korea: GeoRisk Indicator
Turkey
Turkey: GeoRisk Indicator
Turkey: GeoRisk Indicator
Brazil
Brazil: GeoRisk Indicator
Brazil: GeoRisk Indicator
Section III: Geopolitical Calendar
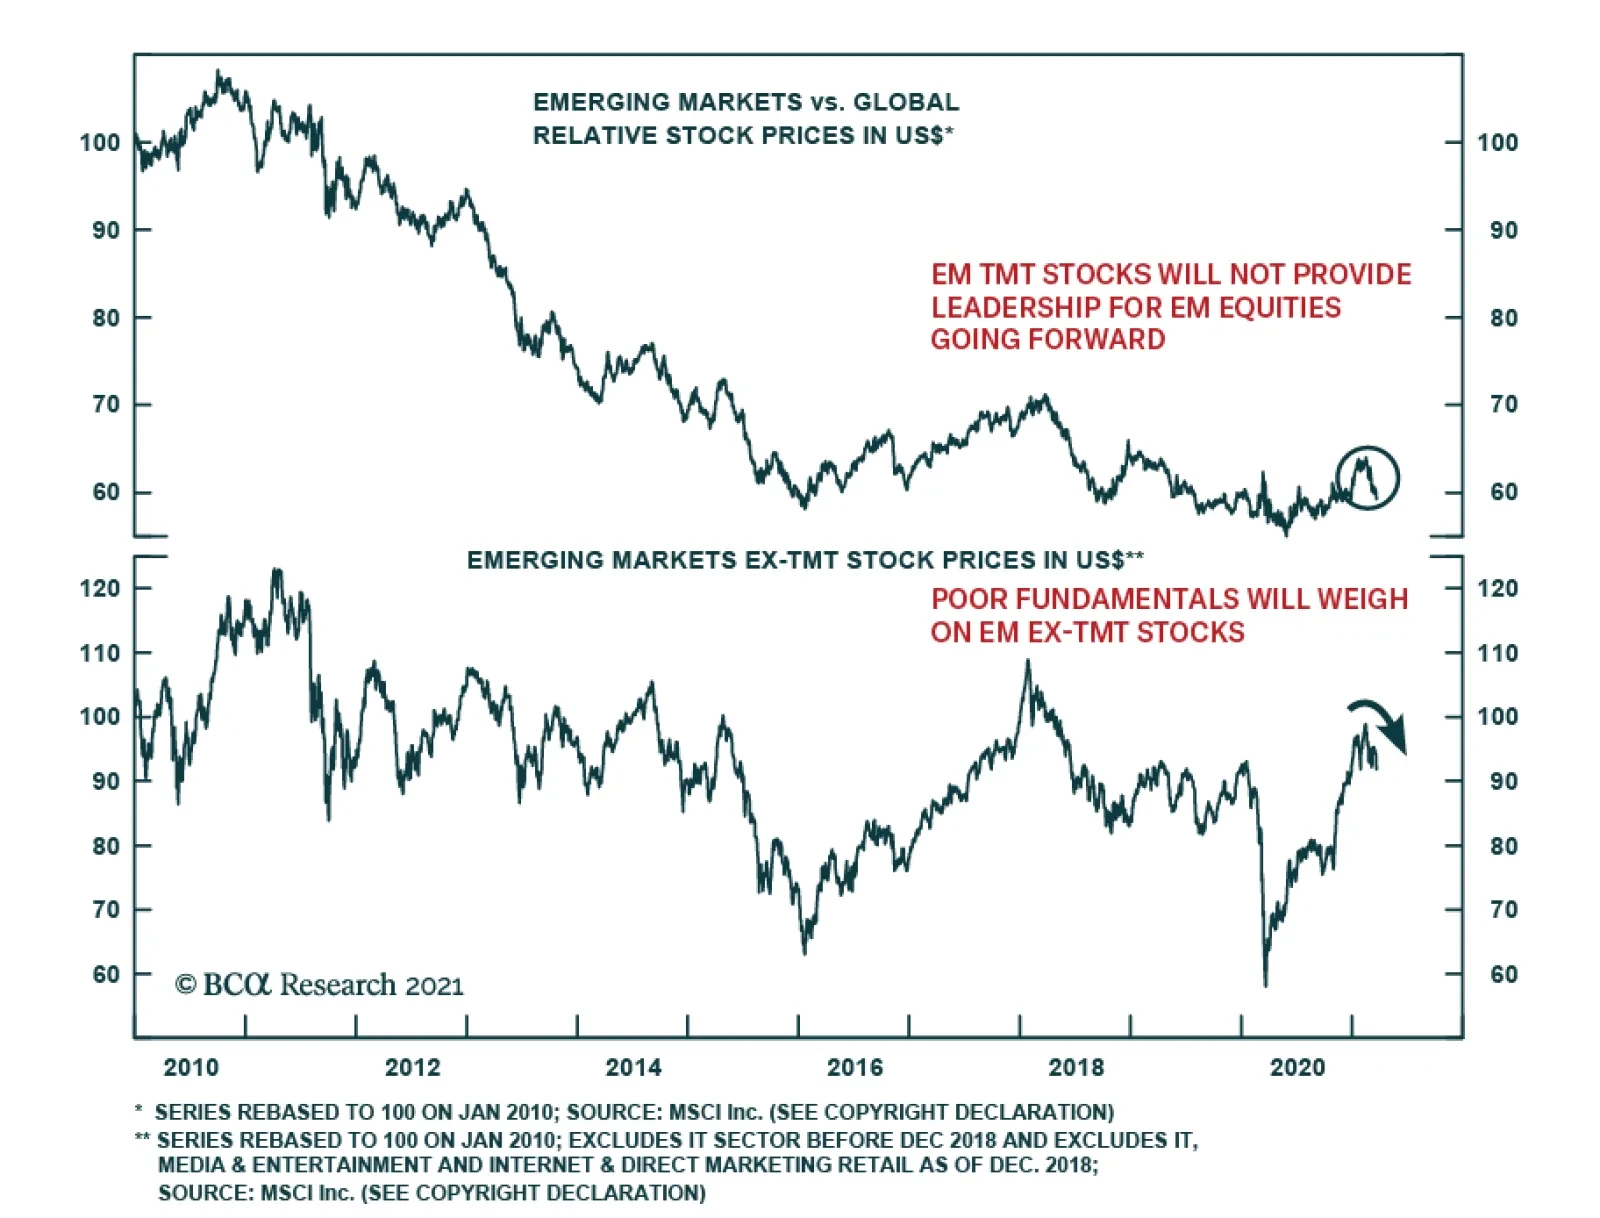
Our Emerging Markets Strategists recently argued that the outlook for EM shares prices remains unfavorable over the coming months. The breadth of EM equity outperformance versus DM in H2 last year was narrow. This outperformance was largely driven by EM…
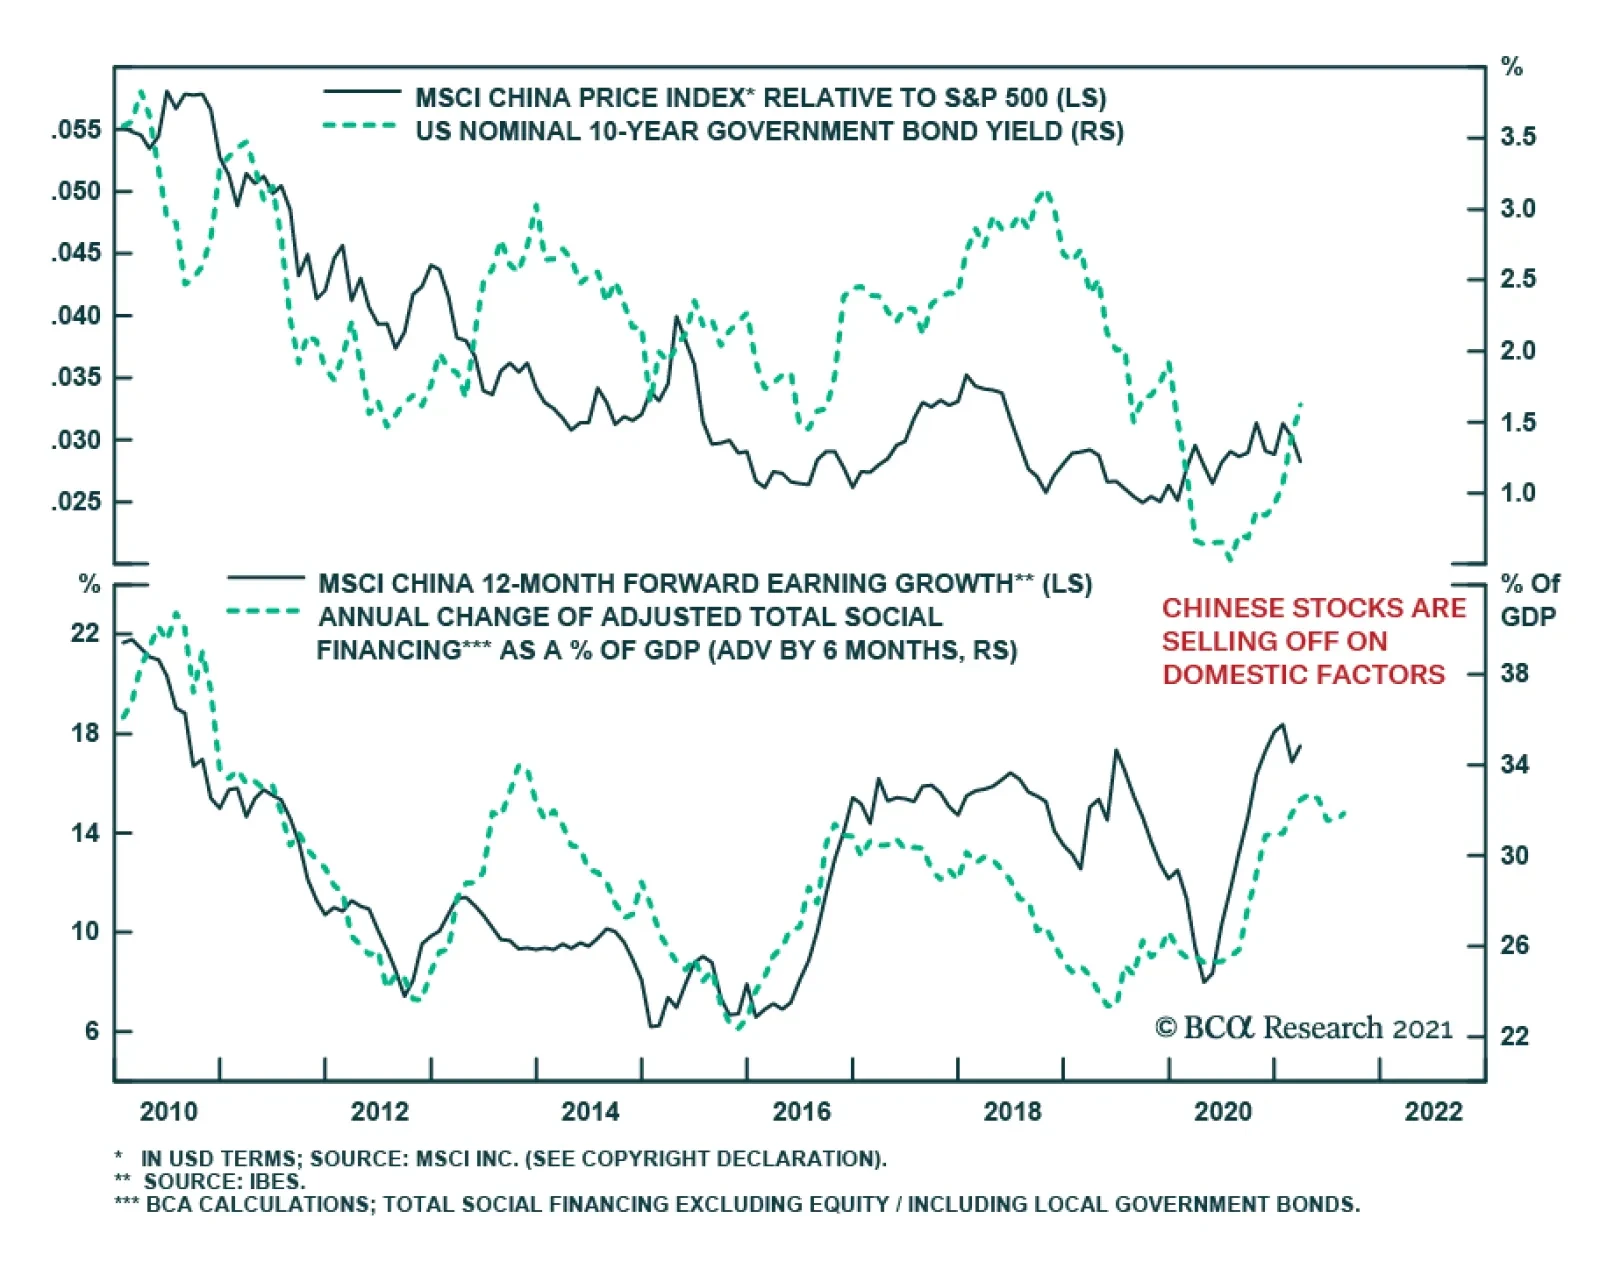
Chinese stocks peaked in mid-February, with the selloff extending well through March. Market participants fear that escalating US Treasury yields will have a sustained negative impact on Chinese risk assets. And while BCA Research’s China Investment Strategy…