Emerging Markets

Highlights The Biden administration’s early actions suggest it will be hawkish on China as expected – and the giant Microsoft hack merely confirms the difficulty of reducing strategic tensions. US-China talks are set to resume and piecemeal engagement is possible. However, most of the areas of engagement touted in the media are overrated. Competition will prevail over cooperation. Cybersecurity stocks have corrected, creating an entry point for investors seeking exposure to a secular theme of Great Power conflict in the cyber realm and beyond. Global defense stocks are even more attractive than cyberstocks as a “back to work” trade in the geopolitical context. Continue to build up safe-haven hedges as geopolitical risk remains structurally elevated and underrated by financial markets. Feature The Biden administration passed its first major law, the $1.9 trillion American Rescue Plan, on March 10. This gargantuan infusion of fiscal stimulus accounts for about 2% of global GDP and 9% of US GDP, a tailwind for risky assets when taken with a receding pandemic and normalizing global economy. The US dollar has perked up so far this year on the back of this extraordinary pump-priming and the rapid rollout of COVID-19 vaccines, which have lifted relative growth expectations with the rest of the world. Hence the dollar is rising for fundamentally positive reasons that will benefit global growth rather than choke it off. Our Foreign Exchange Strategist Chester Ntonifor argues that the dollar has 2-3% of additional upside before relapsing under the weight of rising global growth, inflation expectations, commodity prices, and relative equity flows into international markets. We agree with the dollar bear market thesis. But there are two geopolitical risks that investors must monitor: Cyclically, China’s combined monetary and fiscal stimulus is peaking, growth will decelerate, and the central government runs a non-negligible risk of overtightening policy. However, China’s National People’s Congress so far confirms our view that Beijing will not overtighten. Structurally, the US-China cold war is continuing apace under President Biden, as expected. The two sides are engaging in normal diplomacy as appropriate to a new US administration but the Microsoft Exchange hack (see below) underscores the trend of confrontation over cooperation. Chart 1Long JPY / Short KRW As Geopolitical Risk Is Underrated
Long JPY / Short KRW As Geopolitical Risk Is Underrated
Long JPY / Short KRW As Geopolitical Risk Is Underrated
The second point reinforces the first since persistent US pressure on China will discourage it from excessive deleveraging at home. In a world where China is struggling to cap excessive leverage, the US is pursuing “extreme competition” with China (Biden’s words), and yet the US rule of law is intact, global investors will not abandon the US dollar in a general panic and loss of confidence. They will, however, continue to diversify away from the dollar on a cyclical basis given that global growth will accelerate while US policy will remain extremely accommodative. Reinforcing the point, geopolitical frictions are rising even outside the US-China conflict. A temporary drop in risk occurred in the New Year as a result of the rollout of vaccines, the defeat of President Trump, and the resolution of Brexit. But going forward, geopolitical risk will reaccelerate, with various implications that we highlight in this report. While we would not call an early end to the dollar bounce, we will keep in place our tactical long JPY-USD and long CHF-USD hedges. These currencies offer a good hedge in the context of a dollar bear market and structurally high geopolitical risk. If the dollar weakens anew on good news for global growth then the yen and franc will benefit on a relative basis as they are cheap, whereas if geopolitical risk explodes they will benefit as safe havens. We also recommend going long the Japanese yen relative to the South Korean won given the disparity in valuations highlighted by our Emerging Markets team, and the fact that geopolitical tensions center on the US and China (Chart 1). “Our Most Serious Competitor, China” Why are we so sure that geopolitical risk will remain structurally elevated and deliver negative surprises to ebullient equity markets? Our Geopolitical Power Index shows that China’s rise and Russia’s resurgence are disruptive to the US-led global order (Chart 2). If anything this process has accelerated over the COVID-19 crisis. China and Russia have authoritarian control over their societies and are implementing mercantilist and autarkic economic policies. They are carving out spheres of influence in their regions and using asymmetric warfare against the US and its allies. They have also created a de facto alliance in their shared interest in undermining the unity of the West. The US is meanwhile attempting to build an alliance of democracies against them, heightening their insecurities about America’s power and unpredictability (Chart 3). Chart 2Great Power Struggle Continues
Great Power Struggle Continues
Great Power Struggle Continues
Massive fiscal and monetary stimulus is positive for economic growth and corporate earnings but it reduces the barriers to geopolitical conflict. Nations can pursue foreign and trade policies in their self-interest with less concern about the blowback from rivals if they are fueled up with artificially stimulated domestic demand. Chart 3Biden: ‘Our Most Serious Competitor, China’
More Reasons To Buy Cybersecurity And Defense Stocks
More Reasons To Buy Cybersecurity And Defense Stocks
Total trade between the US and China, at 3.2% and 4.7% of GDP respectively in 2018, was not enough to prevent trade war from erupting. Today the cost of trade frictions is even lower. The US has passed 25.4% of GDP in fiscal stimulus so far since January 1, 2020. China’s total fiscal-and-credit impulse has risen by 8.4% of GDP over the same time period. The Biden administration is co-opting Trump’s hawkish foreign and trade policy toward China, judging by its initial statements and actions (Appendix Table 1). Specifically, Biden has issued an executive order on securing domestic supply chains that demonstrates his commitment to the Trumpian goal of diversifying away from China and on-shoring production, or at least offshoring to allied nations. The Democratic Party is also unveiling bipartisan legislation in Congress that attempts to reduce reliance on China.1 These executive decrees are partly spurred on by the global shortage of semiconductors. China, the US, and the US’s allies are all attempting to build alternative semiconductor supply chains that bypass Taiwan, a critical bottleneck in the production of the most advanced computer chips. The Taiwanese say they will coordinate with “like-minded economies” to alleviate shortages, by which they mean fellow democracies. But this exposes Taiwan to greater geopolitical risk insofar as it excludes mainland China from supplies, either due to rationing or American export controls. The surge in semiconductor sales and share prices of semi companies (especially materials and equipment makers) will continue as countries will need a constant supply of ever more advanced chips to feed into the new innovation and technology race, the renewable energy race, and the buildout of 5G networks and beyond (Chart 4). It takes huge investments of time and capital to build alternative fabrication plants and supply lines yet governments are only beginning to put their muscle into it via stimulus packages and industrial policy. Chart 4Semiconductor Supply Shortage
Semiconductor Supply Shortage
Semiconductor Supply Shortage
Supply shocks have geopolitical consequences. The oil shocks of the 1970s and early 1990s motivated the US to escalate its interventions and involvement in the Middle East. They also motivated the US to invest in stockpiles of critical goods and alternative sources of production so as to reduce dependency (Chart 5). Although semiconductors are not fungible like commodities, and the US has tremendous advantages in semiconductor design and production, nevertheless the bottleneck in Taiwan will take years to alleviate. Hence the US will become more active in supply security at home and more active in alliance-building in Asia Pacific to deter China from taking Taiwan by force or denying regional access to the US and its allies. China faces the same bottleneck, which threatens its technological advance, economic productivity, and ultimately its political stability and international defense. Chart 5ASupply Shortages Motivate Strategic Investments
Supply Shortages Motivate Strategic Investments
Supply Shortages Motivate Strategic Investments
Chart 5BSupply Shortages Motivate Strategic Investments
Supply Shortages Motivate Strategic Investments
Supply Shortages Motivate Strategic Investments
Semiconductor and semi equipment stock prices have gone vertical as highlighted above but one way to envision the surge in global growth and capex for chip makers is to compare these stocks relative to the shares of Big Tech companies in the communication service sector, i.e. those involved in social networking and entertainment, such as Twitter, Facebook, and Netflix. On a relative basis the semi stocks can outperform these interactive media firms which face a combination of negative shocks from rising interest rates, regulation, economic normalization, and ideologically fueled competition (Chart 6). Chart 6Long Chips Versus Big Tech
Long Chips Versus Big Tech
Long Chips Versus Big Tech
What about the potential for the US and China to enhance cooperation in areas of shared interest? Generally the opportunity for re-engagement is overrated. The Biden administration says there will be engagement where possible. The first high-level talks will occur in Alaska on March 18-19 between Secretary of State Antony Blinken, National Security Adviser Jake Sullivan, Central Foreign Affairs Commissioner Yang Jiechi, and Foreign Minister Wang Yi. Presidents Biden and Xi Jinping may hold a bilateral summit sometime soon and the old strategic and economic dialogue may resume, enabling cabinet-level officials to explore a range of areas for cooperation independently of high-stakes strategic negotiations. However, a close look at the policy areas targeted for engagement reveals important limitations: Health: There is little room for concrete cooperation on the COVID-19 pandemic given that the pandemic is already receding, the Chinese have not satisfied American demands for data transparency, Chinese officials have fanned theories that the virus originated in the US, and the US is taking measures to move pharmaceutical and health equipment supply chains out of China. Trade: Trade is an area of potential cooperation given that the two countries will continue trading while their economies rebound. The Phase One trade deal remains in place. However, China only made structural concessions on agriculture in this deal so any additional structural changes will have to be the subject of extensive negotiations. Secretary of Treasury Janet Yellen says the US will use the “full array of tools” to ensure compliance and will punish China for abuses of the global trade system. Cybersecurity: On cybersecurity, China greeted the Biden administration by hacking the Microsoft Exchange email system, an even larger event than Russia’s SolarWinds hack last year. Both hacks highlight how cyberspace is a major arena of modern Great Power struggle, making it unlikely that there will be effective cooperation. The hack suggests Beijing remains more concerned about accessing technology while it can than reducing tensions. The Americans will make demands of China at the Alaska meetings. Environment: As for the environment, the US is a net oil exporter while China imports 73% of its oil, 42% of its natural gas and 7.8% of its coal consumption, with 40% and 10% of its oil and gas coming from the Middle East. The US wants to be at the cutting edge of renewable energy technology but it has nowhere near the impetus of China (or Europe), which are diversifying away from fossil fuels for the sake of national security. Moreover China will want its own companies, not American, to meet its renewable needs. This is true even if there is success in reducing barriers for green trade, since the whole point of diversifying from Middle Eastern oil supplies is strategic self-sufficiency. The Americans would have to accept less energy self-sufficiency and greater renewable dependence on China. Nuclear Proliferation: Cooperation can occur here as the Biden administration will seek to return to a deal with the Iranians restraining their nuclear ambitions while maintaining a diplomatic limiting North Korea’s nuclear weapons stockpile and ballistic missile development. China and Russia will accept the US rejoining the 2015 Iranian nuclear deal but they will require significant concessions if they are to join the US in forcing anything more substantial on the Iranians. China may enforce sanctions on North Korea but then it will expect concessions on trade and technology that the Biden administration will not want to give merely for the sake of North Korea. Bottom Line: The Biden administration’s China strategy is taking shape and it is hawkish as expected. It is not ultra-hawkish, however, as the key characteristic is that it is a defensive posture in the wake of the perceived failures of Trump’s strategy of “attack, attack, attack.” This means largely maintaining the leverage that Trump built for the US while shifting the focus to actions that the US can take to improve its domestic production, supply chain resilience, and coordination with allied producers. Punitive measures are an option, however, and if relations deteriorate over time, as expected, they will be increasingly relied on. Buy The Dip In Cybersecurity Stocks A linchpin of the above analysis is the Microsoft Exchange hack, which some have called the largest hack in US history, since it confirms the view that the Biden administration will not be able to de-escalate strategic tensions with China much. China has been particularly frantic to acquire technology through hacking and cyber-espionage over the past decade as it attempts to achieve a Great Leap Forward in productivity in light of slowing potential growth that threatens single-party rule over the long run. The breakdown in ties between Presidents Barack Obama and Xi Jinping occurred not only because of Xi’s perceived violation of a personal pledge not to militarize the South China Sea but also because of the failure of a cybersecurity cooperation deal between the two. When the Trump administration arrived on the scene it sought to increase pressure on China and cybersecurity was immediately identified as an area where pushback was long overdue. Cyber conflict is highly likely to persist, not only with Russia but also with China. Cyber operations are a way for states to engage in Great Power struggle while still managing the level of tensions and avoiding a military conflict in the real world. The cyber realm is a realm of anarchy in which states are insecure about their capabilities and are constantly testing opponents’ defenses and their own offensive capabilities. They can also act to undermine each other with plausible deniability in the cyber realm, since multiple state and quasi-state actors and a vast criminal underworld make it difficult to identify culprits with confidence. Revisionist states like China, North Korea, Russia, and Iran have an advantage in asymmetric warfare, including cyber, since it enables them to undermine the US and West without putting their weaker conventional forces in jeopardy. Cybersecurity stocks have corrected but the general up-trend is well established and fully justified (Chart 7). It is not clear, however, that investors should favor cybersecurity stocks over the general NASDAQ index (Chart 8). The trend has been sideways in recent years and is trying to form a bottom. Cybersecurity stocks are volatile, as can be seen compared to tech stocks as a whole, and in both cases the general trend is for rising volatility as the macro backdrop shifts in favor of higher interest rates and inflation expectations (Chart 9). Chart 7Cyber Security Stocks Corrected
Cyber Security Stocks Corrected
Cyber Security Stocks Corrected
Chart 8Major Hacks Failed To Boost Cyber Vs NASDAQ
Major Hacks Failed To Boost Cyber Vs NASDAQ
Major Hacks Failed To Boost Cyber Vs NASDAQ
Chart 9Volatility Of Cyber & Tech Stocks Rising
Volatility Of Cyber & Tech Stocks Rising
Volatility Of Cyber & Tech Stocks Rising
Great Power struggle will not remain limited to the cyber realm. There is a fundamental problem of military insecurity plaguing the world’s major powers. Furthermore the global economic upturn and new energy and industrial innovation race will drive up commodity prices, which will in turn reactivate territorial and maritime disputes. Turf battles will re-escalate in the South and East China Seas, the Persian Gulf and Indian Ocean basin, the Mediterranean, and even the Baltic Sea and Arctic. One way to play this shift is as a geopolitical “back to work” trade – long defense stocks relative to cybersecurity stocks (Chart 10). The global defense sector saw a run-up in demand, capital expenditures, and profits late in the last business cycle. That all came crashing down with the pandemic, which supercharged cybersecurity as a necessary corollary to the swarm of online activity as households hunkered down to avoid the virus and obey government social restrictions. Cybersecurity stocks have higher EV/EBITDA ratios and lower profit margins and return on equity compared to defense stocks or the broad market. Chart 10Long Defense / Short Cyber Security: 'Back To Work' For Geopolitics
Long Defense / Short Cyber Security: 'Back To Work' For Geopolitics
Long Defense / Short Cyber Security: 'Back To Work' For Geopolitics
The trade does not mean cybersecurity stocks will fall in absolute terms – we maintain our bullish case for cybersecurity stocks – but merely that defense stocks will make relative gains as economic normalization continues in the context of Great Power struggle. Bottom Line: Structurally elevated geopolitical risks will continue to drive demand for cybersecurity in absolute terms. However, we would favor global defense stocks on a relative basis. The US Is Not As War-Weary As People Think America is consumed with domestic divisions and distractions. Since 2008 Washington has repeatedly demonstrated an unwillingness to confront foreign rivals over small territorial conquests. This risk aversion has created power vacuums, inviting ambitious regional powers like China, Russia, Iran, and Turkey to act assertively in their immediate neighborhoods. However, the US is not embracing isolationism. Public opinion polling shows Americans are still committed to an active role in global affairs (Chart 11). The 2020 election confirms that verdict. Nor are Americans demanding big cuts in defense spending. Only 31% of Americans think defense spending is “too much” and only 12% think the national defense is stronger than it needs to be (Chart 12). Chart 11No Isolationism Here
No Isolationism Here
No Isolationism Here
True, the Democratic Party is much more inclined to cut defense spending than the Republicans. About 43% of Democrats demand cuts, while 32% are complacent about the current level of spending (compared to 8% and 44% for Republicans). But it is primarily the progressive wing of the party that seeks outright cuts and the progressives are not the ones who took power. Chart 12Americans Against ‘Forever Wars’ But Not Truly Dovish
More Reasons To Buy Cybersecurity And Defense Stocks
More Reasons To Buy Cybersecurity And Defense Stocks
Biden and his cabinet represent the Washington establishment, including the military-industrial complex. Even if Vice President Kamala Harris should become president she would, if anything, need to prove her hawkish credentials. Defense spending cuts might be projected nominally in Biden’s presidential budgets but they will not muster majorities in the two narrowly divided chambers of Congress. Biden has co-opted Trump’s (and Obama’s) message of strategic withdrawal and military drawdown. He is targeting a date of withdrawal from Afghanistan on May 1, notwithstanding the leverage that a military presence there could yield in its priority negotiations with Iran. Yet he is not jeopardizing the American troop presence in Germany and South Korea, much more geopolitically consequential spheres of action in a long competition with Russia and China. While it is true (and widely known) that Americans have turned against “forever wars,” this really means Middle Eastern quagmires like Iraq and Afghanistan and does not mean that the American public or political establishment have truly become anti-war “doves.” The US public recognizes the need to counter China and Russia and Congress will continue appropriating funds for defense as well as for industrial policy. The Biden administration will increase awareness about the risks of a lack of deterrence and alliance-building. This is especially apparent given the military buildup in China. The annual legislative session has revealed an important increase in military focus in Beijing in the context of the US rivalry. Previously, in the thirteenth five-year plan and the nineteenth National Party Congress, the People’s Liberation Army aimed to achieve “informatization and mechanization” reforms by 2020 and total modernization by 2035. However, at the fifth plenum of the central committee in October, the central government introduced a new military goal for the PLA’s 100th anniversary in 2027 – a “military centennial goal” to match with the 2021 centennial of the Communist Party and the 2049 centennial goal of the founding of the People’s Republic. While details about this new military centenary are lacking, the obvious implication is that the Communist Party and PLA are continuing to shift the focus to “fighting and winning wars,” particularly in the context of the need to deter the United States. The official defense budget is supposed to grow 6.8% in 2021, only slightly higher than the 6.6% goal in 2020, but observers have long known that China’s military budget could be as much as twice as high as official statistics indicate. The point is that defense spending is going up, as one would expect, in the context of persistent US-China tensions. Bottom Line: Just as US-China cooperation will be hindered by mutual efforts to reduce supply chain dependency and support domestic demand, so too it will be hindered by mutual efforts to increase defense readiness and capability in the event of military conflict. The beneficiary of continued high levels of US defense spending and Chinese spending increases – in the context of a more general global arms buildup – will be global arms makers. Investment Takeaways Geopolitical risk remains structurally elevated despite the temporary drop in tensions in late 2020 and early 2021. The China-backed Microsoft Exchange hack reinforces the Biden administration’s initial foreign policy comments and actions suggesting that US policy will remain hawkish on China. While Biden will adopt a more defensive rather than offensive strategy relative to Trump, there is no chance that he will return to the status quo ante. The Obama administration itself grew more hawkish on China in 2015-16 in the face of cyber threats and strategic tensions in the South China Sea. Cybersecurity stocks will continue to benefit from secular demand in an era of Great Power competition where nations use cyberattacks as a form of asymmetric warfare and a means of minimizing the risks of conflict. The recent correction in cybersecurity stocks creates a good entry point. We closed our earlier trade in January for a gain of 31% but have remained thematically bullish and recommend going long in absolute terms. We would favor defense over cybersecurity stocks as a geopolitical version of the “back to work” trade in which conventional economic activity revives, including geopolitical competition for territory, resources, and strategic security. Defense stocks are undervalued and relative share prices are unlikely to fall to 2010-era lows given the structural increase in geopolitical risk (Chart 13). Chart 13Global Defense Stocks Oversold
Global Defense Stocks Oversold
Global Defense Stocks Oversold
Chart 14Global Defense Stocks Profitable, Less Indebted
Global Defense Stocks Profitable, Less Indebted
Global Defense Stocks Profitable, Less Indebted
Defense stocks have seen profit margins hold up and are not too heavily burdened by debt relative to the broad market (Chart 14). Defense stocks have a higher return on equity than the average for non-financial corporations and cash flow will improve as a new capex cycle begins in which nations seek to improve their security and gain access to territory and resources (Chart 15). Chart 15Defense Stocks: High RoE, Capex Will Revive
Defense Stocks: High RoE, Capex Will Revive
Defense Stocks: High RoE, Capex Will Revive
Chart 16Discount On Global Defense Stocks
Discount On Global Defense Stocks
Discount On Global Defense Stocks
Valuation metrics show that global defense stocks are trading at a discount (Chart 16). Matt Gertken Vice President Geopolitical Strategy mattg@bcaresearch.com Appendix Table 1 Appendix Table 1Biden Administration's First 100 Days: Key Statements And Actions On China
More Reasons To Buy Cybersecurity And Defense Stocks
More Reasons To Buy Cybersecurity And Defense Stocks
Footnotes 1 See Federal Register, "America’s Supply Chains", Mar. 1, 2021, federalregister.gov and Richard Cowan and Alexandra Alper, "Top U.S. Senate Democrat directs lawmakers to craft bill to counter China", Feb. 23, 2021, reuters.com.
BCA Research’s Emerging Markets Strategy service concludes that EMs (ex-China, Korea and Taiwan) are better positioned to handle higher US bond yields today than they were back in 2013. Nonetheless, they will feel some pain. Are we entering another Taper…
Please note that we will be presenting a webcast on Thursday March 11 at 10:00 AM EST for the Americas and EMEA regions and on March 12 at 9:00 HKT/12:00 AEDT for APAC clients. We will be discussing macro themes and investment strategies. Highlights EMs (ex-China, Korea and Taiwan) are better positioned to handle higher US bond yields today than they were in 2013. Yet better does not mean they will be unscathed. The combination of rising US bond yields and a firming US currency will suffocate EM risk assets in the near-term. A neutral allocation is warranted in EM stocks and credit markets within global equity and credit portfolios, respectively. Feature Ever since the US elections concluded in January with a Blue Sweep, we have been warning that rising US bond yields could trigger a setback in global markets in general, and in EM markets in particular. EM equities, currencies and fixed-income markets have recently experienced a correction (Chart 1). The question now is: Is the market rout over? Or is there more to come? We are inclined to believe that the correction is not over. Rising US Treasury yields have been the culprit of the shakeout in global growth stocks, EM equities, as well as EM currencies. Therefore, taking a stance on US bond yields and on the US dollar is critical for assessing the outlook for EM financial markets. Odds are that the selloff in US long-term bonds and the rebound in the US dollar are not yet over because: Positioning and sentiment on US long-dated Treasuries is neutral, as illustrated in Chart 2. Chart 1Rising US Real Yields Have Caused A Shakeout In EM
Rising US Real Yields Have Caused A Shakeout In EM
Rising US Real Yields Have Caused A Shakeout In EM
Chart 2Investor Sentiment And Positioning In US Treasurys Are Neutral
Investor Sentiment And Positioning In US Treasurys Are Neutral
Investor Sentiment And Positioning In US Treasurys Are Neutral
Typically, US bond yields do not reverse their ascent until investor sentiment becomes downbeat and bond portfolios are of materially short duration. These conditions for a top in bond yields are not yet present. US government bond yields would have been much higher if it were not for the Federal Reserve and US commercial banks’ massive bond-buying spree. The Fed has bought $2.8 trillion and US commercial banks have purchased about $300 billion of Treasurys in the past 12 months (Chart 3). One of the main motives for commercial banks to buy US Treasurys has been the SLR relief initiative which commenced on April 1, 2020.1 This SLR relief is due to terminate on March 31, 2021. Unless it is extended, commercial banks will drastically curtail their net government bond purchases. This will exert upward pressure on Treasury yields. Regarding the greenback, investor sentiment remains quite bearish (Chart 4). From a contrarian perspective, this heralds further strength in the US dollar. Chart 3Surging Purchases Of US Treasurys By The Fed And Commercial Banks
Surging Purchases Of US Treasurys By The Fed And Commercial Banks
Surging Purchases Of US Treasurys By The Fed And Commercial Banks
Chart 4Investors Are Still Bearish On The US Dollar
Investors Are Still Bearish On The US Dollar
Investors Are Still Bearish On The US Dollar
From a cyclical perspective, US growth will be stronger relative to its potential, and vis-à-vis other DMs, EMs and China. Growth differentials moving in favor of the US foreshadows near-term strengthening of the dollar. Structurally, the bearish case for the US currency hinges on both the Federal Reserve falling behind the inflation curve and ballooning US twin deficits. In our view, this will ultimately be the case. Hence, the long-term outlook for the US dollar remains troublesome. That said, twin deficits alone are insufficient to produce a continuous currency depreciation. The twin deficits must also be accompanied with low/falling real interest rates – in order to generate sufficient conditions for currency depreciation. As long as US real rates continue rising, the dollar’s rebound will be extended. The USD/EUR exchange rate has been correlated with the 10-year real yield differential and this relationship will persist (Chart 5). Bottom Line: US government bonds will continue selling off. Rising bond yields (including rising real yields) will support the dollar in the near-term. The combination of rising US bond yields and a firming US currency will cause global macro volatility to rise (Chart 6). This will suffocate EM risk assets and EM currencies. Chart 5US Real Yields (TIPS) Will Continue Driving The US Dollar
US Real Yields (TIPS) Will Continue Driving The US Dollar
US Real Yields (TIPS) Will Continue Driving The US Dollar
Chart 6Aggregate Financial Market Volatility: Higher Lows
Aggregate Financial Market Volatility: Higher Lows
Aggregate Financial Market Volatility: Higher Lows
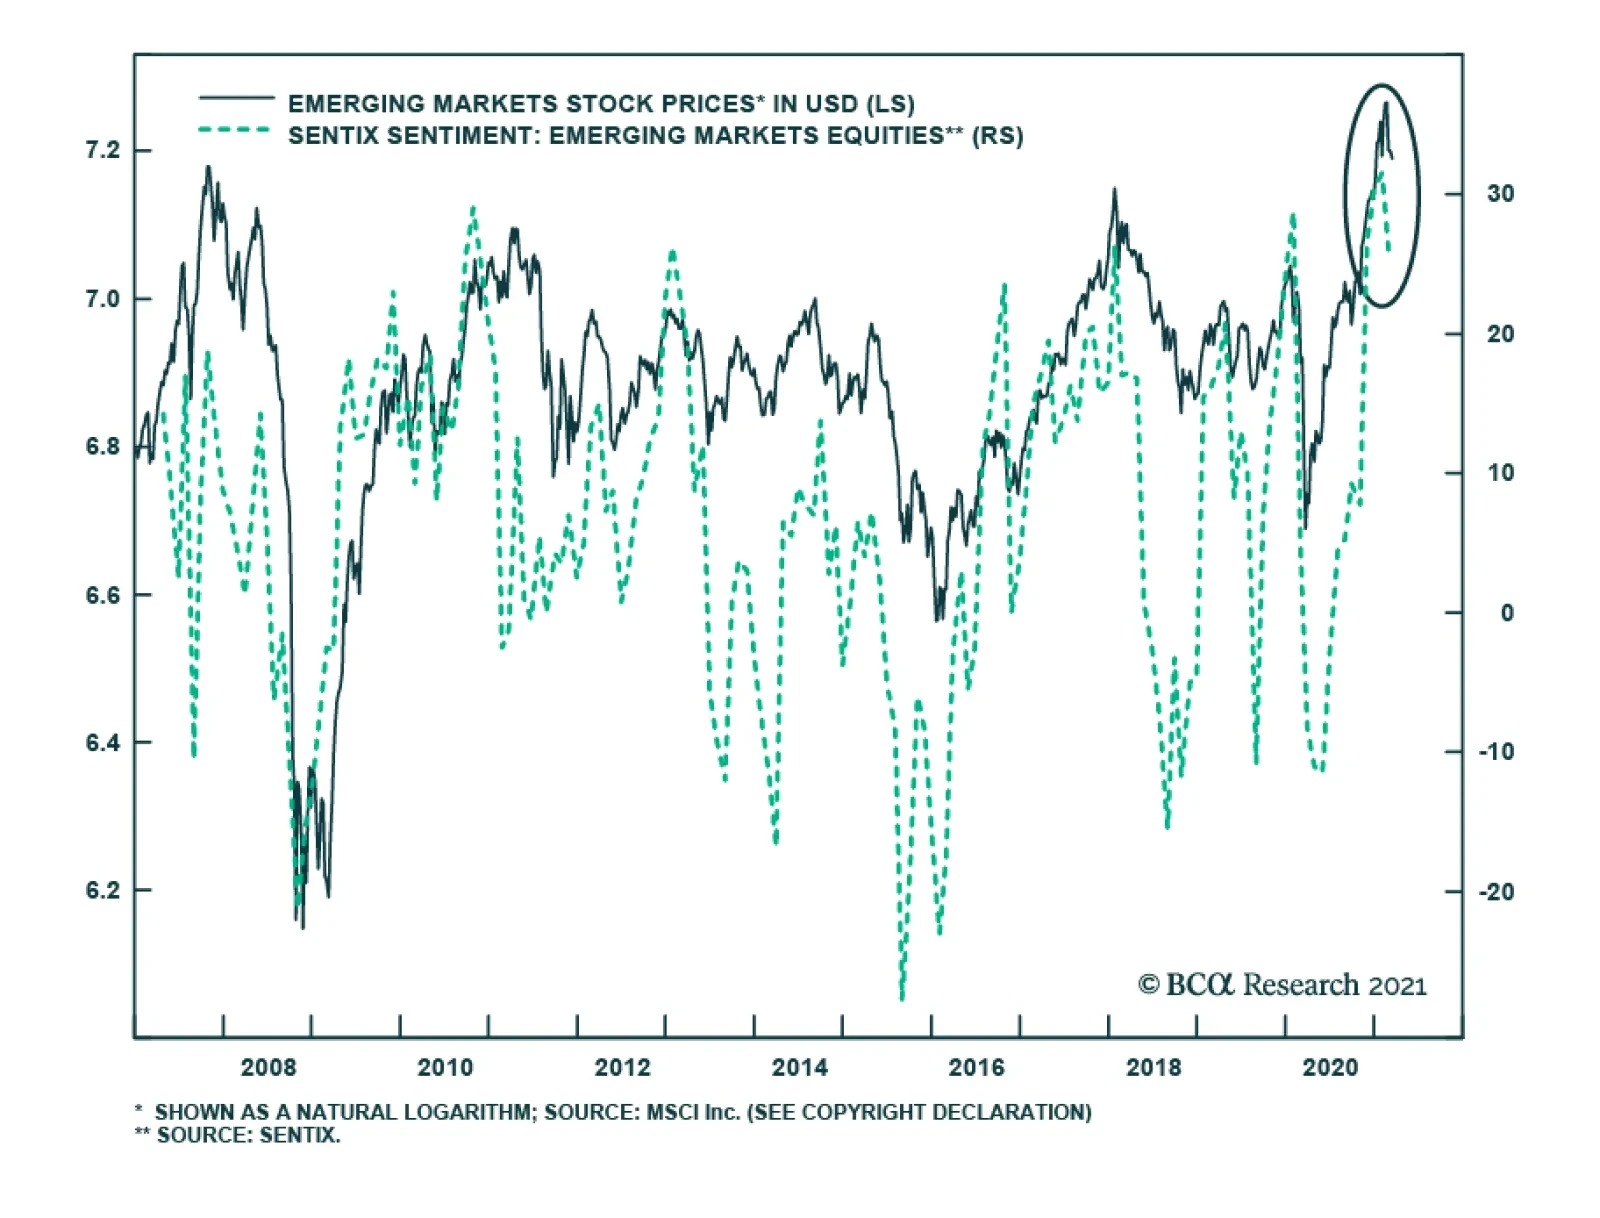
Impact On EM: 2013 Versus Now Are we entering another Taper Tantrum episode as in the spring of 2013 when many EMs were devastated? There are both similarities and differences between the current period of rising US bond yields and the 2013 episode. Similarities: Today, as in early 2013, investor sentiment on EM is very bullish and investors are long EM (Chart 7). Chart 7Investor Sentiment On EM Stocks Was At A Record High In January
Investor Sentiment On EM Stocks Was At A Record High In January
Investor Sentiment On EM Stocks Was At A Record High In January
In early 2013, as is the case today, EM local currency bond yields were very low and EM credit spreads were too tight. When US Treasury yields spiked in the spring of 2013, EM assets tanked. Many commentators blamed it on the Fed. We disagree with that interpretation. Remarkably, the rise in US TIPS yields in 2013 had little impact on equity indices such as the S&P 500 and Nasdaq, or on US corporate spreads (Chart 8). The correction in the US equity market lasted about a week. Yet, EM equities, fixed income markets and currencies experienced a prolonged slump, and in many cases, a bear market. There is no basis to believe that the Fed’s policy and US bond yields are more important to EM than they are to US credit and equity markets. The core rationale for the EM bear market in 2013 was poor domestic fundamentals. The Fed’s tapering was the trigger, not the cause. Differences: The key difference between the current episode and the 2013 Taper Tantrum is EM macro fundamentals. Specifically: EM economies (ex-China, Korea and Taiwan) entered 2013 with booming bank loans and strong domestic demand as well as high inflation (Chart 9). Chart 8US Markets Were Not Hit By The Taper Tantrum In 2013
US Markets Were Not Hit By The Taper Tantrum In 2013
US Markets Were Not Hit By The Taper Tantrum In 2013
Chart 9EM (ex-China, Korea And Taiwan): 2013 Vs Now
EM (ex-China, Korea and Taiwan): 2013 Vs Now
EM (ex-China, Korea and Taiwan): 2013 Vs Now
Chart 10EM (ex-China, Korea And Taiwan): 2013 Vs Now
EM (ex-China, Korea and Taiwan): 2013 Vs Now
EM (ex-China, Korea and Taiwan): 2013 Vs Now
Presently, EM bank credit is subdued, domestic demand is dismal, and inflation is tame. Besides, EMs (ex-China, Korea and Taiwan) had a very large trade deficits in 2013 and were financing them via foreign borrowing, which was roaring prior to 2013 (Chart 10). Presently, their trade balances are in surplus and foreign indebtedness has not increased in recent years. Bottom Line: In 2013, EM economies (ex-China, Korea and Taiwan) were overheating and were addicted to foreign funding. These were the reasons why EM currencies and fixed income markets teetered when US bond yields spiked in 2013. Presently, the majority of EM economies (ex-China, Korea and Taiwan) have different types of malaises: domestic bank loan origination is too timid, consumer spending and capital expenditures are moribund, inflation is low and fiscal policy is tight. Consequently, EMs (ex-China, Korea and Taiwan) are better positioned to handle higher US bond yields today than they were back in 2013. Yet better does not mean they will be unscathed. Investment Strategy Equities: The key variable to watch to assess the vulnerability of both US and EM equity markets is their respective corporate bond yields. Historically, rising corporate bond yields (shown inverted in both panels of Chart 11) heralds lower share prices. Chart 11Rising Corporate Bond Yields Are Bad For Share Prices
Rising Corporate Bond Yields Are Bad For Share Prices
Rising Corporate Bond Yields Are Bad For Share Prices
Given that both EM and US corporate credit spreads are too tight, they are unlikely to narrow further to offset rising US Treasury yields. Instead, EM and US corporate bond yields are likely to rise with US Treasury yields. This will trigger more weakness in share prices. Besides, rising EM local currency government bond yields also point towards more downside in EM equities (yields are shown inverted on the chart) (Chart 12). Chart 12Rising EM Local Currency Bond Yields Heralds Weaker Equity Prices
Rising EM Local Currency Bond Yields Heralds Weaker Equity Prices
Rising EM Local Currency Bond Yields Heralds Weaker Equity Prices
Concerning equity style, global growth stocks have peaked versus global value stocks. In the EM equity space, we have less conviction on growth versus value. As to regional allocation in a global equity portfolio, we continue recommending a neutral allocation to EM, underweighting US and overweighting Europe and Japan. Commodities: Investors’ net long positions in commodities are very elevated (Chart 13). As US bond yields rise and the US dollar continues rebounding, there will be a de-risking in the commodities space resulting in a pullback in commodities prices. Currencies: We continue shorting a basket of EM currencies – including BRL, CLP, ZAR, TRY and KRW versus the euro, CHF and JPY. Several EM currencies have failed to break above their technical resistance levels, suggesting that a pullback could be non-trivial (Chart 14). Chart 13Investors Are Record Long Commodities
Investors Are Record Long Commodities
Investors Are Record Long Commodities
Chart 14Asian Currencies Hit Technical Resistances
Asian Currencies Hit Technical Resistances
Asian Currencies Hit Technical Resistances
In central Europe, we are closing the long CZK/short USD trade with a 3.8% gain. Continue holding the long CZK/short PLN and HUF position. Local fixed income markets: EM local bond yields have risen in response to rising US treasury real yields and the setback in EM currencies. This might persist in the near-term, but we continue to recommend receiving 10-year swap rates in selected countries where inflation risks are low and monetary and fiscal policies are tight. These countries include Mexico, Colombia, Russia, China, India and Malaysia. A further rise in their swap rates would represent an overshoot and hence, should not be chased. EM currencies are more vulnerable to a selloff than local rates are. We continue to wait for a better entry point in currencies to recommend buying cash domestic bonds instead of receiving swap rates. EM Credit: A neutral allocation to EM sovereign and corporate bonds is warranted in a global credit portfolio. Our sovereign credit overweights are Mexico, Russia, Malaysia, Peru, Colombia, the Philippines and Indonesia, while our sovereign credit underweights are Brazil, South Africa and Turkey. Arthur Budaghyan Chief Emerging Markets Strategist arthurb@bcaresearch.com Footnotes 1 The Supplementary Leverage Ratio (SLR) is equivalent to Basel III Tier-1 leverage ratio and varies from 3-5% for US banks. Under the relief program last April, the Fed allowed US banks to exclude holdings of US Treasury Bonds and cash kept in reserves at the Fed from their assets when calculating this ratio. The SLR relief is planned to end March 31, 2021. Equities Recommendations Currencies, Credit And Fixed-Income Recommendations

China’s all-important credit data surprised to the upside in February, declining by less than anticipated. Aggregate financing was nearly double consensus expectations, coming in at CNY 1.71 trillion from CNY 5.17 trillion in January. Meanwhile, Chinese banks…
Highlights China’s economic recovery is in a later stage than the US. A rebound in US Treasury yields is unlikely to trigger upward pressure on government bond yields in China. Imported inflation through mounting commodity and oil prices should be transitory and does not pose enough risk for Chinese authorities to further tighten policies. Historically, Chinese stocks have little correlation with changes in US Treasury yields; Chinese equity prices are primarily driven by the country’s domestic credit growth and economic conditions. We maintain our tactical (0 to 3 months) neutral position on Chinese stocks, in both absolute and relative terms. However, the near-term pullbacks are taking some air out of Chinese equities' frothy valuations, providing room for a cyclical upswing. Chinese offshore stocks, which are highly concentrated in the tech sector, are facing multiple challenges. We are closing our long investable consumer discretionary/short investable consumer staples trade and we recommend long A-shares/short MSCI China Index. Feature Chinese stocks extended their February losses into the first week of March. Market participants fear that escalating real government bond yields in the US and elsewhere will have a sustained negative impact on Chinese risk assets, reinforced by ongoing policy normalization in China. Global equity prices have been buffeted by crosscurrents. An acceleration in the deployment of vaccines and increased economic reopenings provide a positive backdrop to the recovery of corporate profits. At the same time, optimism about global growth and broadening fiscal stimulus in the US has prompted investors to expect higher policy rates sooner. The US 10-year Treasury yield is up by 68bps so far this year, depressing US equity valuations and sending ripple effects across global bourses. In this report, we examine how rising US and global bond yields would affect China’s domestic monetary policy and risk-asset prices. Will Climbing US Treasury Yields Push Up Chinese Rates? Chart 1Chinese Gov Bond Yields Have Led The US Counterpart Since 2015
Chinese Gov Bond Yields Have Led The US Counterpart Since 2015
Chinese Gov Bond Yields Have Led The US Counterpart Since 2015
Increasing bond yields in the US will not necessarily lead to higher bond yields in China. Chart 1 shows that the direction of China’s 10-year government bond yield has a tight correlation with its US counterpart. It is not surprising because business cycles in these giant economies have become more synchronized. Interestingly, China’s 10-year Treasury bond yield has led the US one since 2015. This may be due to China’s growing importance in the world economy. China’s credit and domestic demand growth leads the prices of many industrial metals and in turn, business cycles in many economies. China’s rising long-duration government bond yields reflect expectations of an improving domestic economy, and these expectations often spill over to the rest of the world, including the US. Although the recent sharp rebound in the US Treasury yield is mainly driven by domestic factors, the rebound is unlikely to spill over to their Chinese peers, because the countries are in different stages of their business and policy cycles. America is still at its early stage of economic recovery and fresh stimulus measures are still being rolled out, whereas China has already normalized its policy rates back to pre-pandemic levels and its credit growth peaked in Q4 last year. Chinese fixed-income markets will soon start pricing in moderating growth momentum in the second half of this year, suppressing the long-end of China’s Treasury yield curve (Chart 2). Importantly, none of the optimism that has lifted US Treasury yields - a vaccine-led global growth recovery and a massive US fiscal stimulus – would warrant a better outlook for China. Reopening worldwide economies will likely unleash pent-up demand for services, such as travel and catering, rather than merchandise trade. Chart 3 shows that since the pandemic US spending on goods, which benefited Chinese exports, has soared relative to spending on services. The trend will probably reverse when the US and world economy fully opens, limiting the upside for China’s exports and its contribution to growth this year. Chart 2China And The US Are In Different Stages Of Their Economic Recoveries
China And The US Are In Different Stages Of Their Economic Recoveries
China And The US Are In Different Stages Of Their Economic Recoveries
Chart 3US Consumers Have Been Spending Much More On Goods Than Services During The Pandemic
US Consumers Have Been Spending Much More On Goods Than Services During The Pandemic
US Consumers Have Been Spending Much More On Goods Than Services During The Pandemic
Bottom Line: China’s waning growth momentum will insulate Chinese bond yields from higher US Treasury yields. Do Rising Inflation Expectations In The US Pose Risks Of Policy Tightening In China? Chart 4Imported Inflation Shouldnt Constrain The PBoC
Imported Inflation Shouldnt Constrain The PBoC
Imported Inflation Shouldnt Constrain The PBoC
While China’s monetary policymaking is not entirely insulated from exogenous shocks, it is primarily driven by domestic economic conditions and inflation dynamics. We are not complacent about the risk of a meaningful uptick in global inflation, but we do not consider imported inflation a major policy constraint for the PBoC this year (Chart 4). Furthermore, at last week’s National People’s Congress (NPC), China set the inflation target in 2021 at 3%, which is a high bar to breach. Mounting commodity prices, particularly crude oil prices, may put upward pressures on China’s producer prices, but their impact on China’s overall inflation will be limited for the following reasons: China accounts for a large portion of the world’s commodity demand. Given that the country’s credit impulse has already peaked, domestic demand in capital-intensive sectors (such as construction and infrastructure spending) will slow this year. Reinforced policy restrictions on the property sector will also restrain the upside price potential in industrial raw materials such as steel and cement (Chart 5). For producers, the main and sustained risk for imported inflation will be concentrated in crude oil. The PPI may spike in Q2 and Q3 this year due to advancing oil prices and the extremely low base factor from the same period last year. The PBoC will likely view a spike in the PPI as transitory. Moreover, the recent improvement in producer pricing power appears to be narrow. The output price for consumer goods, which accounts for 25% of the PPI price basket, remains subdued (Chart 6). Chart 5Chinas Demand For Raw Materials Will Slow
Chinas Demand For Raw Materials Will Slow
Chinas Demand For Raw Materials Will Slow
Chart 6Output Price For Consumer Goods Remains In Contraction
Output Price For Consumer Goods Remains In Contraction
Output Price For Consumer Goods Remains In Contraction
Importantly, when oil prices plummeted in the first half of 2020, China’s crude oil inventories showed the fastest upturn on record (Chart 7). It suggests that China’s inventory restocking from last year may help to partially offset the impact from elevated oil prices this year. For consumers, oil prices account for a much smaller percentage of China’s CPI basket than in the US (Chart 8). Food prices, particularly pork, drive China’s headline CPI and can be idiosyncratic. We expect food price increases to be well contained this year due to improved supplies and the high base effect from last year. Chart 7Massive Buildup in Chinas Crude Oil Inventory In 2020
Massive Buildup in Chinas Crude Oil Inventory In 2020
Massive Buildup in Chinas Crude Oil Inventory In 2020
Chart 8Oil Prices Account For A Small Portion In China's Consumer Spending
Oil Prices Account For A Small Portion In Chinas Consumer Spending
Oil Prices Account For A Small Portion In Chinas Consumer Spending
Importantly, China’s inflation expectations have not recovered to their pre-pandemic levels and consumer confidence on future income growth also remains below its end-2019 figure (Chart 9). If this trend holds, then it will be difficult for producers to pass through escalating input costs to end users. Although China’s economy has strengthened, it is far from overheating (Chart 10). Without a sustained above-trend growth rebound, it is difficult to expect genuine inflationary pressures. The pandemic has distorted the balance of global supply and demand, propping up demand and price tags attached to it. In China’s case, however, production capacity and capital expenditures rebounded faster than demand and consumer spending, constraining the upsides in inflation (Chart 11). Chart 9Consumer Inflation Expectations Have Not Fully Recovered
Consumer Inflation Expectations Have Not Fully Recovered
Consumer Inflation Expectations Have Not Fully Recovered
Chart 10Chinese Economy Is Not Yet Overheating
Chinese Economy Is Not Yet Overheating
Chinese Economy Is Not Yet Overheating
China’s CPI is at its lowest point since 2009, making China’s real yields much greater than in the US. Rising real US government bond yields could be mildly positive for China because they help to narrow the Sino-US interest rate differential and temper the pace of the RMB’s appreciation (Chart 12). A breather in the RMB’s gains would be a welcome reflationary force for Chinese exporters and we doubt that Chinese policymakers will spoil it with a rush to hike domestic rates. Chart 11And Production Has Recovered Faster Than Demand
And Production Has Recovered Faster Than Demand
And Production Has Recovered Faster Than Demand
Chart 12Narrowing Real Rate Differentials Helps To Tamper The RMB Appreciation
Narrowing Real Rate Differentials Helps To Tamper The RMB Appreciation
Narrowing Real Rate Differentials Helps To Tamper The RMB Appreciation
Bottom Line: It is premature to worry about an inflation overshoot in China. The current environment is characterized as easing deflation rather than rising inflation. Our base case remains that inflationary pressures will stay at bay this year. Are Higher US Treasury Yields Headwinds For Chinese Stocks? Historically, Chinese stocks have exhibited a loose cyclical correlation with US government bond yields, particularly in the onshore market (Chart 13). Equity prices in China are more closely correlated with domestic long-duration government bond yields, but the relationship is inconsistent (Chart 14). Chart 13Chinese Stocks Have Little Correlation With US Treasury Yields
Chinese Stocks Have Little Correlation With US Treasury Yields
Chinese Stocks Have Little Correlation With US Treasury Yields
Chart 14Correlations Between Chinese Stocks And Domestic Gov Bond Yields Are Inconsistent
Correlations Between Chinese Stocks And Domestic Gov Bond Yields Are Inconsistent
Correlations Between Chinese Stocks And Domestic Gov Bond Yields Are Inconsistent
Chinese stocks are much more sensitive to changes in the quantity of domestic money supply than the price of money. A sharp rebound in China’s 10-year government bond yield in the second half of last year did not stop Chinese stocks from rallying. The insensitivity of Chinese stocks to changes in the price of money is particularly prevalent during the early stage of an economic recovery. As we pointed out in a previous report, since 2015 the PBoC has shifted its policy to target interest rates instead of the quantity of money supply. Thus, credit growth, which propels China’s business cycle and corporate profits, can still trend higher even as bond yields pick up. This explains why domestic credit growth, rather than China’s real government bond yields, has been the primary driver of the forward P/E of Chinese stocks (Chart 15A and 15B). This contrasts with the S&P, in which the forward P/E ratio moves in lockstep with the inverted real yield in US Treasuries (Chart 16). Chart 15ACredit Growth Has Been Driving Up Chinese Stock Valuations
Credit Growth Has Been Driving Up Chinese Stock Valuations
Credit Growth Has Been Driving Up Chinese Stock Valuations
Chart 15BCredit Growth Has Been Driving Up Chinese Stock Valuations
Credit Growth Has Been Driving Up Chinese Stock Valuations
Credit Growth Has Been Driving Up Chinese Stock Valuations
Credit growth in China peaked in Q4 last year and the intensity of the economic recovery has started to moderate. Hence, regardless of the changes in bond yields, Chinese stocks will need to rely on profit growth in order to sustain an upward trend (Chart 17). Chart 16Falling Real Rates Were Propping Up US Equity Valuations
Falling Real Rates Were Propping Up US Equity Valuations
Falling Real Rates Were Propping Up US Equity Valuations
Chart 17Earnings Growth Needs To Accelerate To Support Chinese Stock Performance
Earnings Growth Needs To Accelerate To Support Chinese Stock Performance
Earnings Growth Needs To Accelerate To Support Chinese Stock Performance
The good news is that recent gyrations in the US equity market, coupled with concerns about further tightening in China’s domestic economic policy have triggered shakeouts in China’s equity markets. The pullback in stock prices has helped to shed some excesses in frothy Chinese valuations and has opened a door for more upsides in Chinese stock on a cyclical basis. Bottom Line: Rising Treasury yields in the US or China will not have a direct negative impact on Chinese equities. Last year’s massive credit expansion has lifted both earnings and multiples in Chinese stocks and an acceleration in earnings growth is now needed to support stock performance. Investment Implications The key message from last week’s NPC meetings suggests that policy tightening will be gradual this year. While the 6% growth target was lower than expected, it represents a floor rather than a suggested range and it will likely be exceeded. Bond yields and policy rates are already at their pre-pandemic levels, indicating that there is not much room for further monetary policy tightening this year. The announced objectives for the fiscal deficit and local government bond quotas are only modestly smaller than last year. The economic and policy-support targets support our view that policymakers will be cautious and not overdo tightening. We will elaborate on our takeaways from this year’s NPC in next week’s report. Chart 18Chinese Cyclicals Can Still Benefit From An Improving Global Economic Backdrop
Chinese Cyclicals Can Still Benefit From An Improving Global Economic Backdrop
Chinese Cyclicals Can Still Benefit From An Improving Global Economic Backdrop
Meanwhile, there is still some room for Chinese cyclical stocks to run higher relative to defensives, given the current Goldilocks backdrop of global economic recovery and accommodative monetary policy (Chart 18). We maintain a tactical (0 to 3 months) neutral position on Chinese stocks, in both absolute and relative terms. The market correction has not fully run its course. However, the near-term pullbacks are taking some air out of Chinese equities' frothy valuations, providing room for a cyclical upswing. We are closing our long investable consumer discretionary/short investable consumer staples trade. Instead, we recommend the following trade: long A-share stocks/short MSCI China Index. Investable consumer discretionary sector stocks, which are concentrated in China’s technology giants, face a confluence of challenges ranging from the ripple effects of falling stock prices in the US tech sector and tightened antitrust regulations in China (Chart 19). In contrast, the A-share index is heavily weighted in value stocks while the MSCI China investable index has a large proportion of expensive new economy stocks (Chart 20). The trade is in line with our view that the investment backdrop has shifted in favor of global value versus growth stocks due to a strong US expansion, rising US bond yields and a weaker US dollar. Chart 19Chinese Investable Tech Sector Is Facing Strong Headwinds
Chinese Investable Tech Sector Is Facing Strong Headwinds
Chinese Investable Tech Sector Is Facing Strong Headwinds
Chart 20Overweight A Shares Versus Chinese Investable Stocks
Overweight A Shares Versus Chinese Investable Stocks
Overweight A Shares Versus Chinese Investable Stocks
Jing Sima China Strategist jings@bcaresearch.com Cyclical Investment Stance Equity Sector Recommendations

Chinese markets have been in somewhat of a slump. The CSI 300 was the only major global equity benchmark in the red on Tuesday, falling 2.15% on the day and bringing down the index’s year-to-date performance to -4.61%. The yuan, which strengthened throughout…

Chinese trade beat expectations by a large margin in the first two months of the year. Exports in January and February were up a cumulative 60.6% y/y in USD terms versus expectations of a 40.0% y/y increase, marking a significant acceleration from the 18.1%…

China’s annual National People’s Congress kicked off on Friday with the unveiling of economic targets and budgets for the year. Beijing once again abandoned the numerical GDP growth target, instead setting it “above 6%”. Meanwhile, other important economic…
Dear client, In addition to this week’s abbreviated report, we are also sending you a Special Report on currency hedging, authored by my colleague Xiaoli Tang. Xiaoli’s previous work mapped out a dynamic hedging strategy for developed market equity investors in various home currencies. In this report, she extends the work to emerging market exposure. I hope you will find the report insightful. Next week, in lieu of our weekly report on Friday, we will be sending you a joint Special Report on the UK on Tuesday, together with our Global Fixed Income colleagues. Kind regards, Chester Highlights The DXY index is up for the year, but further gains will be capped at 2-3% from current levels. Long yen positions are offside amid the dollar rally. This should wash out stale longs, and underpin the bull case. Lower the limit-sell on the gold/silver ratio to 68. We were stopped out of our short AUD/MXN position amidst a broad-based selloff in EM currencies. We are reinitiating the trade this week. Feature Chart I-1The Dollar Has Been Strong In 2021
The Dollar Has Been Strong In 2021
The Dollar Has Been Strong In 2021
The DXY index has once again kissed off the 90 level and is gaining momentum in March. Year-to-date, the DXY index is up 1.1%. This performance has been particularly pronounced against other safe haven currencies, such as the Swiss franc and the Japanese yen. GBP and AUD have fared rather well in this environment (Chart I-1). As the “anti-dollar,” the euro has also suffered. Our technical indicators continue to warn that the dollar still has upside. Net speculative positions are at very depressed levels, consistent with many sentiment indicators that are bearish USD. However, this time around, any dollar rally could be capped at 2-3%, in sharp contrast to the bounce we witnessed in March 2020. The Message From Dollar Technical Indicators Our dollar capitulation index has bounced from very oversold levels, and is now sitting above neutral territory (Chart I-2). The index comprises a standardized measure of sentiment, net speculative positioning and momentum. It is very rare that a drop in this index below the -1.5 level does not trigger a rebound in the dollar. This time around, the bounce has been rather muted. Chart I-2BCA Dollar Capitulation Index Suggests Some Upside
BCA Dollar Capitulation Index Suggests Some Upside
BCA Dollar Capitulation Index Suggests Some Upside
Part of the reason has been concentration around dollar short positions. Investors throughout most of the pandemic executed their bearish dollar bets through the euro, yen and the Swiss franc (countries that already had negative interest rates). Positioning on risk on currencies such as the Australian dollar and the Mexican peso were neutral. This also explains the underperformance of the yen, as the dollar rises. From a sizing standpoint, ever since the dollar peaked in March 2020, counter-trend moves have been in the order of 2-3%. We expect this time to be no different. What To Do About The Yen The yen has been one of our core holdings on three fundamental pillars: it is cheap, it tends to rise during dollar bear markets and the economy in Japan is more hostage to deflation than the US. This bodes well for real rates in Japan, relative to the US. Over the last month, our long yen position has been put offside. First, demand for safe havens has ebbed as US interest rates have gapped higher (Chart I-3, panel 1). King dollar has once again become the safe haven of choice. As Chart I-1 illustrates, low beta currencies such as the Swiss franc and yen, that tend to do relatively well when the dollar is rallying, have underperformed. Yield curve control (YCC) in Japan is also negative for the yen as interest rates rise (panel 2). Economic momentum in Japan is also rolling over (panel 3). Prime Minister Yoshihide Suga’s mulling to extend the state of emergency in the Tokyo region could further cripple any Japanese economic recovery. Chart I-3A Healthy Reset In The Yen
A Healthy Reset In The Yen
A Healthy Reset In The Yen
Chart I-4USD/JPY Support Should Hold
USD/JPY Support Should Hold
USD/JPY Support Should Hold
For short-term investors, USD/JPY is very overbought and is approaching strong resistance (Chart I-4). In our view, a washing out of stale shorts would provide a healthy reset for the bear market to resume. Meanwhile, USD/JPY and the DXY change correlations during risk-off periods, where the yen appreciates versus the dollar. Therefore, a market reset is also positive for the yen. Housekeeping Chart I-5Remain Short AUD/MXN
Remain Short AUD/MXN
Remain Short AUD/MXN
We were stopped out of our short AUD/MXN trade last week for a loss of 6.1%. We are reinitiating the trade this week. The case for the trade, made a month ago, remains intact. A short-term recovery in the US economy, relative to the rest of the world, argues for an AUD/MXN short. In fact, a divergence has occurred between the BRL/MXN and the AUD/MXN exchange rate (Chart I-5). Domestic factors have certainly tempered the Brazilian real, but the underperformance of metal prices relative to oil in recent months is also a factor. We expect some convergence to occur, with MXN appreciating much faster than the AUD. Chester Ntonifor Foreign Exchange Strategist chestern@bcaresearch.com Currencies U.S. Dollar Chart II-1USD Technicals 1
USD Technicals 1
USD Technicals 1
Chart II-2USD Technicals 2
USD Technicals 2
USD Technicals 2
Recent data in the US have stepped up: Personal income rose by 10% in January, while personal spending rose by 2.4% month-on-month. The ISM report was stellar. The manufacturing PMI improved from 58.7 to 60.8 in February. Prices paid rose to 86. Factory orders were slightly above expectations at 2.6% month-on-month in January. The DXY index rose by 165 bps this week. The narrative of a counter-trend reversal in the DXY index isn playing out. As the story unfolds, it will be important to establish targets. Our bias is that the DXY stalls before 93-94 is reached. Report Links: Are Rising Bond Yields Bullish For The Dollar? - February 19, 2021 Portfolio And Model Review - February 5, 2021 Sizing A Potential Dollar Bounce - January 15, 2021 The Euro Chart II-3EUR Technicals 1
EUR Technicals 1
EUR Technicals 1
Chart II-4EUR Technicals 2
EUR Technicals 2
EUR Technicals 2
Recent data from the euro area remain weak: Core CPI in the Eurozone came in at 1.1%, in line with expectations. The unemployment rate declined from 8.3% to 8.1% in January. January retail sales were weak at -6.4% year-on-year. The euro fell by 1.7%% against the US dollar this week. It will be almost impossible for the euro to rise in an environment where the dollar is in a broad-based decline. Given elevated sentiment on the euro, a healthy reset is necessary for the bull market to resume. Report Links: Portfolio And Model Review - February 5, 2021 On Japanese Inflation And The Yen - January 29, 2021 The Dollar Conundrum And Protection - November 6, 2020 The Japanese Yen Chart II-5JPY Technicals 1
JPY Technicals 1
JPY Technicals 1
Chart II-6JPY Technicals 2
JPY Technicals 2
JPY Technicals 2
Recent data from Japan has been marginally positive: The employment report was positive, with the unemployment rate dipping to 2.9% and an improvement in the jobs-to-applicants ratio in January. Consumer confidence in February is rebounding from very low levels. The Japanese yen fell by 1.5% against the US dollar this week. The recovery in the Japanese economy is fragile, and tentative signs of a renewed lockdown will knock down confidence. In this transition phase, yen long positions could be hostage to losses. Longer-term, the yen is cheap and will benefit from a broad-based dollar decline. Report Links: On Japanese Inflation And The Yen - January 29, 2021 The Dollar Conundrum And Protection - November 6, 2020 The Near-Term Bull Case For The Dollar - February 28, 2020 British Pound Chart II-7GBP Technicals 1
GBP Technicals 1
GBP Technicals 1
Chart II-8GBP Technicals 2
GBP Technicals 2
GBP Technicals 2
Recent data out of the UK have been in line: Mortgage approvals rose 99K in January, in line with expectations. The construction PMI rose from 49.2 to 53.3 in February. Nationwide house prices are soaring, rising 6.9% in February on a year-on-year basis. The pound fell by 0.8% against the dollar this week. It is however the best performing currency this year. Our short EUR/GBP trade has benefited from faster vaccination in the UK (that could give way to a faster reopening of the economy) and a nice valuation starting point. Report Links: Portfolio And Model Review - February 5, 2021 The Dollar Conundrum And Protection - November 6, 2020 Revisiting Our High-Conviction Trades - September 11, 2020 Australian Dollar Chart II-9AUD Technicals 1
AUD Technicals 1
AUD Technicals 1
Chart II-10AUD Technicals 2
AUD Technicals 2
AUD Technicals 2
Recent data in Australia was robust: Home lending remained in an uptrend. Owner-occupied loans increased by 11% in January, while investor loans increased by 9.4%. Terms of trade are soaring, rising 24% year-on-year in February. The current account surplus came in near a record A$14.5 billion in Q4. GDP grew by 3.1% QoQ in Q4. The Aussie fell by 1.8% his week. Terms of trade will continue being a tailwind for the AUD/USD. We also like the AUD/NZD cross, as a valuation and terms-of-trade bet. However, we expect that any positive surprises in the US will hurt AUD relative to the Americas. One way to play this is by shorting AUD/MXN. Report Links: Portfolio And Model Review - February 5, 2021 Australia: Regime Change For Bond Yields & The Currency? - January 20, 2021 An Update On The Australian Dollar - September 18, 2020 New Zealand Dollar Chart II-11NZD Technicals 1
NZD Technicals 1
NZD Technicals 1
Chart II-12NZD Technicals 2
NZD Technicals 2
NZD Technicals 2
There was scant data out of New Zealand this week: Terms of trade rose by 1.3% in Q4. CoreLogic home prices rose 14.5% in February. The New Zealand dollar fell by 2.4% against the US dollar this week. The kiwi ranks as the most unattractive currency in our FX framework. For one, it has catapulted itself to the most expensive currency in our PPP models. Report Links: Portfolio And Model Review - February 5, 2021 Currencies And The Value-Versus-Growth Debate - July 10, 2020 Updating Our Balance Of Payments Monitor - November 29, 2019 Canadian Dollar Chart II-13CAD Technicals 1
CAD Technicals 1
CAD Technicals 1
Chart II-14CAD Technicals 2
CAD Technicals 2
CAD Technicals 2
Recent data from Canada was positive: The Nanos confidence index rose from 58.2 to 59.4 in February. Annualized 4Q GDP came in at 9.6%, above expectations. Building permits rose 8.2% month-on-month in January. The Canadian dollar fell 0.4% against the US dollar this week. Oil prices remain very much in an uptrend, which is underpinning the loonie. Better US economic performance in the near term should also help the CAD. Report Links: Will The Canadian Recovery Lead Or Lag The Global Cycle? - February 12, 2021 Currencies And The Value-Versus-Growth Debate - July 10, 2020 More On Competitive Devaluations, The CAD And The SEK - May 1, 2020 Swiss Franc Chart II-15CHF Technicals 1
CHF Technicals 1
CHF Technicals 1
Chart II-16CHF Technicals 2
CHF Technicals 2
CHF Technicals 2
Recent data out of Switzerland have been improving: Swiss GDP rose by 0.3% quarter-on-quarter in 4Q. The KOF leading indicator rose from 96.5 to 102.7 in February. The February manufacturing PMI rose from 59.4 to 61.3. Switzerland remains in deflation, with the core CPI that came in at -0.3% year-on-year in February. The Swiss franc fell by 2.6% against the US dollar this week. Safe -haven currencies continue to be laggards, as rates rise and gold falls to the wayside. This is bullish on procyclical currencies, and negative the Swiss franc. We are long EUR/CHF on this basis, but short USD/JPY purely as portfolio insurance. Report Links: Portfolio And Model Review - February 5, 2021 The Dollar Conundrum And Protection - November 6, 2020 On The DXY Breakout, Euro, And Swiss Franc - February 21, 2020 Norwegian Krone Chart II-17NOK Technicals 1
NOK Technicals 1
NOK Technicals 1
Chart II-18NOK Technicals 2
NOK Technicals 2
NOK Technicals 2
The data out of Norway has been robust: The unemployment rate fell from 4.4% to 4.3% The manufacturing PMI increased from 51.8 to 56.1 in February. The current account balance was robust in Q4. It should increase significantly in Q1 this year given the large trade balance in January. Being long the Norwegian krone is one of our high-conviction bets in the FX portfolio. The Norwegian krone fell by 1% against the US dollar this week, but outperformed the euro, amongst other currencies. The NOK ticks all the boxes of an attractive currency – cheap valuations, a liquidity discount, and primed to benefit from a global growth rebound. Report Links: Portfolio And Model Review - February 5, 2021 Revisiting Our High-Conviction Trades - September 11, 2020 A New Paradigm For Petrocurrencies - April 10, 2020 Swedish Krona Chart II-19SEK Technicals 1
SEK Technicals 1
SEK Technicals 1
Chart II-20SEK Technicals 2
SEK Technicals 2
SEK Technicals 2
Most Swedish data releases were in line with expectations: GDP came in at -0.2% quarter-on-quarter, below expectations. Retail sales rose 3.1% year-on-year, above expectations. The trade balance came in at a surplus of SEK 5.2 billion in January. The manufacturing PMI remained elevated at 61.6 in February. The Swedish krona fell by 2.4% against the US dollar this week. Manufacturing data is improving in Sweden but the economy remains hostage to COVID-19, compared to Norway. That is weighing on the krona. That said, Sweden is a highly levered play on the global cycle. Therefore, once the pandemic is behind us, the SEK will outperform. Report Links: Revisiting Our High-Conviction Trades - September 11, 2020 Updating Our Balance Of Payments Monitor - November 29, 2019 Where To Next For The US Dollar? - June 7, 2019 Trades & Forecasts Forecast Summary Core Portfolio Tactical Trades Limit Orders Closed Trades
Highlights We use a correlation-hedge approach to manage emerging market (EM) currency exposure for global investors with nine different home currencies. For USD-based investors, EM debt volatility is driven by the EM spot exchange rate vs. USD. Hedged EM debt has better absolute and risk-adjusted returns than US Treasurys. Investing in EM equities, on the other hand, makes sense only when the expected absolute return is positive on a sustained basis. During these episodes, hedging is not necessary. If USD-based investors choose to manage EM currency exposure directly, then a 12-month momentum-based dynamic hedging strategy could add value in terms of risk-adjusted returns for both EM stocks and bonds. USD-based investors could also diversify the source of funding by selling closely correlated DM currencies using an overlay of currency forwards. For non-USD-based investors, EM currency volatility is low and there is no need to fully hedge EM exposure. Domestic bonds have very low volatility, therefore these investors should avoid EM debt if their objective is to maximize risk-adjusted returns. To enhance returns, unhedged EM equities are a much better choice than EM debt. Currency overlay, in line with our long-held view on the total portfolio approach, should be managed at the total fund level. Feature How to manage EM currency exposure when investing in EM local currency debt and equities has been a frequently asked question since our reports on managing developed market (DM) currency exposure when investing in DM equities 1,2 and government bonds.3 According to the BIS Triennial Central Bank Survey, EM currency exchange markets have evolved rapidly since 2001. The daily turnover reached 1.65 trillion dollars in April 2019, which is about 25% of the global currency daily turnover.4 While it is becoming increasingly easy to trade EM currencies, compared with DM currencies it is still more costly and operationally more challenging to hedge EM currency exposure, especially the currencies with non-deliverable forwards (NDFs) that require collateral management. In this report, we identify the return and volatility drivers of EM local currency government bonds (represented by JP Morgan’s GBI-EM Global Diversified Local Currency Index) and EM equities (represented by MSCI’s EM Net Return Index). We briefly touch on a momentum-based dynamic hedging strategy to hedge EM exposure directly for USD-based investors. Our main focus is to test a correlation-hedge approach, both static and dynamic, for nine home currencies: the US dollar (USD), the euro (EUR), the Japanese yen (JPY), the British pound (GBP), the Canadian dollar (CAD), the Australian dollar (AUD), the New Zealand dollar (NZD), the Swedish krona (SEK), and the Norwegian krone (NOK). We want to determine if a USD-based investor’s return/risk profile would be improved when investing in EM assets by using unfunded overlays of DM currency forwards. Finally, we present solutions for non-USD investors, which vary based on the correlations between the home currencies and the EM currency aggregates. Part 1: The USD Perspective 1.1 EM Asset Return Drivers In general, unhedged USD returns for US investors from investing in foreign assets can be decomposed into three parts as shown in the following equation (1): (1+Rd) = (1+Rh) (1+Rc) (1+Rs) ..…..(1) Where, Rd is the unhedged return in USD. Rh is the hedged return in USD using currency forwards. Rc is the carry return resulting from the short-term rate differential between a foreign country and the US. Rs is the spot exchange rate return of a foreign currency vs. the USD (quoted as how many USD per 1 unit of foreign currency). Chart 1A and Chart 1B show the return decompositions of JP Morgan’s (JPM) EM local currency government bonds and MSCI’s EM equities based on equation (1). Chart 1AEM Local Debt USD Return Decomposition
EM Local Debt USD Return Decomposition
EM Local Debt USD Return Decomposition
Chart 1BEM Equities USD Return Decomposition
EM Equities USD Return Decomposition
EM Equities USD Return Decomposition
Hedging reduces both the volatility and returns for both EM local currency bonds and equities; however, the return and volatility reductions are more significant in bonds than in stocks (panel 1 in Chart 1A and Chart 1B). EM currency aggregate indexes implied from JPM and MSCI are different because of the different country compositions. The currency component has been very volatile for both indexes and has generated negative returns during the 18 years from January 2003 to January 2021 (panel 3 in Chart 1A and Chart 1B). The carry component from JPM is sharply higher than that from MSCI, which is also the result of different country compositions (panel 2, Chart 1A and Chart 1B). The carry components from both indexes have very low volatility with positive returns over the 18-year period. Many EM countries had much higher interest rates than the US, therefore a US investor had to be exposed to EM currencies to capture this carry gain. Thus, from a return-enhancing perspective, an investor should hedge only if he/she expects the EM currency spot exchange rate to depreciate more than the implied carry (panel 3, Chart 1A and Chart 1B). The answer may be different from a volatility-reducing perspective, especially for EM debt where currency volatility dominates bond volatility. We plot the return-risk profiles of EM local currency bonds and equities (hedged and unhedged) in Charts 2A, 2B and 2C to show how they behave in different environments compared to US equities, US Treasurys and hedged non-US global government bonds. Table 1 further lists the detailed statistics of all the above-mentioned assets, in addition to the spot currency and carry components implied from JPM’s EM local currency bond index and MSCI’s EM index, ranked by risk-adjusted return. The entire 18-year period (Chart 2A) is also separated into the period with steadily rising EM currencies (1/2003 – 7/2008, Chart 2B) and the period with declining EM currencies (8/2008-1/2021, Chart 2C). Chart 2AUSD Asset Return-Risk Profile For The Entire Period (1/2003-1/2021)
Managing EM Currency Exposure: A Correlation-Hedge Approach
Managing EM Currency Exposure: A Correlation-Hedge Approach
Chart 2BUSD Asset Return-Risk Profile When EM Currencies Were Strong (1/2003-7/2008)
Managing EM Currency Exposure: A Correlation-Hedge Approach
Managing EM Currency Exposure: A Correlation-Hedge Approach
Chart 2CUSD Asset Return-Risk Profile When EM Currencies Were Weak (8/2008-1/2021)
Managing EM Currency Exposure: A Correlation-Hedge Approach
Managing EM Currency Exposure: A Correlation-Hedge Approach
Both EM debt and equities had impressive unhedged returns in the period from January 2003 to July 2008 when the EM currency index rose steadily against the USD. Even on a hedged basis, EM bonds still delivered better absolute returns (5.1%) than US Treasurys (4.3%) with lower volatility. In terms of EM equities, although hedged return of 22.8% significantly outpaced US equities (9.7%), the volatility of EM equities (16.8%) was much higher than US equities (9.8%). Interestingly, in the period with declining EM FX from August 2008 to January 2021, hedged EM equities (5.6%) significantly underperformed US equities (11.5%) with comparable volatility, but hedged EM bonds (4.2%) outperformed US Treasurys (3.6%) with comparable volatility, despite the negative carry. It is easy to make the case for EM equities: US investors should not touch EM equities unless they are convinced that EM is entering a sustainably strong absolute return period. There is no need to hedge the currency exposure because the risk reduction is relatively small. In the case of EM local currency debt, the three components of total returns in USD based on equation (1) have distinct characteristics as follows: First, the carry component generated an annualized return of 3.4% with only 0.7% volatility in the entire period, making it the best performer among all the assets in terms of risk-adjusted return, as shown in Table 1. Table 1USD Asset Return-Risk Profile In Different Time Periods
Managing EM Currency Exposure: A Correlation-Hedge Approach
Managing EM Currency Exposure: A Correlation-Hedge Approach
Chart 3What Drives The Hedged Return Of EM Local Debt?
What Drives The Hedged Return Of EM Local Debt?
What Drives The Hedged Return Of EM Local Debt?
Second, the hedged return or the EM duration return (i.e. the compensation for a US investor to take on EM interest rate and term premia risks), had a better return/risk profile than US Treasurys in terms of both absolute return and risk-adjusted return, regardless of whether the EM currency index rose or fell against the USD. From January 2003 to January 2021, hedged EM debt returned 4.5% with a volatility of 4.1%, giving a 1.1 return per unit of risk, while US Treasurys returned 3.8% with a volatility of 4.3%, resulting in a 0.9 return per unit of risk. This component is mainly driven by the direction of government bonds in the developed markets as shown in Chart 3. Third, from January 2003 to January 2021, the JPM-implied EM currency had the worst return/risk profile with an annualized loss of 1.7% and annualized volatility of 9.1% (Table 1). However, this component was also the most regime-dependent. Between January 2003 and July 2008 it registered an annualized gain of 7.0% and an annualized volatility of 6.2%, in contrast with the annualized loss of 5.2% and annualized volatility of 9.9% from August 2008 to January 2021. Historically, the EM currency as an aggregate, no matter how the aggregate is calculated, closely correlates to commodities as shown in Chart 4. This is because many EM countries are either commodity producers or have significant trading exposure to China, the dominant player influencing commodity prices as shown in Chart 5. Chart 4EM FX Largely Driven By Commodities
EM FX Largely Driven By Commodities
EM FX Largely Driven By Commodities
Chart 5The Commodities-China Link
The Commodities-China Link
The Commodities-China Link
It is a challenge to build a systematic EM currency model due to the complex nature of EM economies. BCA’s FX Strategy team is working on EM currency models by applying the same approach they used for their DM models. BCA’s EMS Strategy team takes a more discretionary approach to forecasting currencies. Below we will explore two options: one for investors who choose to manage an EM FX hedging program directly and another for investors who cannot manage a direct EM currency hedging program but want to improve their return-risk profile in EM assets. 1.2 Momentum-Based Dynamic Hedging Of EM Currencies Price momentum is a useful tool for dynamic hedging as shown in our previous work on DM currency exposure management. A simple rule of hedging back to the home currency when the 12-month price momentum of a foreign currency turns negative adds value for investors with several DM home currencies. Given that the USD is a strong momentum currency, it makes sense to test if a simple 12-month price momentum rule for the EM FX aggregate vs. USD adds any value. The results are encouraging as shown in Chart 6A and Chart 6B and Chart 7A and Chart 7B. Chart 6AMomentum-Based Dynamic Hedging For EM Bonds
Momentum-Based Dynamic Hedging For EM Bonds
Momentum-Based Dynamic Hedging For EM Bonds
Chart 6BMomentum-Based Dynamic Hedging For EM Stocks
Momentum-Based Dynamic Hedging For EM Stocks
Momentum-Based Dynamic Hedging For EM Stocks
In the case of EM local debt, dynamic hedging reduced volatility to 8.4% from an unhedged volatility of 11.7%, while only trimming return slightly compared with the unhedged index (Charts 6A, 7A). For EM equities, dynamic hedging cut volatility to 18.6% from the unhedged volatility of 21.1%, while increasing the return by 25 bps, compared to the unhedged index. (Charts 6B, 7B). Chart 7AEM Local Debt Return-Risk Profiles: Static Hedging* Vs. Dynamic Hedging**
Managing EM Currency Exposure: A Correlation-Hedge Approach
Managing EM Currency Exposure: A Correlation-Hedge Approach
Chart 7BEM Equities Return-Risk Profiles: Static Hedging* Vs. Dynamic Hedging**
Managing EM Currency Exposure: A Correlation-Hedge Approach
Managing EM Currency Exposure: A Correlation-Hedge Approach
These results are directionally encouraging, but this method still requires hedging all EM currencies. The approach may operationally challenge investors who are not equipped to manage EM currency overlays. Bottom Line: Using only price momentum to hedge EM currency aggregates could improve the return-risk profile of both EM debt and equities, even though the improvements would be limited. This is encouraging for our eventual systematic approach for direct EM currency hedging. 1.3 Correlation Hedge Using DM Currencies EM FX is closely correlated with DM commodity currencies, such as the NOK, CAD, AUD, and NZD. As shown in Charts 8A and 8B, even the euro has an average correlation greater than 60% with EM currency aggregates. Only the JPY has an unstable correlation with the EM currencies of less than 25%, while the GBP also has a relative lower correlation. Chart 8AJPM-Implied EM FX* Correlation** With DM FX
JPM-Implied EM FX* Correlation** With DM FX
JPM-Implied EM FX* Correlation** With DM FX
Chart 8BMSCI-Implied EM FX* Correlation** With DM FX
MSCI-Implied EM FX* Correlation** With DM FX
MSCI-Implied EM FX* Correlation** With DM FX
Therefore, a USD-based investor, instead of hedging out EM currency exposure directly, should be able to eliminate part of EM currency volatility by selling lower-yielding DM currencies. This move would diversify his/her source of funding from USD to other DM currencies with high correlations with EM currencies. To test the effect on the return-risk profile, we use an unfunded overlay of 1-month DM currency forwards and rebalance monthly. To begin, we test a static correlation hedge where each of the eight DM currencies is sold individually. Then we test a dynamic correlation hedge where each one is dynamically sold based on the BCA Forex Strategy Team’s Intermediate-Term Timing Model (ITTM), which uses the same indicators described in our DM currency hedging report. To avoid subjective selection bias among the currencies, we also test an equally- weighted basket of eight currencies (AUD, NZD, JPY, GBP, EUR, CAD, NOK, and SEK) for dynamic hedging and an equally- weighted basket of five currencies (GBP, EUR, CAD, NOK, and SEK) for static hedging. The AUD, NZD, and JPY were excluded in the static hedging basket because in general, AUD and NZD had very high carries and JPY had an unstable correlation with EM currencies. The combined results are shown in Chart 9A and Chart 9B. Additionally, Table 2A and Table 2B list the return-risk profiles together with the fully hedged and unhedged EM indexes for equities and local debt. Chart 9AStatic Correlation Hedge For US Investors
Static Correlation Hedge For US Investors
Static Correlation Hedge For US Investors
Chart 9BDynamic Correlation Hedge For US Investors
Dynamic Correlation Hedge For US Investors
Dynamic Correlation Hedge For US Investors
Table 2AEM Debt Funding Source Diversification For USD-Based Investors (2/2003-1/2021)
Managing EM Currency Exposure: A Correlation-Hedge Approach
Managing EM Currency Exposure: A Correlation-Hedge Approach
Table 2BEM Equity Funding Source Diversification For USD-Based Investors (2/2003-1/2021)
Managing EM Currency Exposure: A Correlation-Hedge Approach
Managing EM Currency Exposure: A Correlation-Hedge Approach
For US investors investing in EM local currency bonds, the best risk-adjusted return of 1.08 would come from fully hedging all the EM currencies as shown in Table 2A. Fully-hedged EM debt has the lowest volatility (4.12%), but also the lowest return (4.45%). To achieve a comparable return of unhedged EM debt (6.18%) without incurring the same high volatility (11.71%), however, a USD-based investor could either statically sell the five DM currencies or dynamically sell the eight DM currencies. The resulting risk-adjusted return of 0.8 would still be comparable to US Treasurys as shown in Table 1. US investors investing in EM equities may improve their return-risk profile by funding their positions in DM currencies. If the aim is to maximize risk-adjusted returns, then the choice would be to fund the position by selling the basket of equally weighted five DM currencies using currency forwards (i.e. using a static correlation hedge). In this way, they would achieve a comparable volatility (16.25%) as if all the EM currencies were fully hedged to USD (16.29%), while also achieving a higher return (12.29%) than when all the EM currencies were not hedged (11.71%). The return per unit of risk of 0.76 would be the highest among all the cases as shown in Table 2B and be on par with US equities as shown in Table 1. If investors prefer even higher returns without significantly higher volatility, then dynamically selling an equally weighted basket of eight currencies would achieve an annualized return of 13.03% with a higher volatility of 18.71%, resulting in a risk-adjusted return of 0.7. Bottom Line: USD-based asset allocators should use the hedged EM debt index and the unhedged EM equities index as benchmarks to measure the performance of their asset-class managers. The EM currency exposure should be managed in a currency overlay at the total fund level by either statically or dynamically selling DM currencies using a correlation hedge, depending on the return-risk preferences. Part 2: Non-USD-Perspective Six out of the eight non-USD DM currencies have strong positive correlations with EM currencies as shown in Chart 8A and Chart 8B. Therefore, non-USD investors investing in EM assets should naturally experience less spot-currency volatility (Chart 10A and Chart 10B). Consequently, they do not need to hedge EM currency exposure from a volatility perspective. But what about return enhancement? Should they consider an allocation to EM assets in place of domestic assets? If they do, would the correlation-hedge approach used by USD-based investors benefit them too? Chart 10ADM Currency Per Unit Of EM Currency
DM Currency Per Unit Of EM Currency
DM Currency Per Unit Of EM Currency
Chart 10BDM Currency Per Unit Of EM Currency
DM Currency Per Unit Of EM Currency
DM Currency Per Unit Of EM Currency
To find answers to those questions, we compare the return-risk profiles of domestic assets, unhedged EM assets, and correlation-hedged EM assets in Table 3A and Table 3B. For the correlation-hedged results for non-USD investors, we simply use the results for the US investors converted into the non-USD home currencies at spot exchange rates. This way, the return enhancements from the correlation-hedged EM assets compared to the unhedged EM assets would be similar for all nine currencies. Chart 3AEM-Debt* For Non USD-Based Investors
Managing EM Currency Exposure: A Correlation-Hedge Approach
Managing EM Currency Exposure: A Correlation-Hedge Approach
Table 3BEM-Stocks* For Non USD-Based Investors
Managing EM Currency Exposure: A Correlation-Hedge Approach
Managing EM Currency Exposure: A Correlation-Hedge Approach
We find that non-USD investors would do better to avoid local-currency EM debt if their objective is to maximize risk-adjusted returns because domestic government bonds had unbeatably low volatility, resulting in the highest risk-adjusted returns, as shown in Table 3A. But domestic government bonds had lower returns than unhedged EM bonds for all but AUD- and NZD-based investors. To further enhance the return-risk profile, non-USD investors could follow their US counterparts by dynamically diversifying their funding sources, then converting their USD returns into their home currency at spot exchange rates (i.e. not hedging the USD exposure). GBP- and JPY-based investors would benefit the most from a dynamic correlation hedge with higher returns and lower volatility compared with the unhedged case. In the case of EM equities, other than SEK- and NZD-based investors, unhedged EM equities have higher returns on an absolute and risk-adjusted basis compared with domestic equities, with GBP-, JPY- and euro-based investors benefiting the most (Table 3B). Even though NOK-based investors increased their returns by only 1% by putting funds into unhedged EM equities, they enjoy lower volatility than in domestic equities. Unlike the case for EM debt where a static correlation hedge did not improve over an unhedged case, both static and dynamic correlation hedges improve the return/risk profiles relative to the unhedged case, and the dynamic hedge outperforms the static hedge in each country. While domestic equities underperform domestic government bonds in terms of risk-adjusted returns, EM equities outperform EM local currency debt when a dynamic correlation hedge is applied. Even in the unhedged case, EM equities are still a much better choice than EM debt (Chart 11). To evaluate how this could impact an asset allocation, we replace home equity with EM equities in a 60/40 home equity/Treasury portfolio. In this extreme exercise, six of the eight non-USD-based portfolios could generate better return/risk profiles, with only the NZD- and SEK-based portfolios worse off (Chart 12). Chart 11Risk-Adjusted Return: Stocks Minus Bonds
Managing EM Currency Exposure: A Correlation-Hedge Approach
Managing EM Currency Exposure: A Correlation-Hedge Approach
Chart 12Asset Allocation Implications*
Managing EM Currency Exposure: A Correlation-Hedge Approach
Managing EM Currency Exposure: A Correlation-Hedge Approach
Bottom Line: Non-USD-based investors should avoid EM local debt if their objective is to maximize their risk-adjusted returns. For the purposes of return enhancement, EM equities are a much better choice than EM debt for all investors with the exception of those based in New Zealand and Sweden. Xiaoli Tang Associate Vice President xiaolit@bcaresearch.com Footnotes 1,2Please see Global Asset Allocation Special Reports, “Currency Hedging: Dynamic Or Static? - A Practical Guide For Global Equity Investors,” dated September 29, 2017; and "Currency Hedging: Dynamic Or Static? - A Practical Guide For Global Equity Investors (Part II)," dated October 13, 2017. 3 Please see Global Asset Allocation Special Reports, “Why Invest In Foreign Government Bonds?” dated March 12, 2018. 4 Please see "Triennial Central Bank Survey Foreign exchange turnover in April 2019," Bank for International Settlements, dated 16 September 2019.