Emerging Markets

Highlights The Biden administration will not attempt a major diplomatic “reset” with Russia. The era of engagement is over. Russia faces rising domestic political risk and rising geopolitical risk at the same time. A war in the Baltics is possible but unlikely. Putin has benefited from taking calculated risks and wants to keep the US and Europe divided. The Russian economy is weighed down by structural flaws as well as tight policy. Investors focused on absolute returns should sell Russian assets. For EM-dedicated investors, our Emerging Markets Strategy recommends a neutral allocation to Russian stocks and local currency bonds and an overweight allocation to US dollar-denominated sovereign and corporate debt. Feature “We will not hesitate to raise the cost on Russia.” – US President Joseph R. Biden, State Department, February 4, 2021 The Biden presidency will differ from its predecessors in that there will not be a major attempt to engage Russia at the outset. Previous US presidents sought to reach out to their Russian counterparts to create room for maneuver. This was true of Presidents Reagan, Clinton, Bush, Obama, and Trump. Even Biden has shown a semblance of reengagement by extending an arms reduction pact. But investors should not be misled. The United States and the Democratic Party have shifted their approach to Russia since the failure of the diplomatic “reset” that occurred in 2009-11 and Washington will take a fundamentally more hawkish approach. Russia is not Biden’s top foreign policy focus – that would be Iran and China. But as with China, engagement has given way to Great Power struggle and hence there will not be a grace period before geopolitical tensions re-escalate. Tensions will keep the risk premium elevated for Russia’s currency and assets. The same is true of emerging European markets that get caught up in any US-Russia conflicts. Putin, Biden, And Grand Strategy Understanding US-Russia relations in 2021 requires a brief outline of both the permanent and temporary strategies of the United States and Russia. Russia’s grand strategy over the centuries has focused on establishing a dominant central government, controlling as large of a frontier as possible, and maintaining a high degree of technological sophistication. The nightmare of the Russian elite consists of foreign powers manipulating and weaponizing the country’s extremely diverse peoples and territories against it, reducing the world’s largest nation-state to its historical origin as a geographically indefensible and technologically backward principality. Chart 1Russia's Revival In Perspective
Russia's Revival In Perspective
Russia's Revival In Perspective
Russia can endure long stretches of austerity in order to undermine and outlast rival states in this effort to achieve defensible borders. Russia’s strategy since the rise of President Vladimir Putin has focused on rebuilding the state and military after the collapse of the Soviet Union so as to restore internal security and re-establish political dominance in the former Soviet space (Chart 1). Partial invasions of Georgia and Ukraine and a military buildup along the border with the Baltic states show Russia’s commitment to prevent American or US-allied control of strategic buffer spaces. Expansion of the North Atlantic Treaty Organization (NATO) and the European Union poses an enduring threat to Putin’s strategy. Putin has countered through conventional and nuclear deterrence as well as the use of “hybrid warfare,” trade embargoes, cyberattacks, and disinformation. To preempt challengers within the former Soviet space Russia also maintains a “veto” over geopolitical developments outside that space, as with nuclear proliferation (Iran), civil wars (Syria, Libya), or resource production (OPEC 2.0). The evident flaw in Putin’s strategy is the decay of the economy, the long depreciation of the ruble, and the drop in quality of life and labor force growth. See the macro sections below for a full discussion of these negative trends. Compare the American strategy: America’s grand strategy is to control North America, dominate the oceans, prevent the rise of regional empires, and maintain the leading position in technology and talent. A nightmare for American policymakers would be a collapse of the federal union among the disparate regions and the rise of a secure foreign empire that could supplant the US’s naval preponderance. This is especially true if the rival empire were capable of supplanting US supremacy in technology, since then the US would not even be safe within North America. America’s strategy under the Biden administration is to mitigate internal political divisions through economic growth, maintain its global posture by refurbishing alliances, and reassert its technological primacy by encouraging immigration and trade. The status quo of strong growth and rising polarization has been beneficial for US technology but not for foreign and defense policy (Chart 2). Political polarization has prevented the US from executing a steady long-term strategy for over 30 years. As a result, Russia has partially rebuilt the Soviet sphere of influence and China is constructing a sphere of its own. A few conclusions can be drawn from the above. First, China poses a greater challenge to the US than Russia from a strategic point of view. China is capable of creating a regional empire that can one day challenge the US for technological leadership. Modern Russia must summon all its strength to carve out small pieces of its former empire – it is not a contender for supremacy in technology or in any regions other than its own. Second, however, Russia’s resurgence under Putin poses a secondary challenge to American grand strategy. Russia can undermine US strategy very effectively. The effect today is to aid the rise of China, on which Russia’s economy increasingly depends (Chart 3). Chart 2US Tech Boom Coincided With Disinflation, Polarization
US Tech Boom Coincided With Disinflation, Polarization
US Tech Boom Coincided With Disinflation, Polarization
Chart 3Russia’s Turn To The Far East
Biden And Russia: No Diplomatic "Reset" This Time
Biden And Russia: No Diplomatic "Reset" This Time
Unlike the US, Russian leadership has not changed over the past year – and Vladimir Putin’s tactics are likely to be consistent. These were underscored by the constitutional revisions approved by popular vote in September 2020. Not only will Putin be eligible to remain president till 2036 but also Russia reaffirmed its willingness to intervene militarily into neighboring regions by asserting its right to defend Russian-speaking peoples everywhere. Finally, Russia ensured there would be no giving away of territories, thus ruling out a solution on Ukraine over Crimea.1 Bottom Line: The US-Russia conflict will continue under the Biden administration, even though Biden’s primary concern will be China. Biden’s Foreign Policy Intentions It is too soon to draw conclusions about Biden’s foreign policy “doctrine” as he has not yet faced any major challenges or taken any major actions. Biden’s first two foreign policy speeches and interim national security strategy guidance establish his foreign policy intentions, which will have to be measured against his administration’s capabilities.2 His chief intentions are to revive the economy and court US allies: First, Biden asserts that every foreign action will be taken with US working families in mind, co-opting Trump’s populism and emphasizing that US international strength rests on internal unity which flows from a strong economy. This goal will largely be met as the administration is already passing a major economic stimulus and is likely to pass a second bill with long-term investments by October. The impact on Russia is mixed but the Biden administration is largely correct that a strong recovery in the US economy and reduction in political polarization will be a major asset in its dealings with Russia and other rivals. Second, Biden asserts that diplomacy will be the essence of his foreign policy. He aims to create or rebuild an alliance of democracies that spans from the UK and European Union to the East Asian democracies. The two goals of economy and diplomacy are connected because Biden envisions the democracies working together to make “historic investments” in technology, setting global standards and rules of trade, and defending against hacking and intellectual property theft. This goal will have mixed success: the EU and US will manage their own trade tensions reasonably well but they will disagree on how to handle Russia and especially China. Biden explicitly sets up this alliance of democracies against autocracies. He calls China the US’s “most serious competitor” but also highlights Russia: “The challenges with Russia may be different than the ones with China, but they’re just as real.”3 Table 1 shows the Biden administration’s notable comments and actions on Russia so far. What is clear is that the US will not seek an extensive new diplomatic engagement with Russia.4 The failure of the Obama administration’s “diplomatic reset” with Russia has disabused the Democratic Party of the notion that strategic patience and outreach are the right approaches to Putin’s regime. The reset and its failure are described in detail in Box 1. Table 1Biden Administration's First 100 Days: Key Statements And Actions On Russia
Biden And Russia: No Diplomatic "Reset" This Time
Biden And Russia: No Diplomatic "Reset" This Time
Box 1: What Was The US-Russia Diplomatic Reset? What Comes Next? Most American presidents open their foreign policy with overtures to Russia to create space to maneuver, given that Russia is capable of undermining US aims in so many areas. The Barack Obama administration made a notable effort at this in 2009, which was dubbed the “diplomatic reset.” It was a rest because relations had collapsed over Russia’s use of natural gas pipelines as a weapon against Ukraine and especially its invasion of Georgia in 2008. Then Vice President Joe Biden led the reset. President Putin had stepped aside in accordance with constitutional term limits, putting his protégé Dmitri Medvedev in the presidential seat, which supported the reset because Medvedev had at least some desire to reform Russia’s economy. The reset lasted long enough for Washington and Moscow to agree on the need for a strategic settlement on the question of Iran – which would culminate in the 2015 nuclear deal – as well as to admit Russia to the World Trade Organization (WTO). But the aftermath of the financial crisis proved an inauspicious time for a reset. Along with the Arab Spring, popular unrest emerged in Moscow in 2011 and western influence crept into Ukraine – all of it allegedly fomented by Washington. Putin feared he would lose central control at home and frontier control abroad. He also sensed an opportunity given that commodity prices were filling state coffers while the US was focused on domestic policy, increasingly polarized, and unwilling to make the sacrifices necessary to solidify its influence in eastern Europe. Russia’s betrayal of the reset resulted in a string of losses for the US and its European allies: the Edward Snowden affair, the invasion of Ukraine, the intervention in Syria, the meddling in the 2016 US election, and most recently the SolarWinds hack. The Obama administration refrained from a strong reaction over Crimea partly to seal the Iran deal. But Russia pressed its advantage after that. It is doubtful that Russia’s influence decided the 2016 election but, regardless, the Democratic Party fell from power and then watched in dismay as the Trump administration revoked the Iran deal. Now that the Democrats are back in power they will seek to retaliate not only for the SolarWinds hack but also for the betrayal of the reset. However, retaliation will come at a time of Washington’s choosing. Bottom Line: The Biden administration’s foreign policy will emphasize alliances of democracies in opposition to autocracies like Russia and China. Biden is planning a more hawkish approach to Russia than previous recent administrations. Biden’s Foreign Policy Capabilities There are a few clear limitations on Biden’s foreign policy goals. First, his administration will largely be focused on domestic priorities. In foreign affairs there is at best the chance to salvage the Obama administration’s foreign policy legacy. Second, Biden’s dealings with China will take up most of his time and energy. China’s fourteenth five-year plan contains a state-driven technological Great Leap Forward that will frustrate any attempt by Biden to reduce tensions. Biden will not be able to devote much attention to Russia if he pursues China with the attention it deserves, i.e. to secure US interests yet avoid a war.5 Third, Biden will be limited by allied risk aversion and the need for consensus on difficult decisions. If his diplomacy with Europe is successful then China and Russia will face steeper costs for any provocative actions. If it fails then European risk aversion will prevail, the allies will remain divided, and China and Russia will faces few costs for maintaining current policies. Table 2Russia’s Pipeline Export Capacity
Biden And Russia: No Diplomatic "Reset" This Time
Biden And Russia: No Diplomatic "Reset" This Time
The Nordstream Two pipeline will be a key test of European willingness to follow the US’s lead even if it means taking on greater risks: Nordstream Two is a major expansion of Russian-EU energy cooperation but contrary to America’s national interest. German Chancellor Angela Merkel still backs the project despite Russia’s poisoning and imprisonment of dissident Alexei Navalny and forceful suppression of protests. However, Merkel is a lame duck and there is some evidence that German commitment to the project is fraying.6 Biden has not tried to halt the pipeline project, but he still could. There are only 100 miles left to the pipeline. Construction resumed in January after a hiatus last year due to US sanctions. The project will take five months to complete at the rate of 0.6 miles per day. The Biden administration still has time to halt the project through sanctions. If it does, the Russians will react harshly to this significant loss of economic and strategic influence over Europe (Table 2). Biden will have a crisis on his hands in Europe. If Biden does nothing on Nordstream, then Russia will conclude that his administration is not serious and take actions that undermine the Biden administration in accordance with Putin’s established strategy. This would prompt Biden to act on his pledge to stand up to Putin’s provocations. Whereas if Biden imposes sanctions to halt Nordstream, Russia will retaliate. Elsewhere it is possible that Biden will be too confrontational with Russia for Europe’s liking. Biden plans to increase support for Ukraine, which will prompt an increase in military conflict this spring.7 The US will promote democracy across eastern Europe, including Belarus, and it is possible that Russia could overreact to this threat of turning peripheral regimes against Russia. The EU is on the front lines in the conflict with Russia and will not want the US to act aggressively – but the US is specifically seeking to “raise the cost” on Russia for its aggression.8 Bottom Line: Russia is not Biden’s priority. But his pledge both to promote democracy and retaliate against Russian provocations sets the US up for a period of higher tensions. US-Russia Engagement On Iran? Will the US not need to engage Russia to achieve various policy goals? Specifically, while highlighting competition, Biden says he will engage Russia and China on global challenges, namely the pandemic, climate change, cybersecurity, and nuclear proliferation. Nuclear proliferation is the only one of these areas where US-Russia cooperation might matter. After all, there is zero chance of cybersecurity cooperation. Whereas on nuclear issues, the US and Russia immediately extended the New START arms reduction treaty through 2026 and could also work together on Iran. Biden is determined to restore the Obama administration’s 2015 nuclear deal. Moscow does not have an interest in a nuclear-armed Iran so there is some overlap of interest. The Iranian issue will require Biden to consider whether he is willing to make major concessions to Russia: Compromise the hard line on Russia: A new Iranian administration takes office in August. Biden is likely to have to rush a return to the 2015 nuclear deal before that time if he wants a deal with Iran. Otherwise it would take years for Biden and the Europeans to reconstitute the P5+1 coalition with Russia and China and negotiate an entirely new deal. Biden would have to make major concessions to Russia and China. His stand against autocracy would be compromised from the get-go. Maintain the hard line on Russia: The alternative is for Biden to rejoin the 2015 nuclear deal with a flick of his wrist, with Iranian President Hassan Rouhani signing off by August. Biden would extract promises from the Iranians to keep talking about a broader deal in future. In this case Biden would not need to give the Russians or Chinese any new concessions. Chart 4China Enforces Iran Sanctions
China Enforces Iran Sanctions
China Enforces Iran Sanctions
The Biden administration will be keen to make sure that Russia does not exploit the US eagerness for a deal with Iran as it did with the original deal in 2014-15. Iran has an individual interest in restoring the deal, which is to gain sanction relief and avoid air strikes. The Europeans have helped Iran keep the deal alive. China is at least officially enforcing sanctions (Chart 4). Russia is also urging a return to the deal and would be isolated if it tried to sabotage the deal. This could happen but it would escalate the conflict between the US and Russia. Otherwise, if a deal is agreed, the US will continue putting pressure on Russia in other areas. Bottom Line: The Biden administration is likely to seal an Iranian nuclear deal without any major concessions to Russia. Tail Risk – A War In The Baltics? It is well established that the Putin regime will use belligerent foreign adventures to distract from domestic woes. Just look at poor opinion polling tends to precede major foreign invasions (Chart 5). With the eruption of social unrest in the wake of COVID-19 and the imprisonment of opposition leader Alexei Navalny, it is entirely possible that Russia will activate this tool again. The implication is a new crisis in Ukraine, a larger Russian military presence in Belarus, or further escalation of hybrid warfare or cyberwar in other areas. What about an invasion of the Baltic states of Latvia, Lithuania, and Estonia? Unlike other hotspots in Russia's periphery this is a perennial "black swan" risk that would equate with a geopolitical earthquake in Europe. A Baltic war is conceivable based on Russia’s geographic proximity, military superiority, and military buildup on the border and in the Kaliningrad exclave. The combined military spending of NATO dwarfs that of Russia but NATO is extremely vulnerable in this far eastern flank (Chart 6). However, Europe would cutoff Russia’s economy and join the US in countermeasures while Russia would be left to occupy hostile countries.9 Chart 5Putin Lashes Out When Popularity Falls
Putin Lashes Out When Popularity Falls
Putin Lashes Out When Popularity Falls
The Baltic states are members of NATO and thus an attack on one is theoretically an attack on all. President Trump ultimately endorsed Article V of the NATO treaty on collective self-defense and President Biden has enthusiastically reaffirmed it. The guarantee is meaningless without greater military support to enforce it, so NATO could try to reinforce its forward presence there. This could provoke Russia to retaliate, likely with measures short of full-scale war. Chart 6Russia Would Be Desperate To Invade Baltics
Biden And Russia: No Diplomatic "Reset" This Time
Biden And Russia: No Diplomatic "Reset" This Time
Since the wars in Iraq and Afghanistan, US rivals have observed that the American public lacks the willingness to fight small wars. It responded weakly to Russia’s invasion of Crimea and China’s encroachments in the South China Sea and Hong Kong. However, foreign rivals do not know whether the unpredictable US leadership and public are willing to fight a major war. Hence Russia and China are likely to continue to focus on incremental gains and calculated risks rather than frontal challenges. Based on the Biden administration’s moderate political capital (very narrow electoral and legislative control), the US will continue to be divided and distracted. Russia, China, and other powers will test the administration and make an assessment before they attempt any major foreign adventures. The testing period is imminent, however, and thus holds out negative surprises for investors. It is also possible that Biden could make the first move – particularly on Russia, where retaliation for the 2020 SolarWinds hack should be expected. Bottom Line: A full-scale war in the Baltics is possible but unlikely as the Russians have succeeded through calculated risks whereas they face drastic limitations in a major war against the NATO alliance. Growth Weighed Down By Tight Policy We now turn to Russia’s domestic economic conditions. Here, Russia also faces major challenges. Authorities are determined to keep a tight lid on both monetary and fiscal policies. In particular, high domestic borrowing costs and negative fiscal thrust will weigh down domestic demand over the next six-to-12 months. There are three reasons authorities will maintain tight monetary and fiscal policies: First, concerns about high inflation are deeply entrenched among consumers, enterprises, and policymakers. Russian consumers and businesses tend to have higher-than-realized inflation expectations. This is due to the history of high inflation as well as stagflation in Russia. A recent consumer poll reveals that rising prices are the number one concern among households (Table 3). Remarkably, the poll was conducted in August amid the height of the pandemic and high unemployment. This suggests that households do not associate growth slumps with lower inflation but rather fear inflation even amid a major recession (i.e., worry about stagflation). Table 3Fear Of Inflation Prevalent Amongst Consumers’ Expectations
Biden And Russia: No Diplomatic "Reset" This Time
Biden And Russia: No Diplomatic "Reset" This Time
Second, Central Bank of Russia Governor Elvira Nabiullina is one of the most hawkish central bankers in the world. Her early tenure was characterized by the 2014-15 currency crisis and a major inflation spike. To combat structural inflation and bring down persisting high inflation expectations, the central bank has adopted a very hawkish policy stance since 2014. There is no sign that the central bank is about to change its hawkish policy. Specifically, monetary authorities have been syphoning liquidity from the banking system. With relatively tight banking system liquidity and high borrowing costs, private credit growth will fail to accelerate from current levels. Third, the government still projects an austere budget for 2021. The fiscal thrust will be -1.7% of GDP this year (Chart 7). While a moderate spending increase is likely, it will not be sufficient to boost materially domestic demand. There are no signs yet that the fiscal rule10 will be further relaxed, potentially releasing more funds for the government to spend this year. The fiscal rule has become an important gauge of the country’s ability to weather swings in energy prices. In addition to the points listed above, policymakers’ inflation worries stem from the economy’s structural drawbacks: Despite substantial nominal currency depreciation in recent years, Russia runs a current account deficit excluding energy. When a country runs a chronic current account deficit, including periods of major domestic demand recessions and currency devaluations, it is a symptom of a lack of productivity gains. Real incomes grew at a quick pace from the mid-1990s, largely driven by the resource boom in the 2000s. Yet rising real incomes were not complemented by expanding domestic manufacturing capacity to produce consumer and industrial goods. As such, imports of consumer goods and services rose alongside real incomes. Russia has been underinvesting. Gross fixed capital formation excluding resources industries and residential construction has never surpassed 10% of GDP in either nominal or real terms (Chart 8). Chart 7Russia: Fiscal Policy Will Remain Austere In 2021
Russia: Fiscal Policy Will Remain Austere In 2021
Russia: Fiscal Policy Will Remain Austere In 2021
Chart 8Russia: Underinvestment Within Domestic Sectors
Russia: Underinvestment Within Domestic Sectors
Russia: Underinvestment Within Domestic Sectors
Geopolitical tensions with the West have discouraged FDI inflows and hindered Russian companies’ ability to raise capital externally. This has inhibited capital spending and ”know-how” transfer and, hence, bodes ill for productivity gains. Russian domestic industries are highly concentrated and, in some cases, oligopolistic in nature. This allows incumbents to raise prices. The number of registered private enterprises has fallen below early 2000s levels (Chart 9). Despite chronic currency depreciation, Russian resource companies have failed to grab a large share of their respective export markets. For instance, Russia’s oil market share of total global oil production has been flat for over a decade and the nation has been losing market share in the global natural gas industry. A shrinking labor force due to poor demographics and meager immigration complements Russia’s sluggish productivity growth and caps its potential GDP growth (Chart 10). Chart 9Russia: Increasing Industry Concentration
Russia: Increasing Industry Concentration
Russia: Increasing Industry Concentration
Some positive signs are appearing in the form of import substitution. Since the Ukraine conflict in 2014 and the resulting Western sanctions, the government has enacted various laws and decrees to incentivize domestic production, and with it providing substitutions for imported goods. Their impact is noticeable in certain sectors. Chart 10Russia: Poor Potential Growth Outlook
Russia: Poor Potential Growth Outlook
Russia: Poor Potential Growth Outlook
In particular, the country has invested heavily in the food industry, as food imports are 16% of overall imports. Agricultural sector output has been rising while imports of key food categories have declined. Recent decrees on industrial goods will likely boost domestic production of some goods and processed resources. Around 40% of Russian imports are concentrated in machinery, industrial equipment, transportation parts, and vehicles. Hence, raising competitiveness in production of industrial goods is essential for Russia to reduce reliance on imports. In short, fewer imports of goods for domestic consumption will make inflation less sensitive to fluctuations in the exchange rate. The current trend is mildly positive, but its pace remains slow. Bottom Line: Russia needs to raise its productivity and labor force growth and, hence, potential GDP growth to deliver reasonable high-income growth without raising inflation. The Cyclical OutLook: Worry About Growth, Not Inflation Cyclically, high domestic borrowing costs and lackluster fiscal spending will weigh down domestic growth and cap inflation for the next 12 months. Russia’s real borrowing costs are among the highest in the EM space. High borrowing costs are causing notable financial stress amongst corporate and household debtors. Commercial banks’ NPLs and provisions are high and rising (Chart 11). Unwilling to take on more credit risk, banks have shunned traditional lending and have instead expanded their assets into financial securities. This trend will likely persist and corporate and consumer credit will fail to boost investment and consumption. The recent pickup in inflation was primarily due to rising food prices and the previous currency depreciation pass-through. Chart 12 illustrates the recent currency appreciation heralds a rollover in core inflation. Chart 11Russia: High Borrowing Costs Are Leading To Higher Credit Stress
Russia: High Borrowing Costs Are Leading To Higher Credit Stress
Russia: High Borrowing Costs Are Leading To Higher Credit Stress
Chart 12Russia: Inflation Will Rollover Due To Stable RUB
Russia: Inflation Will Rollover Due To Stable RUB
Russia: Inflation Will Rollover Due To Stable RUB
In fact, a broad range of inflation indicators suggest that core inflation remains within the central bank target (Chart 13). These measures of inflation are less correlated with the ruble movements. Chart 13Russia: Inflation Is At Central Bank Target Of 4%
Russia: Inflation Is At Central Bank Target Of 4%
Russia: Inflation Is At Central Bank Target Of 4%
Chart 14Russia: Tame Recovery In Domestic Activity
Russia: Tame Recovery In Domestic Activity
Russia: Tame Recovery In Domestic Activity
High-frequency data suggest that consumer spending and business activity remain tame (Chart 14). Bottom Line: The latest uptick in Russia’s core CPI is likely transitory. Cyclical conditions for a material rise in inflation and hence monetary tightening are not in place. Investment Takeaways Chart 15Russia Underperforms Amid Commodity Bull Run
Russia Underperforms Amid Commodity Bull Run
Russia Underperforms Amid Commodity Bull Run
Russia’s sluggish economy and austere policy backdrop suggest that the fires of domestic political unrest will continue to burn. While political instability may force the Kremlin to ease fiscal policy, the easing so far envisioned is slight. The implication is that Russia faces rising domestic political risk simultaneously with the rise in international, geopolitical risk stemming from the Biden administration’s efforts to promote democracy in Russia’s periphery and push back against its regional and global attempts to undermine the US-led global order. So far the totality of Russia’s risks have outweighed the benefits of the global economic recovery as Russian assets are trailing the rally in commodity prices (Chart 15). The ruble is above the lows reached at the height of the Ukraine crisis, whether compared to the GBP or the EUR, suggesting further downside when US-Russia tensions spike (Chart 16). The currency is neither cheap nor expensive at present (Chart 17). Chart 16Ruble Will Fall Further On Geopolitical Risk But Floor Not Far
Ruble Will Fall Further On Geopolitical Risk But Floor Not Far
Ruble Will Fall Further On Geopolitical Risk But Floor Not Far
Chart 17Russia: The Ruble Is Fairly Valued
Russia: The Ruble Is Fairly Valued
Russia: The Ruble Is Fairly Valued
Chart 18Geopolitical Risk Will Revive Despite Apparent Top
Geopolitical Risk Will Revive Despite Apparent Top
Geopolitical Risk Will Revive Despite Apparent Top
Our Geopolitical Risk Indicator for Russia is forming a bottom, implying that global investors believe the worst has passed. This is a mistake and we expect the indicator to change course and price in new risk. The result will weigh on Russian equities, which are fairly well correlated with this indicator (Chart 18). Overall, we recommend investors who care about absolute returns to sell Russian assets. For dedicated EM equity as well as EM local currency bond portfolios, BCA's Emerging Markets Strategy recommends a neutral stance on Russia (Chart 19). Rising bond yields in the US will continue weighing especially on high-flying growth stocks. The low market-cap weight of technology/growth stocks in the Russian bourse makes the latter less vulnerable to rising global bond yields. Concerning local rates, we see value in 10-year swap rates, as tight monetary and fiscal policies will keep a lid on inflation. With the central bank unlikely to hike rates anytime soon, a steep yield curve offers good value in the long end of the curve for fixed income investors. Finally, orthodox macro policies will benefit fixed-income investors on the margin. In regard to EM credit (USD bonds) portfolio, the Emerging Markets Strategy team recommends overweighting Russia (Chart 20). The government has little local currency debt and minimal US dollar debt. Not surprisingly, Russia has been a low-beta credit market and it will outperform its EM peers in a broad sell off. Chart 19Russia: Move To Neutral Local Currency Bond Allocation
Russia: Move To Neutral Local Currency Bond Allocation
Russia: Move To Neutral Local Currency Bond Allocation
Lastly, the Emerging Markets Strategy is moving Ukrainian local currency government bonds to underweight and closing the 5-year local currency bond position. Risks of military confrontation on the Ukraine front have escalated. Chart 20Russia: Remain Overweight On USD Credit
Russia: Remain Overweight On USD Credit
Russia: Remain Overweight On USD Credit
Matt Gertken Vice President Geopolitical Strategy mattg@bcaresearch.com Andrija Vesic Associate Editor Emerging Markets Strategy AndrijaV@bcaresearch.com Footnotes 1 See Pavlo Limkin et al, “Putin’s new constitution spells out modern Russia’s imperial ambitions,” Atlantic Council, September 10, 2020, atlanticcouncil.org. 2 See White House, “Remarks by President Biden on America’s Place in the World,” February 4, 2021, and “Remarks by President Biden at the 2021 Virtual Munich Security Conference,” February 19, 2021, whitehouse.org. 3 See “Remarks … at the … Munich Security Conference” in footnote 2 above. 4 We first outlined this US-Russia disengagement in our last joint special report on Russia, “US-Russia: No Reverse Kissinger (Yet),” July 3, 2020, bcaresearch.com. 5 See Margarita Assenova, “Clouds Darkening Over Nord Stream Two Pipeline,” Jamestown Foundation, February 1, 2021, Jamestown.org. 6 Biden’s “Interim National Security Strategic Guidance,” White House, March 3, 2021, whitehouse.org, reinforces this point by focusing most of its attention on China and largely neglecting Russia. 7 See “Kremlin concerned about rising tensions in Donbass,” Tass, March 4, 2021, tass.com. 8 One way in which this could transpire would be a carbon border tax. The EU says imposing a tariff on carbon-intensive imports will proceed unilaterally if there is not a UN agreement in November because it is a “matter of survival” for its industry as it raises green regulation. The Biden administration also promised in its campaign to levy a “carbon adjustment fee.” Russia, which is exposed as a fossil fuel exporter that does not have a carbon pricing scheme, says such a fee would go against WTO rules. See Kate Abnett, “EU sees carbon border levy as ‘matter of survival’ for industry,” Reuters, January 18, 2021, reuters.com; Sam Morgan, “Moscow cries foul over EU’s planned carbon border tax,” Euractiv, July 27, 2020, euractiv.com. 9 See Heinrich Brauss and Dr. András Rácz, “Russia’s Strategic Interests and Actions in the Baltic Region,” German Council on Foreign Relations, DGAP Report, January 7, 2021, dgap.org; Christopher S. Chivvis et al, “NATO’s Northeastern Flank: Emerging Opportunities for Engagement,” Rand Corporation, 2017. 10 The rule stipulates that a portion of oil and gas revenues that the government can spend is determined by a fixed oil price benchmark. Currently, the benchmark oil price stands at $42 per barrel. The fiscal rule also encompasses constraints on the National Welfare Fund withdrawals in oil prices below $42 per barrel.
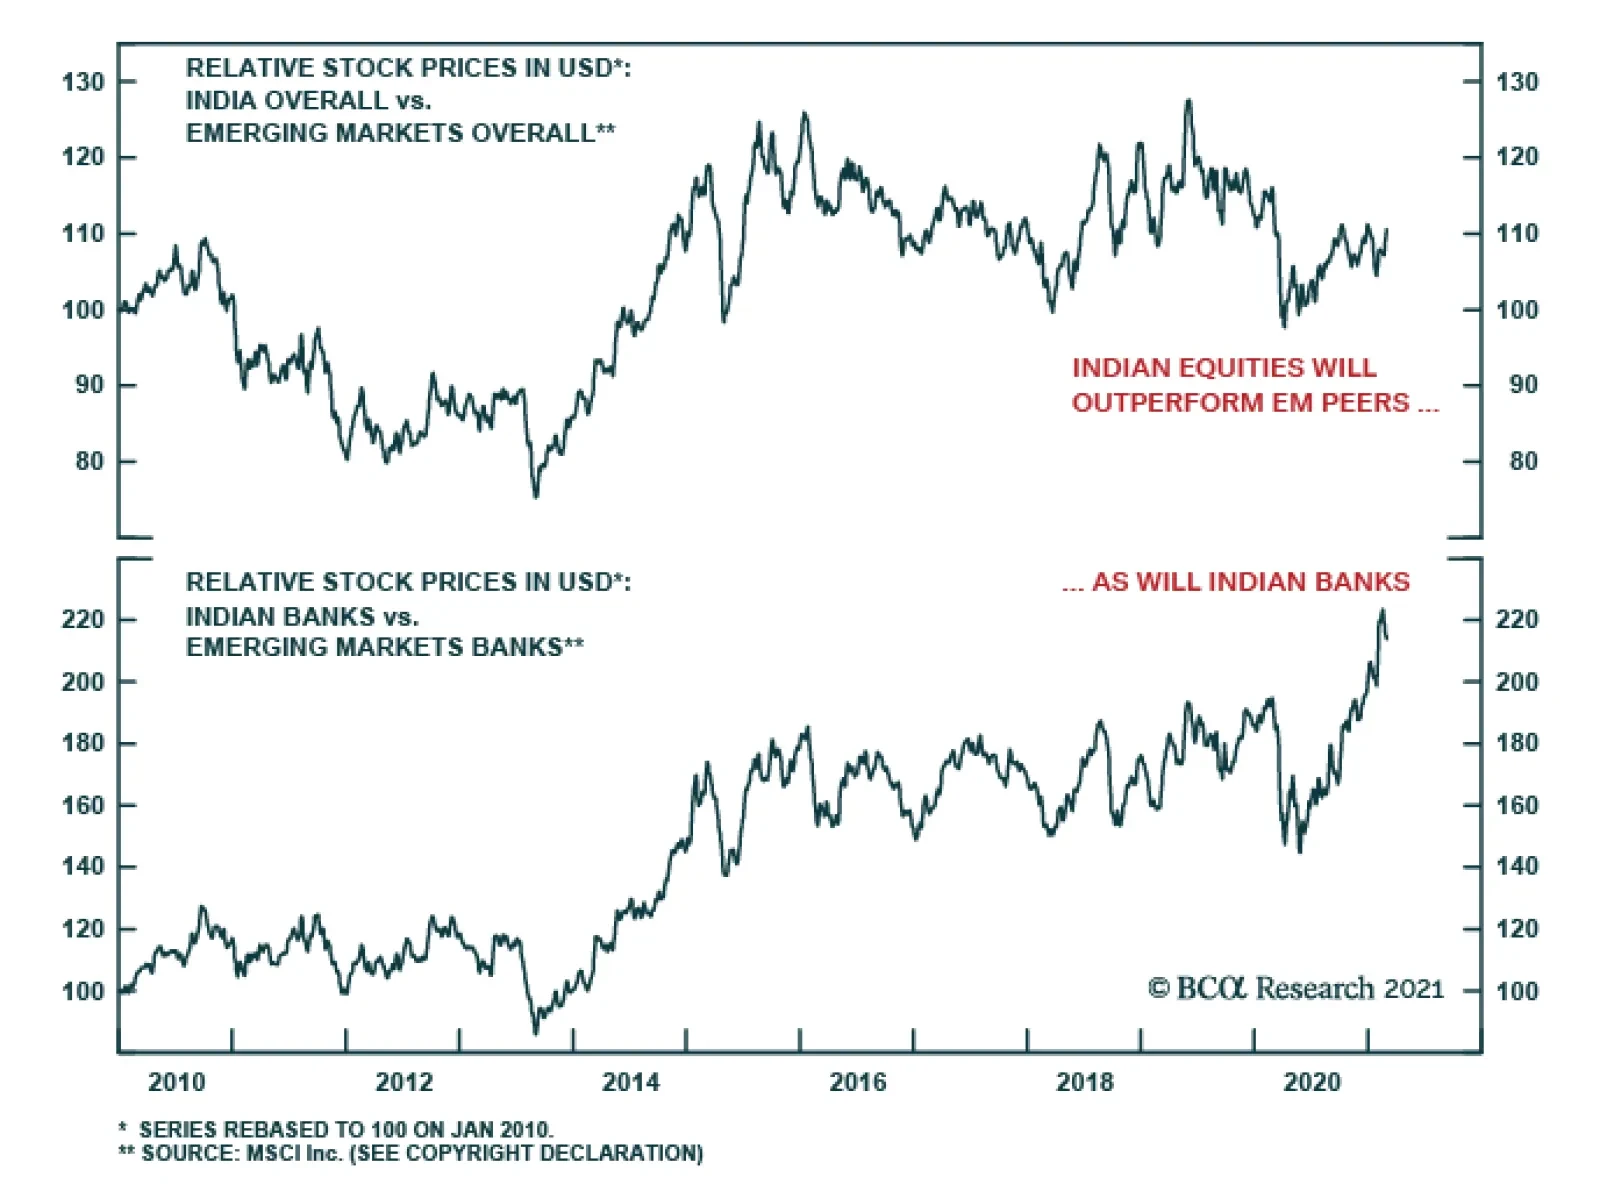
Our Emerging Markets Strategy team recently recommended that dedicated EM equity investors upgrade India from neutral to overweight in an equity portfolio. India is likely to see its inflation remain under control, thanks to a good harvest. That is…
Highlights China’s primary vulnerabilities over the past decade have been, and remain, credit/money excesses and a misallocation of capital. China’s advantage has not been its banking system or monetary policy’s "magic touch," but its ability to continuously raise productivity at a solid rate. Inflation has remained subdued due to robust productivity gains. Without the latter, policymakers would have little room to navigate and secure economic and financial stability. As long as solid productivity gains persist, the economy will absorb excesses over time and remain structurally sound. Feature China’s credit and fiscal stimulus has peaked and will roll over significantly in 2021. Hence, the question now is: what will be the extent of the economic slowdown? The magnitude of the growth slowdown depends not only on the pace and extent of credit and fiscal tightening but also on the structural health of the economy. In a structurally sound economy, the end of a credit and fiscal stimulus does not produce a sharp and extended slowdown. Conversely, in an economy saddled with structural malaises, modest policy tightening could produce a dramatic or prolonged business cycle downtrend. Two examples from China’s not-so-distant past are the credit tightening in 2004 and policy tightening in 2013-14. After the acute credit tightening in 2004 and the ensuing loan slowdown, China’s growth moderated briefly but remained robust and, in fact, reaccelerated in 2005 (Chart 1, top panel). However, following the 2013-14 policy tightening episode, China’s industrial sector experienced an extended downtrend (Chart 2, top panel). Chart 1China In Mid-2000s: Market Performance Amid Credit Tightening
China In Mid-2000s: Market Performance Amid Credit Tightening
China In Mid-2000s: Market Performance Amid Credit Tightening
Chart 2China In Mid-2010s: Market Performance Amid Policy Tightening
China In Mid-2010s: Market Performance Amid Policy Tightening
China In Mid-2010s: Market Performance Amid Policy Tightening
Consistently, China-related plays in financial markets experienced only a brief and short-lived shakeout in 2004 and resumed their bull market within a short time span (Chart 1, bottom panel). But in 2013-15, China-plays experienced a deep and extended bear market (Chart 2, bottom panel). In this report, we assess the structural health of the mainland economy. “Soft-Budget” Constraints And Capital Misallocation China’s primary vulnerabilities over the past decade have been, and remain, credit excesses and a misallocation of capital. Loose credit and fiscal policies – “soft-budget” constraints – starting in 2009 fueled money creation on a grand scale, causing corporate and household debt to mushroom. This has massively inflated property prices and led to capital misallocation. Many of these excesses have by and large lingered. In particular: Broad money supply in China has surged 4.7-fold since January 2009 (Chart 3, top panel). This is significantly above the 2.3-fold increase in the US, and the 1.6-fold rise in the euro area and in Japan. Chart 3Broad Money Excesses: China Has Been An Outlier
Broad Money Excesses: China Has Been An Outlier
Broad Money Excesses: China Has Been An Outlier
Not only has broad money supply skyrocketed in China by much more than in other economies, but it has also risen by much more relative to its own nominal GDP (Chart 3, middle panel). Since January 2009, as unorthodox monetary policies gained traction around the world, the broad money-to-GDP ratio has risen by 80 percentage points in China, 35-percentage points in the US, 25-percentage points in the euro area and 70-percentage points in Japan. Chart 4China: No Deleveraging So Far
China: No Deleveraging So Far
China: No Deleveraging So Far
Notably, China’s broad money-to-GDP ratio is the highest in the world, as illustrated in the middle panel of Chart 3. Finally, the absolute amount of broad money – all types of local currency deposits and cash in circulation converted into dollars to make numbers comparable – now stands at $40 trillion in China, $18 trillion in the US and the euro area each and $11 trillion in Japan (Chart 3, bottom panel). In brief, China’s money (RMB) supply is greater than the sum of money supply in the US and euro area. China’s domestic credit growth has been outpacing nominal GDP growth since 2008 (Chart 4, top panel). Consequently, its domestic credit-to-GDP ratio is making new highs (Chart 4, bottom panel). A continuously rising domestic debt-to-GDP ratio indicates that the nation has not really deleveraged in the past ten years. Concerning debt structure, local and central government debt stands at 61% of GDP, enterprise (including SOE) debt represents 162% of GDP and household debt is 61% of GDP. Notably, enterprise debt is the highest in the world, as illustrated in Chart 5. This chart shows a decline in China’s corporate credit-to-GDP ratio from 2016 to 2018. The drop, however, is due to the Local Government Financing Vehicles (LGFV) debt swap. Authorities simply moved debt from LGFV balance sheets to local governments, which represents an accounting reshuffle and not genuine deleveraging. Meanwhile, households in China are as leveraged as those in the US (Chart 6) when debt-to-disposable income ratios are compared. The latter is how consumer debt is measured in all countries around the world. Chart 5Chinas Corporate Debt Is The Highest In the World
Chinas Corporate Debt Is The Highest In the World
Chinas Corporate Debt Is The Highest In the World
Chart 6Chinese Households Are As Leveraged As US Ones
Chinese Households Are As Leveraged As US Ones
Chinese Households Are As Leveraged As US Ones
Chart 7Debt Servicing Costs In China Are High
Debt Servicing Costs In China Are High
Debt Servicing Costs In China Are High
Finally, the true indicator of debt stress is the debt-service ratio. The Bank for International Settlements (BIS) estimates that the debt-service ratio for Chinese enterprises and households is above 20% of income. The same ratio for the US rolled over at 18% in 2007 during the credit crisis (Chart 7). There are several symptoms consistent with pervasive capital misallocation. First, return on assets (RoA) for non-financial onshore listed companies has dropped to an 20-year low (Chart 8, top panel). Companies have raised substantial capital to invest but the return on investment has been disappointing, resulting in a falling RoA. Second, a falling output-to-capital ratio – an inverse analog of a rising incremental capital-to-output ratio (ICOR) – also indicates capital misallocation and falling efficiency (Chart 9). Chart 8Falling Return On Assets And Slowing Productivity Growth
Falling Return On Assets And Slowing Productivity Growth
Falling Return On Assets And Slowing Productivity Growth
Chart 9Output Per Unit Of Capex Is Falling
Output Per Unit Of Capex Is Falling
Output Per Unit Of Capex Is Falling
Falling return on capital is the natural outcome of too much investment. It is simply impossible to invest more than 40% of GDP every year over a 20-year period without capital misallocation. It has become difficult to find profitable projects, especially as China’s economy is no longer as underinvested as it was 20 years ago. Falling efficiency ultimately entails lower productivity and, eventually, declining potential real GDP growth. Has China Deleveraged? Following such an epic credit boom, one would typically expect creditors in general and banks in particular to undertake profound cleansing of their balance sheets, and for the amounts involved to be colossal. However, Chinese banks have not yet done this on a meaningful scale. We estimate that banks have disposed – written-off and sold - RMB 9.4 trillion in loans since 2012, which is equivalent to 6.6% of all loans originated since January 2009 (when the credit boom commenced). In addition, banks’ NPL provisions remain very low at 3.4% of their loan book. In a nutshell, banks have not yet sufficiently cleansed their balance sheets. Not surprisingly, their share prices have been among the worst performers in the Chinese equity universe and in the EM space more generally. Overall, the Chinese economy was very healthy and was on an extremely solid foundation until the credit boom (“soft-budget” constraints) began in 2009. Since then, the economic model has bred inefficiencies which could weigh on growth going forward. One widely circulated counterargument against the thesis of excessive credit/money growth in China has been that Chinese households save a lot. As the argument goes, this is what has prompted banks to lend out those deposits. This analysis is incorrect, and we have written extensively about this topic in a series of reports that are available upon request. The interaction between money creation, credit and savings is outside the scope of this report. We therefore limit the discussion to the key inferences from the series of reports we published: National savings, including household savings, do not create money supply or deposits. Also, banks do not lend out deposits. Money/deposits are created by commercial banks when they make loans to, or buy assets from, non-banks. This is true for any economy in the world. Chart 10Gradual Deleveraging But No Crisis In Japan In 1990s
Gradual Deleveraging But No Crisis In Japan In 1990s
Gradual Deleveraging But No Crisis In Japan In 1990s
We agree that Chinese households do have a high savings rate. However, their savings do not impact whether banks originate loans and create deposits, i.e., expand money supply. To expand their balance sheets, banks require liquidity/excess reserves, not deposits. In short, the enormous money supply in China has been an outcome of reckless behavior on the part of banks and borrowers rather than originating out of household or national savings. As such, at the current levels, Chinese money and credit represent major excesses and, thereby, pose risks to financial stability and long-term development. A pertinent question is as follows: Is there an economy that did not experience a credit crisis following a credit bubble? Japan is one example. Yet, Japan suffered from deleveraging. The top panel of Chart 10 demonstrates that bank loan growth peaked at 12% in 1990 and gradually slowed thereafter, ultimately contracting. The bottom panel of Chart 10 shows that Japan’s companies and households underwent gradual deleveraging beginning in the mid-1990s. Such a long lasting but gradual adjustment contrasts with the acute and sharp crisis that occurred in the US in 2007-08. To sum up, credit excesses do not need to culminate in a credit crisis; Japan being the primary example. However, it is unusual for the non-public debt-to-GDP ratio to continuously rise from already elevated levels. In brief, China has seen its money and credit excesses rise continually and the problem has yet to be addressed. Other Structural Headwinds Chart 11China Is Much More Industrialized Than Commonly Believed
China Is Much More Industrialized Than Commonly Believed
China Is Much More Industrialized Than Commonly Believed
The Chinese economy is facing other structural headwinds: First, the oft-quoted 60% urbanization rate understates the extent of China’s industrialization. China is much more industrialized than generally perceived: the country’s industrialization rate is currently 85% – i.e., 85% of jobs in China are already in non-agricultural sectors (Chart 11). This entails a slower rate of industrialization and urbanization going forward. Second, the labor force is shrinking. This is a major drag on the nation’s potential real GDP growth rate – which is equal to the sum of productivity growth and labor force growth. In turn, productivity growth is estimated to have slowed down to about 6% with total factor productivity growth slipping to 2% (Chart 8, bottom panel, above). Chart 12Re-Balancing Is About Slowing Capex Not Accelerating Consumer Spending
Re-Balancing Is About Slowing Capex Not Accelerating Consumer Spending
Re-Balancing Is About Slowing Capex Not Accelerating Consumer Spending
As we discussed in our recent Special Report A Primer On Productivity, productivity is the most important variable for any country’s long-term development and 6% is still a very high number. The challenge for China in the coming years is to prevent its productivity growth rate from dropping below 4.5-5%. Third, there is a misconception about what rebalancing really means for this economy. Consumer spending in China has in fact been booming over the past 20 years – it has been growing at a compounded annual growth rate (CAGR) of 10.3% in real terms from 1998 until 2020 (pandemic) (Chart 12, top panel). Hence, the imbalance in China has not been sluggish consumer spending, which has actually been booming for the past 20 years. Rather, capital expenditure has been too strong for too long (Chart 12, bottom panel). Healthy rebalancing entails a slowdown in investment spending – not an acceleration in household demand. Hence, the market relevant question is: can the growth rate of household expenditure accelerate above 10% CAGR in real terms as capital spending decelerates? Our hunch is that this is unlikely. The basis is that investment outlays account for more than 40% of GDP and create many jobs and income, which in turn feeds into consumer spending. A meaningful downshift in capital expenditures will produce lower household income growth, resulting in a moderation in consumer spending growth. Bottom Line: Maturing industrialization, a shrinking labor force and an imperative to slow capital spending all constitute formidable headwinds to China’s secular growth outlook. China’s Advantage: What Makes It Distinct Chart 13China Does Not Have An Inflation Problem
China Does Not Have An Inflation Problem
China Does Not Have An Inflation Problem
Although all of the above structural drawbacks have persisted for the past ten years, the Chinese economy (1) has not experienced a credit crisis; and (2) has not seen an inflation outbreak despite burgeoning money supply. The question is: why? Concerning the credit excesses and the property bubble, China has avoided a credit crisis because its banking system has shown extreme forbearance towards debtors, i.e., banks have not forced corporate restructuring when companies were unable to service their debt. Besides, authorities – being fully aware of the risk of financial instability – have been lenient towards banks and debtors, tolerating continued credit overflow and rising credit excesses. The domestic credit growth rate has never dropped below nominal GDP growth (Chart 4 above). Rather, it has remained above 10% – despite several episodes of policy tightening and deleveraging campaigns. Authorities in any country with effective control over banks could do this. However, many economies with such a rampant money/credit boom would exhibit very high inflation. Yet, inflation in China has been absent (Chart 13). Critically, China’s advantage over other nations has not been its banking system or its monetary policy’s "magic touch" but its ability to continuously grow productivity at a solid rate. Inflation has remained subdued due to robust productivity gains. Without the latter, policymakers would have little room to navigate and secure economic and financial stability. The lack of inflation in China amid the credit and money boom is critical to understanding the unique structure and character of its economy. We have the following considerations: First, rampant money growth is typically associated with higher inflation because of the presumption that new money creation stimulates the demand for, but not the supply of goods and services. This is presently the case in the US where monetarization of public debt and fiscal transfers to households are boosting demand but not the potential productive capacity. However, in China’s case, credit flow to enterprises has always dwarfed credit to consumers. This means that the lion’s share of credit origination/money creation has been going directly into capital spending. Investment expenditures have led to rapid expansion of production capacity in the majority of industries. As a result, output has exceeded demand, resulting in an oversupply of goods and services and ultimately, in falling prices. Chart 14A and 14B illustrate that production capacity in many sectors in China has exploded over the past 20 years. In many industries, production capacity and output have expanded more than 10-fold since 2000. The outcome has been chronic deflation in many goods (Chart 15). Chart 14AProduction Capacity Has Been Surging In Many Industries
Production Capacity Has Been Surging In Many Industries
Production Capacity Has Been Surging In Many Industries
Chart 14BProduction Capacity Has Been Surging In Many Industries
Production Capacity Has Been Surging In Many Industries
Production Capacity Has Been Surging In Many Industries
In short, too much credit/money channeled into expanding production capacity could lead to deflation. Second, when banks make new loans/create new money, inflation occurs in goods/commodities that money is used to purchase. Those goods/commodities experienced periods of high price inflation during money/credit growth acceleration. For example, China’s credit/money growth impulse explains swings in commodities prices (Chart 16). Hence, the link between credit/money and certain goods/commodities prices has held up. Chart 15Goods Deflation Is Pervasive In China
Goods Deflation Is Pervasive In China
Goods Deflation Is Pervasive In China
Chart 16Money Impulse Is Sending A Warning For Industrial Metals
Money Impulse Is Sending A Warning For Industrial Metals
Money Impulse Is Sending A Warning For Industrial Metals
Finally, the application of digital technologies in service sectors has kept a lid on service price inflation. Hence, China has benefited from productivity-enabled disinflation despite the ongoing money/credit boom. That said, there are also areas where there has been rampant inflation. These include land, housing and high-end services. On the whole, deflation in goods prices due to oversupply has overwhelmed the pockets of high inflation in services. Crucially, unit labor costs in both the industrial economy (secondary industry) and service sectors have been contained as strong wage growth has been offset by robust productivity gains (Chart 17). The following factors have enabled high productivity growth in China: Chinese people are genuinely entrepreneurial, hardworking and disciplined. Educational attainment has been rising and innovation has proliferated. China has closed the gap in all patents with the US (Chart 18, top panel). It has actually surpassed the US in the number of semiconductor patents (Chart 18, bottom panel). Chart 17Rising Wages But Stable Unit Labor Costs
Rising Wages But Stable Unit Labor Costs
Rising Wages But Stable Unit Labor Costs
Chart 18China Has Become A Global Innovation Hub
China Has Become A Global Innovation Hub
China Has Become A Global Innovation Hub
Chart 19China Is Pursuing Automation On A Large Scale
China Is Pursuing Automation On A Large Scale
China Is Pursuing Automation On A Large Scale
Our report from June 24, 2020 has elucidated the nation’s innovation drive. Rising spending on research and development will ensure China’s continued ascent as a major global innovation hub. Consistent with rising productivity, China’s share in global trade continues to rise. China is aggressively implementing automation in many of its industries, replacing labor with robotics. Specifically, the number employees in the industrial sector has been falling while production of industrial robots - and presumably, demand for them - has surged (Chart 19). The outcome will be continued rapid productivity gains which will allow companies to keep a lid on costs and secure reasonable profit margins without resorting to price hikes. What could cause productivity growth to slow? The main risk is complacency associated with easy credit and recurring fiscal stimulus, i.e., “soft-budget constraints”. If zombie companies continue to enjoy easy access to financing and are not forced to restructure and become more efficient, the pace of productivity gains will decelerate with negative consequences for potential GDP growth and inflation. In such a case, the credit system’s forbearance towards enterprises that misallocate capital will continue channeling money to projects with low efficiency. The latter will increase the supply of goods and services that are not demanded. This will produce pockets of short-term deflation but will lay the foundation for higher inflation down the road.1 Bottom Line: China’s unique advantage has been its ability to avoid inflation despite the money/credit boom. Using a large share of credit to expand production capacity – rather than consumption – has been the key to maintaining low inflation. The latter has allowed policymakers to avoid material tightening policy and has kept the currency competitive. In brief, the nation has been able to maintain reasonably high productivity gains, albeit slower relative to pre-2010. As long as productivity grows at a solid rate, the economy will over time absorb excesses with moderate pain/setbacks and will do well structurally. Investment Considerations Appreciating the long-term negative ramifications of “soft-budget” constraints, Chinese policymakers have embarked on another tightening campaign since last summer. This policy stance will continue, and the economy is now facing triple tightening: Monetary and fiscal tightening: The total social financing and our broad money (M3) impulses have already rolled over (Chart 16 above). Fiscal policy will also tighten relative to the unprecedented stimulus of last year. Regulatory tightening on banks and non-bank financial institutions: Authorities are planning to reinforce asset management regulation by the end of this year. This will limit how much these financial institutions can expand their balance sheets reinforcing a credit slowdown. Property market tightening: Restrictions on both property purchases and property developers’ leverage will lead to a notable slump in real estate construction. Chart 20Overweight A Shares Versus Chinese Investable Stocks
Overweight A Shares Versus Chinese Investable Stocks
Overweight A Shares Versus Chinese Investable Stocks
As China’s credit-sensitive sectors – construction and infrastructure spending – slow down this year, the risk-reward for industrial commodities and other China-plays worldwide is poor. Regarding Chinese stocks, Chinese A-shares will begin outperforming Chinese Investable stocks (Chart 20). We recommend the following strategy: long A shares / short China investable stocks. The primary reason is that the A-share index is heavy in value stocks while the MSCI China investable index has a large weight in expensive new economy stocks. The global investment backdrop has shifted in favor of global value versus global growth stocks due to strong US growth and rising US bond yields. Also, there has been more rampant speculation in global stocks that affect Chinese investable stocks more than onshore equities. Notably, the Composite A-share large and A-share small cap indexes have not performed well since July while investable stocks had been surging until recently. As to the exchange rate, the RMB is overbought and will likely experience a setback as the US dollar rebounds. However, the yuan’s long-term outlook versus the US dollar depends on the relative productivity growth. As long as the productivity growth differential between China and the US does not narrow, the RMB will appreciate versus the dollar on a structural basis. Arthur Budaghyan Chief Emerging Markets Strategist arthurb@bcaresearch.com Footnotes 1 Deflation can turn into inflation when the economy produces goods/services that are not demanded (type A goods) and not producing the ones that are in demand (type B goods). As a result, prices of type A goods will deflate often overwhelming inflation type B goods keeping overall inflation very low. Consequently, production of type-A goods will halt because plunging prices will discourage output. As a result, deflation will abate in the economy. If the economy still cannot produce type-B goods – the ones in demand, inflation will become prevalent.

A recent statement from top Chinese banking regulator Guo Shuqing highlighting the risk of bubbles in both foreign equity markets and domestic property markets cast a shadow over Asian equities earlier this week. The Chairman of the China Banking and…
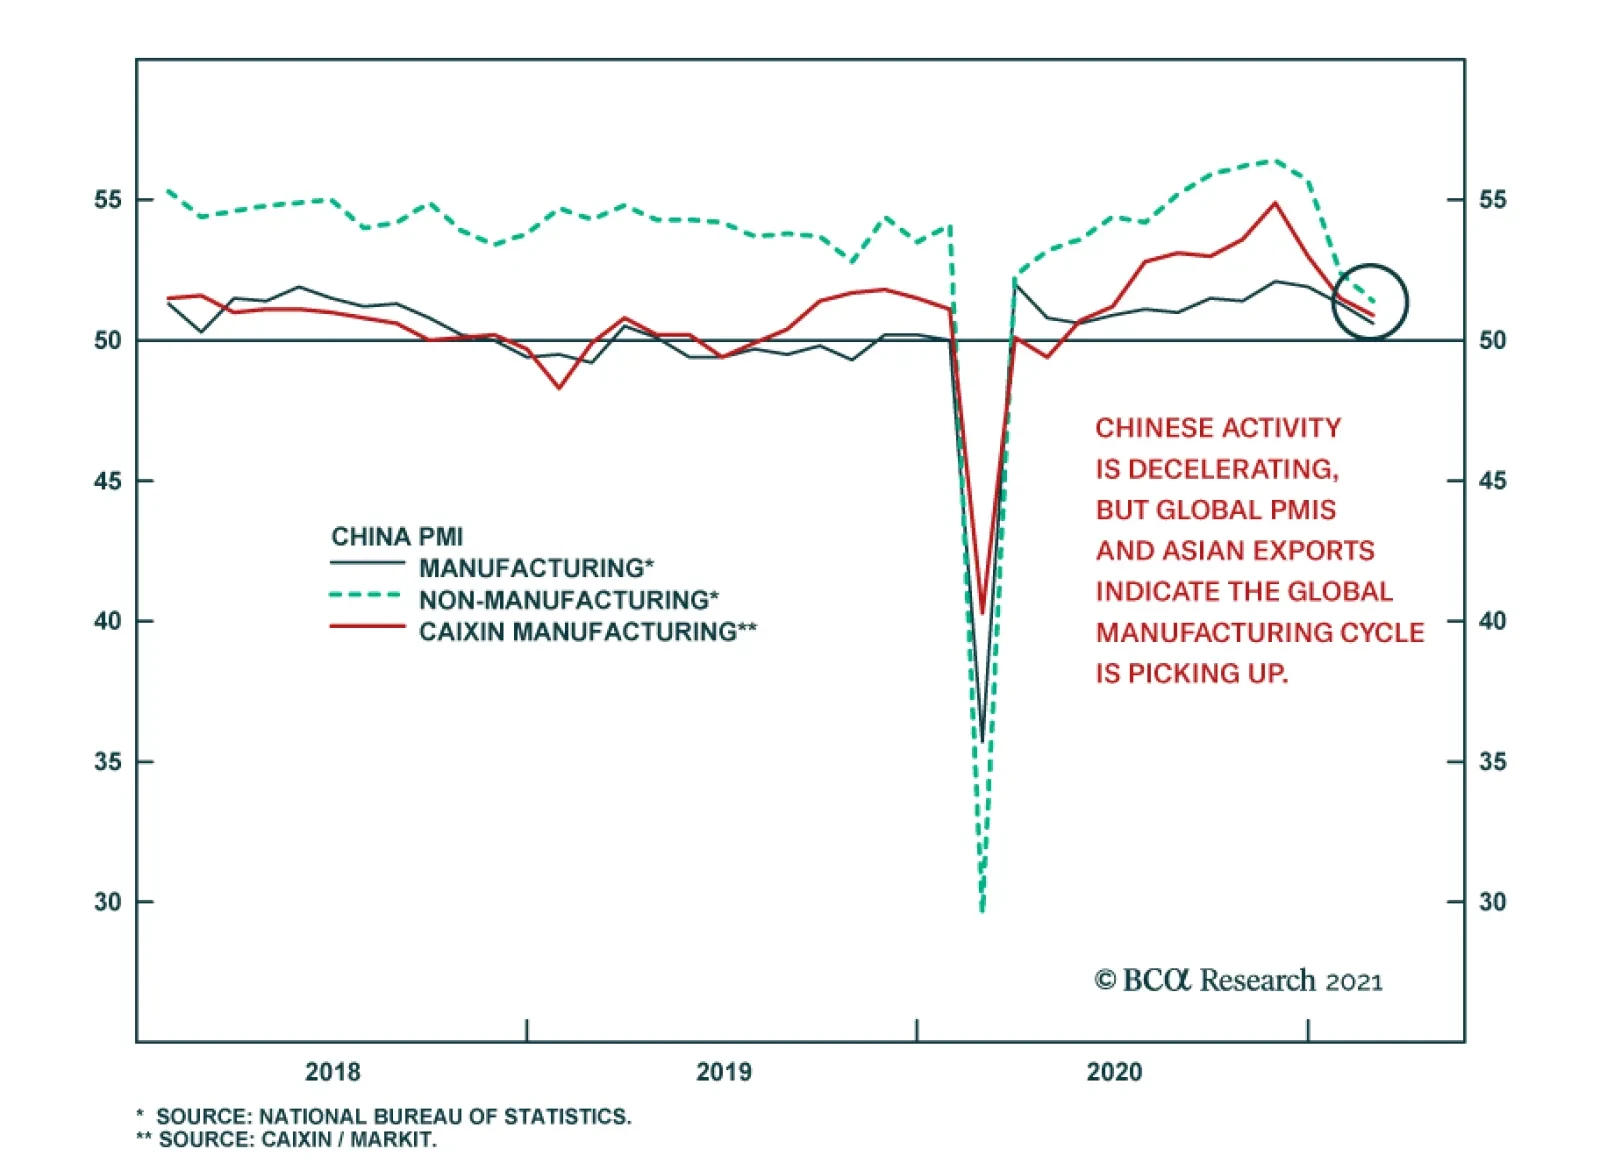
China’s economic recovery continued to moderate in February. The composite PMI compiled by the National Bureau of Statistics declined for the third consecutive month, sliding to 51.6 from 52.8 on the back of weaker than expected growth in both the…

BCA Research’s Foreign Exchange Strategy service concludes that a big driver for the RMB in the coming years will also be widespread diversification away from USD assets. With extremely low volatility, the yuan has appreciated by approximately 10% since…
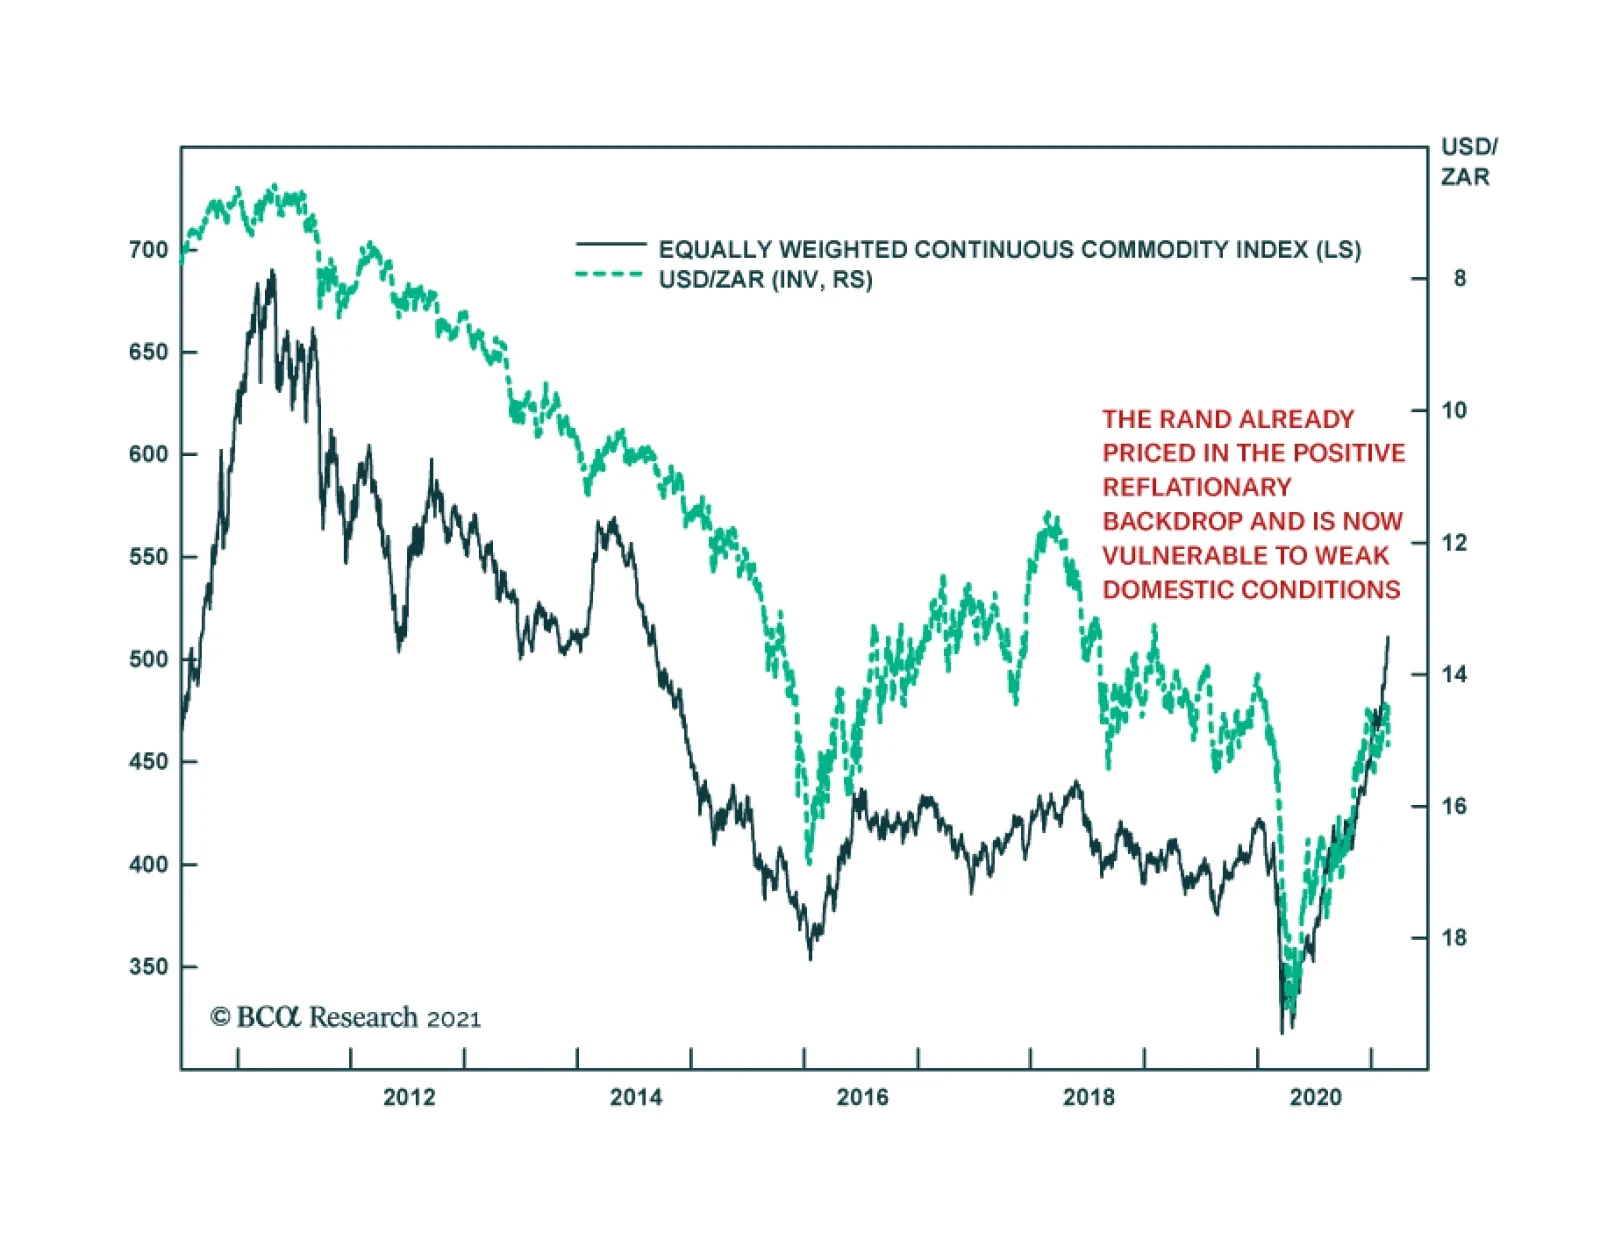
South Africa’s revised budget forecasts reveal that authorities are more optimistic than they were last October. The government deficit was revised down, and public debt is now expected to peak at 88.9% of GDP in 2025/26, down from the 95.3% of GDP previously…
Highlights Market-based geopolitical analysis is about identifying upside as well as downside risk. So far this year upside risks include vaccine efficacy, coordinated monetary and fiscal stimulus, China’s avoidance of over-tightening policy, and Europe’s stable political dynamics. Downside risks include vaccine rollout problems, excessive US stimulus, a Chinese policy mistake, and traditional geopolitical risks in the Taiwan Strait and Persian Gulf. Financial markets may see more turmoil in the near-term over rising bond yields and the dollar bounce. But the macro backdrop is still supportive for this year. We are initiating and reinitiating a handful of trades: EM currencies ex-Brazil/Turkey/Philippines, the BCA rare earth basket, DM-ex-US, and the Trans-Pacific Partnership markets, and global value plays. Feature Chart 1Bond Yield Spike Threatens Markets In Near Term
Bond Yield Spike Threatens Markets In Near Term
Bond Yield Spike Threatens Markets In Near Term
Investors hear a lot about geopolitical risk but the implication is always “downside risk.” What about upside risks? Where are politics and geopolitics creating buying opportunities? So far this year, on the positive side, the US fiscal stimulus is overshooting, China is likely to avoid overtightening policy, and Europe’s political dynamics are positive. However, global equity markets are euphoric and much of the good news is priced in. On the negative side, the US stimulus is probably too large. The output gap will be more than closed by the Biden administration’s $1.9 trillion American Rescue Plan yet the Democrats will likely pass a second major bill later this year with a similar amount of net spending, albeit over a longer period of time and including tax hikes. The countertrend bounce in the dollar and rising government bond yields threaten the US and global equity market with a near-term correction. The global stock-to-bond ratio has gone vertical (Chart 1). Meanwhile Biden faces immediate foreign policy tests in the Taiwan Strait and Persian Gulf. These two are traditional geopolitical risks that are once again underrated by investors. The near term is likely to be difficult for investors to navigate. Sentiment is ebullient and likely to suffer some disappointments. In this report we highlight a handful of geopolitical opportunities and offer some new investment recommendations to capitalize on them. Go Long Japan And Stay Long South Korea China’s stimulus and recovery matched by global stimulus and recovery have led to an explosive rise in industrial metals and other China-sensitive assets such as Swedish stocks and the Australian dollar that go into our “China Play Index” (Chart 2). Chart 2China Plays Looking Stretched (For Now)
China Plays Looking Stretched (For Now)
China Plays Looking Stretched (For Now)
While a near-term pullback in these assets looks likely, tight global supplies will keep prices well-bid. Moreover long-term strategic investment plans by China and the EU to accelerate the technology race and renewable energy are now being joined by American investment plans, a cornerstone of Joe Biden’s emerging national policy program. We are long silver and would buy metals on the dips. Chinese President Xi Jinping’s “new era” policies will be further entrenched at the March National People’s Congress with the fourteenth five-year plan for 2021-25 and Xi’s longer vision for 2035. These policies aim to guide the country through its economic transition from export-manufacturing to domestic demand. They fundamentally favor state-owned enterprises, which are an increasingly necessary tool for the state to control aggregate demand as potential GDP growth declines, while punishing large state-run commercial banks, which are required to serve quasi-fiscal functions and swallow the costs of the transition (Chart 3). Xi Jinping’s decision to promote “dual circulation,” which is fundamentally a turn away from Deng Xiaoping’s opening up and liberal reform to a more self-sufficient policy of import substitution and indigenous innovation, will clash with the Biden administration, which has already flagged China as the US’s “most serious competitor” and is simultaneously seeking to move its supply chains out of China for critical technological, defense, and health goods. Chart 3Xi Jinping Leans On The Banks To Save The SOEs
Xi Jinping Leans On The Banks To Save The SOEs
Xi Jinping Leans On The Banks To Save The SOEs
Chinese political and geopolitical risks are almost entirely priced out of the market, according to our GeoRisk Indicator, leaving Chinese equities exposed to further downside (Chart 4). Hong Kong equities have traded in line with GeoRisk Indicator for China, which suggests that they also have downside as the market prices in a rising risk premium due to the US’s attempt to galvanize its allies in a great circumvention of China’s economy in the name of democracy versus autocracy. Chart 4China/HK Political Risk Priced Out Of Market
China/HK Political Risk Priced Out Of Market
China/HK Political Risk Priced Out Of Market
China has hinted that it will curtail rare earth element exports to the US if the US goes forward with a technological blockade. Biden’s approach, however, is more defensive rather than offensive – focusing on building up domestic and allied semiconductor and supply chain capacity rather than de-sourcing China. President Trump’s restrictions can be rolled back for US designed or manufactured tech goods that are outdated or strictly commercial. Biden will draw the line against American parts going into the People’s Liberation Army. Biden has a chance in March to ease the Commerce Department’s rules implementing Trump’s strictures on Chinese software apps in US markets as a gesture of engagement. Supply constraints and shortages cannot be solved quickly in either semiconductors or rare earths. But both China and the US can circumvent export controls by importing through third parties. The problem for China is that it is easier for the US to start pulling rare earths from the ground than it is for China to make a great leap forward in semiconductor production. Given the US’s reawakening to the need for a domestic industrial policy, strategic public investments, and secure supply chains, we are reinitiating our long rare earth trade, using the BCA rare earth basket, which features producers based outside of China (Chart 5). The renminbi is starting to rolling over, having reached near to the ceiling that it touched in 2017 after Trump’s arrival. There are various factors that drive the currency and there are good macro reasons for the currency to have appreciated in 2016-17 and 2020-21 due to strong government fiscal and monetary reflation. Nevertheless the People’s Bank allowed the currency to appreciate extensively at the beginning of both Trump’s and Biden’s terms and the currency’s momentum is slowing as it nears the 2017 ceiling. We are reluctant to believe the renminbi will go higher as China will not want to overtighten domestic policy but will want to build some leverage against Biden for the forthcoming strategic and economic dialogues. For mainland-dedicated investors we recommend holding Chinese bonds but for international investors we would highlight the likelihood that the renminbi has peaked and geopolitical risk will escalate. There is no substantial change on geopolitical risk in the Taiwan Strait since we wrote about it recently. A full-scale war is a low-probability risk. Much more likely is a diplomatic crisis – a showdown between the US and China over Taiwan’s ability to export tech to the mainland and the level of American support for Taiwan – and potentially a testing of Biden’s will on the cybersecurity, economic security, or maritime security of Taiwan. While it would make sense to stay long emerging markets excluding Taiwan, there is not an attractive profile for staying long emerging markets excluding all of Greater China. Therefore investors who are forced to choose should overweight China relative to Taiwan (Chart 6). Chart 5Rare Earth Miners Outside China Can Go Higher
Rare Earth Miners Outside China Can Go Higher
Rare Earth Miners Outside China Can Go Higher
Market forces have only begun to register the fact that Taiwan is the epicenter of geopolitical risk in the twenty-first century. The bottleneck for semiconductors and Taiwan’s role as middleman in the trade war have supported Taiwanese stocks. It will take a long time for China, the US, and Europe to develop alternative suppliers for chips. But geopolitical pressures will occasionally spike and when they do Taiwanese equities will plunge (Chart 7). Chart 6EM Investors Need Either China Or Taiwan ... Taiwan Most At Risk
EM Investors Need Either China Or Taiwan ... Taiwan Most At Risk
EM Investors Need Either China Or Taiwan ... Taiwan Most At Risk
South Korean geopolitical risk is also beneath the radar, though stocks have corrected recently and emerging market investors should generally favor Korea, especially over Taiwan. The first risk to Korea is that the US will apply more pressure on Seoul to join allied supply chains and exclude shipments of sensitive goods to China. The second risk is that North Korea – which Biden is deliberately ignoring in his opening speeches – will demand America’s attention through a new series of provocations that will have to be rebuked with credible threats of military force. Chart 7Markets Starting To Price Taiwan Strait Geopolitical Risk
Markets Starting To Price Taiwan Strait Geopolitical Risk
Markets Starting To Price Taiwan Strait Geopolitical Risk
Chart 8South Korea Favored In EM But Still Faces Risks Over Chips, The North
South Korea Favored In EM But Still Faces Risks Over Chips, The North
South Korea Favored In EM But Still Faces Risks Over Chips, The North
Chart 9Don't Worry About Japan's Revolving Door
Don't Worry About Japan's Revolving Door
Don't Worry About Japan's Revolving Door
The North Korean risk is usually very fleeting for financial markets. The tech risk is more serious but the Biden administration is not seeking to force South Korea to stop trading with China, at least not yet. The US would need to launch a robust, multi-year diplomatic effort to strong-arm its allies and partners into enforcing a chip and tech ban on China. Such an effort would generate a lot of light and heat – shuttle diplomacy, leaks to the press, and public disagreements and posturing. Until this starts to occur, US export controls will be a concern but not an existential threat to South Korea (Chart 8). Japan is the geopolitical winner in Asia Pacific. Japan is militarily secure, has a mutual defense treaty with the US, and stands to benefit from the recovery in global trade and growth. Japan is a beneficiary of a US-driven tech shift away from excess dependency on China and is heavily invested in Southeast Asia, which stands to pick up manufacturing share. Higher bond yields and inflation expectations will detract from growth stocks more than value stocks, and value stocks have a larger market-cap weight in European and Japanese equity markets. Japanese politics are not a significant risk despite a looming election. While Prime Minister Yoshihide Suga is unpopular and likely to revive the long tradition of a “revolving door” of short-lived prime ministers, and while the Liberal Democratic Party will lose the super-majorities it held under Shinzo Abe, nevertheless the party remains dominant and the national policy consensus is behind Abe’s platform of pro-growth reforms, coordinated dovish monetary and fiscal policy, and greater openness to trade and immigration (Chart 9). Favor EU And UK Over Russia And Eastern Europe Russian geopolitical risk appears to be rolling over according to our indicator but we disagree with the market’s assessment and expect it to escalate again soon (Chart 10). Not only will Russian social unrest continue to escalate but also the Biden administration will put greater pressure on Russia that will keep foreign investors wary. Chart 10Russia Geopolitical Risk Will Not Roll Over
Russia Geopolitical Risk Will Not Roll Over
Russia Geopolitical Risk Will Not Roll Over
While geopolitics thus poses a risk to Russian equities – which are fairly well correlated (inversely) with our GeoRisk indicator – nevertheless they are already cheap and stand to benefit from the rise in global commodity prices and liquidity. Russia is also easing fiscal policy to try to quiet domestic unrest. The pound and the euro today are higher against the ruble than at any time since the invasion of Ukraine. It is possible that Russia will opt for outward aggressiveness amidst domestic discontent, a weak and relapsing approval rating for Vladimir Putin and his government, and the Biden administration’s avowed intention to prioritize democracy promotion, including in Ukraine and Belarus (Chart 11). The ruble will fall on US punitive actions but ultimately there is limited downside, at least as long as the commodity upcycle continues. Chart 11Ruble Can Fall But Probably Not Far
Ruble Can Fall But Probably Not Far
Ruble Can Fall But Probably Not Far
Biden stated in his second major foreign policy speech, “we will not hesitate to raise the cost on Russia.” There are two areas where the Biden administration could surprise financial markets: pipelines and Russian bonds. Biden could suddenly adopt a hard line on the Nordstream 2 pipeline between Russia and Germany, preventing it from completion. This would require Biden to ask the Germans to put their money where their mouths are when it comes to trans-Atlantic solidarity. Biden is keen to restore relations with Germany, and is halting the withdrawal of US troops from there, but pressuring Germany on Russia is possible given that it lies in the US interest and Biden has vowed to push back against Russia’s aggressive regional actions and interference in American affairs. The US imposed sanctions on Russian “Eurobonds” under the Chemical and Biological Weapons Control and Warfare Elimination Act of 1991 (CBW Act) in the wake of Russia’s poisoning of secret agent Sergei Skripal in the UK in 2018. Non-ruble bank loans and non-ruble-denominated Russian bonds in primary markets were penalized, which at the time accounted for about 23% of Russian sovereign bonds. This left ruble-denominated sovereign bonds to be sold along with non-ruble bonds in secondary markets. The Biden administration views Russia’s poisoning of opposition leader Alexei Navalny as a similar infraction and will likely retaliate. The Defending American Security from Kremlin Aggression Act is not yet law but passed through a Senate committee vote in 2019 and proposed to halt most purchases of Russian sovereign debt and broaden sanctions on energy projects and Kremlin officials. Biden is also eager to retaliate for the large SolarWinds hack that Russia is accused of conducting throughout 2020. Cybersecurity stocks are an obvious geopolitical trade in contemporary times. Authoritarian nations have benefited from the use of cyber attacks, disinformation, and other asymmetric warfare tactics. The US has shown that it does not have the appetite to fight small wars, like over Ukraine or the South China Sea, whereas the US remains untested on the question of major wars. This incentivize incremental aggression and actions with plausible deniability like cyber. Therefore the huge run-up in cyber stocks is well-supported and will continue. The world’s growing dependency on technology during the pandemic lockdowns heightened the need for cybersecurity measures but the COVID winners are giving way to COVID losers as the pandemic subsides and normal economic activity resumes. Traditional defense stocks stand to benefit relative to cyber stocks as the secular trend of struggle among the Great Powers continues (Chart 12). Specifically a new cycle of territorial competition will revive military tensions as commodity prices rise. Chart 12Back To Work' Trade: Long Defense Versus Cyber
Back To Work' Trade: Long Defense Versus Cyber
Back To Work' Trade: Long Defense Versus Cyber
By contrast with Russia, western Europe is a prime beneficiary of the current environment. Like Japan, Europe is an industrial, trade-surplus economy that benefits from global trade and growth. It benefits as the geopolitical middleman between the US and its rivals, China and Russia, especially as long as the Biden administration pursues consultation and multilateralism and hesitates to force the Europeans into confrontational postures against these powers. Chart 13Political Risk Still Subsiding In Continental Europe
Political Risk Still Subsiding In Continental Europe
Political Risk Still Subsiding In Continental Europe
Meanwhile Russia and especially China need to court Europe now that the Biden administration is using diplomacy to try to galvanize a western bloc. China looks to substitute European goods for American goods and open up its market to European investors to reduce European complaints of protectionism. European domestic politics will become more interesting over the coming year, with German and French elections, but the risks are low. The rise of a centrist coalition in Italy under Mario Draghi highlights how overstated European political risk really is. In the Netherlands, Mark Rutte’s center-right party is expected to remain in power in March elections based on opinion polling, despite serious corruption scandals and COVID blowback. In Germany, Angela Merkel’s center-right party is also favored, and yet an upset would energize financial markets because it would result in a more fiscally accommodative and pro-EU policy (Chart 13). The takeaway is that there is limit to how far emerging European countries can outperform developed Europe, given the immediate geopolitical risk emanating from Russia that can spill over into eastern Europe (Chart 14). Developed European stocks are at peak levels, comparable to the period of Ukraine’s election, but Ukraine is about to heat up again as a battleground between Russia and the West, as will other peripheral states. Chart 14Favor DM Europe Over EM Europe
Favor DM Europe Over EM Europe
Favor DM Europe Over EM Europe
Chart 15GBP: Watch For Scottish Risk Revival In May
GBP: Watch For Scottish Risk Revival In May
GBP: Watch For Scottish Risk Revival In May
Finally, in the UK, the pound continues to surge in the wake of the settlement of a post-Brexit trade deal, notwithstanding lingering disagreements over vaccines, financial services, and other technicalities. British equities are a value play that can make up lost ground from the tumultuous Brexit years. There is potentially one more episode of instability, however, arising from the unfinished business in Scotland, where the Scottish National Party wants to convert any victory in parliamentary elections in May into a second push for a referendum on national independence. At the moment public opinion polls suggest that Prime Minister Boris Johnson’s achievement of an EU trade deal has taken the wind out of the sails of the independence movement but only the election will tell whether this political risk will continue to fall in the near term (Chart 15). Hence the pound’s rally could be curtailed in the near term but unless Scottish opinion changes direction the pound and UK domestic-oriented stocks will perform well. Short EM Strongmen Throughout the emerging world the rise of the “Misery Index” – unemployment combined with inflation – poses a persistent danger of social and political instability that will rise, not fall, in the coming years. The aftermath of the COVID crisis will be rocky once stimulus measures wane. South Africa, Turkey, and Brazil look the worst on these measures but India and Russia are also vulnerable (Chart 16). Brazilian geopolitical risk under the turbulent administration of President Jair Bolsonaro has returned to the 2015-16 peaks witnessed during the impeachment of President Dilma Rousseff amid the harsh recession of the middle of the last decade. Brazilian equities are nearing a triple bottom, which could present a buying opportunity but not before the current political crisis over fiscal policy exacts a toll on the currency and stock market (Chart 17). Chart 16EM Political Risk Will Bring Bad Surprises
EM Political Risk Will Bring Bad Surprises
EM Political Risk Will Bring Bad Surprises
Chart 17Brazil Risk Hits Impeachment Peaks On Bolso Fiscal Populism
Brazil Risk Hits Impeachment Peaks On Bolso Fiscal Populism
Brazil Risk Hits Impeachment Peaks On Bolso Fiscal Populism
Bolsonaro’s signature pension reform was an unpopular measure whose benefits were devastated by the pandemic. The return to fiscal largesse in the face of the crisis boosted Bolsonaro’s support and convinced him to abandon the pretense of austere reformer in favor of traditional Brazilian fiscal populist as the 2022 election approaches. His attempt to violate the country’s fiscal rule – a constitutional provision passed in December 2016 that imposes a 20-year cap on public spending growth – that limits budget deficits is precipitating a shakeup within the ruling coalition. Our Emerging Market Strategists believe the Central Bank of Brazil will hike interest rates to offset the inflationary impact of breaking the fiscal cap but that the hikes will likely fall short, prompting a bond selloff and renewed fears of a public debt crisis. The country’s political crisis will escalate in the lead up to elections, not unlike what occurred in the US, raising the odds of other negative political surprises. Chart 18Reinitiate Long Mexico / Short Brazil
Reinitiate Long Mexico / Short Brazil
Reinitiate Long Mexico / Short Brazil
While Latin America as a whole is a shambles, the global cyclical upturn and shift in American policy creates investment opportunities – particularly for Mexico, at least within the region. Investors should continue to prefer Mexican equities over Brazilian given Mexico’s fundamentally more stable economic policy backdrop and its proximity to the American economy, which will be supercharged with stimulus and eager to find ways to use its new trade deal with Mexico to diversify its manufacturing suppliers away from China (Chart 18). In addition to Brazil, Turkey and the Philippines are also markets where “strongman leaders” and populism have undercut economic orthodoxy and currency stability. A basket of emerging market currencies that excludes these three witnessed a major bottom in 2014-16, when Turkish and Brazilian political instability erupted and when President Rodrigo Duterte stormed the stage in the Philippines. These three currencies look to continue underperforming given that political dynamics will worsen ahead of elections in 2022 (possibly 2023 for Turkey) (Chart 19). Chart 19Keep Shorting The Strongmen
Keep Shorting The Strongmen
Keep Shorting The Strongmen
Investment Takeaways We closed out some “risk-on” trades at the end of January – admittedly too soon – and since then have hedged our pro-cyclical strategic portfolio with safe-haven assets, while continuing to add risk-on trades where appropriate. The Biden administration still faces one or more major foreign policy tests that can prove disruptive, particularly to Taiwanese, Chinese, Russian, and Saudi stocks. Biden’s foreign policy doctrine will be established in the crucible of experience but his preferences are known to favor diplomacy, democracy over autocracy, and to pursue alliances as a means of diversifying supply chains away from China. We will therefore look favorably upon the members of the Comprehensive and Progressive Trans-Pacific Partnership (CPTPP) and recommend investors reinitiate the long CPTPP equities basket. These countries, which include emerging markets with decent governance as well as Japan, Australia, New Zealand, and Canada all stand to benefit from the global upswing and US foreign policy (Chart 20). Chart 20Reinitiate Long Trans-Pacific Partnership
Reinitiate Long Trans-Pacific Partnership
Reinitiate Long Trans-Pacific Partnership
Chart 21Reinitiate Long Global Value Over Growth
Reinitiate Long Global Value Over Growth
Reinitiate Long Global Value Over Growth
The Biden administration will likely try to rejoin the CPTPP but even if it fails to do so it will privilege relations with these countries as it strives to counter China and Russia. The UK, South Korea, Thailand and others could join the CPTPP over time – though an attempt to recruit Taiwan would exacerbate the geopolitical risks highlighted above centered on Taiwan. The dollar is perking up, adding a near-term headwind to global equities, but the cyclical trend for the dollar is still down due to extreme monetary and fiscal dovishness. Tactically, go long Mexican equities over Brazilian equities. From a strategic point of view we still favor value stocks over growth stocks and recommend investors reinitiate this global trade (Chart 21). Strategically, wait to overweight UK stocks in a global portfolio until the result of the May local elections is known and the risk of Scottish independence can be reassessed. Strategically, favor developed Europe over emerging Europe stocks as a result of Russian geopolitical risks that are set to escalate. Strategically go long global defense stocks versus cyber security stocks as a geopolitical “back to work” trade for a time when economic activity resumes and resource-oriented territorial, kinetic, military risks reawaken. Strategically, favor EM currencies other than Brazil, Turkey, and the Philippines to minimize exposure to economic populism, poor macro fundamentals, and election risk. Strategically, go long the BCA Rare Earths Basket to capture persistent US-China tensions under Biden and the search for alternatives to China. Matt Gertken Vice President Geopolitical Strategy mattg@bcaresearch.com We Read (And Liked) … Supply-Side Structural Reform Supply-Side Structural Reform, a compilation of Chinese economic and policy research, discusses several aspects of Chinese economic reform as it is practiced under the Xi Jinping administration, spanning the meaning and importance of supply-side structural reform in China as well as five major tasks.1 The book consists of contributions by Chinese scholars, financial analysts, and opinion makers in 2015, so we have learned a lot since it was published, even as it sheds light on Beijing’s interpretation of reform. 2015 was a year of financial turmoil that saw a dramatic setback for China’s 2013 liberal reform blueprint. It also saw the launch of a new round of reforms under the thirteenth Five Year Plan (2016-20), which aimed to push China further down the transition from export-manufacturing to domestic and consumer-led growth. Beijing’s renewed reform push in 2017, which included a now infamous “deleveraging campaign,” ultimately led to a global slowdown in 2018-19 that was fatefully exacerbated by the trade war with the United States – only to be eclipsed by the COVID-19 pandemic in 2020. Built on fundamental economic theory and the social background of China, the book’s authors examine the impact of supply-side reform on the Chinese financial sector, industrial sector, and macroeconomic development. The comprehensive analysis covers short-term, mid-term and long-term effects. From the perspective of economic theory, there is consensus that China's supply-side structural reform framework did not forsake government support for the demand side of the economy, nor was it synonymous with traditional, liberal supply-side economics in the Western world. In contrast to Say’s Law, Reaganomics, and the UK’s Thatcherite privatization reforms, China's supply-side reform was concentrated on five tasks specific to its contemporary situation: cutting excessive industrial capacity, de-stocking, deleveraging, cutting corporate costs, and improving various structural “weaknesses.” The motives behind the new framework were to enhance the mobility and efficiency of productive factors, eliminate excess capacity, and balance effective supply with effective demand. Basically, if China cannot improve efficiencies, capital will be misallocated, corporations will operate at a loss, and the economy’s potential will worsen over the long run. The debt buildup will accelerate and productivity will suffer. Regarding implementation, the book sets forth several related policies, including deepening the reform of land use and the household registration (hukou) system, and accelerating urbanization, which are effective measures to increase the liquidity of productive factors. Others promote the transformation from a factor-driven economy to efficiency and innovation-driven economy, including improving the property rights system, transferring corporate and local government debt to the central government, and encouraging investment in human capital and in technological innovation. The book also analyzes and predicts the potential costs of reform on the economy in the short and long term. In the short run, authors generally anticipated that deleveraging and cutting excessive industrial capacity would put more pressure on the government’s fiscal budget. The rise in the unemployment rate, cases of bankruptcy, and the negative sentiment of investors would slow China’s economic growth. In the medium and long run, this structural reform was seen as necessary for a sustainable medium-speed economic growth, leading to more positive expectations for households and corporates. The improved efficiency in capital allocation would provide investors with more confidence in the Chinese economy and asset market. Authors argued that overall credit risk was still controllable in near-term, as the corresponding policies such as tax reduction and urbanization would boost private investment and consumption in the short run. These policies increased demand in the labor market and created working positions to counteract adverse impacts. Employment in industries where excessive capacity was most severe only accounted for about 3% of total urban employment in 2013. Regarding the rise in credit risk during de-capacity, the asset quality of banks had improved since the 1990s and the level of bad debt was said to be within a controllable range, given government support. Moreover, in the long run, the merger and reorganization of enterprises would increase the efficient supply and have a positive effect on economic innovation-driven transformation. We know from experience that much of the optimism about reform would confront harsh realities in the 2016-21 period. The reforms proceeded in a halting fashion as the US trade war interrupted their implementation, prompting the government to resort to traditional stimulus measures in mid-2018, only to be followed by another massive fiscal-and-credit splurge in 2020 in the face of the pandemic. Yet investors could be surprised to find that the Politburo meeting on April 17, 2020 proclaimed that China would continue to focus on supply-side structural reform even amid efforts to normalize the economy and maintain epidemic prevention and control. Leaders also pledged to maintain the supply-side reform while emphasizing demand-side management during annual Central Economic Work Conference in December 2020. In other words, Xi administration’s policy preferences remain set, and compromises forced by exogenous events will soon give way to renewed reform initiatives. This is a risk to the global reflation trade in 2021-22. There has not been a total abandonment of supply-side reform. The main idea of demand-side reform – shifts in the way China’s government stimulates the economy – is to fully tap the potential of the domestic market and call for an expansion of consumption and effective investment. Combined with the new concept of “dual circulation,” which emphasizes domestic production and supply chains (effectively import substitution), the current demand-side reforms fall in line with the supply-side goal of building a more independent and controllable supply chain and produce higher technology products. These combined efforts will provide “New China” sectors with more policy support, less regulatory constraint, and lead to better economic and financial market performance. Despite the fluctuations in domestic growth and the pressure from external demand, China will maintain the focus on reform in its long-term planning. The fundamental motivation is to enhance efficiency and innovation that is essential for China’s productivity and competitiveness in the future. Thus, investors should not become complacent over the vast wave of fiscal and credit stimulus that is peaking today as we go to press. Instead they should recognize that China’s leaders are committed to restructuring. This means that the economic upside of stimulus has a cap on it– a cap that will eventually be put in place by policymakers, if not by China’s lower capacity for debt itself. It would be a colossal policy mistake for China to overtighten monetary and fiscal policy in 2021 but any government attempts to tighten, the financial market will become vulnerable. A final thought: it is unclear whether there is potential for an improvement in China’s foreign relations contained in this conclusion. What the western world is demanding is for China to rebalance its economy, open up its markets, cut back on the pace of technological acquisition, reduce government subsidies for state-owned companies, and conform better to US and EU trade rules. There is zero chance that China will provide all of these things. But its own reform program calls for greater intellectual property protections, greater competition in non-strategic sectors (which the US and EU should be able to access under recent trade deals), and targeted stimulus for sustainable energy, where the US and EU see trade and investment opportunities. Thus there is a basis for an improvement in cooperation. What remains to be seen is how protectionist dual circulation will be in practice and how aggressively the US will pursue international enforcement of technological restrictions on China under the Biden administration. Jingnan Liu Research Associate JingnanL@bcaresearch.com Footnotes 1 Yifu L, et al. Supply-Side Structural Reform (Beijing: Democracy & Construction Publishing House, 2016). 351 pages. Appendix: GeoRisk Indicator China
China: GeoRisk Indicator
China: GeoRisk Indicator
Russia
Russia: GeoRisk Indicator
Russia: GeoRisk Indicator
UK
UK: GeoRisk Indicator
UK: GeoRisk Indicator
Germany
Germany: GeoRisk Indicator
Germany: GeoRisk Indicator
France
France: GeoRisk Indicator
France: GeoRisk Indicator
Italy
Italy: GeoRisk Indicator
Italy: GeoRisk Indicator
Canada
Canada: GeoRisk Indicator
Canada: GeoRisk Indicator
Spain
Spain: GeoRisk Indicator
Spain: GeoRisk Indicator
Taiwan
Taiwan: GeoRisk Indicator
Taiwan: GeoRisk Indicator
Korea
Korea: GeoRisk Indicator
Korea: GeoRisk Indicator
Turkey
Turkey: GeoRisk Indicator
Turkey: GeoRisk Indicator
Brazil
Brazil: GeoRisk Indicator
Brazil: GeoRisk Indicator
Section III: Geopolitical Calendar
Highlights Higher yields in China should continue to encourage inflows into the RMB. However, the gap between Chinese and US/global interest rates will narrow. This will temper the pace of RMB appreciation. The RMB remains modestly undervalued. Higher productivity gains in China will raise the fair value of the currency. The US dollar could have entered a structural bear market. This will also buffet the CNY-USD exchange rate. A big driver for the RMB in the coming years will also be widespread diversification away from USD assets. This will dovetail nicely with the ascension of the RMB in global FX reserves. Feature Chart 1The RMB Often Moves With Relative Rates
The RMB Often Moves With Relative Rates
The RMB Often Moves With Relative Rates
The appreciation in the Chinese yuan has been a boon for global bond, equity and currency investors. With extremely low volatility, the yuan has appreciated by approximately 10% since its May 2020 lows. This places the rise in the RMB on par with what we saw in the 2017/2018 period. It also makes the yuan one of the best performing emerging market currencies this year. One of the key drivers of the yuan’s stellar performance has been the interest rate gap between China and the US (Chart 1). The Chinese economy was one of the first to emerge from the pandemic-driven lockdown. As economic activity recovered, so did local bond yields. With global bond yields now on the rise, this raises the specter that Sino-global bond yield spreads will narrow. The implications for the path of the Chinese yuan are worth monitoring. On the other hand, structural factors also argue that the path of least resistance for the US dollar over the next few years is down. This is positive for the Chinese yuan. Which force will dominate the path of the RMB going forward? In this Special Report, we discuss the intersection between the People’s Bank of China (PBoC) monetary policy and the global environment, and what that means for the Chinese yuan on a 12-month horizon. China And The Global Cycle The evolution of the global economic cycle has important implications for the yuan exchange rate in particular, because the RMB is a pro-cyclical currency. The USD/CNY has been moving tick for tick with emerging market equities, Asian currencies and commodity prices (Chart 2). Meanwhile, China has also been a major engine for global growth. Ever since the global financial crisis, the money and credit cycle in China has led the global recovery (Chart 3). With the authorities set to modestly decelerate the pace of credit creation, it will be important to gauge if this is a risk to global growth and, by extension, the path of the RMB. Chart 2The RMB Has Traded Like A Pro-cyclical Currency
The RMB Has Traded Like A Pro-cyclical Currency
The RMB Has Traded Like A Pro-cyclical Currency
Chart 3The Chinese Impulse Leads ##br##The Global Cycle
The Chinese Impulse Leads The Global Cycle
The Chinese Impulse Leads The Global Cycle
In our view, while the credit impulse in China will roll over, the impact will be to slow the pace of RMB appreciation rather than reverse it, because: The interest rate gap between China and the rest of the world will remain very wide. The current level of 10-year yields in China is 3.3% versus 1.4% in the US. In a world of very low nominal interest rates, a differential of almost 200 basis points makes all the difference. Our base case is that the Chinese credit impulse could slow to 30% of GDP. If past is prologue, this could compress the yield spread to 1.5% but will still provide a meaningful yield pickup for foreign investors (Chart 4). Meanwhile, the real rate differential between China and the US might not narrow much if China continues to reign in credit growth, while the US pursues inflationary policies. Already, inflation in China is collapsing relative to the US, which supports relative real rates in China. The credit impulse tends to lead the economy by six to nine months, thus, for much of 2021, Chinese growth will remain robust. Overall industrial production is picking up meaningfully, with the production of electricity and steel, and all inputs into the overall manufacturing value chain inflecting higher. This will continue to support bond yields in China (Chart 5). In recent weeks, both steel and iron ore prices have been soaring. While supply bottlenecks are playing a role, it is evident from both the manufacturing data and the trend in prices that demand is also a key driver (Chart 6). Chart 4The China-US Spread Will Stay Positive
The China-US Spread Will Stay Positive
The China-US Spread Will Stay Positive
Chart 5Underlying Economic Activity Is Resilient
Underlying Economic Activity Is Resilient
Underlying Economic Activity Is Resilient
Chart 6Strong Chinese Demand For Commodities
Strong Chinese Demand For Commodities
Strong Chinese Demand For Commodities
China has had a structurally higher productivity growth rate compared to the US or Europe for many years, which will continue. It is also the reason why the fair value of the currency has been rising over the last two decades (Chart 7). Higher productivity growth suggests the neutral rate of interest in China will remain high for many years and will attract further fixed income inflows. China is running a basic balance surplus, which indicates that the RMB does not need to cheapen to entice capital inflows (Chart 8). Chart 7The RMB Is Not Overvalued
The RMB Is Not Overvalued
The RMB Is Not Overvalued
Chart 8A Basic Balance Surplus
A Basic Balance Surplus
A Basic Balance Surplus
Chinese bonds are gaining wider investor appeal. Following their inclusion in the Bloomberg Barclays Global Aggregate Index (BBGA) since April 2019, and in the JP Morgan Government Bond - Emerging Market Index (GBI-EM) since February 2020, FTSE Russell announced the inclusion of Chinese government bonds in the FTSE World Government Bond Index (WGBI) as of October 2021. The inclusion of Chinese government bonds in all of the world’s three major bond indices is a seminal milestone in the process of liberalizing the Chinese fixed-income market. Based on both the US$2-4 trillion in AUM, tracking the WGBI index and a 5-6% weight of Chinese bonds, an additional US$150 billion in foreign investments will flow into China’s bond market following the WGBI inclusion. Moreover, the JPMorgan Global Index team predicts that the inclusion of Chinese bonds in the world’s three major bond indices will bring RMB inflows of up to US$250-300 billion. This will be particularly true if Chinese bonds are perceived as a better hedge against equity volatility (Chart 9). Finally, currencies respond to relative rates of return, which include equity returns in addition to fixed income ones. The relative performance of the Chinese equity market in common currency terms has also moved neck and neck with the performance of the RMB (Chart 10). Chart 9Chinese Bonds Could Become The Perfect Hedge
Chinese Bonds Could Become The Perfect Hedge
Chinese Bonds Could Become The Perfect Hedge
Chart 10The RMB Follows Domestic Equity Relative Performance
The RMB Follows Domestic Equity Relative Performance
The RMB Follows Domestic Equity Relative Performance
Bottom Line: Even though the Chinese credit impulse will continue to roll over, bond investors will still benefit from enticing real interest rates in China as its neutral rate of interest is higher. Equity investors will also benefit from a cheaper market, as well as exposure to sectors that are primed to benefit as the global economy reopens. This combination will sustain the pace of foreign capital inflows (Chart 11). Chart 11Inflows Into China Remain Strong
Inflows Into China Remain Strong
Inflows Into China Remain Strong
The Dollar Versus The RMB The path of the RMB in the short-term will follow relative growth dynamics between China and the rest of the world, but structural factors such as the dollar’s reserve status will also dictate its longer-term trend. What China (and other countries for that matter) decide to do with their war chest of US Treasuries is of critical importance. In recent years, foreign investors have been fleeing the US Treasury market at an exceptional pace. On a rolling 12-month total basis, the US saw an exodus of about US$500 billion in bond flows from foreigners, the largest on record (Chart 12). Vis-à-vis official flows, China has become the number one contributor to the US trade deficit. Concurrently, Beijing has been destocking its holdings of Treasuries, if only as retaliation against past US policies, or perhaps to make room for the internationalization of the RMB (Chart 13). Chart 12An Exodus From US Treasurys
An Exodus From US Treasurys
An Exodus From US Treasurys
Chart 13China Destocking Of Treasurys
China Destocking Of Treasurys
China Destocking Of Treasurys
Data from the International Monetary Fund (IMF) shows that the allocation of global foreign exchange reserves towards the US dollar peaked at about 72% in the early 2000s and has been in a downtrend since. Meanwhile, allocation to other currencies, including the RMB, is surging. Moreover, foreign central banks have been amassing tremendous gold reserves, notably Russia and China, almost to the tune of the total annual output of the yellow metal. A diversification away from dollars and into other currencies such as the RMB and gold will be a key factor in dictating currency trends in the next few years (Chart 14). Chart 14The RMB Rises In Global Currency Reserves
The RMB Rises In Global Currency Reserves
The RMB Rises In Global Currency Reserves
The US dollar will remain the reserve currency of the world for years to come, but that exorbitant privilege is clearly fraying at the edges. This is especially the case as balance-of-payments dynamics are deteriorating. Rising US twin deficits have usually been synonymous with a cheapening dollar. Bottom line: For one reason or another, foreign central banks are diversifying out of dollars. This could be a long-term trend, which will dictate the path of the dollar (and by extension the RMB) in the years to come. Other Considerations Chart 15A Forward Discount On The RMB
A Forward Discount On The RMB
A Forward Discount On The RMB
The RMB has historically suffered from capital outflows, especially illicit flows. This is less risky today than in 2015-2016.1 Nonetheless, investors must monitor this possibility. Typically, offshore markets have anticipated the yuan’s depreciation. Back in 2014, offshore markets started pricing in a rising USD/CNY rate, and maintained that view all the way through to 2018, when the yuan eventually bottomed. Right now, 12-month non-deliverable forwards expect a modest depreciation in the yuan (Chart 15). Offshore markets in Hong Kong and elsewhere can be prescient because more often than not, they are the destination for illicit flows out of China. However, this time might be different. First, higher relative interest rates in China have lowered the forward RMB rate investors will receive to hedge currency exposure. Second, junkets (key operators in Macau casinos) have been one of the often-rumored vehicles used for Chinese money to leave the country.2 These junkets bankroll their Chinese clients in Macau while collecting any debts in China, allowing for illicit capital outflows. This was particularly rampant before the Chinese 2015-2016 corruption clampdown, when Macau casino equities were surging while equity prices in China were subdued. This time around, with tourism taking a backseat, the Chinese MSCI index is heavily outpacing the performance of Macau casino stocks, suggesting little evidence of hot money outflows (Chart 16). Chart 16China Versus Macau Stocks: Little Hot Money Outflows Like In 2013/2014
China Versus Macau Stocks: Little Hot Money Outflows Like In 2013/2014
China Versus Macau Stocks: Little Hot Money Outflows Like In 2013/2014
Sino-US trade relations will also affect the exchange rate. China remains the biggest contributor to the US trade deficit, even though the gap has narrowed (Chart 17). There is little evidence that the Biden administration will engage in an all-out trade war with China, but the case for subtle skirmishes exists. Chart 17The US Trade Deficit With China Remains Wide
The US Trade Deficit With China Remains Wide
The US Trade Deficit With China Remains Wide
In a broader sense, the pandemic might have supercharged the de-globalization trend witnessed since 2011. The stability and self-sufficiency in the production capacity of any country's core supply chain have become paramount. From the perspective of the US, this means introducing more policies that attract investment into domestic manufacturing, such as clean energy. US multinational companies may also continue to diversify production risk away from China to other emerging countries, among them Vietnam, Myanmar, and India. This will curtail FDI flows into China at the margin (previously mentioned Chart 8). Concluding Thoughts Chart 18The RMB And The Trade-Weighted Dollar
The RMB And The Trade-Weighted Dollar
The RMB And The Trade-Weighted Dollar
While USD/CNY could bounce in the near term, it is likely to reach 6.2 in the next 12 months. Interest rate spreads at the long end already overtook their 2017 highs and are near cyclically elevated levels. The bond market tends to lead the currency market by a few months, since China does not yet have a fully flexible and open capital account. Meanwhile, the path of the US dollar will also be critical for the USD/CNY exchange rate. We expect the USD to keep depreciating, which will boost the RMB (Chart 18).3 A slower pace of RMB appreciation will fend off interventionist policies by the PBoC. While the exchange rate has appreciated sharply since mid-2020, the CFETS rate has not deviated much from the onshore USD/CNY rate. This will remain the case if the pace of RMB appreciation moderates. Chester Ntonifor Foreign Exchange Strategist chestern@bcaresearch.com Footnotes 1 Please see Chinese Investment Special Report, titled “Monitoring Chinese Capital Outflows,” dated March 20, 2019, available at fes.bcaresearch.com. 2 Please see Reuters article “Factbox: How Macau’s casino junket system works,” available at reuters.com. 3 Please see Foreign Exchange Strategy Special Report, titled “2021 Key Views: Tradeable Themes,” dated December 4, 2020, available at bcaresearch.com. Trades & Forecasts Forecast Summary Core Portfolio Tactical Trades Limit Orders Closed Trades
Highlights The positive correlation between share prices and US bond yields – that has been in place since 1997 – is likely to turn negative. Looking ahead, stock prices will fall when US bond yields rise and will rally when Treasury yields drop. The basis is that the key macro risk to equities is shifting from low inflation/deflation to higher inflation. Global growth stocks will underperform value stocks. US equities will lag international markets. Investment strategies and frameworks that have worked over the past 24 years might require modifications. Feature From 1966 until 1997, US equity prices were negatively correlated with US Treasury yields (Chart 1, top panel). Since 1997, US share prices have been positively correlated with US government bond yields. We believe we are now in the process of a major paradigm shift in the stock-bond correlation, reverting to the pre-1997 relationship. Chart 1US Stock-Bond Correlation: Paradigm Shifts In 1966 And 1997
US Stock-Bond Correlation: Paradigm Shifts In 1966 And 1997
US Stock-Bond Correlation: Paradigm Shifts In 1966 And 1997
The basis for the 1997 reversal in the stock-bond correlation was a regime shift in the global macro backdrop. Before 1997, the main risk to business cycles and share prices was inflation. From 1997 until very recently, the main risk to equity markets was deflation or very low inflation. The watershed event that triggered this global macro shift from inflation to deflation was the Asian currency devaluation of 1997. The latter followed the Chinese currency devaluations of early 1994 and the Mexican peso’s crash of early 1995 (Chart 2). All these currency devaluations allowed local producers – operating in these large manufacturing hubs – to cut their export prices in US dollar terms. The price reductions unleashed deflationary forces that spread all over the world, including the US. US import prices from emerging Asia ex-China began plummeting in 1997 (Chart 3). Chart 2EM Currency Devaluations Set Off A Deflation Shock In Second Half Of 1990s
EM Currency Devaluations Set Off A Deflation Shock In Second Half Of 1990s
EM Currency Devaluations Set Off A Deflation Shock In Second Half Of 1990s
Chart 3Deflating Asian Export Prices Reinforced Disinflation Trends In US
Deflating Asian Export Prices Reinforced Disinflation Trends In US
Deflating Asian Export Prices Reinforced Disinflation Trends In US
Due to this deflationary shock from EM currency devaluations and other forces (productivity gains, globalization and outsourcing, among others), the US core inflation rate dropped to 2% in 1997 (Chart 3). This marked a regime shift in global equity markets where concerns about deflation, rather than inflation, became the prime focus of investors. Consequently, share prices rallied when bond yields rose, i.e., stock investors cheered stronger growth because the latter meant diminished deflation risks and only a modest inflation pickup. The positive relationship also prevailed in the period prior to the mid-1960s when inflation was below 2% (Chart 1). Looking ahead, the main risk to share prices, at least in the US, will be higher inflation. As investors gain confidence that US core inflation will exceed 2%, US share prices will once again exhibit a negative correlation with Treasury yields, as they did prior to 1997. Inflation Redux Odds are that US core inflation will rise well above 2%, and could potentially overshoot, over the coming 12-36 months. Chart 4US Core Inflation Lags Business Cycle By About 12 Months
US Core Inflation Lags Business Cycle By About 12 Months
US Core Inflation Lags Business Cycle By About 12 Months
Cyclical factors driving core inflation higher in the US are as follows: 1. Core inflation lags the business cycle by about 12 months (Chart 4). A continuous economic recovery points to higher core inflation starting this spring. 2. A combination of surging money supply and a potential revival in the velocity of money heralds higher nominal GDP growth and inflation. It is critical to realize that in contrast to the last decade when the Fed was also undertaking QE programs, US money supply is now skyrocketing, as shown in Chart 5. In the Special Report from October 22, BCA’s Emerging Markets team discussed in depth why US money growth is currently substantially stronger than it was in the post-GFC period. Chart 5An Unprecedented US Broad Money Boom
An Unprecedented US Broad Money Boom
An Unprecedented US Broad Money Boom
With household income and deposits (money supply) booming due to fiscal transfers funded by the Fed (genuine public debt monetization), the only missing ingredient for inflation to transpire is a pickup in the velocity of money. Lets’ recall: Nominal GDP = Price Level x Output Volume = Velocity of Money x Money Supply Solving the above equation for inflation, we arrive at: Price Level = (Velocity of Money x Money Supply) / (Output Volume) Going forward, the velocity of US money will likely recover, for it is closely associated with consumer and businesses’ willingness to spend. At that point, a rising velocity of money and greater money supply will work together to exert upward pressure on nominal GDP and inflation (Chart 6). Chart 6As Velocity Of Money Rises, Inflation Will Accelerate
As Velocity Of Money Rises, Inflation Will Accelerate
As Velocity Of Money Rises, Inflation Will Accelerate
Chart 7US Goods Prices Are Rising
US Goods Prices Are Rising
US Goods Prices Are Rising
3. Demand-supply distortions and shortages will lead to higher prices. The pandemic has distorted supply chains while the overwhelming demand for manufacturing goods has, accordingly, produced shortages. US household spending on goods is booming and US core goods prices as well as import prices from emerging Asia, China and Mexico are rising (Chart 7). Lockdowns will likely permanently curtail capacity in some service sectors. Meanwhile, the reopening of the economy will likely release pent-up demand for services. As a result, demand for some services will overwhelm supply and companies will take advantage of this new reality by charging considerably higher prices. Consumers will not mind paying higher prices to enjoy services that were not available to them for 18 months or so. This will lead to higher inflation expectations, which might become engrained. Critically, this could happen even if the unemployment rate is high or the output gap is large. 4. Pandemic-related fiscal stimulus in the US has amounted to 21% of GDP. We reckon this exceeds the lingering output gap that opened up in response to the economic crash last year. In short, US authorities are over-stimulating. On top of cyclical forces, there are several structural forces pointing to higher inflation: Higher concentration in US industries and the consequent reduction in competition create fertile grounds for inflation. Over the past two decades, the competitive structure of many US industries has changed: it has become oligopolistic. Due to cheap financing and weak enforcement of anti-trust regulations, large companies have acquired smaller competitors. Chart 8 shows the number of anti-trust enforcement cases has been in a secular decline and is currently very low. In the recent past, there were slightly more than 100 cases per annum while the 1970s averaged more than 400 cases per annum when the economy was much smaller and industry concentration was much lower than now. In many industries, several dominant players now have a substantial market share. Such a high concentration across many industries raises odds of collusion and price increases where conditions permit. Chart 9 demonstrates a measure of market concentration across all US industries. A higher number indicates higher industry concentration. Presently, we have the highest concentration in 50 years, which creates fertile ground for companies to raise their prices. Notably, the sharp drop in this measure of market concentration in the early 1980s was one of reasons behind the secular disinflation trend that followed. Chart 8In Past 20 Years Antitrust Regulations Have Not Been Reinforced In US
In Past 20 Years Antitrust Regulations Have Not Been Reinforced In US
In Past 20 Years Antitrust Regulations Have Not Been Reinforced In US
Chart 9US Industry Concentration Is At A Record High
US Industry Concentration Is At A Record High
US Industry Concentration Is At A Record High
Chart 10US Demographic Points Towards Higher Wage Inflation
US Demographic Points Towards Higher Wage Inflation
US Demographic Points Towards Higher Wage Inflation
Retirement of baby boomers entails more consumption and less production and is inflationary, ceteris paribus. The US support ratio1 (shown inverted on the chart) portends that the US is transitioning from an environment of low to higher wage growth (Chart 10). This ratio is calculated as the number of workers relative to consumers. This means more consumers exist versus workers available to produce goods and services and, hence, entails higher wages. Higher employee compensation, unless supported by rapid productivity gains, will beget higher inflation. Government policies targeting faster growth in employee compensation are conducive to higher inflation. One of the Biden administration’s key priorities is to boost wages and reduce income inequality. Unless productivity growth accelerates considerably in the coming years, odds are that labor’s share in national income will rise and companies’ profit margins will be jeopardized. Businesses will attempt to raise prices to restore their profit margins. Provided that income and spending are robust, companies might succeed in raising their prices. In the US, a (moderate) wage-inflation spiral is probable in the coming years. De-globalization – the ongoing shift away from the lowest price producer – entails higher costs of production and, ultimately, higher prices. US import prices are already rising (Chart 7 above). If the US dollar continues to depreciate, exporters to the US will have no other choice but to raise US dollar prices to protect their profit margins. Bottom Line: The US core inflation rate will rise well above 2% in the coming years. Inflationary pressures will become evident later this year when the economy opens up. The main risk to this view is that technology and automation will boost productivity and allow companies to cut or maintain prices despite rising wages. An Invincible Fed? Many investors are relying on the Fed and other central banks to get things right. Yet, policymakers are not always infallible. We offer several reasons why putting one’s faith squarely in the Fed at present might not be the most appropriate investment strategy. It is not unusual for central banks and other government agencies to fight previous wars. As long as the same war lingers, the Fed’s vision and strategy will remain adequate and its policies and actions will secure financial and economic stability, to the benefit of both bond and equity markets. Chart 11US Financial Markets Aggregate Volatility
US Financial Markets Aggregate Volatility
US Financial Markets Aggregate Volatility
However, if we are experiencing a macro paradigm shift from low to higher inflation, the Fed’s strategy and actions will likely prove inadequate, begetting higher financial market volatility, i.e., instability (Chart 11). In brief, if our inflation redux thesis is correct, the Fed will fall behind the inflation curve. In such a scenario, the bond market will continue selling off and rising yields will depress equity valuations. The Fed is excessively and singularly relying on the output gap models and the Phillips curve to forecast inflation. Yet, inflation is a complex and intricate phenomenon, and it is shaped by numerous cyclical and structural forces beyond the output gap and unemployment. Importantly, the output gap and the Phillip’s curve are theoretical models that do not have great success in real-time forecasting. If these models turn out to be wrong, policy decisions will be suboptimal. Financial markets, which up until now have put their faith in the Fed, will riot. Chart 12Inflation Could Rise And Stay High Amid High Unemployment
Inflation Could Rise And Stay High Amid High Unemployment
Inflation Could Rise And Stay High Amid High Unemployment
Interestingly, a popular economic index in the 1970s was the Misery Index, which is calculated as the sum of the inflation rate and the unemployment rate (Chart 12, top panel). The Misery Index was extremely elevated in the 1970s because both unemployment and inflation were high (Chart 12, bottom panel). The point is that inflation can be high alongside elevated unemployment. In its recent report, BCA Research’s Global Investment Strategy service argued: “Some of the mistakes that policymakers made during the 60s and 70s were far from obvious at the time. Athanasios Orphanides, who formerly served as a member of the ECB’s Governing Council, has documented that central banks in the US and other major economies systematically overestimated the amount of slack in their economies. They also overestimated trend growth, with the result that they came to see the combination of sluggish growth and seemingly high unemployment as evidence of inadequate demand.” Inflation is a very inert and persistent phenomenon, and it is not easy to reverse its trajectory. The Fed is now explicitly targeting higher inflation with full confidence that it can easily deal with high inflation when it transpires. We would bet that the Fed will get higher inflation this time, but that high inflation will turn out to be an unpleasant outcome for US policymakers. The basis is that US equity and credit markets are not priced for higher interest rates. By directly and indirectly super-charging equity and bond prices, the Fed has crafted excesses that are vulnerable to higher interest rates (Chart 13). Chart 13US Markets Are Priced To Perfection
US Markets Are Priced To Perfection
US Markets Are Priced To Perfection
On the whole, the Fed is set to fall behind the inflation curve as policymakers will be late to acknowledge higher inflation and alter their policy accordingly. This will be bad news for both equity and corporate bond markets that are priced for perfection. The 1960s Roadmap For Financial Markets? There are many similarities between the US macro picture now and as it was in the late 1960s. In the late 1960s: US inflation was subdued, and interest rates were very low in the preceding two-three decades, i.e., inflation expectations were well anchored heading into the second half of the 1960s. America’s fiscal policy was extremely easy, and the budget deficit was swelling. US domestic demand was robust, and the current account deficit was widening. Chart 14FAANGM Now And Nifty-Fifty Mania In The 1960s
FAANGM Now And Nifty-Fifty Mania In The 1960s
FAANGM Now And Nifty-Fifty Mania In The 1960s
Finally, US equities were in a long bull market and a dozen large-cap stocks (the Nifty-Fifty) was leading the rally. Notably, the decade-long profile of FAANGM2 stock prices in real terms (adjusted for inflation) resembles that of Walt Disney – one of the leaders of the Nifty-Fifty pack – in the 1960s (Chart 14). The following dynamics of financial markets in the 1960s and 1970s are noteworthy and could serve as a roadmap for the present: In the mid-1960s, US share prices initially ignored rising bond yields. However, obstinately rising Treasury yields eventually led to a major equity sell-off (bond yields are shown inverted on this panel) (Chart 15, top panel). Yet, bond yields continued ascending despite plunging share prices. Chart 151962-1974: Stock Prices, Bond Yields, Business Cycle And Inflation
1962-1974: Stock Prices, Bond Yields, Business Cycle And Inflation
1962-1974: Stock Prices, Bond Yields, Business Cycle And Inflation
The culprit was US core inflation surging well above 2% in 1966. This marked a paradigm shift in the relationship between equity prices and US Treasury yields. Share prices bottomed in late 1966 only after bond yields began declining. Notably, the S&P 500 fell by 22% in 1966, even though economic growth remained robust (Chart 15, middle panel). Critically, US bond yields in the period from 1966 until the early 1980s were more correlated with the core inflation rate than with the business cycle (Chart 15, middle and bottom panels). In short, sticky and persistent inflation not economic growth was the main worry for both US bond and stock markets from the mid-1960s until the early-1980s. Presently, the US recovery will continue, and economic growth will be rather robust. However, core inflation will climb well above 2% and US Treasury yields will increase further. At some point, this will upset the equity market. Chart 16US And EM EPS Growth Expectations Are Already Very Elevated
US And EM EPS Growth Expectations Are Already Very Elevated
US And EM EPS Growth Expectations Are Already Very Elevated
A pertinent question for stocks from a valuation standpoint is whether profit growth expectations can continue to increase enough to offset the rise in the discount factor. US equities are already pricing in a lot of earning growth: analysts’ expectations for the S&P 500’s EPS growth are 24% for 2021 and another 15% for 2022. Worth noting is that long-term EPS growth expectations have skyrocketed for both US and EM equities (Chart 16). In short, the main problem with US equities is that their valuations are expensive at a time when inflation and interest rates are set to rise. Investment Strategy The equity rally is entering a risky period. Major shakeouts are likely. Share prices will advance when US bond yields drop, and they will dip when Treasury yields ascend. As and when US share prices drop due to concerns about higher inflation, the Fed will attempt to calm investors arguing that inflation is transitory, and it knows how to deal with it. Stocks and bonds will likely rally on reassurances of this kind. However, financial markets will resume selling off if evidence from the real economy corroborates the thesis of higher inflation. The Fed will again soothe the investment community. Although equity and bond prices might firm up anew, such a rebound might not last long as investors will begin to question the appropriateness of the Fed’s policy. Chart 17No Contrarian Buy Signal For US Treasurys
No Contrarian Buy Signal For US Treasurys
No Contrarian Buy Signal For US Treasurys
The sell-off in US Treasurys is unlikely to be over for now as traders’ sentiment on government bonds is far from a bearish extreme (Chart 17). Ultimately, to cap inflation, the Fed will have to hike interest rates more than the fixed-income market is currently pricing. This will not go down well with stock or bond markets. Higher US bond yields entail that global growth stocks will underperform global value stocks. The former is much more expensive and, hence, is more vulnerable to a rising discount rate. Global equity portfolios should underweight the US, adopt a neutral stance on EM and overweight Europe and Japan. The market-cap weight of growth stocks is the highest in the US followed by EM. European and Japanese bourses are less vulnerable to rising bond yields. The Fed falling behind the inflation curve is fundamentally bearish for the US dollar. That is why the primary trend for the dollar remains down. However, the greenback is very oversold and a rebound is likely, especially if US yields continue to rise, triggering a period of risk-off in global financial markets. Arthur Budaghyan Chief Emerging Markets Strategist arthurb@bcaresearch.com Footnotes 1This measure was originally shown by BCA’s Global Investment Strategy team and is calculated as the ratio of the number of workers to the number of consumers. The number of workers incorporates age-specific variation in labor force participation, unemployment, hours worked, and productivity while the number of consumers incorporates age-specific variation in needs or wants based on age-specific consumption data. 2An equally-weighted index of Facebook, Amazon, Apple, Netflix, Google (Alphabet) and Microsoft stock prices.