Emerging Markets
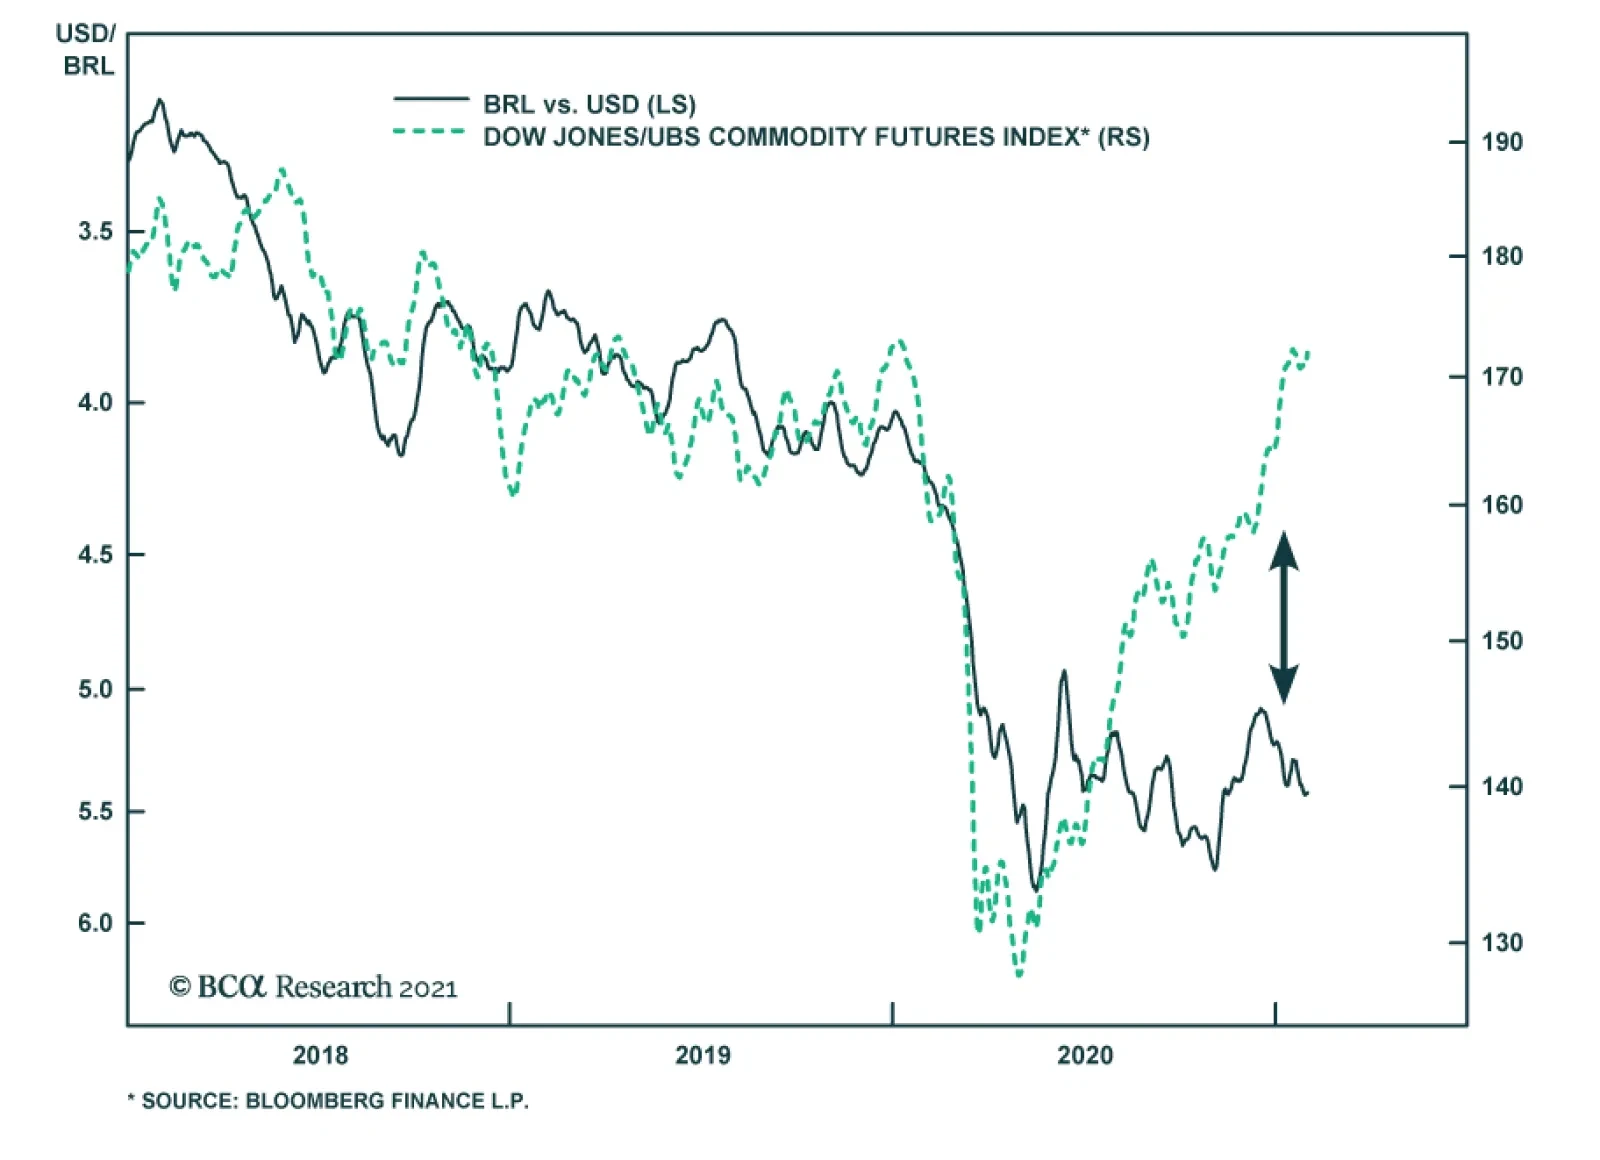
BCA Research’s Emerging Markets Strategy service remains negative on the BRL. Brazilian stocks will only become a clear buy after their risk premium reflects fiscal challenges better. Rising resource prices and the global risk-on environment have failed to…
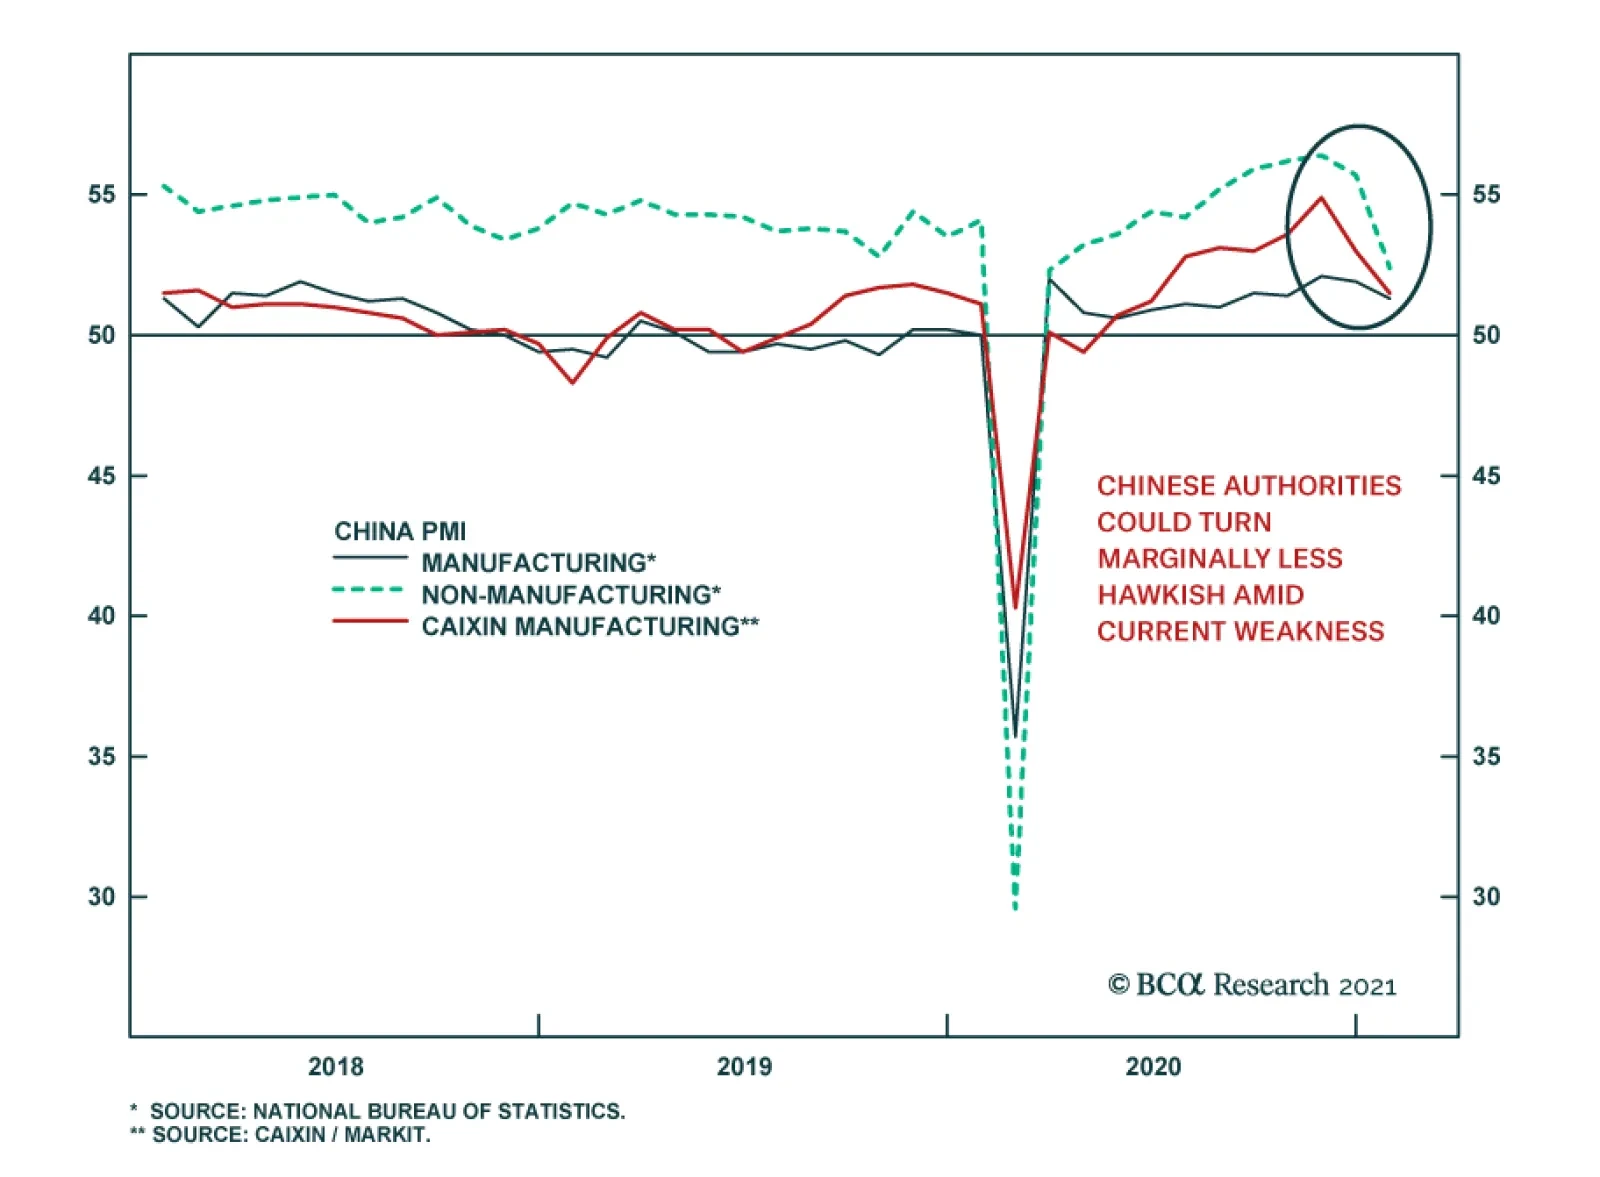
China’s economic recovery moderated more than expected in January. The composite PMI released by China’s National Bureau of Statistics fell to 52.8 from 55.1 on the back of both weaker readings for the Manufacturing and Non-Manufacturing components.…
BCA Research’s Global Investment Strategy service concludes that continued Chinese stimulus will support commodities and cyclical equity sectors. It will also allow the RMB to strengthen further, which should be beneficial for other EM assets. The…

Highlights The enormous size of US stimulus and overflow of liquidity is creating a thrill akin to riding a tiger. Remarkably, this kind of jubilation is very similar to what EM experienced in 2009-10. That was followed by a lost decade for EM. The US equity and bond markets as well as the economy have grown accustomed to constant stimulus – an addiction that will be very hard to wean off. Due to recurring stimulus, the US will experience asset bubbles and inflation in the real economy. The Fed will fall behind the inflation curve. The resulting downward pressure on the US dollar in the coming years favors EM stocks and fixed-income markets over their US counterparts. Feature Policymakers worldwide and in the US in particular “are riding a tiger”. Congress is authorizing unlimited spending and the government is on a borrowing and spending spree. So far there are no constraints on the ballooning budget deficit. Government bond yields are well behaved. In turn, the Fed is printing limitless money to finance the Treasury and there have been no market or economic constrictions. Share prices are at a record high and credit spreads are very tight. The US dollar is depreciating but it is a benign adjustment for the US because the greenback had been too strong for too long. Chart 1EM's Soft-Budget Constraints In 2009-10 Were Followed By A Decade-Long Hangover
EM's Soft-Budget Constraints In 2009-10 Were Followed By A Decade-Long Hangover
EM's Soft-Budget Constraints In 2009-10 Were Followed By A Decade-Long Hangover
In brief, the enormous size of US stimulus and overflow of liquidity is creating a thrill akin to riding a tiger. Remarkably, this kind of jubilation is very similar to what EM experienced in 2009-10. At the BCA annual conference in New York in 2016, one of the invited speakers – a hedge fund manager – recounted that in 2010, in a private conversation with an investor, Brazilian President Lula da Silva likened ruling Brazil to driving a sports car at high speed in the city with no police around. These were prescient words to describe the situation in Brazil’s economy and financial markets in 2009-10. In 2009-10, Brazil – like many other developing countries – benefited from both the impact of China’s enormous stimulus on commodities prices as well as from foreign capital inflows in part triggered by the Fed’s QE program. In addition, its own government provided sizeable monetary and fiscal stimulus. This stimulus trifecta – emanating from China, the US and local authorities – produced a one-off economic boom and a cyclical bull market in Brazil and other EM countries. Yet, the exuberance was followed by a stagflationary period in Brazil, and later a depression and associated rolling bear markets. Brazil was a poster child for that EM era. The experience of other EM economies was similar and the performance of their financial markets was equally underwhelming. These economies, their leaders, and financial markets wholly enjoyed the stimulus of that period. What followed, however, was a drawn-out hangover that lasted many years: EM ex-China, Korea and Taiwan share prices have been flat for the past 10 years and their currencies were depreciating till last spring (Chart 1). China, the epicenter of epic stimulus in 2009-10, had a similar experience. Its investable ex-TMT stocks, i.e., excluding Alibaba, Tencent and Meituan, are presently at the same level as they were in 2010 (Chart 2). The underlying cause has been a collapse in listed companies’ return on assets (Chart 2, bottom panel). It is essential to emphasize that such poor Chinese equity market performance occurred despite recurring fiscal and credit stimulus from Chinese authorities since 2009 (Chart 2, top panel). As we discussed in detail in a previous report, soft-budget constraints – unlimited stimulus and liquidity overflow – led to complacency, inefficiencies and falling return on capital in EM/China. Chart 3 demonstrates that EM EPS (including China, Korea and Taiwan and their TMT companies) has been flat for 10 years and non-financial companies’ return on assets plunged during the past decade. Chart 2China: "Free Money" Undermined Corporate Efficiency And Profitability
China: "Free Money" Undermined Corporate Efficiency And Profitability
China: "Free Money" Undermined Corporate Efficiency And Profitability
Chart 3EM EPS And Return On Assets: The Lost Decade
EM EPS And Return On Assets: The Lost Decade
EM EPS And Return On Assets: The Lost Decade
Can The US Dismount The Tiger? The US is currently experiencing no budget constraints. US broad money (M2) growth is at a record high both in nominal and real terms (Chart 4). In turn, the fiscal thrust was 11.4% of GDP last year and will remain substantial this year as most of Biden’s stimulus plan is likely to gain approval from Congress. Chart 4Helicopter Money In The US
Helicopter Money In The US
Helicopter Money In The US
Chart 5China Has Not Been Able To Wean Off Stimulus
China Has Not Been Able To Wean Off Stimulus
China Has Not Been Able To Wean Off Stimulus
Such an explosive boom in US money supply and fiscal largess will continue. Even after the pandemic is under control, it will be hard for policymakers to withdraw stimulus. China is a case in point. In the past 10 years, any time Beijing attempted to reduce the stimulus, China’s economic growth downshifted considerably and financial markets sold off (Chart 5, top panel). This forced Chinese policymakers to continuously enact new rounds of stimulus measures. As a result, they have not been able to achieve their goal of stabilizing the credit-to-GDP ratio (Chart 5, bottom panel). Similar dynamics will likely transpire in the US. Having been inflated enormously, US equity and corporate credit markets will be exceptionally sensitive to any policy shifts. US financial markets will riot at any attempt to withdraw monetary or fiscal stimulus. Given how sensitive US policymakers are to selloffs in financial markets, authorities will be extremely reluctant to exit these stimulative policies. Overall, the US equity and bond markets as well as the economy have grown accustomed to constant stimulus – an addiction that will be very hard to wean off. Bottom Line: Riding a tiger is fun. The hitch is that no one can safely get off a tiger. Similarly, US authorities are currently enjoying the exuberance from stimulus, but they will not be able to safely and smoothly dismount. Inflation, Asset Bubbles Or Capital Misallocation? In any system where an explosive money/credit boom persists, the outcome will be one or a combination of the following: inflation, asset bubbles or capital misallocation. Charts 6 and 7 illustrate that rampant money/credit growth in Japan and Korea in the second half of the 1980s produced property and equity market bubbles. Chart 6Japan: Money And Asset Prices
Japan: Money And Asset Prices
Japan: Money And Asset Prices
Chart 7Korea: Money And Asset Prices
Korea: Money And Asset Prices
Korea: Money And Asset Prices
Chart 8Deploying Credit To Capital Spending Could Lead To Deflation
Deploying Credit To Capital Spending Could Lead To Deflation
Deploying Credit To Capital Spending Could Lead To Deflation
In China’s case, the 2009-10 stimulus resulted in a property bubble as well as capital misallocation. Over the years, we have discussed these outcomes in China in detail and will not elaborate on them in this report. The pertinent question is why inflation has remained depressed in China. In fact, bouts of deflation occurred in various industries in China in the past 10 years. One usually associates a money/credit boom with demand exceeding supply resulting in higher inflation. That is correct if money/credit origination finances consumption with little capital expenditures taking place. However, the credit outburst in China enabled a capital spending boom. This led to a greater supply of goods and services, which in many cases exceeded underlying demand. The upshot has been deflation in various goods prices (Chart 8). History does not repeat but it rhymes. Open-ended stimulus in the US will eventually lead to years of economic and financial malaise. The nature of the challenges that the US will face matters not only to US financial markets but also to EM. Odds are that the US will experience asset bubbles and inflation in the real economy. We will not debate whether the US equity market is already in a bubble or not. Suffice it to say that in our opinion, parts of the market are already in a bubble. The main observation we will make in that regard is as follows: the sole way to justify the current broad US equity valuations is to assume that US Treasurys yields will not rise from the current levels. If US bond yields do not rise much, equity prices could hover at a high altitude. However, any mean reversion in US bond yields will deflate American share prices considerably. In turn, the outlook for US bond yields is contingent on the Fed’s willingness to continue with QE. We do not doubt the Fed will continue buying government securities until it faces a significant inflationary threat. Hence, the primary threat to US and global equity prices is inflation. Fertile Grounds For Inflation In The US Odds of inflation rising meaningfully above 2% in the US economy in the next 12-24 months have increased substantially:1 1. A combination of surging money supply and a potential revival in the velocity of money herald higher nominal GDP growth and inflation. It is critical to realize that in contrast to the last decade when the Fed was also undertaking QE programs, US money supply is now skyrocketing, as shown in Chart 4. In the Special Report from October 22 we discussed in depth why US money growth is currently substantially stronger than the post-GFC period. With household income and deposits (money supply) booming due to fiscal transfers funded by the Fed, the only missing ingredient for inflation to transpire is a pickup in the velocity of money. Lets’ recall: Nominal GDP = Price Level x Output Volume = Velocity of Money x Money Supply Solving the above equation for inflation, we get: Price Level = (Velocity of Money x Money Supply) / (Output Volume) Going forward, the velocity of US money will likely recover, for it is closely associated with consumer and businesses’ willingness to spend. At that point, a rising velocity of money and greater money supply will work together to exert upward pressure on nominal GDP and inflation (Chart 9). Chart 9The US: The Velocity Of Money Correlates With Inflation Momentum
The US: The Velocity Of Money Correlates With Inflation Momentum
The US: The Velocity Of Money Correlates With Inflation Momentum
2. Government policies targeting faster growth in employee compensation are conducive to higher inflation. One of the Biden administration’s key priorities is to boost wages and reduce income inequality. Unless productivity growth accelerates considerably in the coming years, odds are that labor’s share in national income will rise and companies’ profit margins will shrink (Chart 10). Businesses will attempt to raise prices to restore their profit margins. Provided income and spending will be strong, companies could succeed in raising their prices. In the US, a modest wage-inflation spiral is probable in the coming years. Chart 10The US: Faster Wage Growth Will Likely Undermine Corporate Profit Margins
The US: Faster Wage Growth Will Likely Undermine Corporate Profit Margins
The US: Faster Wage Growth Will Likely Undermine Corporate Profit Margins
Chart 11US Core Goods Price Inflation Is Accelerating
US Core Goods Price Inflation Is Accelerating
US Core Goods Price Inflation Is Accelerating
3. Demand-supply distortions and shortages will lead to higher prices. The pandemic has distorted supply chains while the overwhelming demand for manufacturing goods has produced shortages of manufacturing goods. US household spending on goods is booming and US core goods prices as well as import prices from emerging Asia and China are rising (Chart 11). In the service sector, lockdowns will permanently curtail capacity in some sectors. Meanwhile, the reopening of the economy will likely release pent-up demand for services, leading to shortages in certain segments. 4. De-globalization – the ongoing shift away from the lowest price producer – entails higher costs of production and, ultimately, higher prices. 5. Higher industry concentration and less competition create fertile grounds for inflation. Over the past two decades, the competitive structure of many US industries has changed – it has become oligopolistic. Due to cheap financing and weak enforcement of anti-trust regulation, large companies have acquired smaller competitors. In many industries, several dominant players now have a substantial market share. Such a high concentration across many industries raises odds of collusion and price increases when the macro backdrop permits. In sum, US inflation will rise well above 2% in the coming years. Inflationary pressures will become evident later this year when the economy opens up. The main and overarching risk to this view is that technology and automation will boost productivity and allow companies to cut or maintain prices despite cost pressures. Conclusions And Investment Strategy As America’s economy normalizes in the second half of this year, US inflationary pressures will begin rising. However, the Fed will fall behind the inflation curve – it will be late to acknowledge the potency of the inflationary pressures and act on it. It is typical for policymakers to downplay a budding new economic or financial tendency when they have long been pre-occupied with the opposite. Policymakers often fight past wars and are slow to calibrate their policy when the setting changes. The Fed falling behind the inflation curve is bearish for the US dollar in the medium and long-term. Share prices will be caught between rising inflationary pressures and the Fed’s continuous dovishness. This could create large swings in share prices: the market will sell off in response to evidence of rising inflation but will rebound after being calmed by the Fed. Eventually, fundamentals will prevail and the next US equity bear market will be due to higher inflation and rising bond yields. Over the coming several years, US share prices and bond yields will be negatively correlated as they were in the second half of the 1960s (Chart 12). Chart 12The 1960-70s: US Treasury Yields And The S&P 500 Were Negatively Correlated
The 1960-70s: US Treasury Yields And The S&P 500 Were Negatively Correlated
The 1960-70s: US Treasury Yields And The S&P 500 Were Negatively Correlated
Chart 13Will Gold Outperform Global Equities?
Will Gold Outperform Global Equities?
Will Gold Outperform Global Equities?
This is not imminent, but it is not several years away either. Inflation could become the market’s focus later this year. Such a backdrop of heightening inflation risks and the Fed falling behind the curve will favor gold over equities – this ratio might be making a major bottom (Chart 13). In this context, we reiterate our trade of being long gold/short EM stocks. For now, global risk assets are extremely overbought and many of them are expensive. In short, they are overdue for a correction. During this setback, EM equities and credit markets will suffer and in the near term could even underperform their respective global benchmarks. In anticipation of such a setback, we have not upgraded EM to overweight. We continue to recommend maintaining a neutral allocation to EM in global equity and credit portfolios. Consistently, the US dollar will rebound because it is very oversold. We continue shorting a basket of EM currencies versus the euro, CHF and JPY. High-risk currencies will underperform low-beta currencies. The EM/China backdrop remains disinflationary. Therefore, fixed-income investors should continue receiving 10-year swap rates in the following EM countries: Mexico, Colombia, Russia, China, Korea, India, and Malaysia. Arthur Budaghyan Chief Emerging Markets Strategist arthurb@bcaresearch.com Footnotes 1 This is the view of BCA’s Emerging Markets team and is different from BCA’s house view. The latter is more benign on the US inflation outlook in the coming years. Equities Recommendations Currencies, Credit And Fixed-Income Recommendations
Highlights Pandemic uncertainty is keeping the USD well bid by raising global economic policy uncertainty. When this breaks – i.e., as higher vaccination rates push contagion rates down – the USD will resume its bear market. Renewable-energy output surpassed fossil-fuel generation in Europe for the first time in 2020. With the Biden administration re-committing to renewables, and China and Europe continuing their build-outs, copper demand will rise to meet grid-expansion needs. Copper mine output fell 0.5% in Jan-Oct 2020. Treatment and refining charges – already at 10-year lows – will remain depressed as supplies tighten. Major exchanges’ refined copper inventories were down 17% y/y in December, suggesting weak mine output continued into end-2020. Stocks will continue to fall this year, backwardating the COMEX's copper forward curve (Chart of the Week). Based on the World Bank’s forecast for real global GDP growth of 4% this year, and our expectation for a weaker USD, COMEX copper prices will likely breach $4.00/lb by 2H21. COVID-19 uncertainty drives metals: If infection and hospitalization rates outpace vaccinations, additional lockdowns in the US and Europe will stymie the recovery. Success in expanding vaccinations will push economic activity higher. We expect the latter outcome. Feature Pandemic uncertainty is driving global economic policy uncertainty, which is keeping a safe-haven bid under the USD (Chart 2). Chart of the WeekPhysical Copper Deficit Signals Continued Inventory Draws
Physical Copper Deficit Signals Continued Inventory Draws
Physical Copper Deficit Signals Continued Inventory Draws
This continues to stymie the recovery in industrial commodity prices, particularly oil and base metals.1 The uncertainty caused by the COVID-19 pandemic feeds directly into global economic policy uncertainty, which drives USD safe-haven demand. Chart 2USD Remains In The Thrall Of Pandemic Uncertainty
USD Remains In The Thrall Of Pandemic Uncertainty
USD Remains In The Thrall Of Pandemic Uncertainty
Pandemic uncertainty will not abate until vaccination distribution is sufficient to put infection, hospitalization and death rates on a clear downward trajectory, and remove the threat of widespread lockdowns, which once again are required to deal with rampant contagion rates and the possible spread of vaccine-resistant COVID-19 mutations locally and globally. As markets see empirical evidence of falling COVID-19-related infection, hospitalization and mortality, safe-haven demand for USD will weaken. Massive fiscal and monetary support will continue to support GDP globally, until organic growth takes off after sufficient populations are vaccinated, per the World Bank’s assumptions (Chart 3).2 Fiscal stimulus in the US exceeds 25% of GDP, and will continue to expand as the Biden administration rolls out additional spending measures. With the Fed remaining willing and able to accommodate this massive fiscal profligacy in the US, the USD will face increasing pressure on the downside as normalcy returns. Chart 3Massive Fiscal Support Globally Will Be Replaced By Organic Growth
Pandemic Uncertainty Will Fall, Weakening USD, Boosting Metals
Pandemic Uncertainty Will Fall, Weakening USD, Boosting Metals
A weaker USD and stronger economic growth would boost copper prices this year and the next. A 5% decline in the broad trade-weighted USD this year would push spot COMEX copper prices above $4.30/lb, all else equal, while a 4% boost in world GDP – in line with the World Bank’s forecast for real growth this year – would lift prices to just under $4.05/lb, based on our modeling (Chart 4).3 Chart 4Lower USD, Stronger GDP Bullish For Copper Prices
Lower USD, Stronger GDP Bullish For Copper Prices
Lower USD, Stronger GDP Bullish For Copper Prices
Renewable Generation Will Boost Copper Demand In addition to these stronger fundamentals, base metals demand – particularly for copper – will continue to benefit from the build-out of renewable-energy electricity generation globally, particularly in Europe and China. The return of the US to the Paris Agreement to combat climate change, and a renewed effort by the Biden administration to fund expanded renewable-energy resources will add to the increase in base-metals demand accompanying this global build-out (Chart 5).4 Europe is moving out ahead of the US in its deployment of renewable electricity generation, which, for the first time ever, surpassed fossil-fuel generation in 2020.5 S&P Global Market Intelligence this week reported renewable energy sources accounted for 38% of electricity generation in the EU vs 37% for fossil fuels. Renewables also surpassed fossil-fuel generation in the UK last year. Wind, solar and hydro all saw strong gains. Chart 5Copper Is Indispensible For A Low-Carbon Future
Pandemic Uncertainty Will Fall, Weakening USD, Boosting Metals
Pandemic Uncertainty Will Fall, Weakening USD, Boosting Metals
Copper Supply Continues To Tighten It is important to once again note that all of these, and other renewable technologies, will require higher base metals output, none moreso than copper, which spans all renewable technologies. With copper-mining capex still weak and ore qualities falling in the mines that are producing, the supply side remains challenged (Chart 6). Over the past two years, p.a. supply growth on the mining side has been close to flat. The International Copper Study Group (ICSG) this week reported copper mine output fell 0.5% in the first 10 months of 2020. Refined copper output was up 1.5% over the same interval. Treatment and refining charges – already at 10-year lows – will remain depressed as supplies tighten. We expect full-year mined and refined output to fall on either side of zero growth for 2020, and 2021 (Chart 7).6 Major exchanges’ refined copper inventories were down 17% y/y in December, according to the ICSG, suggesting weak mine output continued into end-2020. An apparent increase in refined copper consumption of 2% noted by the ICSG also contributed to lower inventories. The Group estimates global refined copper balances adjusted for changes in Chinese bonded stocks, which are believed to have increased 105k tons y/y in the Jan-Dec 2020 interval, posted a physical deficit of ~ 380k tons. Chart 6Weak Capex, Lower Copper Ore Quality Remain Chief Supply-Side Challenges
Weak Capex, Lower Copper Ore Quality Remain Chief Supply-Side Challenges
Weak Capex, Lower Copper Ore Quality Remain Chief Supply-Side Challenges
Chart 7Mined, Refined Copper Supply Growth Remains Weak
Mined, Refined Copper Supply Growth Remains Weak
Mined, Refined Copper Supply Growth Remains Weak
We expect inventories will continue to fall this year – as seen in the Chart of the Week – as demand strengthens and supply growth remains weak, which will backwardate the COMEX copper forward curve. Metal Ox Year Brings Short-Term Uncertainties The approach of the Chinese New Year beginning 12 February 2021 normally would herald massive travel and celebration, which, all else equal, would dampen economic growth until festivities ended. This year, however, reports of a re-emergence of COVID-19 infections is casting doubt on this year’s celebrations. In addition, winter industrial curtailments to reduce pollution also should reduce short-term demand for metals generally. These transitory factors should show up in lower levels of economic activity on the industrial side. For this reason, we expect seasonal weakness to show up in 1Q21 activity, to be followed in 2Q21 by higher growth y/y. Bottom Line: Copper fundamentals continue to paint a bullish price picture, particularly on the supply side. Although risks abound on both sides of the market, we expect the massive support being provided by fiscal and monetary policy globally to transition to organic growth in 2H21, in line with the World Bank’s expectations. The enormous fiscal stimulus being unleashed by the US – coupled with an ultra-accommodative Fed – will result in a weakening of the USD that will provide a tailwind to copper prices in 2H21 and next year. We remain long the PICK ETF, expecting copper miners and traders to benefit from this bullish backdrop, which we expect to persist for the next decade. The recommendation is up 6.4% since inception December 10, 2020. We also remain long December 2021 copper, which is up 19.6% since it was recommended on September 10, 2020. Robert P. Ryan Chief Commodity & Energy Strategist rryan@bcaresearch.com Commodities Round-Up Energy: Bullish After falling 11% in 2020 due to COVID-19-induced demand destruction, US energy-related CO2 emissions will rebound this year and next, according to the Energy Information Administration (Chart 8). The EIA forecasts US energy-related CO2 emissions this year and next will be 4.8 and 4.9 billion MT, which would amount to a 4.7% and 3.2% gains, respectively. The EIA tracks emissions from coal, petroleum and natural gas usage in the US in its estimates. Petroleum accounts for ~ 46% of total emissions in 2021 and 2022, while natgas contributes ~ 33% of all energy-related emissions in both years, on average. Reflecting its market-share loss in the power-generation market, coal accounts for ~ 21% of total US energy-related CO2 emissions in 2021 and 2022. Base Metals: Bullish Globally, crude steel production was down 0.9% y/y at 1.864 billion MT, the World Steel Association reported this week. China’s steel production was up 5.2% last year, to 1.053 billion MT, the country a market share of 56.5%, up from 2019’s level of 53.3%. Output in all of Asia totalled 1.375 billion MT, up 1.5% y/y, with India’s production falling close to 11% to 99.6 billion MT. China’s iron-ore imports set a record last year on the back of its strong steel-making performance, reaching 1.2 billion tonnes, a 9.5% increase y/y. Higher infrastructure spending was the primary driver of increased steel demand last year. Iron ore delivered to the Chinese port of Tianjin (62% Fe) closed just above $169/MT on Tuesday, up ~ 9% YTD. Precious Metals: Bullish Gold continues to trade ~ $1,850/oz, down more than $100/oz from its highs earlier this month on the back of persistent USD strength (Chart 9). The pandemic uncertainty feeding into global economic policy uncertainty is the proximate cause of dollar strength. COVID-19 vaccine rates are increasing, and governments remain committed to widespread distribution, which likely will be visible to markets during 1H21. Once this occurs, we expect gold to rally along with other commodities, as the safe-have bid is priced out of the USD. Ags/Softs: Neutral US corn prices rallied on the back of stronger China purchases of the grain on Tuesday. Farm Futures reported a 53.5mm-bushel order out of China on Tuesday was responsible for the gain earlier this week. Farmers continue to expect Chinese buying to remain strong, given falling corn stocks in China. Chart 8
Pandemic Uncertainty Will Fall, Weakening USD, Boosting Metals
Pandemic Uncertainty Will Fall, Weakening USD, Boosting Metals
Chart 9
Gold Trading Lower On The Back of A Strong Dollar
Gold Trading Lower On The Back of A Strong Dollar
Footnotes 1 At the margin, this increases the cost of purchasing commodities and lowers the cost of producing them ex-US in local-currency terms, both of which depress prices. Pandemic uncertainty and global economic policy uncertainty (GEPU) are cointegrated; the USD and GEPU also are cointegrated. We discussed the effects of pandemic uncertainty on the USD and its impact on oil prices in last week’s balances and price forecast update entitled Brent Forecast: $63 This Year, $71 Next Year. This report is available at ces.bcaresearch.com. 2 Please see the Bank's Global Economic Prospects released 5 January 2021 entitled Subdued Global Economic Recovery. The IMF upgraded its global growth outlook to 5.5% this year and 4.2% next year, in its World Economic Outlook Update released this week. We continue to use the more conservative World Bank forecasts. The Israeli economy is providing something of a natural experiment vis-à-vis the rate of COVID-19 vaccination and economic growth. According to reuters.com, the country got an early start on vaccinations, and has one of the highest rates in the world. If maintained, this will result in GDP growth of 6.3% in 2021 and 5.8% next year. Without these early and intensive vaccination rates, 2021 growth likely would be 3.5%. 3 The models in Chart 4 use the broad trade-weighted USD and global copper stocks as common regressors, and estimate copper prices given the World Bank estimates for World, EM ex-China, China and DM real GDPs. In the discussion above, we use elasticities from the World GDP model to highlight the impact of changes in copper prices from the different variables. 4 Please see Renewables, China's FYP Underpin Metals Demand, which we published 26 November 2020. We discuss the implications of essentially rebuilding the global electric-generation grid to accommodate more renewable energy resources vis-à-vis base metals demand. Copper, in particular, spans all technologies that will be deployed to achieve a low-carbon generation pool globally, as Chart 5 illustrates. 5 Please see For 1st time, renewables surpass fossil fuels in EU power mix published by S&P Global Market Intelligence 25 January 2021. 6 Benchmark treatment and refining fees charged by smelters to refine raw ore fell to 5.9 cent/lb this year, down from 6.2 cent/lb last year, according to reuters.com. This 10-year low reflects an abundance of smelting capacity relative to concentrates on the supply side needing to be refined. Investment Views and Themes Recommendations Strategic Recommendations Commodity Prices and Plays Reference Table Summary of Closed Trades
Higher Inflation On The Way
Higher Inflation On The Way
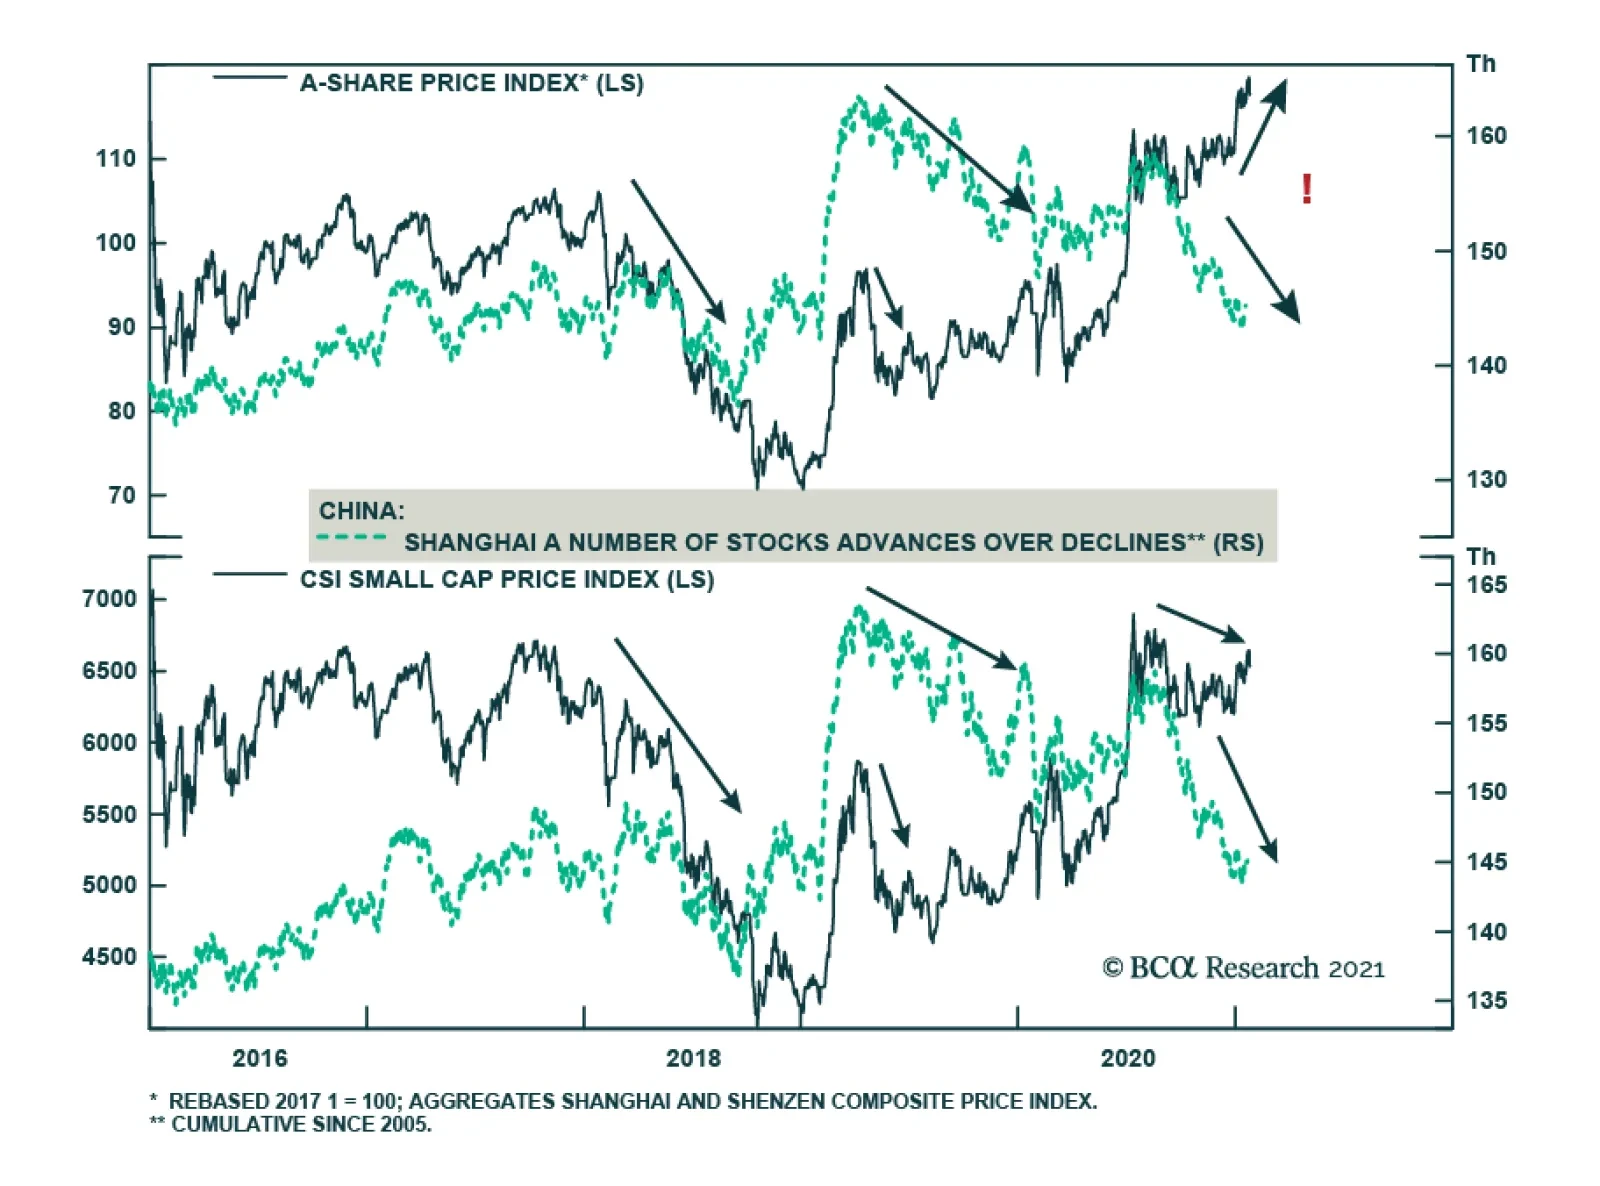
According to BCA Research’s China Investment Strategy service, overstretched stock prices relative to earnings risk a snapback in A-shares. We remain cautious on short-term prospects for China’s onshore equity markets. Market commentators remain sharply…
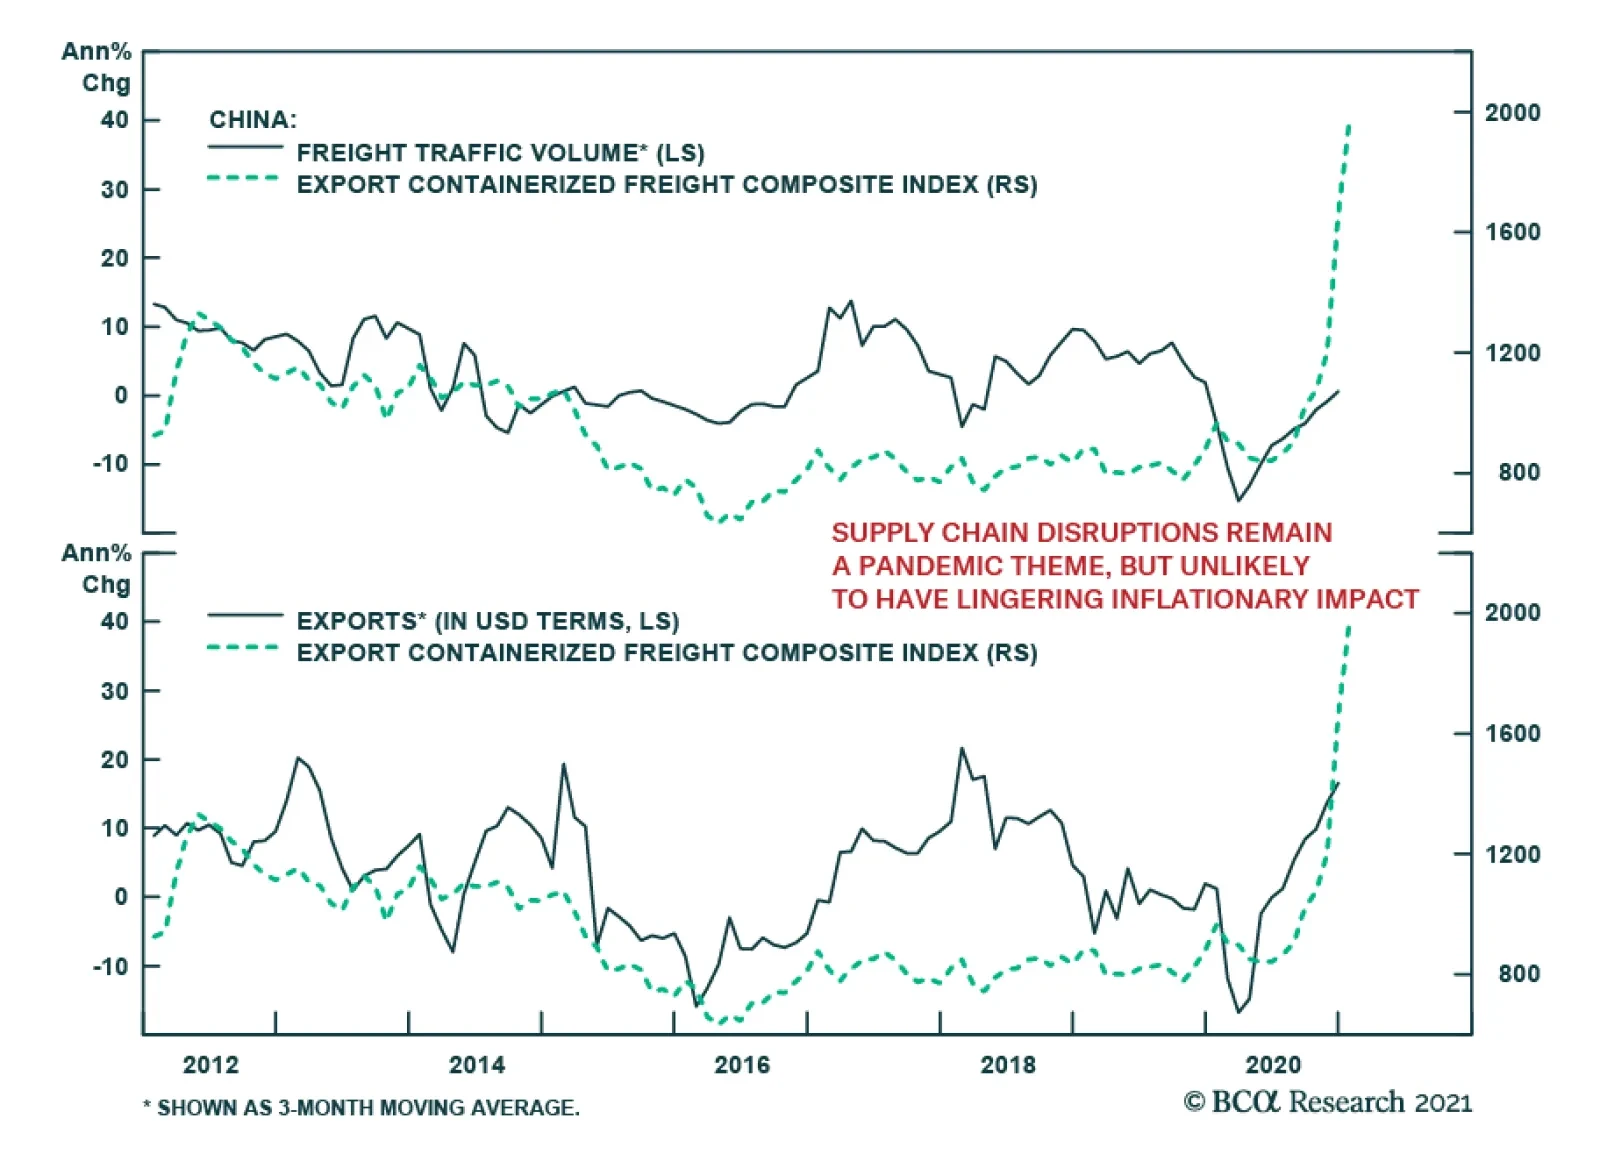
The recent massive jump in freight costs overstates improvements in global trade. Chinese exports have been accelerating at a healthy clip and freight traffic is recovering, but the surge in China’s containerized freight index eclipses both. Instead, shipping…
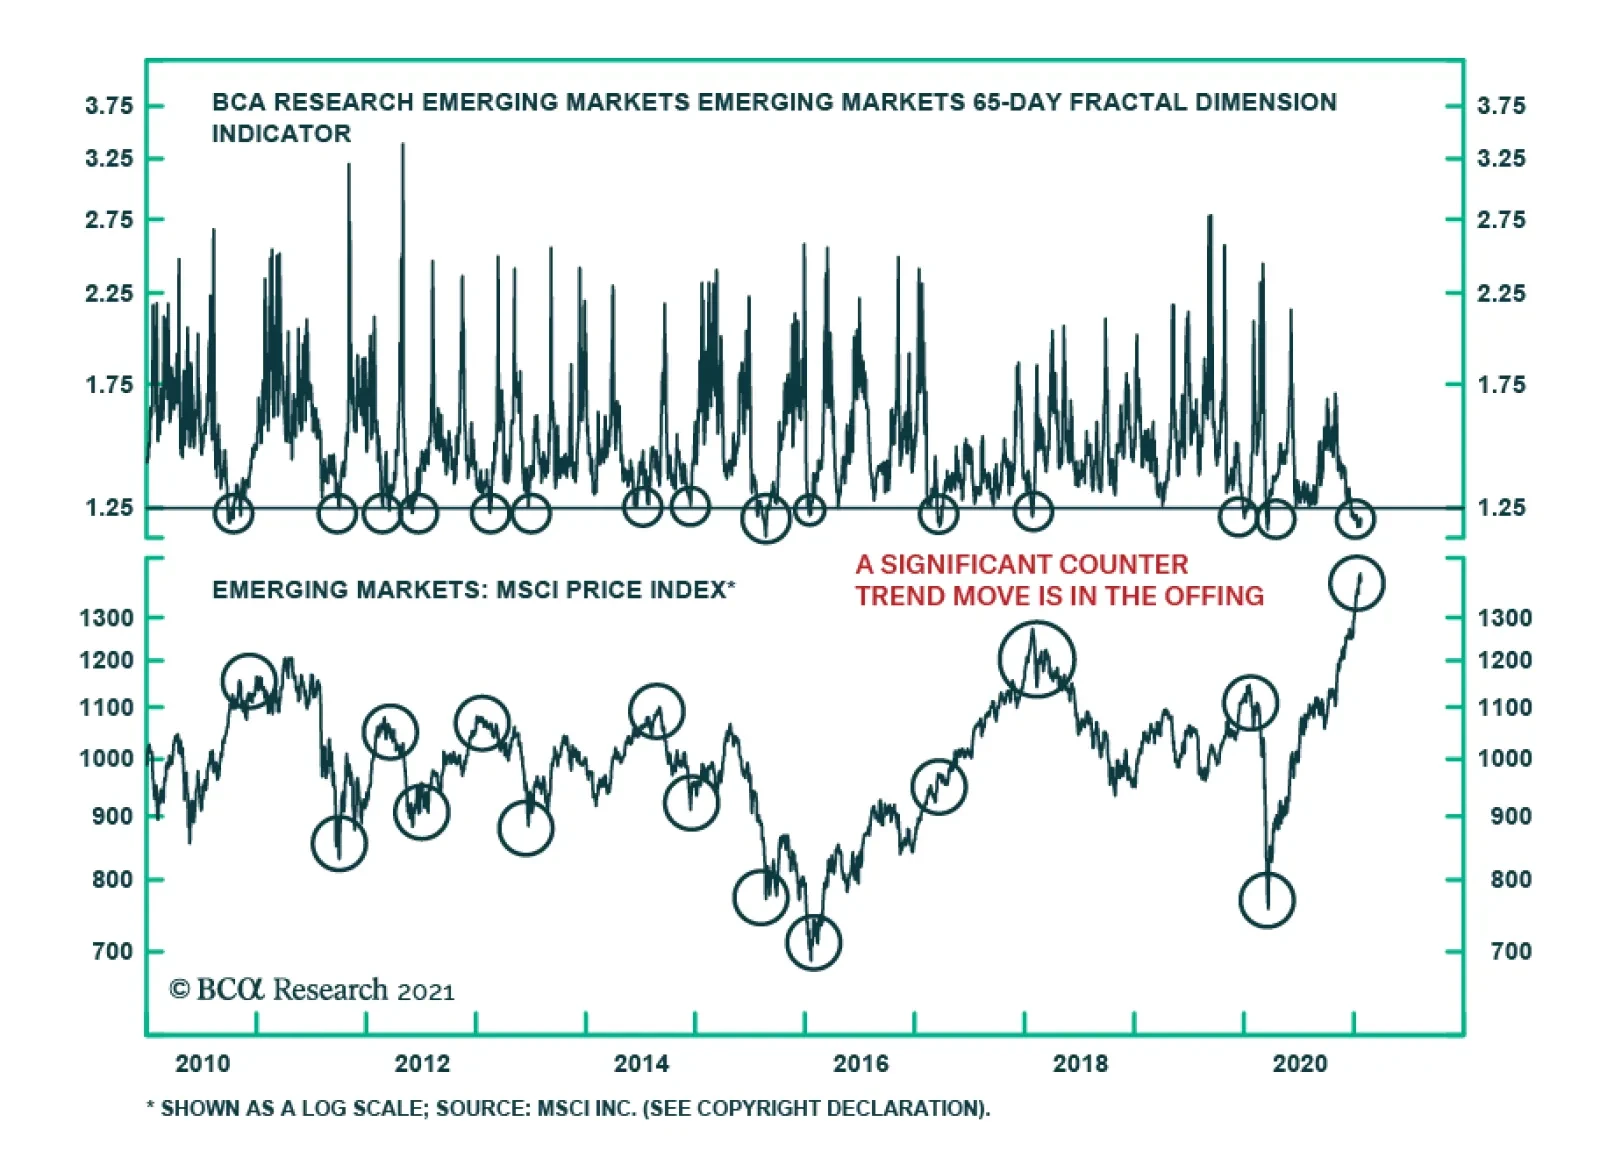
EM equity prices have experienced a spectacular rise since last year’s trough and hit a new all-time high. However, BCA Research’s Fractal Dimension indicator is flashing a warning sign for EM stocks. A reading below 1.25 signals prevalent groupthink…
Highlights A positive backdrop still supports a cyclical bull market in Chinese stocks, but the upside in prices could be quickly exhausted. Investors may be overlooking emerging negative signs in China’s onshore equity market. The breadth of the A-share price rally has sharply declined since the beginning of this year; historically, a rapid narrowing in breadth has been a reliable indicator for pullbacks in the onshore market. Recent stock price rallies in some high-flying sectors of the onshore market are due to earnings multiples rather than earnings growth. Overstretched stock prices relative to earnings risk a snapback. We remain cautious on short-term prospects for China’s onshore equity markets. Feature Market commentators remain sharply divided about whether Chinese stocks will continue on their cyclical bull run or are in a speculative frenzy ready to capitulate. Stock prices picked up further in the first three weeks of 2021, extending their rallies in 2020. The positives that support a bull market, such as China’s economic recovery and improving profit growth, are at odds with the negatives. The downside is that the intensity of post-pandemic stimulus in China has likely peaked and monetary conditions have tightened. In addition, China’s stock markets may be showing signs of fatigue. While aggregate indexes have recorded new highs, the breadth of the rally—the percentage of stocks for which prices are rising versus falling—has been rapidly deteriorating. In the past, a sharp narrowing in breadth led to corrections and major setbacks in Chinese stock prices. Timing the eventual correction in stock prices will be tricky in an environment where plentiful cash on the sidelines from stimulus invites risk-taking. For now, there is little near-term benefit for investors to chase the rally in Chinese stocks. While we are not yet negative on Chinese stocks on a cyclical basis, the risks for a near-term price correction are significant. Investors looking to allocate more cash to Chinese stocks should wait until a correction occurs. Positive Backdrop On a cyclical basis, there are still some aspects that could push Chinese stocks even higher. The question is the speed of the rally. The more earnings multiples expand in the near term, the more earnings will have to do the heavy lifting in the rest of the year to pull Chinese stocks higher. The following factors have provided tailwinds to Chinese stocks, but may have already been discounted by investors: Chart 1Chinas Economic Recovery Continues
Chinas Economic Recovery Continues
Chinas Economic Recovery Continues
China’s economic recovery continues. China was the only major world economy to record growth in 2020. The massive stimulus rolled out last year should continue to work its way through the economy and support the ongoing uptrend in the business cycle (Chart 1). China’s relative success containing domestic COVID-19 outbreaks also provides confidence for the country’s consumers, businesses and investors. Chinese consumers have saved money—a lot of it. Although the household sector has been a laggard in China’s aggregate economy, much of the consumption weakness has been due to a slower recovery in service activities, such as tourism and catering (Chart 2). More importantly, Chinese households have accumulated substantial savings in the past two years. Unlike investors in the US, Chinese households have limited investment choices. Historically, sharp increases in household savings growth led to property booms (Chart 3, top panel). Given that Chinese authorities have become more vigilant in preventing further price inflation in the property market, Chinese households have been increasingly investing in the domestic equity market (Chart 3, middle and bottom panels). Reportedly, there has been a sharp jump in demand for investment products from households; mutual funds in China have raised money at a record pace, bringing in over 2 trillion yuan ($308 billion) in 2020, which is more than the total amount for the previous four years. The equity investment penetration remains low in China compared with developed nations such as the US.1 Thus, there is still room for Chinese households to deploy their savings into domestic stock markets. Chart 2Consumption Has Been A Laggard In Chinas Economic Recovery
Consumption Has Been A Laggard In Chinas Economic Recovery
Consumption Has Been A Laggard In Chinas Economic Recovery
Chart 3But Chinese Households Have Saved A Lot Of Dry Powder
But Chinese Households Have Saved A Lot Of Dry Powder
But Chinese Households Have Saved A Lot Of Dry Powder
Global growth and the liquidity backdrop remain positive. The combination of extremely easy monetary policy worldwide and a new round of fiscal support in the US will provide a supportive backdrop for both global economic growth and liquidity conditions. Foreign investment has flocked into China’s financial markets since last year and has picked up speed since the New Year (Chart 4). On a monthly basis, portfolio inflows account for less than 1% of the onshore equity market trading volume, but in recent years foreign portfolio inflows have increasingly influenced China’s onshore equity market sentiment and prices (Chart 5). Chart 4Foreign Investors Are Piling Into The Chinese Equity Market
Foreign Investors Are Piling Into The Chinese Equity Market
Foreign Investors Are Piling Into The Chinese Equity Market
Chart 5And Have Become A More Influential Player In The Chinese Onshore Market
And Have Become A More Influential Player In The Chinese Onshore Market
And Have Become A More Influential Player In The Chinese Onshore Market
Geopolitical risks are abating somewhat. We do not expect that the Biden administration will be quick to unwind Trump’s existing trade policies on China. However, in the near term, the two nations will likely embark on a less confrontational track than in the past two and a half years. Slightly eased Sino-US tensions will provide global investors with more confidence for buying Chinese risk assets. Lastly, localized COVID-19 outbreaks have flared up in several Chinese cities, prompting local authorities to take aggressive measures, including community lockdowns and stepping up travel restrictions. A deterioration in the situation could delay the recovery of household consumption; however, any negative impact on China’s aggregate economy will more than likely be offset by market expectations that policymakers will delay monetary policy normalization. Domestic liquidity conditions could improve, possibly providing a short-term boost to the rally in Chinese stocks. Bottom Line: Much of the positive news may already be priced into Chinese stocks. Non-Negligible Downside Risks There is a consensus that Chinese authorities will dial back their stimulus efforts this year and continue to tighten regulations in sectors such as real estate. Investors may disagree on the pace and magnitude of policy tightening, but the policy direction has been explicit from recent government announcements. However, the market may have ignored the following factors and their implications on stock performance: Deteriorating equity market breadth. In the past three weeks, the rally in Chinese stocks has been supported by a handful of blue-chip companies. The CSI 300 Index, which aggregates the largest 300 companies listed on both the Shanghai and Shenzhen stock exchanges (i.e. the A-share market) outperformed the broader A-share market by a large margin (Chart 6). Crucially, stock market breadth has declined rapidly (Chart 7). In short, the majority of Chinese stocks have relapsed. Chart 6Large Cap Stocks Outperform The Rest By A Sizable Margin
Large Cap Stocks Outperform The Rest By A Sizable Margin
Large Cap Stocks Outperform The Rest By A Sizable Margin
Chart 7The Breadth Of Onshore Stock Price Rally Has Narrowed Sharply
The Breadth Of Onshore Stock Price Rally Has Narrowed Sharply
The Breadth Of Onshore Stock Price Rally Has Narrowed Sharply
Chart 8Narrowing Market Breadth Has Historically Led To Price Pullbacks
Narrowing Market Breadth Has Historically Led To Price Pullbacks
Narrowing Market Breadth Has Historically Led To Price Pullbacks
Previously, Chinese stocks experienced either price corrections or a major setback as the breadth of the rally narrowed (Chart 8). However, the relationship has broken down since October last year; the number of stocks with ascending prices has fallen, while the aggregate A-share prices have risen. In other words, breadth has narrowed and the rally in the benchmark has been due to a handful of large-cap stocks. Top performers do not have enough weight to support the broad market. An overconcentration of returns in itself may not necessarily lead to an imminent price pullback in the aggregate equity index. The five tech titans in the S&P 500 index have been dominating returns since 2015, whereas the rest of the 495 stocks in the index barely made any gains. Yet the overconcentration in just a few stocks has not stopped the S&P 500 from reaching new highs in the past five years. Unlike the tech titans which represent more than 20% of the S&P index, the overconcentration in the Chinese onshore market has been more on the sector leaders rather than on a particular sector. China’s own tech giants such as Alibaba, Tencent, and Meituan, represent 35% of China’s offshore market, but most of the sector leaders in China’s onshore market account for only two to three percent of the total equity market cap (Table 1). Given their relatively small weight in the Shanghai and Shenzhen composite indexes, it is difficult for these stocks to lift the entire A-share market if prices in all the other stocks decline sharply. The CSI 300 Index, which aggregates some of China’s largest blue-chip companies and industry leaders, including Kweichow Moutai, Midea Group, and Ping An Insurance, is not insulated from gyrations in the aggregate A-share market. Historically, when investors crowded into those top performers, the weight from underperforming companies in the broader onshore market would create a domino effect and drag down the CSI 300 Index. In other words, the magnitude of returns on the CSI 300 Index can deviate from the broader onshore market, but not the direction of returns. Table 1Top 10 Constituents And Their Weights In The CSI 300, Shanghai Composite, And Shenzhen Composite Indexes
Chinese Stocks: Which Way Will The Winds Blow?
Chinese Stocks: Which Way Will The Winds Blow?
Chinese “groupthinkers” are pushing the overconcentration. With the explosive growth in mutual fund sales, Chinese institutional investors and asset managers have started to play important roles in the bull market. Unlike their Western counterparts, Chinese fund managers’ performances are ranked on a quarterly or even monthly basis by asset owners, including retail investors. As such, they face intense and constant pressure to outperform the benchmarks and their peers, and have great incentive to chase rallies in well-known companies. In a late-state bull market when uncertainties emerge and assets with higher returns are sparse, fund managers tend to group up in chasing fewer “sector winners,” driving up their share prices. Chart 9Forward Earnings Growth Has Stalled
Forward Earnings Growth Has Stalled
Forward Earnings Growth Has Stalled
Earnings outlook fails to keep up with multiple expansions. Despite the massive stimulus last year and improving industrial profits, forward earnings growth in both the onshore and offshore equity markets rolled over by the end of last year (Chart 9). Earnings from some of China’s high-flying sectors have been mediocre (Chart 10). Even though the ROEs in the food & beverage, healthcare and aerospace sectors remain above the domestic industry benchmarks, the sharp upticks in their share prices are largely due to an expansion of forward earnings multiples rather than earnings growth (Chart 11). The stretched valuation measures suggest that investors have priced in significant earnings growth, which may be more than these industries can deliver in 2021. Chart 10Other Than Healthcare, High-Flying Sectors Have Seen Mediocre Earnings
Other Than Healthcare, High-Flying Sectors Have Seen Mediocre Earnings
Other Than Healthcare, High-Flying Sectors Have Seen Mediocre Earnings
Chart 11Too Much Growth Priced In
Too Much Growth Priced In
Too Much Growth Priced In
Cyclical stocks may be sniffing out a peak in the market. The performance in cyclical stocks relative to defensives in both the onshore and offshore equity markets has started to falter, after outperforming throughout 2020 (Chart 12). Historically, the strength in cyclical stocks relative to defensives corresponds with improving economic activity (and vice versa). Therefore, the recent rollover in the outperformance of cyclical stocks versus defensives indicates that China’s economic recovery and the equity rally could soon peak. An IPO mania. New IPOs in China reached a record high last year, jumping by more than 100% from 2019. IPOs on the Shanghai, Shenzhen and Hong Kong stock exchanges together were more than half of all global IPOs in 2020. The previous rounds of explosive IPOs in China occurred in 2007, 2010/11, and 2014/15, most followed by stock market riots (Chart 13). Chart 12Cyclical Stocks May Be Sniffing Out A Peak In The Market
Cyclical Stocks May Be Sniffing Out A Peak In The Market
Cyclical Stocks May Be Sniffing Out A Peak In The Market
Chart 13IPO Manias In The Past Have Led To Market Riots
IPO Manias In The Past Have Led To Market Riots
IPO Manias In The Past Have Led To Market Riots
Bottom Line: Investors may be neglecting some risks and pitfalls in the Chinese equity markets, which could lead to near-term price corrections. Investment Conclusions We still hold a constructive view on Chinese stocks in the next 6 to 12 months. Yet the equity market rally has been on overdrive for the past several weeks. The higher Chinese stock prices climb in the near term, the more it will eat into upside potentials and thus push down expected returns. The divergence between forward earnings and PE expansions in Chinese stocks is reminiscent of the massive stock market boom-bust cycle in 2014/15 (Chart 14A and 14B). This is in stark contrast with the picture at the beginning of the last policy tightening cycle, which started in late 2016 (Chart 15A and 15B). Valuation is a poor timing indicator and investor sentiment is hard to pin down. Nevertheless, the wide divergence between the earnings outlook and multiples indicates that Chinese stock prices are overstretched and at risk of price setbacks. Chart 14AA Picture Looking Too Familiar
A Picture Looking Too Familiar
A Picture Looking Too Familiar
Chart 14BA Picture Looking Too Familiar
A Picture Looking Too Familiar
A Picture Looking Too Familiar
Chart 15AAnd A Sharp Contrast From The Last Policy Tightening Cycle
And A Sharp Contrast From The Last Policy Tightening Cycle
And A Sharp Contrast From The Last Policy Tightening Cycle
Chart 15BAnd A Sharp Contrast From The Last Policy Tightening Cycle
And A Sharp Contrast From The Last Policy Tightening Cycle
And A Sharp Contrast From The Last Policy Tightening Cycle
We remain cautious on the short-term prospects for the broad equity market. Investors looking to allocate more cash to Chinese stocks should wait until a price correction occurs. Jing Sima China Strategist jings@bcaresearch.com Footnotes 1Only 20.4% of Chinese households’ total net worth is in financial assets versus the US, where the share is 42.5%. PBoC, “2019 Chinese Urban Households Assets And Liabilities Survey.” Cyclical Investment Stance Equity Sector Recommendations
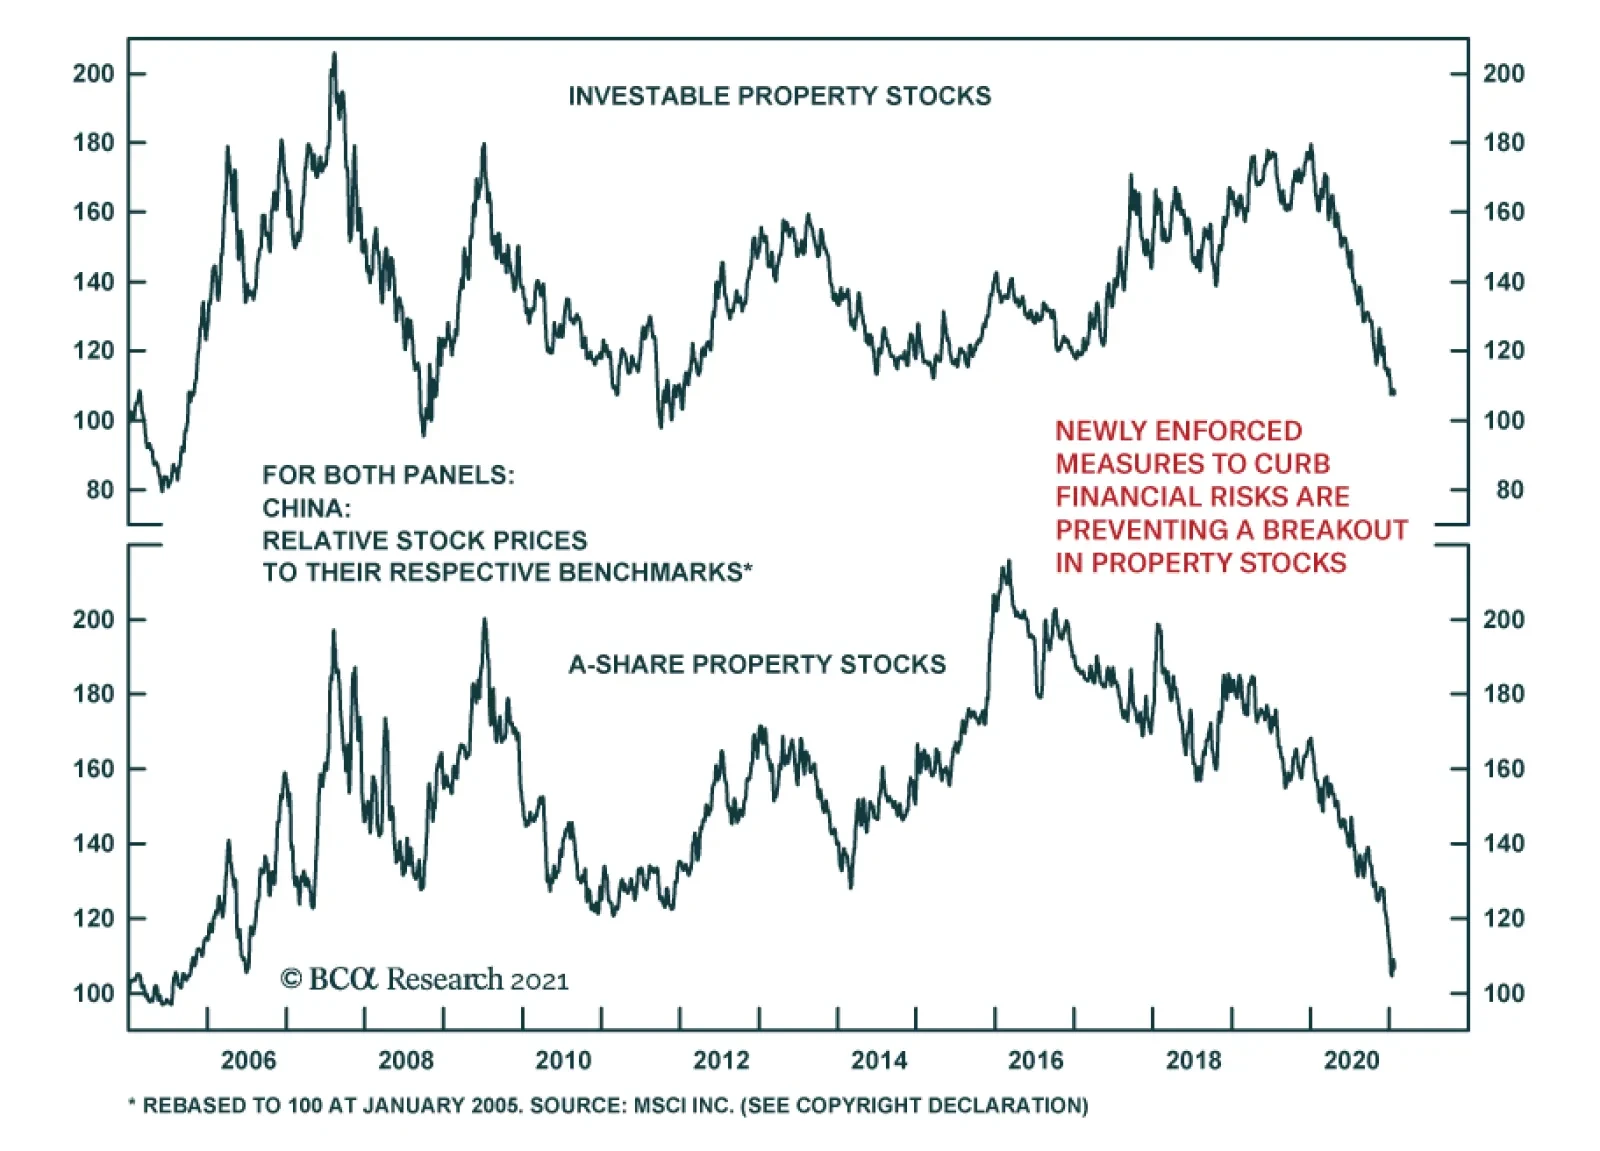
Chinese property had a standout 2020. Property sales broke records and property investments expanded 7% y/y, outpacing total fixed asset investments. But despite this hot performance, property developers’ equities were eclipsed by the overall market last…