Emerging Markets
Taiwanese stocks performed extremely well last year, both in absolute terms as well as relative to Emerging Markets. The risk now is that the rally is getting ahead of itself. While the Taiwanese economy will benefit from rebounding global demand this…
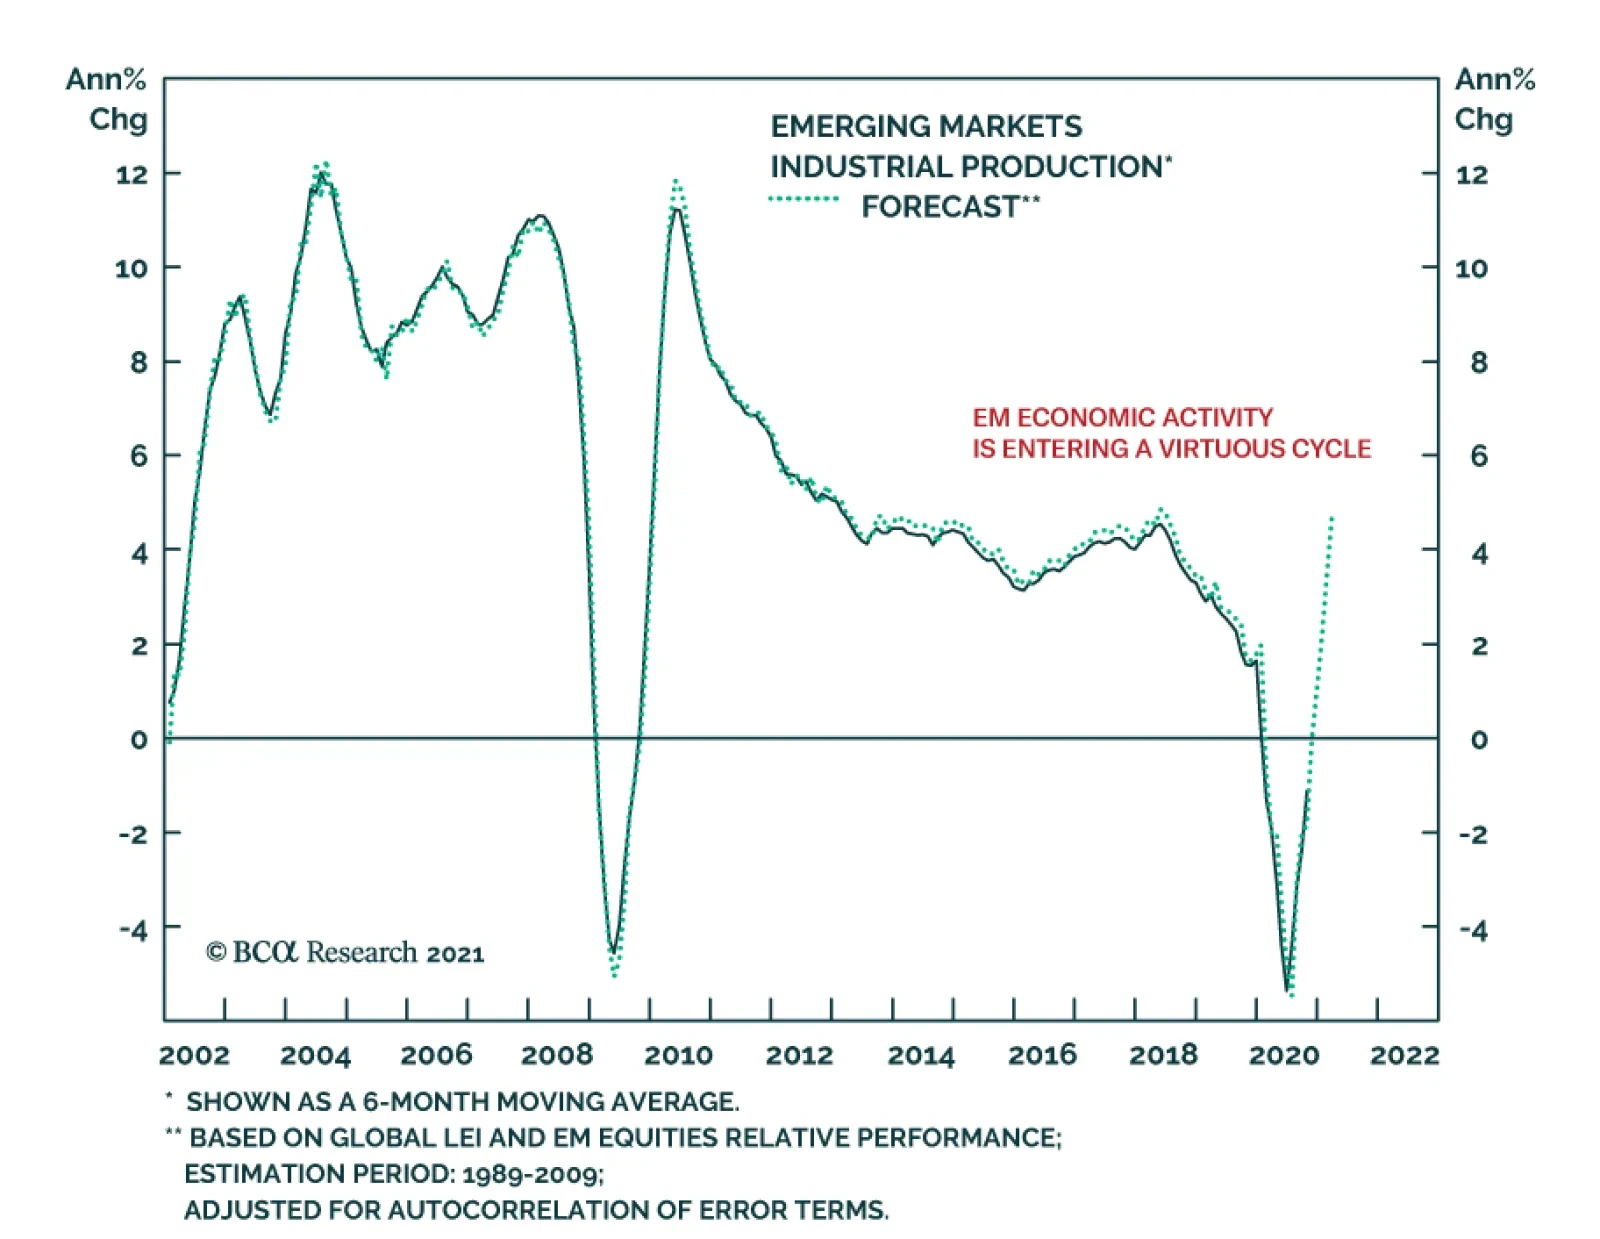
Our models highlight that EM industrial production has significant upside in the coming months. The version adjusting for the autocorrelation of error terms points to a straight line rebound to 2018 growth rates by February. Our rougher model without this…

Highlights The incidents of state-owned enterprise (SOE) bond defaults late last year reflected deteriorating corporate balance sheets and exposed local governments’ weakening fiscal positions. Both were preexisting conditions that worsened due to the pandemic. China’s policymakers have vowed to accelerate restructuring the SOE/corporate sector, but they face a dilemma between economic stability and painful reforms; the outcome will ultimately depend on policymakers’ pain thresholds. In the next 6 to 12 months, the policy tightening cycle will continue and credit growth will decelerate. Chinese stocks are already more expensive than before the start of the last policy tightening cycle. We recommend a neutral position on domestic and investable stocks for now. Feature The days of China’s unconditional bailout of state firms may be over. In the past six months, Beijing has embarked on a series of reform agendas, including restructuring and stricter regulations targeting SOEs and the broader spectrum of the corporate sector. When three SOEs defaulted on bond payments late last year, neither the central nor the local government supported those firms. Allowing market forces to allocate capital to more productive firms by driving out the less efficient companies is structurally positive for the Chinese economy. However, the pursuit of meaningful SOE and broader corporate reforms will be a tough choice for Chinese policymakers this year while the economic recovery is underway. Ultimately, the degree and speed to reform SOEs will depend on how much near-term pain policymakers are willing to endure. We recommend a neutral position in Chinese stocks for now. We expect the financial markets to experience frequent mini-cycles in 2021 due to policy zigzags. Risks for policy miscalculations cannot be ruled out; equity prices will falter if Chinese authorities push for deeper reforms and tighter industry regulations while scaling back stimulus at the same time. Chinese stocks are already expensive and are vulnerable to authorities opting for much smaller stimulus and harsher corporate/SOE reforms. SOE Defaults: Policy Response Matters More Than Defaults Chart 1Policy Zigzags And Market Mini-Cycles
Policy Zigzags And Market Mini-Cycles
Policy Zigzags And Market Mini-Cycles
A flurry of high-profile defaults by state firms late last year unnerved investors and pushed up onshore corporate bond yields. Beijing’s move to allow SOEs to fail forced investors to reprice bonds issued by state firms as much riskier propositions. Following the defaults in November, the PBoC injected unusually large interbank liquidity; the de jure policy rate dropped and Chinese stock prices rallied (Chart 1). In our view, the recent liquidity injections do not provide enough evidence that macro policy is shifting to an easier bias. Despite a retreat in the short-term interbank rate, the authorities have plowed ahead with reforms and initiated more restrictions in key industries. In the coming months, investors should expect the following: SOE reforms will tolerate more bond defaults. Bank loans and local government bonds make up nearly 80% of China’s total domestic credit, whereas corporate bonds (including SOEs and local government financing vehicles (LGFVs)) account for only 10% of the total (Chart 2). Thus, even if corporate bond defaults push up yields, Beijing may see this as a small price to pay in the near term, in exchange for a market-driven system cleansing to eliminate inefficient SOEs. This outcome will be negative for corporate bonds (Chart 3). Chart 2Corporate Bond Issuance Make Up Only A Small Portion Of Total Financing
Corporate Bond Issuance Make Up Only A Small Portion Of Total Financing
Corporate Bond Issuance Make Up Only A Small Portion Of Total Financing
Chart 3Periods Of Financial Tightening Dampen Corporate Bond Market
Periods Of Financial Tightening Dampen Corporate Bond Market
Periods Of Financial Tightening Dampen Corporate Bond Market
Chart 4Higher Funding Costs Will Discourage Corporate Borrowing
Higher Funding Costs Will Discourage Corporate Borrowing
Higher Funding Costs Will Discourage Corporate Borrowing
Policymakers may underestimate the unintended consequences of SOE defaults on credit flow and the broader economy. The central bank was able to engineer a sharp drop in its policy rate last month, which may prompt policymakers to believe that interbank liquidity injections are efficient market-calming measures and rising corporate bond yields will not impede overall credit growth. This may be true in the short term, however, tightened policy in the name of reforms has previously pushed up both the 3-month SHIBOR and bank lending rates, leading to a significant slowing in credit growth and an eventual slowdown in economic expansion (Chart 4). Reasons for such chain reactions are twofold. First, banks become more risk averse during a tightening cycle and charge higher premiums when lending to smaller financial institutions and the private sector (Chart 4, bottom panel). Secondly, although Chinese SOEs can borrow from banks at much lower interest rates than private-sector entities (Chart 5), their heavy indebtedness makes them hyper-sensitive to even a slight uptick in financing costs. Chinese SOEs rely more on bank lending than bond issuance for financing and SOE borrowers dominate China’s bank credit to the corporate sector.1 Chart 6 shows that the rise in the weighted average lending rate in 2017 was relatively minor compared with levels that prevailed in the past decade. Nonetheless, a less than one percentage point hike in the lending rate materially slowed credit growth and the investment-driven sectors of China's economy. Chart 5SOEs Tend To Have Lower Borrowing Costs, Partially Reflecting Implicit Government Guarantees
China's SOE Reform Dilemma
China's SOE Reform Dilemma
Chart 6Small Rise In Lending Rate, Large Fall In Credit Growth
Small Rise In Lending Rate, Large Fall In Credit Growth
Small Rise In Lending Rate, Large Fall In Credit Growth
Regulatory pressures will lead to de facto tightening. As outlined in our 2021 Outlook report, as part of the macroeconomic policy normalization, credit growth will likely decelerate by two to three percentage points this year from 2020. The extended Macro Prudential Assessment (MPA) System will wrap up by year-end and financial institutions will need to start slowing their asset balance sheets to meet the assessments. Moreover, last week the central government revised Measures for the Performance Evaluation of Commercial Banks. The modified version factors lending to the new-economy sectors and micro and small enterprises into the performance evaluation and salaries of the state-owned and controlled commercial banks’ management.2 The new measures will likely dampen the banks’ propensity to lend to old-economy sectors, such as real estate and traditional infrastructure. All in all, a faster-than-desired slowdown in credit growth will ensue if policymakers simultaneously allow more SOE/corporate defaults, undertake industry reforms, and implement tighter banking regulations in 2021. This is negative for both economic growth and the equity market. Bottom Line: Chinese policymakers will likely allow more SOE defaults in the coming months. In addition to an increased number of SOE defaults that is negative for the corporate bond market, sped up industry restructuring and more stringent regulations may lead to a sharp fall in credit growth and stock prices. Worsening Old Economy SOEs’ Financial Positions Chart 7SOEs Are Less Efficient Than Private Firms In Profitability And Productivity
China's SOE Reform Dilemma
China's SOE Reform Dilemma
An acceleration in SOE reforms may trigger near-term risks, but a delay in restructuring China’s loss-making SOEs will have repercussions in the long term. The explicit and implicit government protections for SOEs have eroded their efficiencies compared with the private sector (Chart 7). The most significant side effect is a rapid rise in SOE leverage and diminishing profitability in some of the old economy sectors. It may be a dead end for the government to continue bailing out state firms with inefficient operations and financial losses. A Special Report we previously published showed that among SOEs in the industrial and construction sectors, which account for half of all SOEs in China, the adjusted return on assets (ROA) versus borrowing costs has been negative since 2013 (Chart 8). This suggests that SOE investment funded by higher leverage cannot produce sufficient income to repay debt. During the last tightening cycle that started in late 2016, policymakers managed to rein in local SOE debt growth, but it reversed course in 2018 due to a collapse in domestic demand (Chart 9). As Chart 8 illustrates, ROA among SOEs in the industrial and construction sectors has significantly deteriorated since then. Chart 8SOEs Financial Gains From Debt Are In Deep Contraction
SOEs Financial Gains From Debt Are In Deep Contraction
SOEs Financial Gains From Debt Are In Deep Contraction
Chart 9China Was Successful In Reining In SOE Debt, But Only Briefly
China Was Successful In Reining In SOE Debt, But Only Briefly
China Was Successful In Reining In SOE Debt, But Only Briefly
Bottom Line: A continued capital misallocation by perpetually leveraging SOEs and LGFVs with negative marginal operating gains will eventually lead to a self-reinforcing debt trap. In turn, that would precipitate a default en masse and necessitate a larger government bailout. Another Layer To The SOE Reform Dilemma The central government’s SOE reform agenda is further complicated by the involvement of local governments (LGs). We have several observations: First, a meaningful SOE restructuring, which would require consolidating/liquidating some of the unprofitable SOE assets, may expose the LGs’ fiscal vulnerabilities to both investors and regulators. The fiscal weakness of China’s provincial-level governments is illustrated by the bond-payment default of Yongcheng Coal, a SOE from Henan Province. Henan is economically sound with GDP growth above the national average. However, when considering the province’s direct and hidden debt, debt servicing costs, and liquidity availability, Henan is in a group of 10 provinces with the worst fiscal conditions in 2020.3 This implies that LG officials may not have been able to bail out Yongcheng even if they wanted to. Moreover, cash-strapped LGs have reportedly formed reciprocal and entrenched relationships with local SOEs. These SOEs may carry debt for LGs and in turn, free up an LG’s borrowing capacity. When these SOEs fail, the credibility of LG officials may be questioned and investigated by the central government. As such, LGs are incentivized to protect their local SOEs. Chart 10More Defaults, More Bank Lending
China's SOE Reform Dilemma
China's SOE Reform Dilemma
Secondly, removing the government’s bailout of SOE debt defaults does not negate the underlying factor eroding SOE productivity: the government’s support of local SOEs with easier access to bank loans. Banks, which heavily influence LGs, are not always vigilant about risks associated with local SOE debt. Banks provide loans at preferential rates to localities and their affiliated SOEs. In return, LGs often award banks financing opportunities for profitable infrastructure projects. In this regard, local SOE bond defaults are not necessarily detrimental to bank profits because banks can make up their losses through financing more lucrative projects. Studies show that even when some LGs have experienced large-scale SOE bond defaults, lending to these LGs from commercial banks actually increased relative to other forms of financing (Chart 10). Beijing must take bold measures to break up the long-standing relationship between LGs and SOEs in order to achieve any market-oriented reform of local SOEs. The LGs will likely strongly resist severing the connection. Lastly, given that SOEs are often deployed to support the central government’s economic, political and strategic initiatives, LGs can use those grand initiatives to help justify their local SOEs’ existence - even unprofitable ones. Bottom Line: Beijing faces a tough choice between implementing effective SOE reforms and worsening local governments’ fiscal conditions with negative implications for economic growth. While allowing more SOE bond defaults can force investors to reprice SOE credit risks, as long as the implicit government support for SOEs through bank lending still exists, allocating capital to more efficient private-sector companies will be a formidable task. Investment Conclusions Some economists argue that China’s SOE debt should be considered part of public-sector leverage because many SOE investments are affiliated with government projects. Additionally, Chinese SOEs have accumulated massive assets, which can more than offset their debt4 and make SOE bonds and debt low- risk propositions. Moreover, even though the government may allow more SOE bond defaults, if the defaults threaten China’s financial stability, then the government can move non-performing debt from LGs and SOEs to the balance sheets of the central bank or central government. There are several issues with this argument. The stock of assets in a large portion of Chinese SOEs5 has persistently failed to generate sufficient cash flow to service debt, which implies that the true value of the assets may be low and will likely be sold at below cost when liquidated. It is not useful to compare book value of assets with debt because the true value of assets is contingent on the income/cash flow that they generate. We agree that public-sector leveraging/deleveraging is fundamentally a political choice in countries with control over their own monetary policy and debt is in local currency. Theoretically, a country can monetize public and private local currency-denominated debt via a central bank or government- controlled commercial banks. In such a case, the authorities will have little control over inflation, the exchange rate, and the long-term productivity. For now, Chinese policymakers seem to be on a path of accelerating reform, an indication that they want to avoid bailing out state firms and private-sector companies. In addition, President Xi’s “dual circulation” mantra emphasizes the importance of improving the country’s corporate efficiency and productivity. We think that consolidating some inefficient SOE sectors in the old economy fits such initiative. Our baseline view is that the SOE consolidation process will be gradual and the PBoC will provide sufficient liquidity in an effort to prevent market jitters. At the same time, the sharp turns in the policy rate in the past six months are prime examples of the periodic oscillation in China’s policymaking between maintaining economic stability and pursuing meaningful reforms. The policy swings will create mini-cycles for Chinese risk asset prices. Chinese stocks are not cheap compared with values at the start of the last policy tightening cycle (Chart 11A and 11B). We recommend a neutral position on domestic and investable equities for the time being. CHART 11AInvestable Stocks Are More Expensive Now Than Prior To The Last Tightening Cycle
Investable Stocks Are More Expensive Now Than Prior To The Last Tightening Cycle
Investable Stocks Are More Expensive Now Than Prior To The Last Tightening Cycle
CHART 11BA-Shares Are Less Expensive, But Valuations Are Still Elevated
China's SOE Reform Dilemma
China's SOE Reform Dilemma
Jing Sima China Strategist jings@bcaresearch.com Footnotes 1Based on the OECD estimates, SOEs’ share of China’s total corporate debt escalated from 46% in 2013 to roughly 80% in 2018. 2Banks included in the new appraisal system are state-owned and state-controlled commercial lenders, and other commercial banks may also refer to the guidelines. Lenders will be evaluated yearly and the results will be factored into the annual reviews of top bank executives as salary determinants. Each of the four new categories will carry an equal weighting. The “national development goals and real economy” category has four benchmarks: serving the government’s “ecological civilization strategy” to encourage lending for green industries and companies; serving strategic emerging industries; implementing the “two increases” - inclusive lending to micro and small enterprises; and implementing the “two controls” - nonperforming loans and borrowing costs of micro and small enterprises. The category “controlling and preventing risks” includes metrics on bad loan ratios, the nonperforming loan growth rate, provision coverage, liquidity ratios and capital adequacy ratios. 3“Seeing Through the Frosted Glass: Assessing Chinese Local Governments’ Creditworthiness”, Pengyuan Rating Public Finance Report, June 2020 4Chinese SOE assets are estimated to have reached 2.3 times China’s 2019 GDP, whereas their debt is close to 130% of GDP. 5IMF estimated that about a quarter of Chinese SOEs were operating at a loss in 2017. Cyclical Investment Stance Equity Sector Recommendations
Highlights Strong/weak productivity growth leads to secular bull/bear markets in both equities and the currency. We illustrate why and how robust productivity gains can engender a virtuous self-reinforcing cycle that can run for many years. Detecting productivity for macro strategists is akin to doctors diagnosing a patient – it entails more art than science. Inflation, the real trade balance, and company profit margins constitute a litmus test for assessing productivity growth. Feature By far, the most critical variable determining long-term economic growth is a country’s productivity. This report presents why productivity matters for investors and examines how to gauge productivity growth given it is practically impossible to measure accurately. We use the framework presented in this report to analyze long-term trends in individual EM economies. In a follow-up piece, we will present a practical application of this framework by ranking developing economies according to their productivity and long-term growth potential. This report does not discuss what is needed to boost productivity because the policy prescriptions are well known and are widely available in economic literature. That said, we have outlined some of these in Box 1. BOX 1 The Basic Formula For Long-Term Growth For any economy, the potential growth rate is what can be achieved and sustained in the very long run. It can be expressed as follows: Potential (real) growth rate = productivity growth + labor force growth Given that we can use demographic data to approximate the number of people entering and exiting the labor force for each year over the next 18 years, the labor force growth variable can be easily estimated. Hence, the key unknown in the above formula is productivity growth. In a developing economy, it is difficult to measure productivity accurately (Chart 1). That is why when analyzing the long-term outlook, we first assess whether the country has effectively implemented the structural reforms needed to achieve faster productivity growth – some of which are listed below. We combine these observations with symptoms associated with either strong or weak productivity growth in order to assess an economy’s potential growth trajectory. Chart 1Productivity Growth Estimates For EM/China
Productivity Growth Estimates For EM/China
Productivity Growth Estimates For EM/China
Recommended policies to raise productivity growth typically include: building hard and soft infrastructure, improving education and training, investing in new technologies and equipment, promoting entrepreneurship and formation of new businesses, promoting competition, augmenting R&D spending, importing foreign “know how,” and fostering industry clusters that specialize in certain products or processes. Why Does Productivity Matter For Investors? Following are the investment implications of productivity growth: 1. Productivity is the sole driver of growing prosperity, which is reflected in rising per capita real incomes (Chart 2). Productivity = output per employee per hour = (real GDP or output) / (number of employees x number of hours worked) Rising productivity creates more income that is shared between employees and shareholders. If productivity rises by 5% and hourly wages increase by 2.5% in a year, unit labor costs will drop by 2.5%. In such a case, the 5% increase in productivity is shared equally between shareholders and employees. A lack of productivity gains and resulting stagnant income for both employees and business owners might lead to rising socio-political tensions and ultimately to political instability. 2. Strong productivity gains allow an economy to grow faster without experiencing high inflation (Chart 3). The upshot is reduced cyclicality in economic activity, i.e., business cycles are characterized by longer expansions and shallow and less frequent downturns. Equity investors will thus likely pay higher equity multiples due to the reduced cyclicality of corporate profits. Chart 2Productivity Is Ultimately Reflected In Rising Real Income Per Capita
Productivity Is Ultimately Reflected In Rising Real Income Per Capita
Productivity Is Ultimately Reflected In Rising Real Income Per Capita
Chart 3China: Strong Productivity Growth Has Kept A Lid On Inflation
China: Strong Productivity Growth Has Kept A Lid On Inflation
China: Strong Productivity Growth Has Kept A Lid On Inflation
The rationale is that robust productivity advances allow the economy to expand with low inflation with no need for monetary tightening. The relationship between productivity and inflation is discussed in detail below. A structurally low inflation environment allows policymakers to promptly deploy large monetary and fiscal stimulus when faced with economic downturns. In addition, low interest rates are also associated with higher equity valuations. On the contrary, a lack of productivity growth makes business cycles short-lived. Inflation will rise faster during a business cycle expansion in an economy with low productivity growth. In turn, interest rates will rise more rapidly in those economies, short-circuiting the expansion. Equity investors will be reluctant to pay high multiples for companies operating in such environments. 3. On a microeconomic level, high productivity gains are typically associated with higher profit margins and vice versa (Chart 4). Shareholders assign higher equity multiples to enterprises with higher profit margins and return on capital. Chart 4Faster Productivity Growth = Wider Corporate Profit Margins
Faster Productivity Growth = Wider Corporate Profit Margins
Faster Productivity Growth = Wider Corporate Profit Margins
Besides, wider profit margins allow companies to tolerate higher real interest rates. High real interest rates attract foreign fixed-income capital supporting the nation’s exchange rate. Given that labor costs make up a large share of costs in many companies, unit labor costs are a critical determinant of corporate profitability. Meanwhile, selling prices, sales as well as input prices are often beyond management control. Therefore, raising productivity (output per hour of an employee) is one of the few ways to lift corporate profitability and, by extension, return on capital. Unit labor costs = (wage per person per hour) / productivity 4. Rapid productivity advances allow companies to become more competitive without currency depreciation (Chart 5and Chart 6). Exchange rates of countries that achieve faster productivity growth typically appreciate in the long run. Chart 5Switzerland: High Productivity Has Sustained Competitiveness/Export Volumes Despite Currency Appreciation
Switzerland: High Productivity Has Sustained Competitiveness/Export Volumes Despite Currency Appreciation
Switzerland: High Productivity Has Sustained Competitiveness/Export Volumes Despite Currency Appreciation
Chart 6China and Vietnam: Rising Export Market Share Reflects Productivity Gains
China and Vietnam: Rising Export Market Share Reflects Productivity Gains
China and Vietnam: Rising Export Market Share Reflects Productivity Gains
Enterprises with higher productivity can drop their selling prices with limited impact on their profitability. By doing so, they can undercut their competitors and gain market share. Hence, solid productivity gains also entail a competitive currency, eliminating the need for central banks to hike interest rates in order to defend the exchange rate. 5. High indebtedness – in both public and private sectors – is easier to manage amid brisk productivity gains because the latter generate strong economic growth and relatively low nominal interest rates. Robust income gains among businesses and households, as well as for the government via taxation, enable indebted agents to service higher debt loads. Besides, nominal GDP growth above nominal interest rates arithmetically implies a drop in the public debt-to-GDP ratio. In brief, the economy could “grow into its debt” with robust productivity gains. In sum, strong/weak productivity growth leads to secular bull/bear markets in both equities and the currency. Rapid Productivity Gains Lead To A Virtuous Circle The following illustrates how robust productivity gains can engender a virtuous self-reinforcing cycle that can run for many years. Fast productivity gains allow for either fast wage or rapid corporate profit growth or a combination of the two. As income per capita rises, consumer spending grows and capital owners are willing to invest. New investments create new jobs and income and could also boost future productivity if substantial capital misallocation is dodged. The economy expands at a rapid rate, but inflation and, thereby, interest rates remain capped because the economy’s productive capacity grows in line with demand. Strong income and profit growth as well as stable borrowing costs lead to more credit demand from both households and businesses. Bank and non-bank credit expand but rapid household income gains and healthy enterprise profitability as well as growing government tax revenues support the private or public sectors’ debt servicing capacity. Robust economic growth, elevated real interest rates and high profitability attract foreign capital and foreign inflows lead to currency appreciation. Yet, such currency appreciation should not undermine the competitiveness of local producers – both exporters and those competing with imported goods. As discussed above, sizable productivity gains could reduce unit labor costs and allow domestic companies to drop their prices, sustaining their market shares in both export markets and domestically. Consequently, the trade balance does not deteriorate structurally despite a rapid expansion in domestic demand. Healthy balance of payments support the currency, i.e., the central bank does not need to hike interest rates or draw down reserves to defend the exchange rate. Finally, rapid corporate profit and household income growth as well as reasonably low nominal interest rates sustain high asset (equity and property) valuations for longer. Such a virtuous circle can persist until something breaks or major excesses – for example, capital misallocation, credit or property bubbles – emerge and then unravel. Meager Productivity Gains Lead To A Vicious Circle The following demonstrates how stagnant productivity can set in motion a vicious self-reinforcing circle. With no productivity gains, a business cycle recovery will likely lead to higher inflation sooner than later. The latter will short circuit the economic expansion as the central bank is forced to hike interest rates. If the central bank does not hike interest rates despite rising inflation, real (inflation-adjusted) interest rates will fall and could become negative. Low real rates are bearish for the currency. Either the central bank will be forced eventually to hike interest rates substantially or the exchange rate will continue depreciating. There are two reasons why low real interest rates are negative for the exchange rate: (1) low real borrowing costs will encourage more borrowing, spending, and investment. Such very strong domestic demand in the context of limited domestic productive capacity will lead to a ballooning trade deficit; and/or (2) low real interest rates will discourage foreign fixed-income capital inflows and weigh on the currency. With no productivity gains, any increase in wages will lead to rising unit labor costs and shrinking profit margins; corporate profitability and return on capital will plunge. The sole way to protect profitability amid rising unit labor costs is to raise selling prices. The latter could spur a wage-inflation spiral. Rising unit labor costs and resulting shrinking corporate profit margins leave domestic producers no room to reduce their selling prices to compete in export markets and with imports. The result is less exports, less import substitution and a deteriorating trade balance. In such a case, the only way to restore the competitiveness of domestic producers is to devalue the exchange rate. Declining or low returns on capital will discourage business investment, in general, and foreign direct investment (FDI) in particular with negative ramifications for future productivity. A worsening trade balance as well as diminishing foreign equity and FDI inflows also entail currency depreciation. This feeds into inflation and leads inevitably to monetary policy tightening. Such tightening prompts weaker growth, lower profitability and more foreign capital outflows. This vicious circle can persist until a major regime shift occurs: a dramatically devalued currency that stays very cheap or corporate restructuring and structural reforms that lead to higher productivity. Commodity Prices And Productivity A critical question to address regarding productivity in commodity producing countries is the issue of rising and falling commodity prices. Higher commodity prices lead to improved prosperity and vice versa. Does this mean that high commodity prices should be treated as productivity improvements? There is some ambiguity in regard to this but our preference is not to treat fluctuations in commodity prices as changes in the nation’s structural productivity. Let us consider the examples of Nigeria, which produces and exports oil, and Vietnam, which manufactures and ships smartphones in large quantities. Let us assume that smartphone exports are as important to Vietnam in generating income per capita as oil exports are to Nigeria. A doubling in oil prices amid flat oil export volumes would generate windfall oil revenues which would lift Nigeria’s income per capita. If smartphone prices remain constant but smartphone production and shipments (volumes) double, income per capita in Vietnam would rise as much as in Nigeria.1 The difference between these two scenarios in Nigeria and Vietnam is as follows: Nigeria would be made richer due to the price increases: it would be producing and exporting the same number of barrels of oil but a doubling in crude prices would augment income per capita in Nigeria. The problem is that Nigeria does not control oil prices. If oil prices decline, the nation’s income per capita would also drop substantially. Hence, there would have been no genuine (structural) productivity gains and Nigeria’s prosperity would be at the mercy of the global oil market. In the case of Vietnam, its productivity will have risen as it has succeeded in producing twice as many smartphones as it did last year. The country has built capacity, acquired technology and developed human skills to double smartphone production. This increased capacity, technology acquisition and skills cannot be taken away from Vietnam. This is a case of genuine productivity advancement. In fact, Vietnam could build on these skills and start producing other, more value-added goods. What if Nigeria doubled its oil output and export volume due to more investment and new technologies (as the US succeeded in doing with shale oil)? This scenario would qualify as genuine productivity gains. At any oil price scenario, Nigeria’s oil export revenues would double. The sole caveat is that the new oil production should have reasonably low breakevens, i.e., oil production should be viable even if oil prices decline. The same caveat is applicable to Vietnam. The difference between Nigeria (oil) and Vietnam (smartphones) is that commodities prices are much more volatile than manufactured goods prices. Bottom Line: In commodity producing countries, rising commodities prices have the same effect on income per capita as productivity gains. However, per capita income gains originating from higher commodities prices are reversable, i.e., not sustainable in the very long run. Consequently, higher commodity prices should not be treated as structural productivity gains. By contrast, productivity advancements – like Vietnam doubling its capacity to produce smartphones or Nigeria doubling its oil production volume – are non-reversable, i.e., they cannot be taken away. Hence, these constitute genuine productivity gains. Detecting Productivity Is Akin To Doctors Diagnosing A Patient Even in advanced countries, productivity is hard to measure accurately. Hence, any measure of productivity in developing economies should be used with a grain of salt. How do we carry out long-term analysis of developing economies when the key variable – productivity growth – is hard to measure? How do we make projections about productivity growth going forward? We see structural macro analysis as analogous to the work of doctors. When diagnosing a patient, doctors cannot necessarily observe what is happening in the patient’s body. Doctors conduct various tests and then analyze those results in the context of the symptoms. Putting it all together, they make a diagnosis and prescribe the necessary treatment. Similar to the manner in which doctors rely on symptoms and medical tests to determine where there is sufficient evidence of a disease, macro strategists do not see what is really occurring in their “patient’s” body, i.e., economies. Data for macro strategists is akin to medical tests for doctors. In developing countries, the quantity of economic data available to macro strategists is limited and of poor quality. Therefore, observing symptoms of economies under consideration and interpreting them correctly is crucial to the job of macro strategists for emerging economies. As they can count less on hard data and instead rely more on symptoms, their analysis is more of an art than a science. Symptoms Associated With Productivity: How To Detect Productivity At a country level, robust productivity gains are ceteris paribus typically associated with: A structurally improving real trade balance (exports minus import volumes), which is not due to a cheapened currency or a relapse in domestic demand but is due to domestic producers achieving the following: Becoming more competitive and gaining market share in global trade Succeeding in import substitution (imported products are crowded out by locally produced ones) Low inflation during an extended period of business cycle expansion Corporate profit margins expanding simultaneously with higher wages amid low inflation. A lack of productivity gains are ceteris paribus normally attendant with: A structurally deteriorating real trade balance as: Domestic producers lose market share in global exports Domestic producers lose market share to importers in local markets Rising inflation amid a moderate recovery in domestic demand Lingering downward pressure on corporate profit margins i.e., a modest rise in wage growth leads to a drop in corporate profit margins. On the whole, inflation, the real trade balance, and company profit margins constitute a litmus test for assessing productivity growth. A widening real trade deficit is a form of hidden inflationary pressure and a sign of lackluster productivity growth. The rationale is as follows: In a closed economy, when expanding demand outpaces the productive capacity of that economy, i.e., productivity gains do not keep up with thriving domestic demand, inflation will rise considerably. In short, rising inflation will be a symptom of paltry productivity gains. In an open economy, when domestic demand outpaces the productive capacity of that economy, inflation might not rise as demand could be satisfied by imports of foreign goods and services. In such a scenario, even though the trade balance will deteriorate, the currency might stay firm for a while because of foreign capital inflows or rising export (commodities) prices. As a result, inflation will stay low for some time. Eventually, when tailwinds from foreign capital inflows or high export prices cease, the currency will nosedive. Importers will have to raise prices in local currency causing a spike in inflation. Why would foreign capital inflows halt? Lackluster productivity gains amidst solid wage increases would cause a corporate profit margin squeeze and profitability will plummet. As a result, both FDI and equity inflows will dry up and the currency will depreciate. The latter will push up inflation considerably. In a nutshell, in an open economy poor productivity growth might not necessarily lead to high inflation where domestic demand can be satisfied by imports. In these cases, we can say that a widening real trade deficit is a form of hidden inflation. The only exception is when the real trade balance deteriorates due to imports of capital goods and/or new technologies that will be used to build new productive capacity. In such a case, a ballooning trade deficit should not be viewed as a form of hidden inflation and poor productivity growth. If consumer goods dominate imports, this would signify low chances of sizable productivity gains in a given country. If capital goods dominate imports, there are higher odds of future productivity gains. If these imported equipment and technologies are properly utilized, they will make the nation productive and competitive in the coming years. Higher productivity stemming from imports of these capital goods/new technologies, i.e., enlarged capacity to produce goods and services at lower costs, will cap inflation as well as expand exports and result in significant import substitution. A Checklist For Detecting Productivity Diagram 1 presents macro signposts that can be used to diagnose whether an economy is experiencing strong or weak productivity growth (these do not include traditional metrices such as education, R&D spending, strong governance, soft- and hard-infrastructure, etc.): Diagram 1A Checklist For Detecting Productivity
A Primer On Productivity
A Primer On Productivity
Arthur Budaghyan Chief Emerging Markets Strategist arthurb@bcaresearch.com Footnotes 1 We assume here that all inputs for smartphones are produced domestically, in Vietnam. This is not a realistic assumption, but we use it only to illustrate a macro point about productivity.
Chinese money supply decelerated in December, disappointing consensus expectations of a much more muted slowdown. M1 money supply grew 8.6% y/y, down from 10.0% y/y in November, and M2 decelerated to 10.1% y/y from 10.7% y/y. Similarly, aggregate financing…
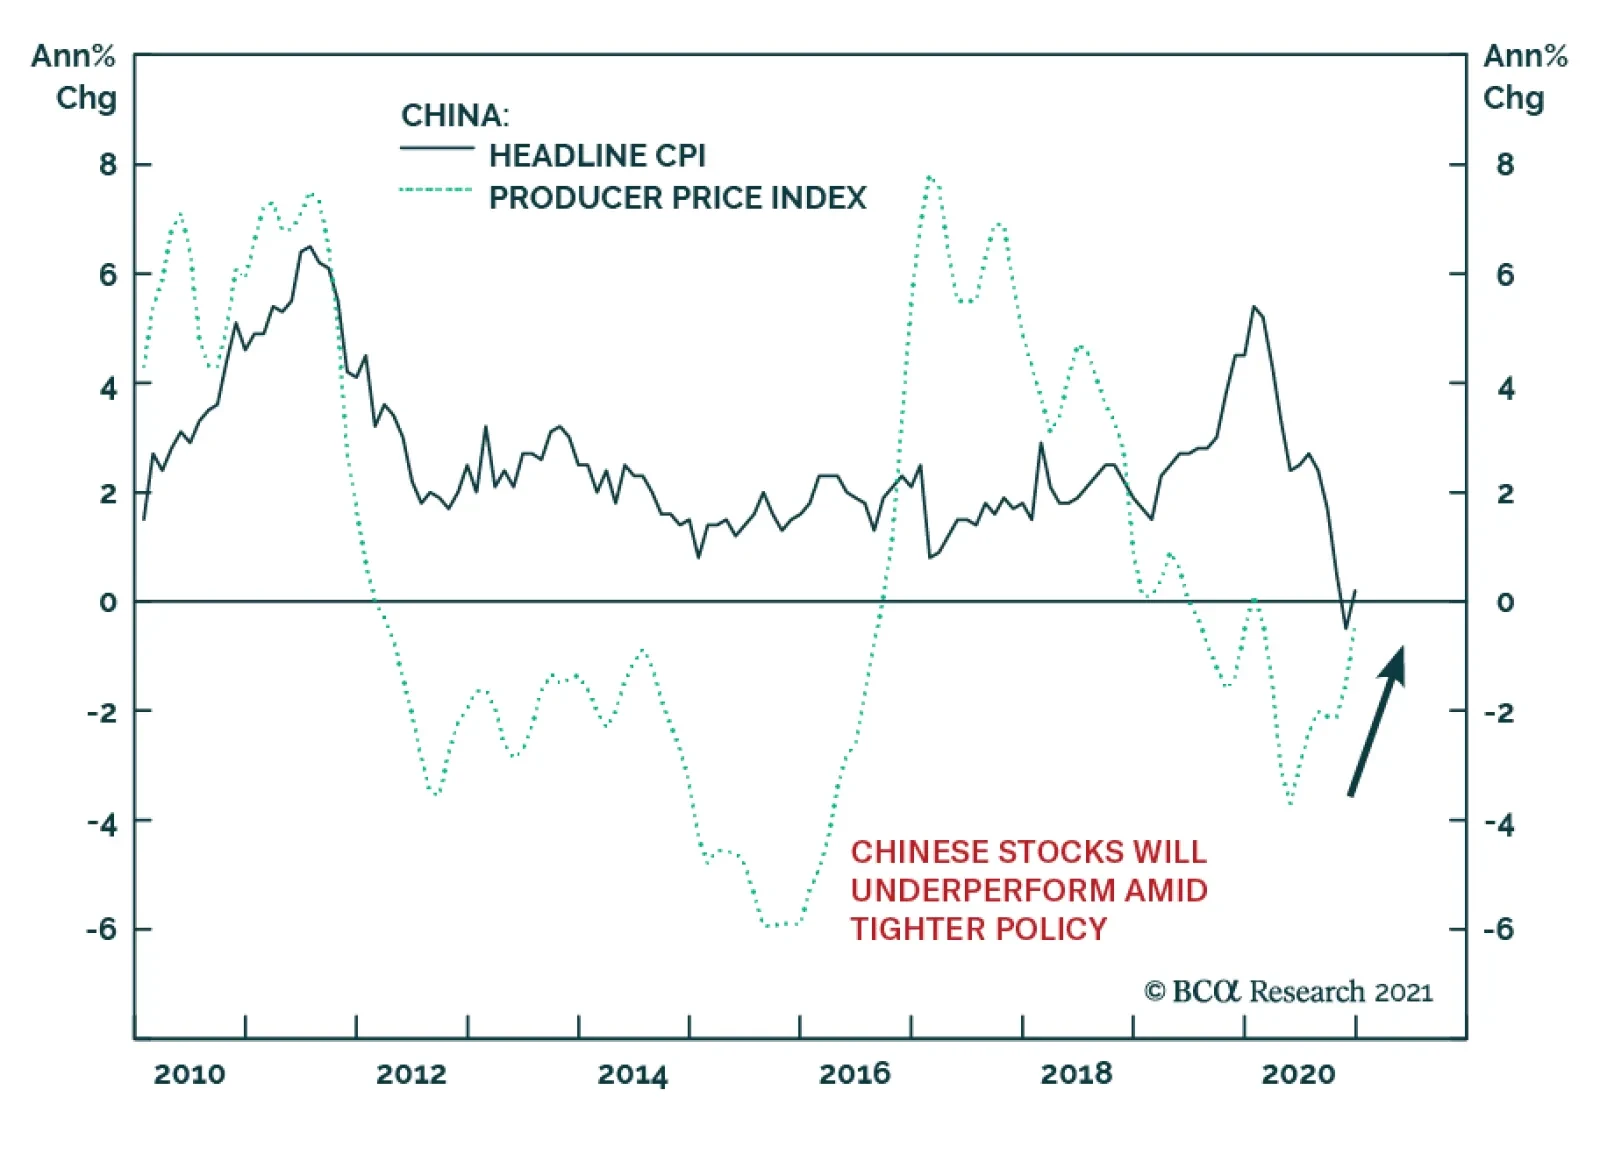
China’s consumer and producer prices surprised to the upside in December, pointing to continued support from China’s recovering business cycle. Headline CPI rose 0.2% y/y after declining 0.5% y/y in November. Core CPI, which excludes food and energy, remained…
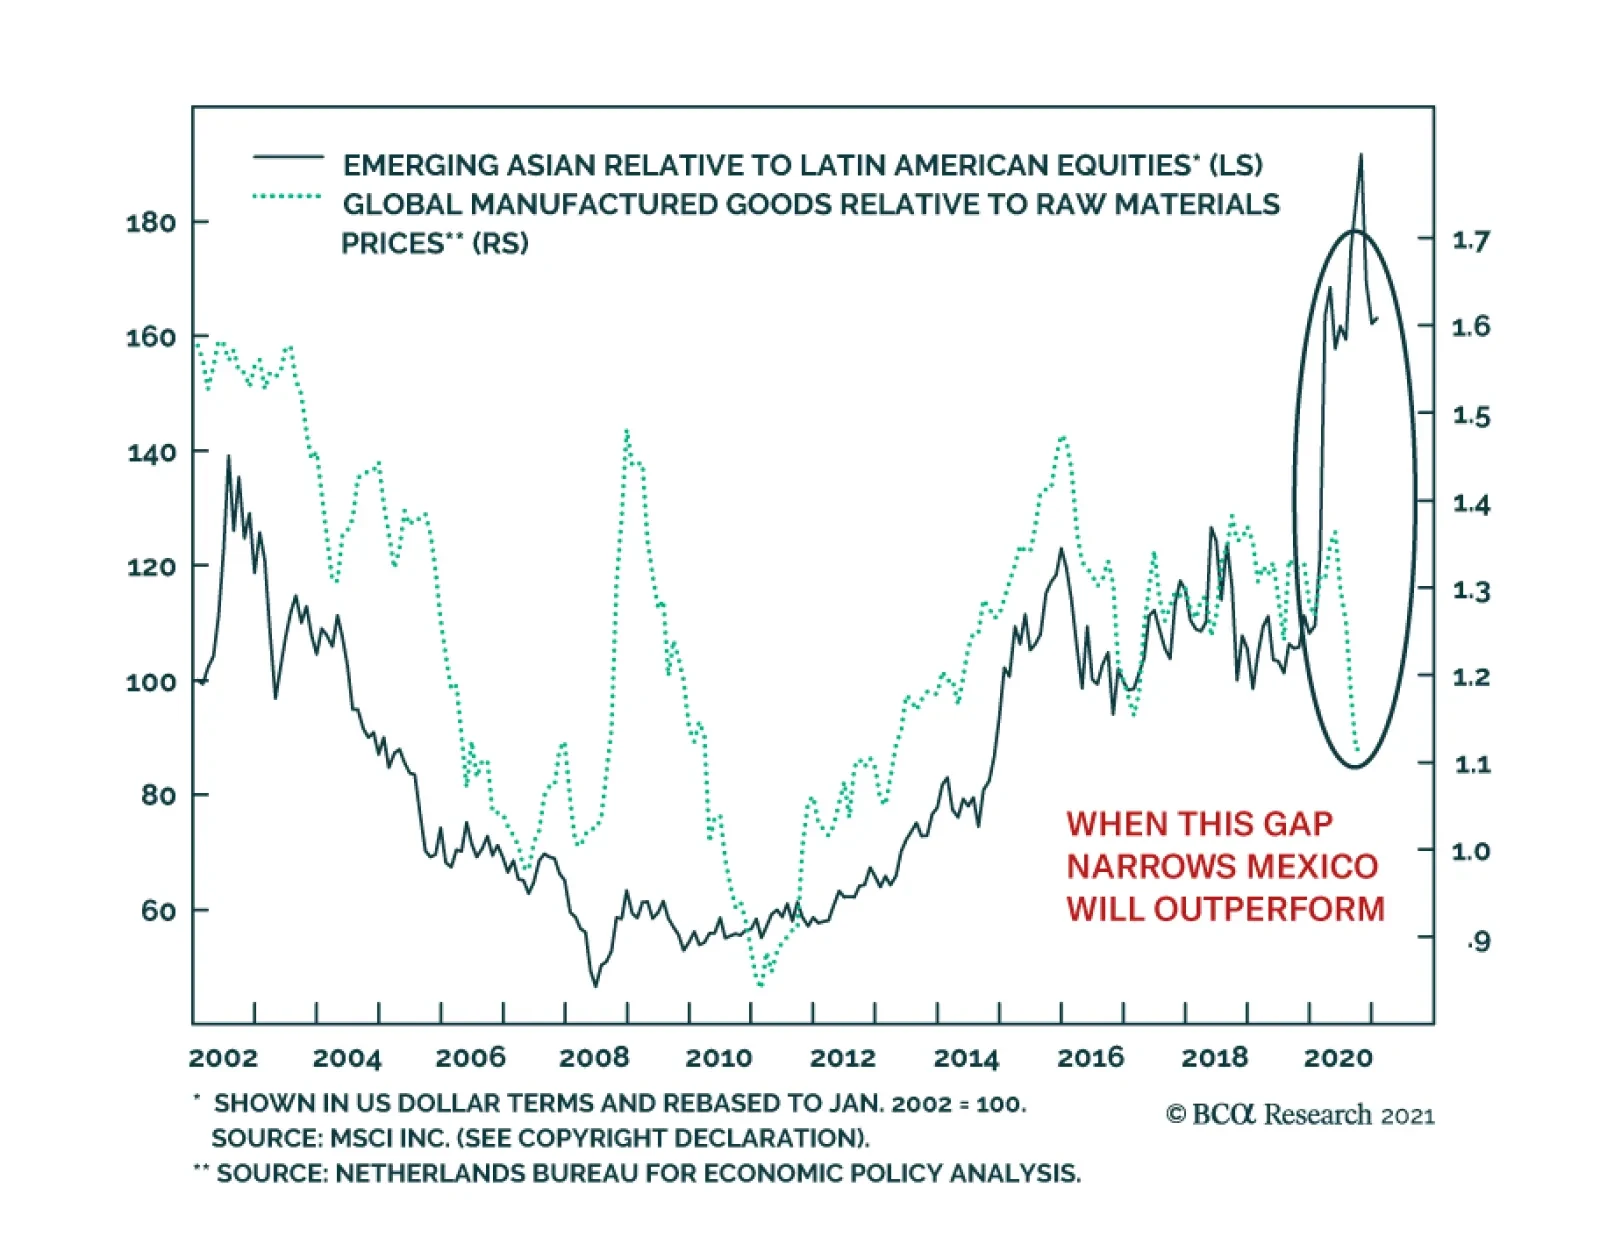
EM Asian equities have enjoyed an outsized outperformance versus EM ones in general and Latin American ones in particular over the past 12 years. This trend is under threat. From 2010 to early 2020, the relative performance of Asian equities closely…
Highlights Markets largely ignored the uproar at the US Capitol on January 6 because the transfer of power was not in question. Democratic control over the Senate, after two upsets in the Georgia runoff, is the bigger signal. US fiscal policy will become more expansive yet the Federal Reserve will not start hiking rates anytime soon. This is a powerful tailwind for risk assets over the short and medium run. Politics and geopolitics affect markets through the policy setting, rather than through discrete events, which tend to have fleeting market impacts. The current setting, in the US and abroad, is negative for the US dollar. The implication is positive for emerging market stocks and value plays. Go long global stocks ex-US, long emerging markets over developed markets, and long value over growth. Cut losses on short CNY-USD. Feature Chart 1Market's Muted Response To US Turmoil
Market's Muted Response To US Turmoil
Market's Muted Response To US Turmoil
Scenes of mayhem unfolded in the US Capitol on January 6 as protesters and rioters flooded the building and temporarily interrupted the joint session of Congress convened to count the Electoral College votes. Congress reconvened later and finished the tally. President-elect Joe Biden will take office at noon on January 20. Financial markets were unperturbed, with stocks up and volatility down, though safe havens did perk up a bit (Chart 1). The incident supports our thesis that the US election cycle of 2020 was a sort of “Civil War Lite” and that the country is witnessing “Peak Polarization,” with polarization likely to fall over the coming five years. The incident was the culmination of the past year of pandemic-fueled unrest and President Trump’s refusal to concede to the Electoral College verdict. Trump made a show of force by rallying his supporters, and apparently refrained from cracking down on those that overran Congress, but then he backed down and promised an orderly transfer of power. The immediate political result was to isolate him. Fewer Republicans than expected contested the electoral votes in the ensuing joint session; one Republican is openly calling for Trump to be forced into resignation via the 25th amendment procedure for those unfit to serve. The electoral votes were promptly certified. Vice President Mike Pence and other actors performed their constitutional duties. Pence reportedly gave the order to bring out the National Guard to restore order – hence it is possible that Pence and Trump’s cabinet could activate the 25th amendment, but that is unlikely unless Trump foments rebellion going forward. Vandals and criminals will be prosecuted and there could also be legal ramifications for Trump and some government officials. Do Politics And Geopolitics Affect Markets? The market’s lack of concern raises the question of whether investors need trouble themselves with politics at all. Philosopher and market guru Nassim Nicholas Taleb tweeted the following: If someone, a year ago, described January 6, 2021 (and events attending it) & asked you to guess the stock market behavior, admit you would have gotten it wrong. Just so you understand that news do not help you understand markets.1 This is a valid point. Investors should not (and do not) invest based on the daily news. Of course, many observers foresaw social unrest surrounding the 2020 election, including Professor Peter Turchin.2 Social instability was rising in the data, as we have long shown. When you combined this likelihood with the Fed’s pause on rate hikes, and a measurable rise in geopolitical tensions between the US and other countries, the implication was that gold would appreciate. So if someone had told you a year ago that the US would have a pandemic, that governments would unleash a 10.2% of global GDP fiscal stimulus, that the Fed would start average inflation targeting, that a vaccine would be produced, and that the US would have a contested election on top of it all, would you have expected gold to rise? Absolutely – and it has done so, both in keeping with the fall in real interest rates plus some safe-haven bonus, which is observable (Chart 2). Chart 2Gold Price In Excess Of Fall In Real Rates Implies Geopolitical Risk
Gold Price In Excess Of Fall In Real Rates Implies Geopolitical Risk
Gold Price In Excess Of Fall In Real Rates Implies Geopolitical Risk
The takeaway is that policy matters for markets while politics may only matter briefly at best. Which brings us back to the implications of the Trump rebellion. What Will Be The Impact Of The Trump Rebellion? We have highlighted that this election was a controversial rather than contested election – meaning that the outcome was not in question after late November when the court cases, vote counts, and recounts were certified. This was doubly true after the Electoral College voted on December 14. The protests and riots yesterday never seriously called this result into question. Whatever Trump’s intentions, there was no military coup or imposition of martial law, as some observers feared. In fact the scandal arose from the President’s hesitation to call out the National Guard rather than his use of security forces to prevent the transfer of power, as occurs during a coup. This partially explains why the market traded on the contested election in December 2000 but not in 2020 – the result was largely settled. The Biden administration now has more political capital than otherwise, which is market-positive because it implies more proactive fiscal policy to support the economic recovery. Trump’s refusal to concede gave Democrats both seats in the Georgia Senate runoffs, yielding control of Congress. Household and business sentiment will revive with the vaccine distribution and economic recovery, while the passage of larger fiscal stimulus is highly probable. US fiscal policy will almost certainly avoid the mistake of tightening fiscal policy too soon. Taken with the Fed’s aversion to raising rates, greater fiscal stimulus will create a powerful tailwind for risk assets over the next 12 months. The primary consequence of combined fiscal and monetary dovishness is a falling dollar. The greenback is a counter-cyclical and momentum-driven currency that broadly responds inversely to global growth trends. But policy decisions are clearly legible in the global growth path and the dollar’s path over the past two decades. Japanese and European QE, Chinese devaluation, the global oil crash, Trump’s tax cuts, the US-China trade war, and COVID-19 lockdowns all drove the dollar to fresh highs – all policy decisions (Chart 3). Policy decisions also ensured the euro’s survival, marking the dollar’s bottom against the euro in 2011, and ensuring that the euro could take over from the dollar once the dollar became overbought. Today, the US’s stimulus response to COVID-19 – combined with the Fed’s strategic review and the Democratic sweep of government – marked the peak and continued drop-off in the dollar. Chart 3Euro Survival, US Peak Polarization, Set Stage For Rotation From USD To EUR
Euro Survival, US Peak Polarization, Set Stage For Rotation From USD To EUR
Euro Survival, US Peak Polarization, Set Stage For Rotation From USD To EUR
Chart 4China's Yuan Says Geopolitics Matters
China's Yuan Says Geopolitics Matters
China's Yuan Says Geopolitics Matters
The Chinese renminbi is heavily manipulated by the People’s Bank and is not freely exchangeable. The massive stimulus cycle that began in 2015, in reaction to financial turmoil, combined with the central bank’s decision to defend the currency marked a bottom in the yuan’s path. China’s draconian response to the pandemic this year, and massive stimulus, made China the only major country to contribute positively to global growth in 2020 and ensured a surge in the currency. The combination of US and Chinese policy decisions has clearly favored the renminbi more than would be the case from the general economic backdrop (Chart 4). Getting the policy setting right is necessary for investors. This is true even though discrete political events – including major political and geopolitical crises – have fleeting impacts on markets. What About Biden’s Trade Policy? Trump was never going to control monetary or fiscal policy – that was up to the Fed and Congress. His impact lay mostly in trade and foreign policy. Specifically his defeat reduces the risk of sweeping unilateral tariffs. It makes sense that global economic policy uncertainty has plummeted, especially relative to the United States (Chart 5). If US policy facilitates a global economic and trade recovery, then it also makes sense that global equities would rise faster than American equities, which benefited from the previous period of a strong dollar and erratic or aggressive US fiscal and trade policy. Trump’s last 14 days could see a few executive orders that rattle stocks. There is a very near-term downside risk to European and especially Chinese stocks from punitive measures, or to Emirati stocks in the event of another military exchange with Iran (Chart 6). But Trump will be disobeyed if he orders any highly disruptive actions, especially if they contravene national interests. Beyond Trump’s term we are constructive on all these bourses, though we expect politics and geopolitics to remain a headwind for Chinese equities. Chart 5Big Drop In Global Policy Uncertainty
Big Drop In Global Policy Uncertainty
Big Drop In Global Policy Uncertainty
US tensions with China will escalate again soon – and in a way that negatively impacts US and Chinese companies exposed to each other. Chart 6Geopolitical Implications Of Biden's Election
Geopolitical Implications Of Biden's Election
Geopolitical Implications Of Biden's Election
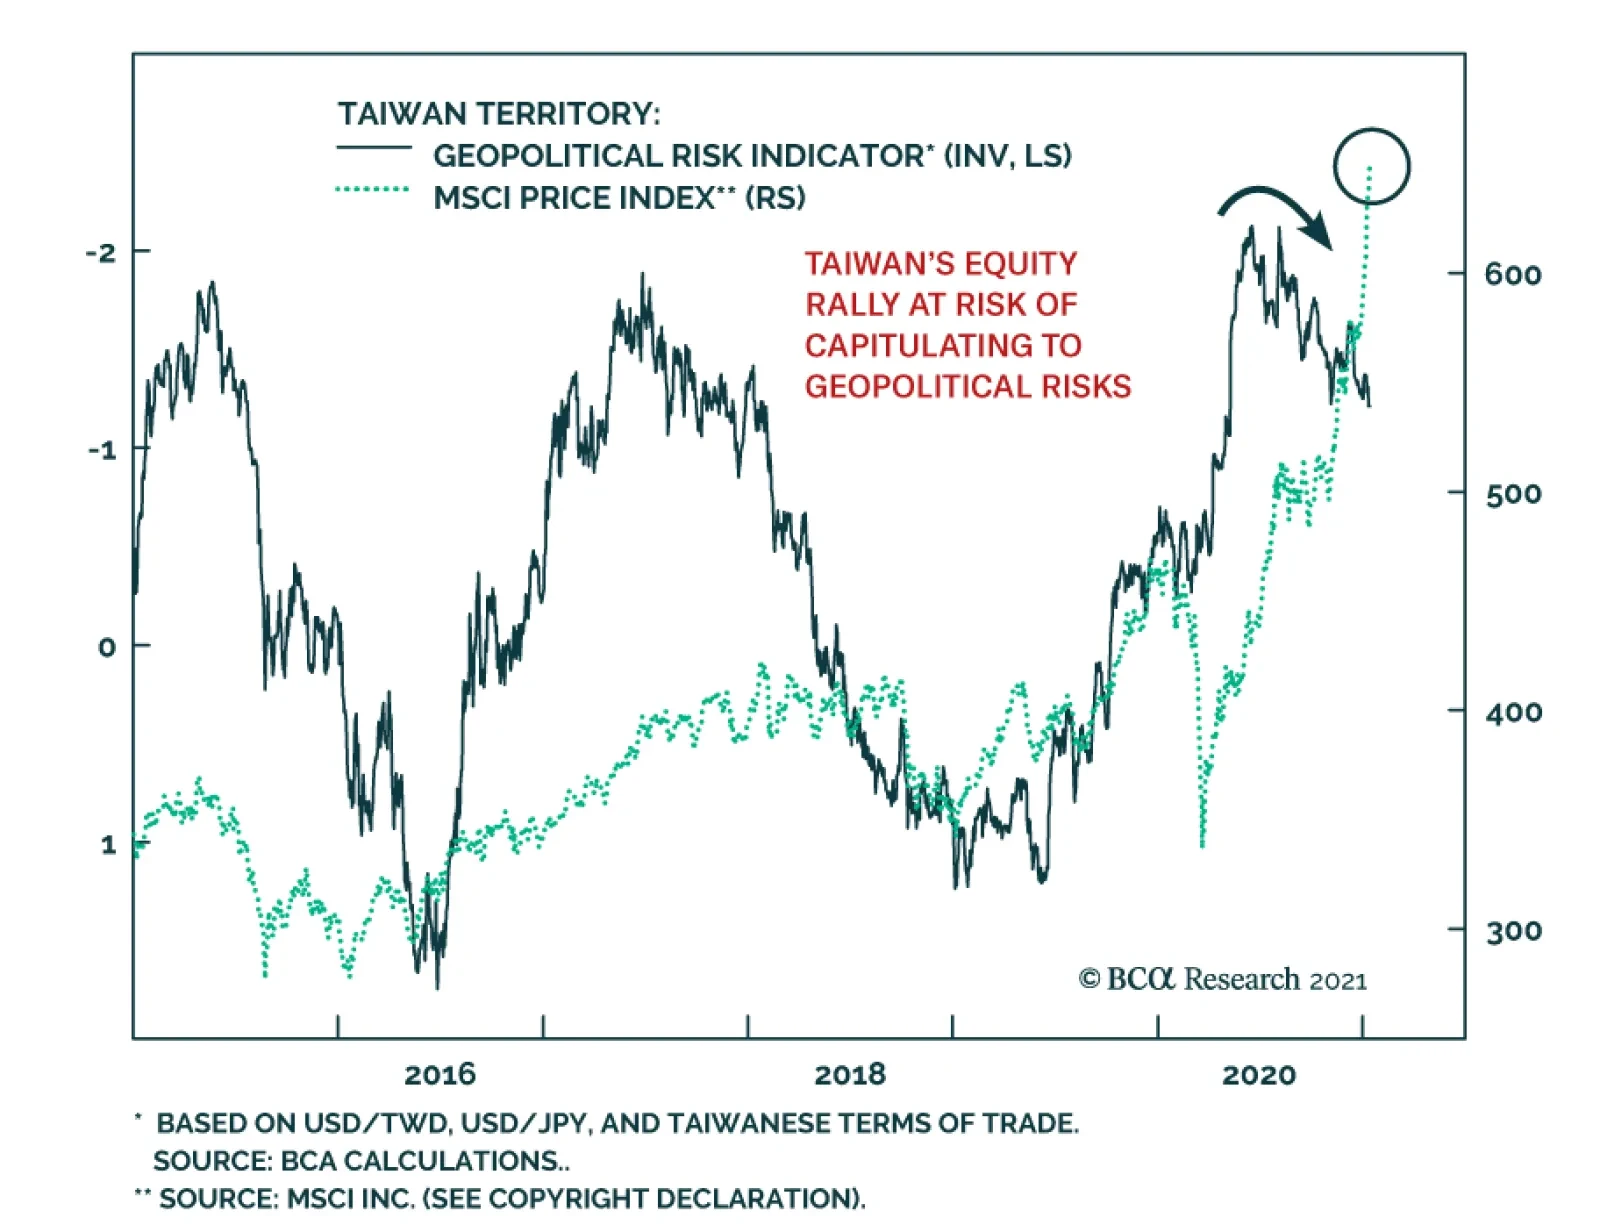
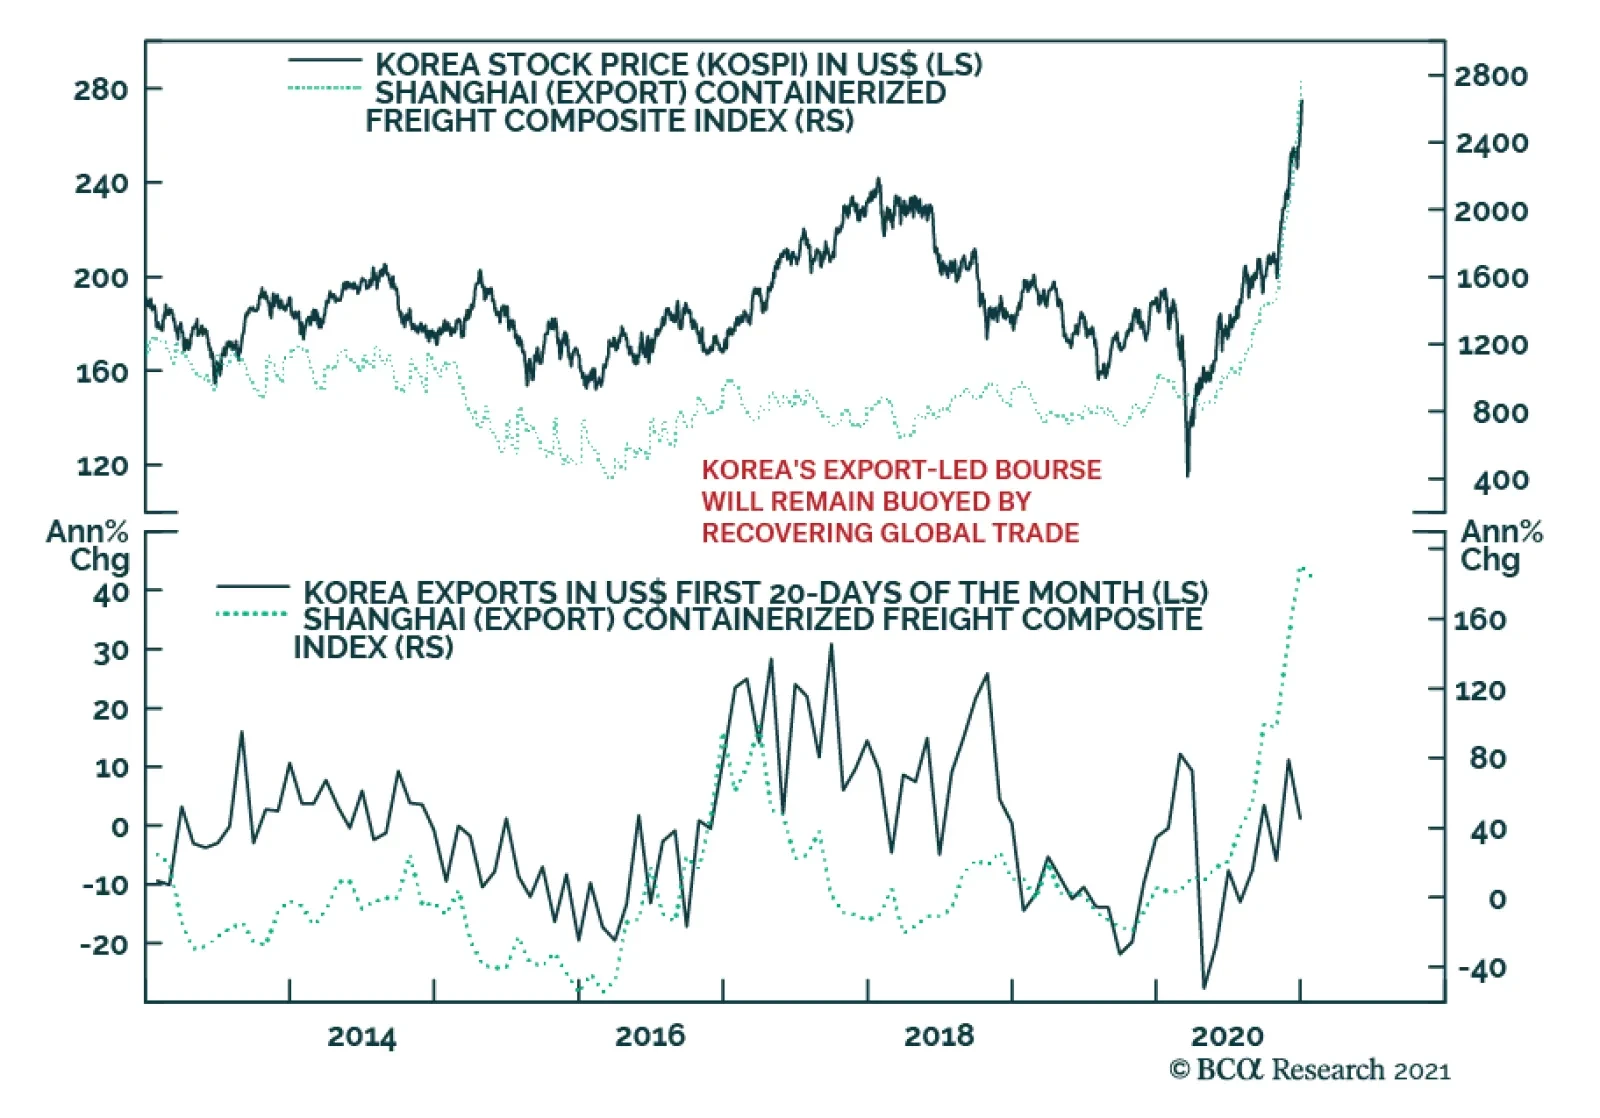
The cold war between these two is an unavoidable geopolitical trend as China threatens to surpass the US in economic size and improves its technological prowess. Presidents Xi and Trump were merely catalysts. But there are two policy trends that will override this rivalry for at least the first half of the year. First, global trade is recovering– as shown here by the Shanghai freight index and South Korean exports and equity prices (Chart 7). The global recovery will boost Korean stocks but geopolitical tensions will continue to brood over more expensive Taiwanese stocks due to the US-China conflict. This has motivated our longstanding long Korea / short Taiwan recommendation. Chart 7Global Economy Speaks Louder Than North Korea
Global Economy Speaks Louder Than North Korea
Global Economy Speaks Louder Than North Korea
Chart 8China Wary Of Over-Tightening Policy
China Wary Of Over-Tightening Policy
China Wary Of Over-Tightening Policy
Chart 9Global Stock-Bond Ratio Registers Good News
Global Stock-Bond Ratio Registers Good News
Global Stock-Bond Ratio Registers Good News
Second, China’s 2020 stimulus will have lingering effects and it is wary of over-tightening monetary and fiscal policy, lest it undo its domestic economic recovery. The tenor of China’s Central Economic Work Conference in December has reinforced this view. Chart 8 illustrates the expectations of our China Investment Strategy regarding China’s credit growth and local government bond issuance. They suggest that there will not be a sharp withdrawal of fiscal or quasi-fiscal support in 2021. Stability is especially important in the lead up to the critical leadership rotation in 2022.3 This policy backdrop will be positive for global/EM equities despite the political crackdown on General Secretary Xi Jinping’s opponents will occur despite this supportive policy backdrop. The global stock-to-bond ratio has surged in clear recognition of these positive policy trends (Chart 9). Government bonds were deeply overbought and it will take several years before central banks begin tightening policy. What About Biden’s Foreign Policy? Chart 10OPEC 2.0 Cartel Continues (For Now)
Accommodative US Monetary Policy, Tighter Commodity Markets Will Stoke Inflation OPEC 2.0 Cartel Continues (For Now)
Accommodative US Monetary Policy, Tighter Commodity Markets Will Stoke Inflation OPEC 2.0 Cartel Continues (For Now)
Iran poses a genuine geopolitical risk this year – first in the form of an oil supply risk, should conflict emerge in the Persian Gulf, Iraq, or elsewhere in the region. This would inject a risk premium into the oil price. Later the risk is the opposite as a deal with the Biden administration would create the prospect for Iran to attract foreign investment and begin pumping oil, while putting pressure on the OPEC 2.0 coalition to abandon its current, tentative, production discipline in pursuit of market share (Chart 10). Biden has the executive authority to restore the 2015 nuclear deal (Joint Comprehensive Plan of Action). He is in favor of doing so in order to (1) prevent the Middle East from generating a crisis that consumes his foreign policy; (2) execute an American grand strategy of reviving its Asia Pacific influence; (3) cement the Obama administration’s legacy. The Iranian President Hassan Rouhani also has a clear interest in returning to the deal before the country’s presidential election in June. This would salvage his legacy and support his “reformist” faction. The Supreme Leader also has a chance to pin the negative aspects of the deal on a lame duck president while benefiting from it economically as he prepares for his all-important succession. The problem is that extreme levels of distrust will require some brinkmanship early in Biden’s term. Iran is building up leverage ahead of negotiations, which will mean higher levels of uranium enrichment and demonstrating the range of its regional capabilities, including the Strait of Hormuz, and its ability to impose economic pain via oil prices. Biden will need to establish a credible threat if Iran misbehaves. Hence the geopolitical setting is positive for oil prices at the moment. Beyond Iran, there is a clear basis for policy uncertainty to decline for Europe and the UK while it remains elevated for China and Russia (Chart 11). Chart 11Relative Policy Uncertainty Favors Europe and UK Over Russia And China
Relative Policy Uncertainty Favors Europe and UK Over Russia And China
Relative Policy Uncertainty Favors Europe and UK Over Russia And China
The US international image has suffered from the Trump era and the Biden administration’s main priorities will lie in solidifying alliances and partnerships and stabilizing the US role in the world, rather than pursuing showdown and confrontation. However, it will not be long before scrutiny returns to the authoritarian states, which have been able to focus on domestic recovery and expanding their spheres of influence amid the US’s tumultuous election year. Chart 12GeoRisk Indicators Say Risks Underrated For These Bourses
GeoRisk Indicators Say Risks Underrated For These Bourses
GeoRisk Indicators Say Risks Underrated For These Bourses
The US will not seek a “diplomatic reset” with Russia, aside from renegotiating the New START treaty. The Democrats will seek to retaliate for Russia’s extensive cyberattack in 2021 as well as for election interference and psychological warfare in the United States. And while there probably will be a reset with China, it will be short-lived, as outlined above. This situation contrasts with that of the Atlantic sphere. The Biden administration is a crystal clear positive, relative to a second Trump term, for the European Union. The EU and the UK have just agreed to a trade deal, as expected, to conclude the Brexit process, which means that the US-UK “special relationship” will not be marred by disagreements over Ireland. European solidarity has also strengthened as a result of the pandemic, which highlighted the need for collective policy responses, including fiscal. Thus the geopolitical risks of the new administration are most relevant for China/Taiwan and Russia. Comparing our GeoRisk Indicators, which are market-based, with the relative equity performance of these bourses, Taiwanese stocks are the most vulnerable because markets are increasingly pricing the geopolitical risk yet the relative stock performance is toppy (Chart 12). The limited recovery in Russian equities is also at risk for the same reason. Only in China’s case has the market priced lower geopolitical risk, not least because of the positive change in US administration. We expect Biden and Xi Jinping to be friendly at first but for strategic distrust to reemerge by the second half of the year. This will be a rude awakening for Chinese stocks – or China-exposed US stocks, especially in the tech sector. Investment Takeaways Chart 13Global Policy Shifts Drive Big Investment Reversals
Global Policy Shifts Drive Big Investment Reversals
Global Policy Shifts Drive Big Investment Reversals
The US is politically divided. Civil unrest and aftershocks of the controversial election will persist but markets will ignore it unless it has a systemic impact. The policy consequence is a more proactive fiscal policy, resulting in virtual fiscal-monetary coordination that is positive both for global demand and risk assets, while negative for the US dollar. The Biden administration will succeed in partially repealing the Trump tax cuts, but the impact on corporate profit margins will be discounted fairly mechanically and quickly by market participants, while the impact on economic growth will be more than offset by huge new spending. Sentiment will improve after the pandemic – and Biden has not yet shown an inclination to take an anti-business tone. The past decade has been marked by a dollar bull market and the outperformance of developed markets over emerging markets and growth stocks like technology over value stocks like financials. Cyclical sectors have traded in a range. Going forward, a secular rise in geopolitical Great Power competition is likely to persist but the macro backdrop has shifted with the decline of the dollar. Cyclical sectors are now poised to outperform while a bottom is forming in value stocks and emerging markets (Chart 13). We recommend investors go strategically long emerging markets relative to developed. We are also going long global value over growth stocks. We are not yet ready to close our gold trade given that the two supports, populist fiscal turn and great power struggle, will continue to be priced by markets in the near term. We are throwing in the towel on our short CNY-USD trade after the latest upleg in the renminbi, though our view continues to be that geopolitical fundamentals will catch yuan investors by surprise when they reassert themselves. We also recommend preferring global equities to US equities, given the above-mentioned global trends plus looming tax hikes. Matt Gertken Vice President Geopolitical Strategy mattg@bcaresearch.com Footnotes 1 January 6, 2020, twitter.com. 2 See Turchin and Andrey Korotayev, "The 2010 Structural-Demographic Forecast for the 2010-2020 Decade: A Retrospective Assessment," PLoS ONE 15:8 (2020), journals.plos.org. 3 Not to mention that 2021 is the Communist Party’s 100th anniversary – not a time to make an unforced policy error with an already wobbly economy.
Highlights An uninterrupted advance in reflation trades will be possible if the FOMO (fear of missing out) evolves into a full-blown mania. This scenario cannot be ruled out especially with retail investors around the world continuing to flock into equity markets. EM equity valuations are neither cheap in absolute terms nor relative to Europe and Japan. EM is cheap only versus the S&P 500. US relative equity outperformance in common currency terms is breaking down. Go long EM stocks / short the S&P 500. The Blue Wave in the US is very bearish for the greenback and has reduced our expectations of the magnitude and duration of any near-term US dollar rebound. It has in fact reinforced our medium- to long-term negative US dollar view. Feature Financial markets are at a crossroad. On the one hand, the reflation trades have already rallied a great deal and might be at a point of exhaustion. On the other hand, gigantic monetary and fiscal support from authorities worldwide, and the US in particular, could push global share prices into a no gravity zone where major overshoots and manias are possible. The bullish view is well-known: DM central banks’ easy monetary and fiscal policies will endure. Moreover, the global economy will continue its recovery as vaccines are made accessible by mid-year to a large share of the population in advanced economies. Markets will ignore any growth disappointment stemming from the expansion and/or extension of lockdowns as they are forward-looking and expect widespread vaccine deployment to eventually allow for a reopening of the economies. We agree with these points. The negative view is also well-recognized: investor sentiment on global equities in general and EM in particular is very elevated and reflation trades have become overbought. These are valid and correct points as well. Chart I-1 illustrates that the Sentix investor sentiment1 on EM equities is at an all-time high. In the past, when sentiment reached these levels EM share prices experienced either a correction or a bear market. Chart I-1Investor Sentiment On EM Equities Is At A Record High
Investor Sentiment On EM Equities Is At A Record High
Investor Sentiment On EM Equities Is At A Record High
Further, the December issue of the Bank of America/Merrill Lynch survey noted that investor overweights in EM stocks and commodities are the highest since November 2010 and February 2011, respectively. These proved to be the major (structural) tops in EM equities and commodities. Certainly, positioning in EM is even more crowded now than it was four weeks ago. Are EM equities at a point of exhaustion – where the rally runs out – or at a point of no gravity – where nothing will stop them from marching higher? In the near term, either is possible. It truly depends on investor behavior which is impossible to forecast with any high degree of certainty. Chart I-2Korean Stocks Have Benefited From Local Retail Mania
Korean Stocks Have Benefited From Local Retail Mania
Korean Stocks Have Benefited From Local Retail Mania
For instance, retail mania has been happening not only in the US but also in many developing countries. In particular, the astonishing rally in Korean stocks has been propelled not by foreign investors but by local retail investors (Chart I-2). That is why traditional yardsticks of investment analysis have not been useful. In the medium and long term, the trend in global share prices, and thereby EM, will likely be shaped by issues where there is no consensus among investors. In our opinion, there are two subjects upon which investors disagree: (1) whether global and EM equity valuations are too expensive, and (2) whether US inflation will rise sufficiently so that the Federal Reserve abandons its super-easy monetary policy stance, and when markets will begin to price this in. EM equity valuations are not at all cheap. An uninterrupted advance will be possible if the FOMO (fear of missing out) evolves into a full-blown mania. This scenario cannot be ruled out especially with retail investors around the world continuing to flock into equity markets. Concerning US inflation, the odds are that it will rise sooner and faster than is expected by the market and the Fed. Although the Fed is unlikely to singlehandedly spoil the party, fixed-income markets could start pricing in rate hikes sooner rather than later with ramifications for share prices. We will discuss equity valuations in this report and devote a separate report in the coming weeks to the inflation outlook in the US and China. Market Implications Of The Blue Wave Chart I-3US Consumption Of Industrial Metals Is Too Small
Reflation Trades: Exhaustion Or No Gravity?
Reflation Trades: Exhaustion Or No Gravity?
We expected US Republicans to maintain their majority in the Senate after Georgia’s Senate elections, thus dimming the likelihood of more large-scale fiscal stimulus. If realized, that would have triggered a rebound in the US dollar from very oversold levels. US Democrats effectively gaining control of the Senate has major implications for financial markets: America’s fiscal policy will be looser than otherwise. Swelling government spending will boost domestic demand and will produce a wider trade deficit and higher inflation. Yet, the Fed is unlikely to tighten policy anytime soon and real interest rates will remain negative. This is very bearish for the US dollar. Any rebound in the greenback, which is possible given its oversold conditions, should be faded. According to our Chief Geopolitical Strategist Matt Gertken, odds are that Democrats will partially repeal the corporate tax cuts enacted during Trump’s administration. This is negative for both the US dollar and for Wall Street. One of the main campaign promises of Democrats has been to address income inequality. Actions on this front are good for Main Street but these policies will weigh on corporate profitability. Big Tech faces a greater threat of taxes from a united Congress as opposed to a divided Congress, but Biden’s executive decrees will not be too harsh given that these companies are a major source of support for Democrats. US nominal interest rates will rise but so will nominal GDP growth. The negative impact of higher US bond yields on EM will be more than offset by two forces: a weaker US dollar and stronger exports to the US. Finally, the shift in US fiscal policy is clearly inflationary. However, the impact on commodities prices will be modest. The US accounts for only 8% of global industrial metals consumption compared to China’s 57% share (Chart I-3). So, a slowdown in China commencing in H2 2021 will more than offset the rise in US metals consumption. Concerning oil, the US is the world’s largest crude consumer. Hence, higher household income and spending are positive for oil prices. However, a forceful Democrat push toward green energy is structurally negative for US oil consumption. These two forces might offset each other leaving oil prices to be determined by other factors. Bottom Line: Democrat control of both houses of Congress is positive for US nominal GDP and, hence, for corporate revenues but is bearish for the US dollar and corporate profit margins. Net-net, this reinforces our view that US relative equity outperformance in common currency terms has already passed its secular top and is breaking down (Chart I-4, top panel). By contrast, this US policy shift is positive for EM financial markets (Chart I-4, bottom panel). We recommend a new trade/strategy: go long EM stocks / short the S&P 500. EM Equity Valuations In our opinion, global stocks, especially US ones, are expensive and EM equities are far from being cheap. Let’s begin with EM equity valuations: Chart I-5 shows our Composite Valuation Indicator (CVI) for the MSCI EM equity benchmark. It is an average of four individual valuation indicators: market cap-weighted, equal-weighted, trimmed mean, and median. Chart I-4US Equity Outperformance Is Over
US Equity Outperformance Is Over
US Equity Outperformance Is Over
Chart I-5EM Equities: Good News Are Fully Priced In
EM Equities: Good News Are Fully Priced In
EM Equities: Good News Are Fully Priced In
In turn, each of these four indicators incorporates five multiples: forward P/E, trailing P/E, price-to-cash EPS, price-to-book value and price-to-dividend ratios. According to Chart I-5, EM equities are expensive. Not only are trailing P/E and price-to-cash EPS ratios extremely elevated but also the forward P/E ratio is the highest and the dividend yield is the lowest it has been in 18 years (Chart I-6). Even though EM stocks do not appear to be expensive based on a price-to-book value (PBV) ratio, a structural decline in EM return on equity (RoE) entails that the fair value range for the PBV ratio has downshifted over the past decade and the current reading should be taken with a grain of salt. Chart I-7 demonstrates that the RoEs for the entire MSCI EM universe, equal-weighted MSCI EM equity index and MSCI non-financial EM companies have deteriorated structurally. Hence, a decline in return on equity is widespread among EM-listed companies, i.e. it is not a feature unique to only large caps. Chart I-6EM Equity Multiples
EM Equity Multiples
EM Equity Multiples
Chart I-7A Structural Drop In EM RoE Heralds Lower Multiples
A Structural Drop In EM RoE Heralds Lower Multiples
A Structural Drop In EM RoE Heralds Lower Multiples
In brief, the structural decline in EM RoE justifies a lower PBV ratio for EM equities (Chart I-7, bottom panel). Relative to DM, EM equities are not cheap. They are cheap versus their US peers but expensive versus European and Japanese stocks. Chart I-8 exhibits the relative Composite Valuation Indicator for EM relative to DM. For EM, it is the same as in Chart I-5 and for DM we use an identical measure. When discussing equity valuations, one should now distinguish between growth and value stocks. EM growth stocks are grossly overvalued as shown in the top panel of Chart I-9. EM value stocks are close to their fair value, i.e., they are not cheap (Chart I-9, bottom panel). Chart I-8EM Versus DM: Relative Equity Multiples
EM Versus DM: Relative Equity Multiples
EM Versus DM: Relative Equity Multiples
Chart I-9Multiples For EM Growth And Value Stocks
Multiples For EM Growth And Value Stocks
Multiples For EM Growth And Value Stocks
A caveat is in order: all of these CVIs do not incorporate interest rates into valuation models. We look at equity multiples in the context of low interest rates in the sections that follow. Incorporating Interest Rates Into Equity Valuations Chart I-10EM Earnings Yields Adjusted For Local Bond Yields
EM Earnings Yields Adjusted For Local Bond Yields
EM Earnings Yields Adjusted For Local Bond Yields
There are various ways to incorporate interest rates/the discount factor into equity valuations. One way is to calculate the difference between forward earnings yield (EY) and long-term bond yields. We use forward EY because trailing EPS is still depressed by the pandemic-induced economic crash, i.e., trailing P/Es do not provide a true valuation picture. Chart I-10 demonstrates the gap between EM forward EY and 10-year US bond yields (on the top panel) and the same forward EY and EM local bond yields (Chart I-10, bottom panel). Both measures are not far from their historical means. Hence, adjusted for bond yields, EM stocks are fairly valued. That said, there are two pertinent questions that follow from this: (1) how do EM equities compare to their DM peers; and (2) how well have these interest rate-adjusted valuation measures worked in markets where interest rates had dropped to zero. In other words, do near-zero interest rates warrant a secular bull market? We address this last topic in the section below. As to the first question, Chart I-11 presents the forward EY-local interest rate differential for major equity markets. A higher differential presage cheaper equity valuation relative to lower numbers. Chart I-11US And EM Equities Have Been Chronically Expensive Versus European And Japanese Ones
US And EM Equities Have Been Chronically Expensive Versus European And Japanese Ones
US And EM Equities Have Been Chronically Expensive Versus European And Japanese Ones
According to this measure, Japanese and Euro Area equities have been and remain cheaper than US and EM equities. Chart I-12 ranks all individual EM equity benchmarks as well as major DM bourses based on the differential between forward EY and local nominal bond yields. Stocks in India, Indonesia, South Africa, Turkey, Mexico and Colombia are expensive, adjusted for local bond yields. Chart I-12Cross Country Valuation Ranking: Forward Earnings Yield Minus Local Bond Yields
Reflation Trades: Exhaustion Or No Gravity?
Reflation Trades: Exhaustion Or No Gravity?
By contrast, equity markets in Central Europe, core Europe and Russia offer better value, relative to domestic bonds. The EM aggregate index, the Chinese investable benchmark and the S&P 500 fall in the middle of this valuation ranking. Bottom Line: Based on equity multiples, EM equities are expensive. However, when adjusted for interest rates, absolute valuation of EM equities is neutral. Relative to DM, the EM equity benchmark is not cheap. In fact, they are more expensive compared to European and Japanese stocks. Equity Valuation When Rates Are At Zero No doubt, equity prices should be re-rated as interest rates drop. However, what should the equilibrium P/E multiple be when interest rates are close to zero? Japan, the euro area and Switzerland offer a roadmap. Chart I-13Japanese And European Stocks Have Not Entered Structural Bull Markets Despite Negative Rates
Japanese and European Stocks Have Not Entered Structural Bull Markets Despite Negative Rates
Japanese and European Stocks Have Not Entered Structural Bull Markets Despite Negative Rates
For some time now, these markets have had to process many of the same features that US and global markets are currently facing. Specifically: They have had negative policy rates and 10-year government bond yields for many years. Their central banks have been conducting some sort of QE programs. The Bank of Japan and the Swiss National Bank have been purchasing equities and the ECB has been buying corporate bonds. Finally, onward from 2012 until the eruption of the pandemic, economic growth in Japan, the euro area and Switzerland was decent. Despite negative interest rates, their broad equity markets have failed to break out into a structural bull market. Their stocks have re-rated, but the upside was capped (Chart I-13). Critically, the forward EY differential with their local government bond yields have stayed wide (Chart I-14). Chart I-14Japanese, Euro Area And Swiss Equities Have Not Re-Rated Despite Negative Bond Yields
Japanese, Euro Area And Swiss Equities Have Not Re-Rated Despite Negative Bond Yields
Japanese, Euro Area And Swiss Equities Have Not Re-Rated Despite Negative Bond Yields
In sum, the experiences of Japanese, Swiss and other European markets show that zero or negative interest rates alone did not compel a secular bull market in share prices. Rather, equity re-rating in these bourses has been relatively moderate. Investment Considerations The Blue Wave is very bearish for the greenback as we argued above. This development has reduced our conviction regarding the magnitude and duration of any near-term US dollar rebound. It has in fact reinforced our medium- to long-term negative US dollar view. Potential EM currencies that investors should consider buying on a dip versus the US dollar are MXN, SGD, KRW, TWD, CNY, INR and CZK. For now, we continue to recommend a neutral allocation to EM equities and credit within global equity and credit portfolios, respectively. However, we note that odds of EM outperformance have risen with the Blue Wave in the US and ensuing US dollar depreciation. Yet, Europe and Japan presently offer a better risk/reward profile than EM. However, to reflect our strong conviction of a breakdown in US relative performance and a more upbeat view on EM versus US stocks, we recommend the following trade/strategy: long EM stocks / short the S&P 500, currency unhedged. Concerning the absolute performance of EM and DM stocks, they are very overbought, reasonably expensive and sentiment is very bullish. In normal times, this would argue for a pullback. For example, Chart I-15 shows that a rollover in the inverted US equity put-call ratio typically heralds a setback in the S&P500. Chart I-15A Red Flag? Do Indicators No Longer Work?
A Red Flag? Do Indicators No Longer Work?
A Red Flag? Do Indicators No Longer Work?
However, if global stocks are moving from a FOMO stage to a mania phase, many traditional relationships and indicators might not work. This and the fact the EM equity index is at a critical juncture entails its outlook is currently highly uncertain – odds of a breakout (FOMO evolving into a mania) and a potential setback are equal. Finally, some housekeeping, we are closing the long Chinese Investable stocks / short Korean stocks recommendation. This trade has generated a massive loss of 33.5% as the KOSPI has taken off in recent weeks. We continue to overweight both Chinese and Korean equities within an EM equity portfolio. We will likely make changes to our recommended country allocations within equity and fixed-income portfolios in the coming weeks. Stay tuned. Arthur Budaghyan Chief Emerging Markets Strategist arthurb@bcaresearch.com Footnotes 1 The Sentix Asset Classes Sentiment Emerging Markets Equities Index is polled among 5,000 European individual and institutional investors. In the survey, investors are asked about their medium-term price expectations for the asset class. Source: SENTIX. Equities Recommendations Currencies, Credit And Fixed-Income Recommendations
South Korean equities had a spectacular run in 2020 and are continuing the rally this year, with the KOSPI up another 3% so far. The bourse was a favorite in the early days of the pandemic due to the Korean government’s rapid response to the virus and the…