Emerging Markets
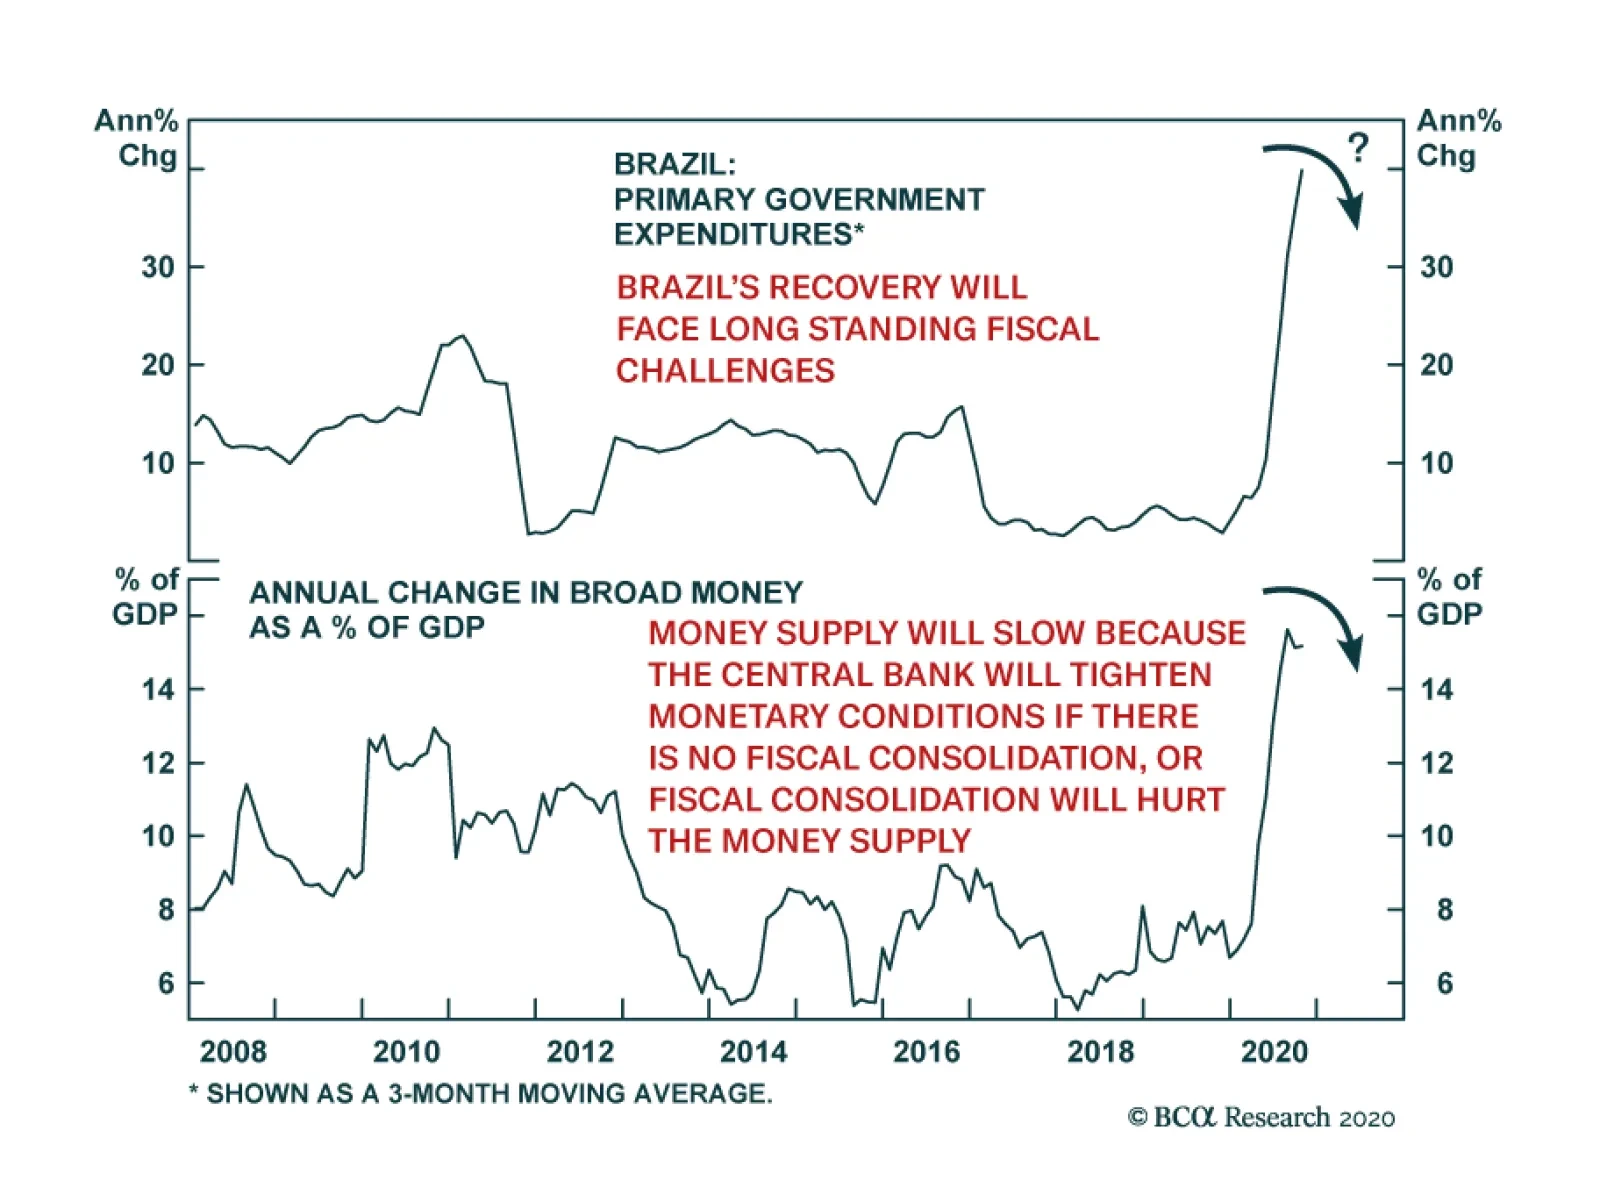
The Brazilian economy has managed the pandemic relatively well this year due to generous fiscal spending. However, fiscal constraints now threaten to derail the recovery. Fiscal sustainability, an issue even prior to the pandemic, is now even more…

Highlights With a vaccine already rolling out in the UK and soon in the US, investors have reason to be optimistic about next year. Government bond yields are rising, cyclical equities are outperforming defensives, international stocks hinting at outperforming American, and value stocks are starting to beat growth stocks (Chart 1). Feature President Trump’s defeat in the US election also reduces the risk of a global trade war, or a real war with Iran. European, Chinese, and Emirati stocks have rallied since the election, at least partly due to the reduction in these risks (Chart 2). However, geopolitical risk and global policy uncertainty have been rising on a secular, not just cyclical, basis (Chart 3). Geopolitical tensions have escalated with each crisis since the financial meltdown of 2008. Chart 1A New Global Business Cycle
A New Global Business Cycle
A New Global Business Cycle
Chart 2Biden: No Trade War Or War With Iran?
Biden: No Trade War Or War With Iran?
Biden: No Trade War Or War With Iran?
Chart 3Geopolitical Risk And Global Policy Uncertainty
Geopolitical Risk And Global Policy Uncertainty
Geopolitical Risk And Global Policy Uncertainty
Chart 4The Decline Of The Liberal Democracies?
The Decline Of The Liberal Democracies?
The Decline Of The Liberal Democracies?
Trump was a symptom, not a cause, of what ails the world. The cause is the relative decline of the liberal democracies in political, economic, and military strength relative to that of other global players (Chart 4). This relative decline has emboldened Chinese and Russian challenges to the US-led global order, as well as aggressive and unpredictable moves by middle and small powers. Moreover the aftershocks of the pandemic and recession will create social and political instability in various parts of the world, particularly emerging markets (Chart 5). Chart 5EM Troubles Await
EM Troubles Await
EM Troubles Await
Chart 6Global Arms Build-Up Continues
Global Arms Build-Up Continues
Global Arms Build-Up Continues
We are bullish on risk assets next year, but our view is driven largely from the birth of a new economic cycle, not from geopolitics. Geopolitical risk is rapidly becoming underrated, judging by the steep drop-off in measured risk. There is no going back to a pre-Trump, pre-Xi Jinping, pre-2008, pre-Putin, pre-9/11, pre-historical golden age in which nations were enlightened, benign, and focused exclusively on peace and prosperity. Hard data, such as military spending, show the world moving in the opposite direction (Chart 6). So while stock markets will grind higher next year, investors should not expect that Biden and the vaccine truly portend a “return to normalcy.” Key View #1: China’s Communist Party Turns 100, With Rising Headwinds Investors should ignore the hype about the Chinese Communist Party’s one hundredth birthday in 2021. Since 1997, the Chinese leadership has laid great emphasis on this “first centenary” as an occasion by which China should become a moderately prosperous society. This has been achieved. China is deep into a structural economic transition that holds out a much more difficult economic, social, and political future. Chart 7China: Less Money, More Problems
China: Less Money, More Problems
China: Less Money, More Problems
The big day, July 1, will be celebrated with a speech by General Secretary Xi Jinping in which he reiterates the development goals of the five-year plan. This plan – which doubles down on import substitution and the aggressive tech acquisition campaign – will be finalized in March, along with Xi’s yet-to-be released vision for 2035, which marks the halfway point to the “second centenary,” 2049, the hundredth birthday of the regime. Xi’s 2035 goals may contain some surprises but the Communist Party’s policy frameworks should be seen as “best laid plans” that are likely to be overturned by economic and geopolitical realities. It was easier for the country to meet its political development targets during the period of rapid industrialization from 1979-2008. Now China is deep into a structural economic transition that holds out a much more difficult economic, social, and political future. Potential growth is slowing with the graying of society and the country is making a frantic dash, primarily through technology acquisition, to boost productivity and keep from falling into the “middle income trap” (Chart 7). Total debt levels have surged as Beijing attempts to make this transition smoothly, without upsetting social stability. Households and the government are taking on a greater debt load to maintain aggregate demand while the government tries to force the corporate sector to deleverage in fits and starts (Chart 8). The deleveraging process is painful and coincides with a structural transition away from export-led manufacturing. Beijing likely believes it has already led de-industrialization proceed too quickly, given the huge long-term political risks of this process, as witnessed in the US and UK. The fourteenth five-year plan hints that the authorities will give manufacturing a reprieve from structural reform efforts (Chart 9). Chart 8China Struggles To Dismount Debt Bubble
China Struggles To Dismount Debt Bubble
China Struggles To Dismount Debt Bubble
Chart 9China Will Slow De-Industrialization, Stoking Protectionism
China Will Slow De-Industrialization, Stoking Protectionism
China Will Slow De-Industrialization, Stoking Protectionism
Chart 10China Already Reining In Stimulus
China Already Reining In Stimulus
China Already Reining In Stimulus
A premature resumption of deleveraging heightens domestic economic risks. The trade war and then the pandemic forced the Xi administration to abandon its structural reform plans temporarily and drastically ease monetary, fiscal, and credit policy to prevent a recession. Almost immediately the danger of asset bubbles reared its head again. Because the regime is focused on containing systemic financial risk, it has already begun tightening monetary policy as the nation heads into 2021 – even though the rest of the world has not fully recovered from the pandemic (Chart 10). The risk of over-tightening is likely to be contained, since Beijing has no interest in undermining its own recovery. But the risk is understated in financial markets at the moment and, combined with American fiscal risks due to gridlock, this familiar Chinese policy tug-of-war poses a clear risk to the global recovery and emerging market assets next year. Far more important than the first centenary, or even General Secretary Xi’s 2035 vision, is the impending leadership rotation in 2022. Xi was originally supposed to step down at this time – instead he is likely to take on the title of party chairman, like Mao, and aims to stay in power till 2035 or thereabouts. He will consolidate power once again through a range of crackdowns – on political rivals and corruption, on high-flying tech and financial companies, on outdated high-polluting industries, and on ideological dissenters. Beijing must have a stable economy going into its five-year national party congresses, and 2022 is no different. But that goal has largely been achieved through this year’s massive stimulus and the discovery of a global vaccine. In a risk-on environment, the need for economic stability poses a downside risk for financial assets since it implies macro-prudential actions to curb bubbles. The 2017 party congress revealed that Xi sees policy tightening as a key part of his policy agenda and power consolidation. In short, the critical twentieth congress in 2022 offers no promise of plentiful monetary and credit stimulus (Chart 11). All investors can count on is the minimum required for stability. This is positive for emerging markets at the moment, but less so as the lagged effects of this year’s stimulus dissipate. Chart 11No Promise Of Major New Stimulus For Party Congress 2022
No Promise Of Major New Stimulus For Party Congress 2022
No Promise Of Major New Stimulus For Party Congress 2022
Not only will Chinese domestic policy uncertainty remain underestimated, but geopolitical risk will also do so. Superficially, Beijing had a banner year in 2020. It handled the coronavirus better than other countries, especially the US, thus advertising Xi Jinping’s centralized and statist governance model. President Trump lost the election. Regardless of why Trump lost, his trade war precipitated a manufacturing slowdown that hit the Rust Belt in 2019, before the virus, and his loss will warn future presidents against assaulting China’s economy head-on, at least in their first term. All of this is worth gold in Chinese domestic politics. Chart 12China’s Image Suffered In Spite Of Trump
2021 Key Views: No Return To Normalcy
2021 Key Views: No Return To Normalcy
Internationally, however, China’s image has collapsed – and this is in spite of Trump’s erratic and belligerent behavior, which alienated most of the world and the US’s allies (Chart 12). Moreover, despite being the origin of COVID-19, China’s is one of the few economies that thrived this year. Its global manufacturing share rose. While delaying and denying transparency regarding the virus, China accused other countries of originating the virus, and unleashed a virulent “wolf warrior” diplomacy, a military standoff with India, and a trade war with Australia. The rest of Asia will be increasingly willing to take calculated risks to counterbalance China’s growing regional clout, and international protectionist headwinds will persist. The United States will play a leading part in this process. Sino-American strategic tensions have grown relentlessly for more than a decade, especially since Xi Jinping rose to power, as is evident from Chinese treasury holdings (Chart 13). The Biden administration will naturally seek a diplomatic “reset” and a new strategic and economic dialogue with China. But Biden has already indicated that he intends to insist on China’s commitments under Trump’s “phase one” trade deal. He says he will keep Trump’s sweeping Section 301 tariffs in place, presumably until China demonstrates improvement on the intellectual property and tech transfer practices that provided the rationale for the tariffs. Biden’s victory in the Rust Belt ensures that he cannot revert to the pre-Trump status quo. Indeed Biden amplifies the US strategic challenge to China’s rise because he is much more likely to assemble a “grand alliance” or “coalition of the willing” focused on constraining China’s illiberal and mercantilist policies. Even the combined economic might of a western coalition is not enough to force China to abandon its statist development model, but it would make negotiations more likely to be successful on the West’s more limited and transactional demands (Chart 14). Chart 13The US-China Divorce Pre-Dates And Post-Dates Trump
The US-China Divorce Pre-Dates And Post-Dates Trump
The US-China Divorce Pre-Dates And Post-Dates Trump
Chart 14Biden's Grand Alliance A Danger To China
Biden's Grand Alliance A Danger To China
Biden's Grand Alliance A Danger To China
The Taiwan Strait is ground zero for US-China geopolitical tensions. The US is reviving its right to arm Taiwan for the sake of its self-defense, but the US commitment is questionable at best – and it is this very uncertainty that makes a miscalculation more likely and hence conflict a major tail risk (Chart 15). True, Beijing has enormous economic leverage over Taiwan, and it is fresh off a triumph of imposing its will over Hong Kong, which vindicates playing the long game rather than taking any preemptive military actions that could prove disastrous. Nevertheless, Xi Jinping’s reassertion of Beijing and communism is driving Taiwanese popular opinion away from the mainland, resulting in a polarizing dynamic that will be extremely difficult to bridge (Chart 16). If China comes to believe that the Biden administration is pursuing a technological blockade just as rapidly and resolutely as the Trump administration, then it could conclude that Taiwan should be brought to heel sooner rather than later. Chart 15US Boosts Arms Sales To Taiwan
2021 Key Views: No Return To Normalcy
2021 Key Views: No Return To Normalcy
Chart 16Taiwan Strait Risk Will Explode If Biden Seeks Tech Blockade
2021 Key Views: No Return To Normalcy
2021 Key Views: No Return To Normalcy
Bottom Line: On a secular basis, China faces rising domestic economic risks and rising geopolitical risk. Given the rally in Chinese currency and equities in 2021, the downside risk is greater than the upside risk of any fleeting “diplomatic reset” with the United States. Emerging markets will benefit from China’s stimulus this year but will suffer from its policy tightening over time. Key View #2: The US “Pivot To Asia” Is Back On … And Runs Through Iran Most likely President-elect Biden will face gridlock at home. His domestic agenda largely frustrated, he will focus on foreign policy. Given his old age, he may also be a one-term president, which reinforces the need to focus on the achievable. He will aim to restore the Obama administration’s foreign policy, the chief features of which were the 2015 nuclear deal with Iran and the “Pivot to Asia.” The US is limited by the need to pivot to Asia, while Iran is limited by the risk of regime failure. A deal should be agreed. The purpose of the Iranian deal was to limit Iran’s nuclear and regional ambitions, stabilize Iraq, create a semblance of regional balance, and thus enable American military withdrawal. The US could have simply abandoned the region, but Iran’s ensuing supremacy would have destabilized the region and quickly sucked the US back in. The newly energy independent US needed a durable deal. Then it could turn its attention to Asia Pacific, where it needed to rebuild its strategic influence in the face of a challenger that made Iran look like a joke (Chart 17). Chart 17The "Pivot To Asia" In A Nutshell
The "Pivot To Asia" In A Nutshell
The "Pivot To Asia" In A Nutshell
It is possible for Biden to revive the Iranian deal, given that the other five members of the agreement have kept it afloat during the Trump years. Moreover, since it was always an executive deal that lacked Senate approval, Biden can rejoin unilaterally. However, the deal largely expires in 2025 – and the Trump administration accurately criticized the deal’s failure to contain Iran’s missile development and regional ambitions. Therefore Biden is proposing a renegotiation. This could lead to an even greater US-Iran engagement, but it is not clear that a robust new deal is feasible. Iran can also recommit to the old deal, having taken only incremental steps to violate the deal after the US’s departure – manifestly as leverage for future negotiations. Of course, the Iranians are not likely to give up their nuclear program in the long run, as nuclear weapons are the golden ticket to regime survival. Libya gave up its nuclear program and was toppled by NATO; North Korea developed its program into deliverable nuclear weapons and saw an increase in stature. Iran will continue to maintain a nuclear program that someday could be weaponized. Nevertheless, Tehran will be inclined to deal with Biden. President Hassan Rouhani is a lame duck, his legacy in tatters due to Trump, but his final act in office could be to salvage his legacy (and his faction’s hopes) by overseeing a return to the agreement prior to Iran’s presidential election in June. From Supreme Leader Ali Khamenei’s point of view, this would be beneficial. He also needs to secure his legacy, but as he tries to lay the groundwork for his power succession, Iran faces economic collapse, widespread social unrest, and a potentially explosive division between the Iranian Revolutionary Guard Corps and the more pragmatic political faction hoping for economic opening and reform. Iran needs a reprieve from US maximum pressure, so Khamenei will ultimately rejoin a limited nuclear agreement if it enables the regime to live to fight another day. In short, the US is limited by the need to pivot to Asia, while Iran is limited by the risk of regime failure. A deal should be agreed. But this is precisely why conflict could erupt in 2021. First, either in Trump’s final days in office or in the early days of the Biden administration, Israel could take military action – as it has likely done several times this year already – to set back the Iranian nuclear program and try to reinforce its own long-term security. Second, the Biden administration could decide to utilize the immense leverage that President Trump has bequeathed, resulting in a surprisingly confrontational stance that would push Iran to the brink. This is unlikely but it may be necessary due to the following point. Third, China and Russia could refuse to cooperate with the US, eliminating the prospect of a robust renegotiation of the deal, and forcing Biden to choose between accepting the shabby old deal or adopting something similar to Trump’s maximum pressure. China will probably cooperate; Russia is far less certain. Beijing knows that the US intention in Iran is to free up strategic resources to revive the US position in Asia, but it has offered limited cooperation on Iran and North Korea because it does not have an interest in their acquiring nuclear weapons and it needs to mitigate US hostility. Biden has a much stronger political mandate to confront China than he does to confront Iran. Assuming that the Israelis and Saudis can no more prevent Biden’s détente with Iran than they could Obama’s, the next question will be whether Biden effectively shifts from a restored Iranian deal to shoring up these allies and partners. He can possibly build on the Abraham Accords negotiated by the Trump administration smooth Israeli ties with the Arab world. The Middle East could conceivably see a semblance of balance. But not in 2021. The coming year will be the rocky transition phase in which the US-Iran détente succeeds or fails. Chart 18Oil Market Share War Preceded The Last US-Iran Deal
Oil Market Share War Preceded The Last US-Iran Deal
Oil Market Share War Preceded The Last US-Iran Deal
Chart 19Still, Base Case Is For Rising Oil Prices
Still, Base Case Is For Rising Oil Prices
Still, Base Case Is For Rising Oil Prices
Chart 20Biden Needs A Credible Threat
Biden Needs A Credible Threat
Biden Needs A Credible Threat
The lead-up to the 2015 Iranian deal saw a huge collapse in global oil prices due to a market share war with Saudi Arabia, Russia, and the US triggered by US shale production and Iranian sanctions relief (Chart 18). This was despite rising global demand and the emergence of the Islamic State in Iraq. In 2021, global demand will also be reviving and Iraq, though not in the midst of full-scale war, is still unstable. OPEC 2.0 could buckle once again, though Moscow and Riyadh already confirmed this year that they understand the devastating consequences of not cooperating on production discipline. Our Commodity and Energy Strategy projects that the cartel will continue to operate, thus drawing down inventories (Chart 19). The US and/or Israel will have to establish a credible military threat to ensure that Iran is in check, and that will create fireworks and geopolitical risks first before it produces any Middle Eastern balance (Chart 20). Bottom Line: The US and Iran are both driven to revive the 2015 nuclear deal by strategic needs. Whether a better deal can be negotiated is less likely. The return to US-Iran détente is a source of geopolitical risk in 2021 though it should ultimately succeed. The lower risk of full-scale war is negative for global oil prices but OPEC 2.0 cartel behavior will be the key determiner. The cartel flirted with disaster in 2020 and will most likely hang together in 2021 for the sake of its members’ domestic stability. Key View #3: Europe Wins The US Election Chart 21Europe Won The US Election
Europe Won The US Election
Europe Won The US Election
The European Union has not seen as monumental of a challenge from anti-establishment politicians over the past decade as have Britain and America. The establishment has doubled down on integration and solidarity. Now Europe is the big winner of the US election. Brussels and Berlin no longer face a tariff onslaught from Trump, a US-instigated global trade war, or as high of a risk of a major war in the Middle East. Biden’s first order of business will be reviving the trans-Atlantic alliance. Financial markets recognize that Europe is the winner and the euro has finally taken off against the dollar over the past year. European industrials and small caps outperformed during the trade war as well as COVID-19, a bullish signal (Chart 21). Reinforcing this trend is the fact that China is looking to court Europe and reduce momentum for an anti-China coalition. The center of gravity in Europe is Germany and 2021 faces a major transition in German politics. Chancellor Angela Merkel will step down at long last. Her Christian Democratic Union is favored to retain power after receiving a much-needed boost for its handling of this year’s crisis (Chart 22), although the risk of an upset and change of ruling party is much greater than consensus holds. Chart 22German Election Poses Political Risk, Not Investment Risk
German Election Poses Political Risk, Not Investment Risk
German Election Poses Political Risk, Not Investment Risk
However, from an investment point of view, an upset in the German election is not very concerning. A left-wing coalition would take power that would merely reinforce the shift toward more dovish fiscal policy and European solidarity. Either way Germany will affirm what France affirmed in 2017, and what France is on track to reaffirm in 2022: that the European project is intact, despite Brexit, and evolving to address various challenges. The European project is intact, despite Brexit, and evolving to address various challenges. This is not to say that European elections pose no risk. In fact, there will be upsets as a result of this year’s crisis and the troubled aftermath. The countries with upcoming elections – or likely snap elections in the not-too-distant future, like Spain and Italy – show various levels of vulnerability to opposition parties (Chart 23). Chart 23Post-COVID EU Elections Will Not Be A Cakewalk
Post-COVID EU Elections Will Not Be A Cakewalk
Post-COVID EU Elections Will Not Be A Cakewalk
Chart 24Immigration Tailwind For Populism Subsided
Immigration Tailwind For Populism Subsided
Immigration Tailwind For Populism Subsided
The chief risks to Europe stem from fiscal normalization and instability abroad. Regime failures in the Middle East and Africa could send new waves of immigration, and high levels of immigration have fueled anti-establishment politics over the past decade. Yet this is not a problem at the moment (Chart 24). And even more so than the US, the EU has tightened border enforcement and control over immigration (Chart 25). This has enabled the political establishment to save itself from populist discontent. The other danger for Europe is posed by Russian instability. In general, Moscow is focusing on maintaining domestic stability amid the pandemic and ongoing economic austerity, as well as eventual succession concerns. However, Vladimir Putin’s low approval rating has often served as a warning that Russia might take an external action to achieve some limited national objective and instigate opposition from the West, which increases government support at home (Chart 26). Chart 25Europe Tough On Immigration Like US
Europe Tough On Immigration Like US
Europe Tough On Immigration Like US
Chart 26Warning Sign That Russia May Lash Out
Warning Sign That Russia May Lash Out
Warning Sign That Russia May Lash Out
Chart 27Russian Geopolitical Risk Premium Rising
Russian Geopolitical Risk Premium Rising
Russian Geopolitical Risk Premium Rising
The US Democratic Party is also losing faith in engagement with Russia, so while it will need to negotiate on Iran and arms reduction, it will also seek to use sanctions and democracy promotion to undermine Putin’s regime and his leverage over Europe. The Russian geopolitical risk premium will rise, upsetting an otherwise fairly attractive opportunity relative to other emerging markets (Chart 27). Bottom Line: The European democracies have passed a major “stress test” over the past decade. The dollar will fall relative to the euro, in keeping with macro fundamentals, though it will not be supplanted as the leading reserve currency. Europe and the euro will benefit from the change of power in Washington, and a rise in European political risks will still be minor from a global point of view. Russia and the ruble will suffer from a persistent risk premium. Investment Takeaways As the “Year of the Rat” draws to a close, geopolitical risk and global policy uncertainty have come off the boil and safe haven assets have sold off. Yet geopolitical risk will remain elevated in 2021. The secular drivers of the dramatic rise in this risk since 2008 have not been resolved. To play the above themes and views, we are initiating the following strategic investment recommendations: Long developed market equities ex-US – US outperformance over DM has reached extreme levels and the global economic cycle and post-pandemic revival will favor DM-ex-US. Long emerging market equities ex-China – Emerging markets will benefit from a falling dollar and commodity recovery. China has seen the good news but now faces the headwinds outlined above. Long European industrials relative to global – European equities stand to benefit from the change of power in Washington, US-China decoupling, and the global recovery. Long Mexican industrials versus emerging markets – Mexico witnessed the rise of an American protectionist and a landslide election in favor of a populist left-winger. Now it has a new trade deal with the US and the US is diversifying from China, while its ruling party faces a check on its power via midterm elections, and, regardless, has maintained orthodox economic policy. Long Indian equities versus Chinese – Prime Minister Narendra Modi has a single party majority, four years on his political clock, and has recommitted to pro-productivity structural reforms. The nation is taking more concerted action in pursuit of economic development since strategic objectives in South Asia cannot be met without greater dynamism. The US, Japan, Australia, and other countries are looking to develop relations as they diversify from China. Matt Gertken Vice President Geopolitical Strategy mattg@bcaresearch.com
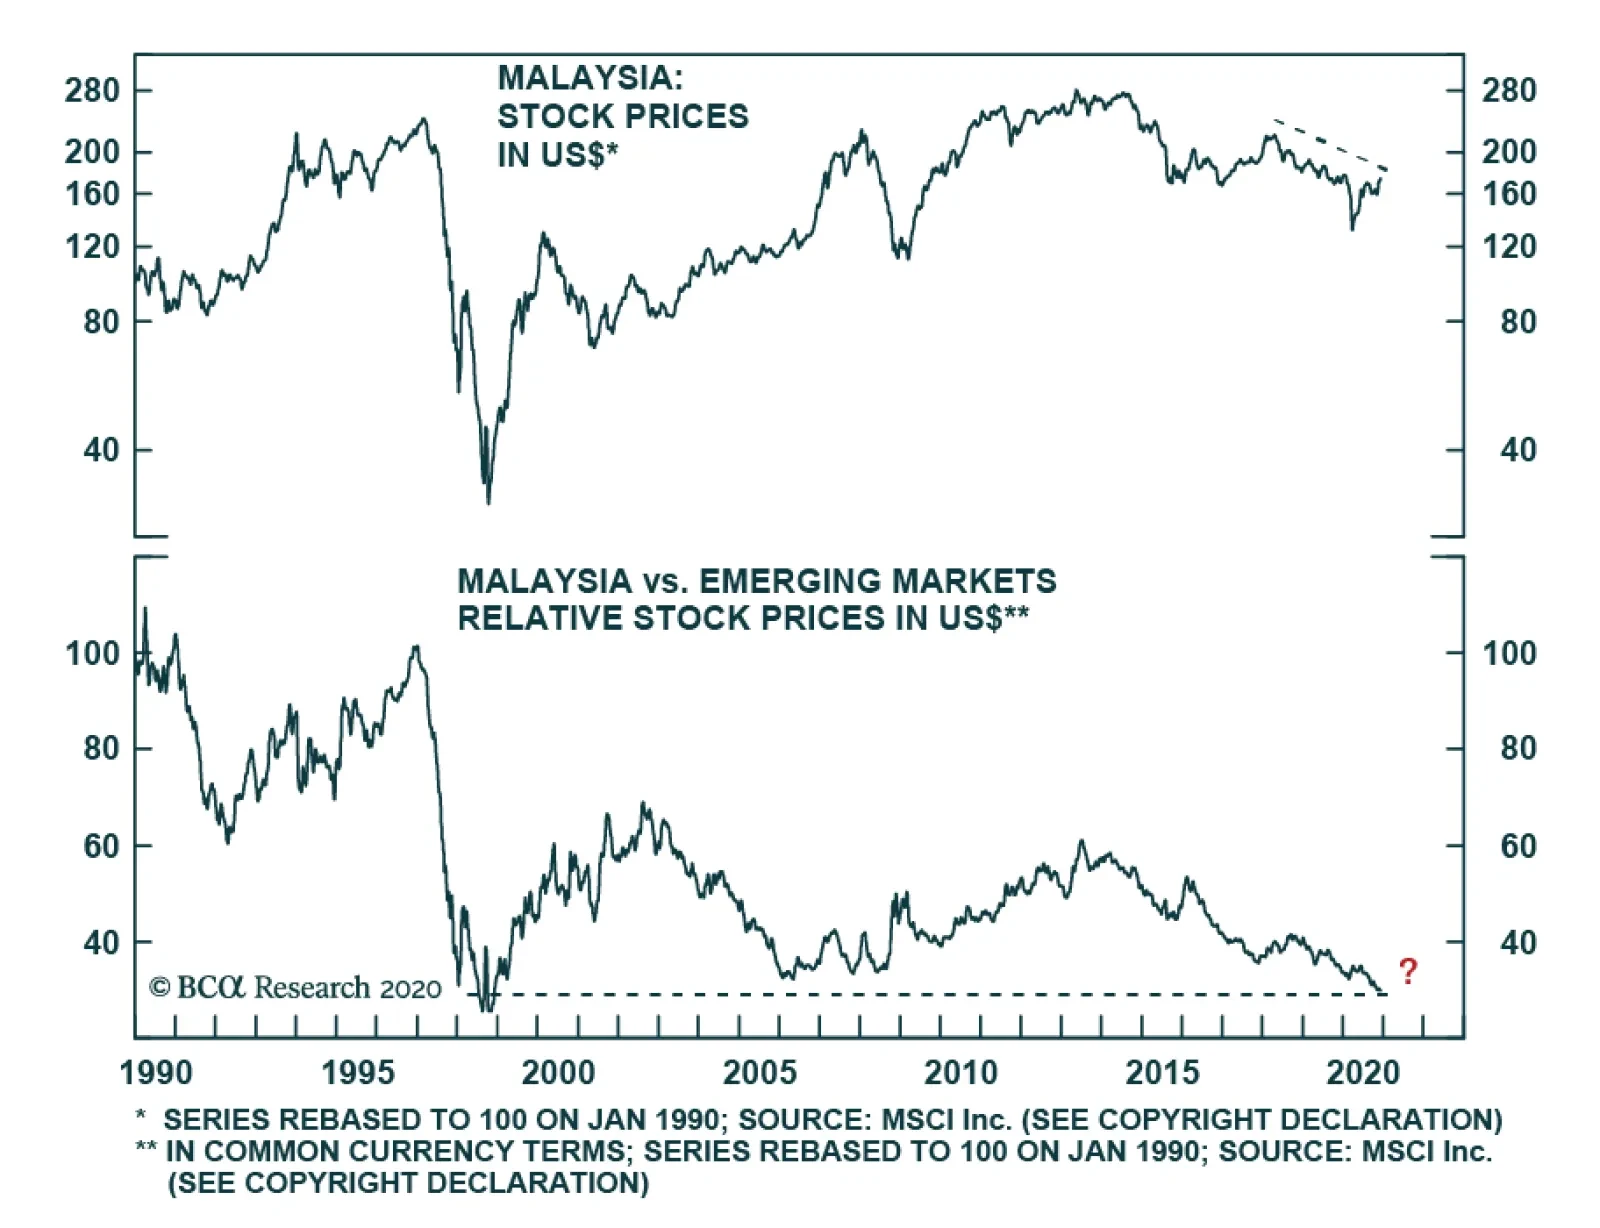
According to BCA Research’s Emerging Markets Strategy service, Malaysian equity underperformance has yet to run its course. Investors should use any rally from oversold positions to downgrade this bourse to underweight. The prolonged bear market in…
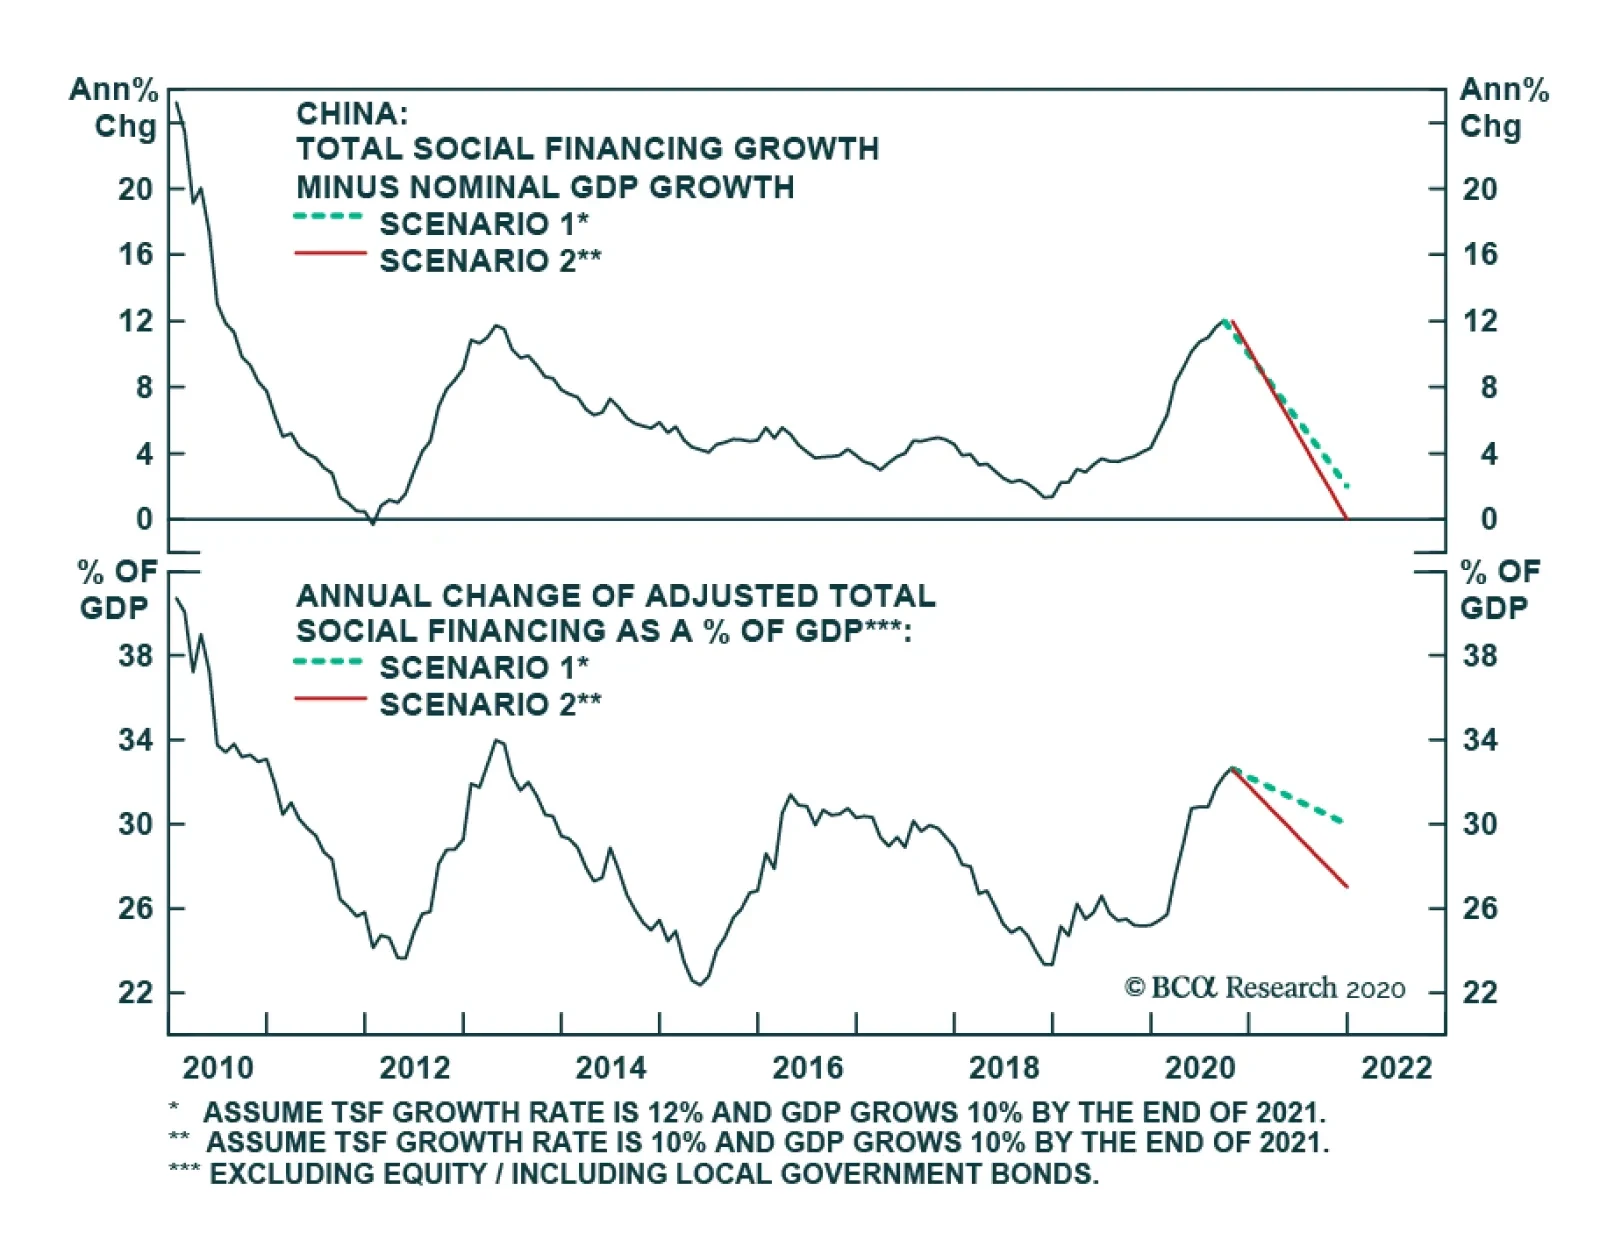
BCA Research’s China Investment Strategy service concludes that Chinese credit growth will slow next year. While policymakers will be data-dependent and the slowdown will be managed, our baseline scenario suggests that the credit impulse will decline by…
Chinese money and credit data surprised to the upside in November. Aggregate financing reaccelerated to CNY2.13 trillion from CNY1.42 trillion, slightly above expectations of CNY2.08 trillion. New loan issuance picked up to CNY1.43 trillion from CNY0.69…
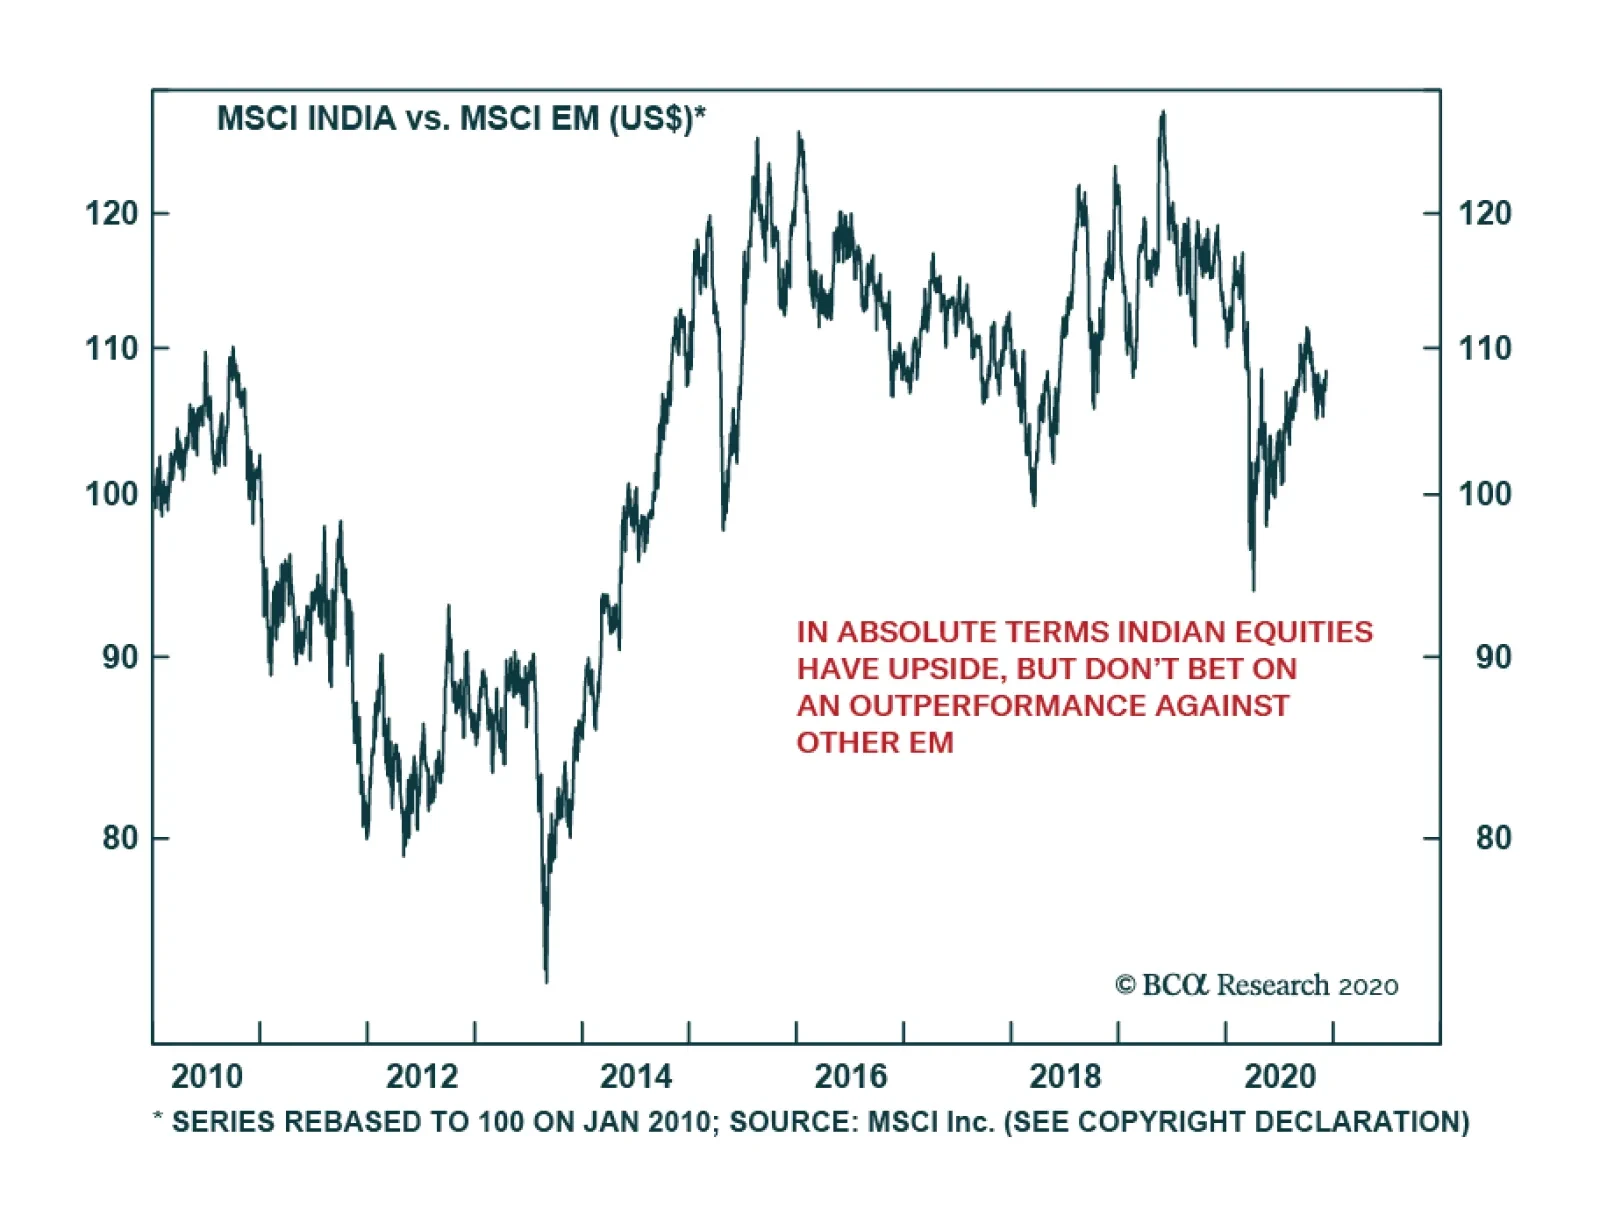
Indian equities have outperformed emerging markets since Q2, rising more than 40% between April and September. However, their relative performance has since slumped. While Indian stocks can rise in absolute terms next year, they are unlikely to…
Dear Client, Next week I will be presenting our 2021 outlook on China at our last webcasts of the year "China 2021 Key Views: Shifting Gears In The New Decade". The webcasts will take place next Wednesday, December 16 at 10:00AM EST (English) and at 9:00 AM Beijing/HK/Taipei time, 12:00 PM Australian Eastern time (Mandarin). In addition, our final weekly publication for 2020 will be on Wednesday, December 16, 2020. Best regards, Jing Sima, China Strategist Highlights Chinese policymakers have shifted their focus from supporting economic growth at all costs to risk management. The trend will likely gather speed in 2021. A deceleration in credit growth next year is almost a certainty. While policymakers will be data dependent and the slowdown will be managed, our baseline scenario suggests a decline of approximately three percentage points in credit impulse in 2021. Chinese stocks could still trend higher in Q1, but prices will falter as the market starts to price in a tighter policy environment and slower profit growth in 2H21. We recommend a tactical neutral stance in both the onshore and offshore markets. We continue to favor Chinese government bonds on a cyclical basis, while gyrations in the onshore corporate bond market will endure for at least the next six months. Feature China’s economic growth momentum has strengthened in recent months, but the nation’s policy stance has also turned more hawkish. As set out in the 14th Five-Year Plan, 2021 will mark the beginning of a new era in which policymakers will switch gears from building a "moderately prosperous society" to becoming a "great modern socialist nation.” The pivot means China’s top officials may tolerate slower economic growth, implement tougher financial and industry regulations, and accelerate structural reforms by allowing more bankruptcies and industry consolidations. As we pointed out in our November 4, 2020 Strategy Report,1 external challenges combined with a stronger domestic leadership will allow China to initiate more meaningful reforms in the next decade than in the past ten years. The reforms will strengthen our structural view on China’s economy and financial assets, but this restructuring will create headwinds for growth in the short to medium term. Therefore, investors should maintain low expectations for Chinese growth and financial asset prices. In 2021, credit growth will decelerate, regulations will be tightened and the “old economy” will moderate in the second half of the year. We will discuss four main themes in our outlook for 2021. Key Theme #1: Macro Policy: Turning More Hawkish Government officials recently stepped up mention of financial risk containment in their public announcements, along with tightened industry regulations. Many market commentators are downplaying the risk of a tighter policy in 2021, citing China’s fragile recovery and a weak global economy. However, the current environment resembles the policy backdrop in late 2016/early 2017 when President Xi Jinping began his financial deleveraging campaign. Our policy framework suggests that China currently faces fewer constraints than in 2016/2017. Thus, the odds are high that the leaders will turn their tough rhetoric into action in the next six to twelve months. Importantly, despite low year-over-year GDP growth, the pace of China’s domestic economic recovery has been faster than in 2016 (Chart 1). The PMIs in both the manufacturing and service sectors have been above the 50 percent boom-bust threshold for nine consecutive months (Chart 2). The laggards in the economy - manufacturing investment and household consumption - have been consistently improving (Chart 3). Bond yields have climbed sharply, but given that corporate bond issuance only accounts for 10% of total social financing, the economic impact from rising corporate bond yields has been more than offset by the large number of government bonds issued (Chart 4). Moreover, the recovery in China’s export sector and current account balance has fared surprisingly well this year, propelled by the global demand for medical supplies and stay-at-home electronic goods (Chart 5). Portfolio inflows also have been strong, fueling a rapid appreciation in the RMB. Chart 1Current Economic Recovery In Better Shape Than In 2016
Current Economic Recovery In Better Shape Than In 2016
Current Economic Recovery In Better Shape Than In 2016
Chart 2PMI Remains Strong
PMI Remains Strong
PMI Remains Strong
Chart 3The Laggards Are Catching Up
The Laggards Are Catching Up
The Laggards Are Catching Up
Chart 4Large Fiscal Stimulus More Than Offset Tighter Monetary Stance
Large Fiscal Stimulus More Than Offset Tighter Monetary Stance
Large Fiscal Stimulus More Than Offset Tighter Monetary Stance
Chart 5Exports Surged
Exports Surged
Exports Surged
Chart 6Chinese Business Cycle Upswing Still Has Steam
Chinese Business Cycle Upswing Still Has Steam
Chinese Business Cycle Upswing Still Has Steam
Looking forward, China’s economic recovery should continue for at least another two quarters due to this year’s credit expansion. Economic activities usually lag the turning points in credit growth by six to nine months (Chart 6). Moreover, headline economic data in 1H21 should be impressive, given the deep slump in domestic output during the same period in 2020. The strengthening economic data will provide China’s leadership with a long-awaited opportunity to focus on risk management. Chart 7A Mild Deflation Will Not Stop Policymakers From Reining In Stimulus
A Mild Deflation Will Not Stop Policymakers From Reining In Stimulus
A Mild Deflation Will Not Stop Policymakers From Reining In Stimulus
Furthermore, the ongoing deflation in the ex-factory prices should not stop the authorities from scaling back policy support. It is worth noting that Xi’s administration doubled down on squeezing shadow banking activity in early 2017 when the CPI was decelerating; the PPI turned positive only due to a low base factor from deep contractions in 2016 (Chart 7). In this vein, as long as the deceleration in both the CPI and PPI does not drastically worsen, we think that policymakers will see less need to reflate the economy. China’s external environment will be less challenging in 2021 than in 2016/2017. Geopolitical tensions are set to ease, at least temporarily, with US President-elect Joe Biden taking office in January. This contrasts with 2016/2017 when President Xi began his financial deleveraging campaign despite increasing strain from then newly-elected President Donald Trump. In hindsight, Xi’s intention may have been to solidify China’s financial sector in preparation for a trade war with the US. The same logic can be applied to our view for next year: Xi will accelerate structure reforms to mitigate risk in the domestic economy before the Biden administration turns its focus to China. We do not think the Communist Party’s 100th anniversary next year will prevent Xi from adopting a hawkish policy bias either. Xi plowed ahead with tightening financial regulations in 2017 even as the ruling Communist Party Committee (CPC) was preparing for a generational leadership reshuffle. In the past two years, the escalation in US-China tensions has strengthened Xi’s power in the CPC and Chinese society. The recent large number of changes in provincial CPC leaders should help Xi to further consolidate his centralized power over local governments. All signs indicate that both the domestic and external landscapes should provide Xi with even more room to undertake reforms in 2021 compared with 2017. Key Theme #2: Stimulus: Deceleration Ahead A deceleration in both credit growth and fiscal support in 2021 is almost a certainty in light of the more hawkish tone by Chinese policymakers. Chart 8 shows that between 2017 and 2019, policymakers came close to stabilizing the macro leverage ratio, but the progress was more than reversed this year due to the pandemic. If policymakers are to allow the increase in the 2021 debt-to-GDP ratio to be within the range of the past four years, then credit may expand at a rate slightly above nominal GDP growth in 2021 (assuming nominal output growth at around 10-11% next year). This scenario, which is our baseline view, is in line with recent statements from the PBoC, which calls for aligning credit growth with nominal GDP in 2021. Our calculation suggests that credit impulse will reach around 29% of next year’s GDP, about 2 to 3 percentage points lower than in 2020 (Chart 9). Chart 8Financial Deleveraging Efforts Erased By COVID-19
Financial Deleveraging Efforts Erased By COVID-19
Financial Deleveraging Efforts Erased By COVID-19
Chart 9Credit Growth Will Decelerate In 2021
Credit Growth Will Decelerate In 2021
Credit Growth Will Decelerate In 2021
Even if the PBoC keeps its official policy rate (i.e. the 7-day interbank repo rate) steady, tightening regulations and repricing credit risk will lead to higher funding costs and a lower appetite for borrowing (Chart 10). Banking regulators have made it clear that some of the one-off easing measures from this year, such as the extension of loan payments (through March 2021) and the delay of macro-prudential assessments (through end-2021), will end next year. Financial institutions will need to slow the pace of their asset balance sheet to comply with these regulations. The regulatory pressures will lead to de facto deleveraging. On the fiscal front, we expect the large budget deficit to remain intact next year. Targeted stimulus through subsidies and tax cuts to support household consumption and small businesses will likely continue. Government spending in the new economy sectors such as semiconductor and tech-related infrastructure will even accelerate. However, the new-economy infrastructure investment is estimated to only account for about 1% of China’s total capital formation, having limited impact on the overall economy.2 Chart 10Higher Funding Costs Will Discourage Corporate Borrowing
Higher Funding Costs Will Discourage Corporate Borrowing
Higher Funding Costs Will Discourage Corporate Borrowing
Chart 11Fiscal Boost For Infrastructure Will Scale Back
2021 Key Views: Shifting Gears In The New Decade
2021 Key Views: Shifting Gears In The New Decade
The proceeds from the large number of the local government special purpose bonds (SPBs) this year will continue to provide tailwinds for infrastructure investment into Q1 2021. However, as the laggards in the economic recovery catch up and government tax revenue improves next year, 2021 quotas for government general and SPBs are likely to be scaled back, reining in expenditure growth in the traditional infrastructure sector (Chart 11). Finally, investors should watch for signs of further hawkishness from China’s leaders at the Central Economic Work Conference this December and the National People’s Congress next March. While we expect policymakers to be data dependent and keep a controlled deceleration in credit and economic growth, risks of a policy overkill cannot be ruled out. A more bearish scenario would be if policymakers decide to fully revert the pace of debt accumulation to the average rate in 2017-2019. In this case, credit impulse in 2021 could fall by more than 5 percentage points compared with 2020 (Scenario 2 in Chart 9 on Page 6). Key Theme #3: Chinese Equities: Position For A Peak In Prices This year’s cyclical (6- to 12 months) call to overweight Chinese stocks within a global portfolio has panned out. In the next 12 months, the risks in Chinese stocks relative to global benchmarks are to the downside; Chinese stocks are vulnerable to setbacks in policy support next year, in both absolute and relative terms. We are closing the following trades: Long MSCI China Index/Short MSCI All Country World Index, for a 1.5% profit; Long MSCI China A Onshore Index/Short MSCI All Country World Index, for a 5.6% profit; Long MSCI China Ex-TMT/Short MSCI Global EX-TMT, for a 0.7% loss; Long Investable Materials/Short broad investable market, for a 5.6% profit; and Long Onshore Materials/Short broad A-Share market, for a 9.3% profit. Chart 12Onshore Equity Market Investors Will Start To Price In Slower Profit Growth In 2H21
Onshore Equity Market Investors Will Start To Price In Slower Profit Growth In 2H21
Onshore Equity Market Investors Will Start To Price In Slower Profit Growth In 2H21
In absolute terms, Chinese onshore stocks on an aggregate level could still inch higher in the next quarter, supported by an improving business and profit cycle (Chart 12). However, in Q2 the market may start to price in slower economic and profit growth in 2H21, erasing the gains from the first quarter. The resilient performance in Chinese stocks against a tightening policy backdrop in 2017 is not likely to repeat itself next year. Current valuations in both China’s onshore and offshore equity markets are higher than at the end of 2016; the price-to-forward earnings ratios in both markets this year have breached the peak levels achieved in 2017 (Chart 13A and 13B). Recovering earnings in the next year will help to digest the currently elevated valuations, i.e. the market has already priced in a substantial post-pandemic profit recovery and investors’ focus will soon switch to a more pessimistic outlook for corporate earnings in 2H21. Chart 13AInvestable Stocks Are More Expensive Now Than Prior To The Last Tightening Cycle
Investable Stocks Are More Expensive Now Than Prior To The Last Tightening Cycle
Investable Stocks Are More Expensive Now Than Prior To The Last Tightening Cycle
Chart 13BA-Shares Are Less Expensive, But Valuations Still Elevated
A-Shares Are Less Expensive, But Valuations Still Elevated
A-Shares Are Less Expensive, But Valuations Still Elevated
Additionally, a property market boom in 2017 boosted the stock performance of real estate developers and related sectors in the supply chain (Chart 14). Policies have already turned much more restrictive in the past month, and deleveraging pressures faced by property developers may weigh on both the sector’s profit growth and stock performance in the next six to twelve months.3 The investable market may not be insulated from tighter domestic policies either. Recent anti-trust regulations in China could create headwinds for mega-cap technology stocks in the near term. Global investors will demand a higher risk premium for China’s tech sector than in the past, as the rich valuations of tech stocks pose more downside risks in a less friendly policy environment (Chart 15). Chart 14Housing Boom In 2017 Also Helped Sustain A Bull Market Back Then
Housing Boom In 2017 Also Helped Sustain A Bull Market Back Then
Housing Boom In 2017 Also Helped Sustain A Bull Market Back Then
Chart 15Valuations In Chinese Tech Stocks Are Elevated
Valuations In Chinese Tech Stocks Are Elevated
Valuations In Chinese Tech Stocks Are Elevated
Chart 16A Policy Overkill Will Significantly Raise Prob Of A Earnings Contraction In 12 Months
A Policy Overkill Will Significantly Raise Prob Of A Earnings Contraction In 12 Months
A Policy Overkill Will Significantly Raise Prob Of A Earnings Contraction In 12 Months
Furthermore, if we presume a policy overkill with more aggressive deleveraging and a further appreciation in the RMB in 2021, our model shows a significant increase in the probability of a profit growth contraction in the next 12 months (Chart 16). In this scenario, selloffs in Chinese stock prices may start in Q1, a risk that cannot be ruled out. In relative terms, Chinese stocks will likely underperform global equities. It is doubtful that the impressive outperformance in Chinese investable stocks throughout 2017 will be repeated in 2021. Chinese equities have benefited from the successful containment of China’s COVID-19 situation in the past year (Chart 17). As breakthroughs in vaccines make the pandemic less threatening to the global economy, Chinese risk assets relative to global ones will become less appealing. Global cyclical stocks, particularly European and Japanese equities, should benefit from improvements in business activities and relatively low valuations (Chart 18). Chart 17Chinese Equities Have Benefited From A Better Control Of COVID-19 This Year...
Chinese Equities Have Benefited From A Better Control Of COVID-19 This Year...
Chinese Equities Have Benefited From A Better Control Of COVID-19 This Year...
Chart 18...But Vaccines Will Give A Boost To Other Markets Next Year
...But Vaccines Will Give A Boost To Other Markets Next Year
...But Vaccines Will Give A Boost To Other Markets Next Year
Importantly, despite strong inflows this year from foreign investors to China’s bond market, foreign portfolio flows into China’s onshore equity market have been less than one-third of that in 2019 (Chart 19). Looking ahead, global investors will be less keen to support Chinese stocks, based on the expectation of tighter onshore liquidity conditions and less buoyant economic growth. Chart 19Foreign Investors Have Not Been So Keen On Chinese Risky Assets This Year
Foreign Investors Have Not Been So Keen On Chinese Risky Assets This Year
Foreign Investors Have Not Been So Keen On Chinese Risky Assets This Year
Everything considered, we anticipate that Chinese A-shares and investable stocks will start descending in Q2 in absolute terms. Their performance relative to global equities will also peak. We recommend a neutral stance on both bourses in the next three months to minimize the downside risks. Key Theme #4: Chinese Bonds: Favor Onshore Government Over Corporate Bonds We continue to recommend a cyclical long position in Chinese government bonds within a global fixed-income portfolio. However, we are closing our long Chinese onshore corporate bond trade for now, for a 17% gain (Chart 20). The large interest rate differential between yields in Chinese bonds versus those in other major developed nations should remain intact into the new year. The yield on the short-duration government notes will continue to trend higher in 1H21, based on the prospect of tighter monetary policy. The yield on long-dated bonds will also escalate as the outlook for the economy continues to improve. We are pricing in a 70BPs increase in the 1-year government bond yield and a 40BPs rise in the yield of the 10-year bond from their current levels (Chart 21). Chart 20Handsome Returns On Chinese Government Bonds
Handsome Returns On Chinese Government Bonds
Handsome Returns On Chinese Government Bonds
Chart 21Our Projections On Government Bond Yield Hikes Next Year
Our Projections On Government Bond Yield Hikes Next Year
Our Projections On Government Bond Yield Hikes Next Year
Chart 22RMB Appreciation Will Continue In 2021, But At A Slower Pace Than This Year
RMB Appreciation Will Continue In 2021, But At A Slower Pace Than This Year
RMB Appreciation Will Continue In 2021, But At A Slower Pace Than This Year
The ongoing appreciation in the RMB will also make Chinese government bonds attractive to global investors. The speed of the gain in the RMB against the US dollar may slow in 2021, but the economic fundamentals do not yet suggest that this trend will reverse. Relative growth and interest rates between China and the US will probably narrow and the geopolitical tailwinds affecting the RMB following the Biden win in the US election will subside in the new year (Chart 22). However, China's strong export sector should still support a record high trade surplus and provide a floor to the Chinese currency against the USD. Chinese onshore corporate bonds have undergone a major shakeout in the domestic corporate bond market in the past month. A slew of state-owned enterprise (SOE) bond defaults has pushed up the yields on the lower-rated corporate bond by nearly 40BPs in one month. In our view, the recent panic selloff in the onshore corporate bond market is overdone and domestic corporate bonds are starting to look attractive on a cyclical basis. Bloomberg data shows that the value of defaulted bonds in the first three quarters of this year is in fact much lower than in the past two years: it dropped to 85Bn RMB from 142Bn RMB defaults in 2019 and the default of 122Bn RMB in 2018. Bondholders have been spooked by the fact that the Chinese local government and top financial regulators allow defaults by state-backed firms. The policy change to shift risk to the markets should result in a continuation of risk-off sentiment among investors, inducing selling pressure in the domestic corporate bond market in the near term. However, on a cyclical basis, such selloffs could present good buying opportunities. While we expect China’s onshore corporate bond defaults to be higher in 2021, the default rate remains below the global average (Chart 23). As we pointed out in our previous report, since 2017 Chinese onshore corporate bonds have been priced with a significantly higher risk premium than their global peers, which in our view is overdone (Chart 24). Chart 23Chinese Corporate Bond Default Rate Lower Than Global Average...
Chinese Corporate Bond Default Rate Lower Than Global Average...
Chinese Corporate Bond Default Rate Lower Than Global Average...
Chart 24...And Much Lower Than Their Risk Premiums Imply
...And Much Lower Than Their Risk Premiums Imply
...And Much Lower Than Their Risk Premiums Imply
Chart 25Chinese Corporate Bonds Can Bring Better Returns Once The Peak Intensity In Policy Tightening Passes
Chinese Corporate Bonds Can Bring Better Returns Once The Peak Intensity In Policy Tightening Passes
Chinese Corporate Bonds Can Bring Better Returns Once The Peak Intensity In Policy Tightening Passes
In addition, Chart 25 shows that the total returns on Chinese onshore corporate bonds briefly declined in 2017 when the government’s financial de-risking efforts intensified. It sequentially rebounded in 2018, suggesting a turnaround in investors’ sentiment after the first cleanup wave in the corporate sector. As such, while we do not favor Chinese onshore corporate bonds in the next six months, on a 12-month horizon, conditions could become more favorable to initiate a long position. Jing Sima China Strategist jings@bcaresearch.com Footnotes 1Please see China Investment Strategy Report "The 14th Five-Year Plan: Meaningful Transformations Ahead," dated November 4, 2020, available at cis.bcaresearch.com 2Please see China Investment Strategy Special Report "Chinese Economic Stimulus: How Much For Infrastructure And The Property Market?" dated March 25, 2020, available at cis.bcaresearch.com 3Please see China Investment Strategy Special Report "China: The Implications Of Deleveraging By Property Developers," dated October 21, 2020, available at cis.bcaresearch.com Cyclical Investment Stance Equity Sector Recommendations
China’s trade balance swelled to a record $75.4 billion in November, significantly surpassing expectations of $53.8 billion. This was mainly explained by the surge in exports which registered a monthly all-time high, rising 21.1% year-on-year (y/y) in USD…
Our semi-annual virtual meeting with the long-standing client Ms. Mea took place on December 1. Given it is the end of the year, Ms. Mea inquired about our strategies for 2021 and reviewed the evolution of our views during 2020. Below is a transcript of our discussion, which we hope will help clients better grasp our views and analysis. Chart 1EM Relative Equity Performance And EM Currencies Versus DM ex-US
EM Relative Equity Performance And EM Currencies Versus DM ex-US
EM Relative Equity Performance And EM Currencies Versus DM ex-US
Ms. Mea: Before we get to investment recommendations for next year, let’s review which of your views have worked in 2020 and which have not. Answer: From a big picture perspective, we went from being very negative on EM over the last decade to being neutral on EM risk assets in both absolute terms and relative to DM peers. Since April, we have been waiting for a pullback to go long and overweight EM, but a meaningful setback has not materialized. That said, although EM risk assets and currencies have rallied substantially in absolute terms, they have not outperformed their DM peers, as shown in Chart 1. Concerning the evolution of our strategy, as you might recall, we had to chase EM stocks higher late last year after the trade deal between the US and China created euphoria in financial markets, pushing EM assets higher. But even then, we did not change our bullish view on the US dollar and continued recommending an underweight allocation in EM versus DM in global equity and credit portfolios. In our January 23, 2020 report we contended that the risk premium in global markets was extremely low and that risk assets were extremely overbought. The following week, as news of the COVID-19 outbreak in China emerged, we recommended closing the long position in EM stocks. On February 20, we asserted that odds of a breakdown were substantial and recommended shorting EM stocks outright. We closed this position on March 19 with a substantial gain. On March 26, we argued that it was too late to sell but too early to buy. In retrospect, the latter part of this assessment was incorrect. Then, on April 23, we recommended going long duration in EM local currency bonds or buying domestic EM bonds while hedging currency risk. We recommended receiving 10-year swap rates in several EM countries. We changed our long-standing strategic bullish stance on the US dollar to bearish on July 9. Simultaneously, we closed our shorts in various EM currencies versus the greenback and recommended shorting many of these EM currencies versus an equal-weighted basket of the euro, CHF and JPY (please refer to the bottom panel of Chart 1). We upgraded EM credit from underweight to neutral on June 4 and lifted the allocation to EM stocks from underweight to neutral on July 30. EM relative equity performance versus DM has been in a broad trading range for the whole of 2020 (please refer to the top panel of Chart 1). Chart 2Facing Technical Resistance
Facing Technical Resistance
Facing Technical Resistance
Ms. Mea: What is your EM outlook going into 2021? Answer: The odds of a major breakout in EM equities, currencies and fixed-income markets have risen, yet there could be a shakeout before the breakout. Both EM equity and the global ex-US equity indexes have risen to their previous highs which proved to be a formidable resistance level (Chart 2). The main reasons to expect a major breakout in EM and global ex-US share prices are as follows: First, the global economy could experience periodic setbacks, but things cannot be worse than they were during the pandemic-induced lockdowns in early 2020. The deployment of vaccines is likely to improve global economic conditions in 2021, especially in hard hit services sectors. Second, asset purchases by major central banks around the world have effectively removed many securities (mostly government bonds) from the marketplace while creating an enormous supply of money (Chart 3). The upshot is that too much money is chasing fewer assets. Chart 4 illustrates this phenomenon in the case of US dollar securities. Cash in both US institutional and retail money market funds is still elevated. As a share of market value of US dollar denominated equities and bonds, the amount in US money market funds has declined but it is still above its February lows. Provided that US money market rates are zero, one can make the case for more flows from money markets into both equities and bonds. Chart 3Booming Money Supply Worldwide
Booming MoneySupply Worldwide
Booming MoneySupply Worldwide
Chart 4How Much Cash On-SidelinesIs There Left In The US?
How Much Cash On-SidelinesIs There Left In The US?
How Much Cash On-SidelinesIs There Left In The US?
Finally, odds that EM equities will break above the trading range they have been in over the last 10 years have increased. As we discussed in our previous reports, EM ex-China, Korea and Taiwan have been facing hard budget constraints due to limited fiscal stimulus packages, a breakdown in their monetary transmission mechanism, and massive foreign capital outflows in early 2020. These harsh conditions have forced many companies to restructure to boost their efficiency. The banking system has been recognizing and provisioning for bad assets. Finally, some governments have adopted difficult structural reforms. These could be sowing seeds of structural transformation in these economies, in turn producing a secular bull market in their equities and currencies. As was discussed in a recent Country In-Depth report, India is one example where structural reforms stand to have a positive effect on its long-term outlook. Indonesia, Colombia, Mexico, and Brazil are other candidates that could undergo similar transformations. In a nutshell, unless the global economy craters – which has low odds – one can envision a scenario in which risk assets continue marching higher. Ms. Mea: However, you mentioned that there could be a shakeout before the breakout. What makes you say that? Answer: A potential shakeout before the breakout may occur due to the following three peaks: Peak investor sentiment: Investor sentiment is very elevated and risk assets are overbought. The ZEW global growth expectations index (a survey of analysts on DM economies) has rolled over after reaching an all-time high (Chart 5, top panel). The Sentix survey of investor future expectations has reached an apex (Chart 5, bottom panel). Importantly, net long positions in copper and net bullish sentiment on copper are at their previous highs (Chart 6). This is a plausible proxy for investor sentiment on both China and global growth. Chart 5Investor Expectations Are Elevated Edited
Investor Expectations Are ElevatedEdited
Investor Expectations Are ElevatedEdited
Chart 6Investors Are Super Bullish On And Very Long Copper
Investors Are Super Bullish On And Very Long Copper
Investors Are Super Bullish On And Very Long Copper
Chart 7Investors Are Bullish On US Equities
Investors Are Bullish On US Equities
Investors Are Bullish On US Equities
Finally, sentiment among US equity investors is also elevated (Chart 7). Peak stimulus: In China, both credit and fiscal stimulus will likely peak in Q4 2020, as demonstrated in Charts 8 and 9. The US and the euro area will experience a negative fiscal thrust in 2021 equal to 7.4% and 3.8% of GDP, respectively. A new fiscal package worth $1.5 trillion is needed in order for the US fiscal thrust to be neutral. As Republicans are likely to retain control of the Senate, even after Georgia’s Senate election vote on January 5, 2021, a new fiscal package larger than $500-750 billion is unlikely. On the whole, many countries in DM and EM are experiencing peak stimulus in 2020. Chart 8China: Peak Credit Stimulus
China: Peak Credit Stimulus
China: Peak Credit Stimulus
Chart 9China: Peak Fiscal Stimulus
China: Peak Fiscal Stimulus
China: Peak Fiscal Stimulus
Peak manufacturing growth: We should differentiate between the top in a business cycle and an end in growth acceleration. As far as global manufacturing is concerned, we are likely currently experiencing growth acceleration at its height. Global manufacturing will continue to expand, but at a slower rate. Share prices could either rally or correct when growth begins to decelerate. The stock market reaction is contingent upon how overbought and how expensive equity prices are. The top panel of Chart 10 illustrates that the tops in the US ISM manufacturing new orders-to-inventory ratio have historically marked setbacks in global cyclical stocks. Similarly, EM share prices and industrial metals fluctuate with the EM and China manufacturing PMI (Chart 10, middle and bottom panels). Having risen sharply to very elevated levels, odds are that global and China manufacturing PMIs are probably topping out. Granted, these are diffusion indexes, and declines/rollovers in global manufacturing PMIs do not necessarily imply that a recession is on the horizon. Rather, they signal the end of the acceleration phase in a cycle. Bottom Line: Given how overbought and expensive they are, share prices might react negatively to peak stimulus. Ms. Mea: Your outlook on the Chinese economy has become more nuanced since the spring. How do you see China’s business cycle and financial markets evolving? Answer: We upgraded our view on the Chinese business cycle in late May after it had become apparent that China had again injected enormous credit and fiscal stimulus into the economy. On June 18, we upgraded Chinese stocks to overweight within an EM equity portfolio. We continue to expect decent growth numbers and reviving corporate profits in most of H1 2021. That said, authorities have been tightening monetary policy since May. Policymakers realize that China’s credit excesses have become even larger and they have been proactive in policy tightening to rein in leverage and speculative activities. The central bank has siphoned off banks’ excess reserves causing interbank rates to rise considerably (Chart 11). With a time lag, money/credit will decelerate and the business cycle will follow. We expect the Chinese business cycle to crest around the middle of 2021. Chart 10Cyclical Assets Fluctuate With Manufacturing PMIs
Cyclical Assets Fluctuate With Manufacturing PMIs
Cyclical Assets Fluctuate With Manufacturing PMIs
Chart 11China: Liquidity Tightening Works With A Time Lag
China: Liquidity Tightening Works With A Time Lag
China: Liquidity Tightening Works With A Time Lag
The recent shakeout in the onshore corporate bond market will lead to a reduction in corporate bond issuance as investors now require higher yields to finance SOEs. In addition, banks and non-bank financial institutions have to comply with the asset management regulation by the end of 2021. This will restrict banks’ ability to expand their balance sheets and curb NBFI risk appetite. All in all, credit-sensitive sectors like capital spending and the property market will decelerate considerably in H2 2021. Provided that they make up a large share in the mainland economy, overall income growth will also slump. Concerning financial markets, if there is a selloff in Chinese stocks in the coming weeks or months, it will give way to another upleg later in H1 2021. Ms. Mea: Going forward, what will be the driving forces of EM risk assets and how will they shape up? Answer: EM risk assets – equities, credit markets and high-yielding domestic bonds – are by and large driven by three factors: (1) China’s import and commodities cycles (which often move in tandem); (2) domestic fundamentals in EM ex-China; and (3) sharp swings in US growth and the S&P500. (1) We elaborated on the intricacies of the Chinese business cycle above and will now offer a few insights on commodities prices. There has been a broad-based recovery in Chinese demand for commodities and various commodities prices have risen substantially. Nevertheless, the outlook for commodities prices is less certain going forward. Chart 12China's Booming Copper Imports Imply Inventory Accumulation
China's Booming Copper Imports Imply Inventory Accumulation
China's Booming Copper Imports Imply Inventory Accumulation
In particular, copper prices have surged but the rally is only partially attributable to recovering real demand in China. Other forces, namely inventory restocking in China and financial (investor) demand, have been responsible for the massive rise in copper prices. The mainland’s imports of copper and copper products have boomed since spring, growing at a rate of 70-80% from a year ago. Meanwhile, the recovery in Chinese infrastructure investment in electricity, water, and gas – which are the largest consumers of copper – has been considerable but not extraordinary (Chart 12). This surge leads us to infer that a sizable inventory restocking cycle has been taking place in China since last spring. Such large inventory accumulation has likely been prompted by the easy availability of credit and rising copper prices. Besides, investors hold record net long positions in copper on the New York Mercantile Exchange (refer to Chart 6). In brief, as we discussed in detail in the Special Report from November 25, Chinese purchases of copper will decline even as its real demand for copper continues to expand. Oil prices are at risk of excess supply as many producers are reluctant to continue suppressing their crude output. Saudi Arabia has been trying hard to limit OPEC+ production. However, it will be increasingly difficult for it to do so. The basis is that many producers are naturally looking to maximize the net present value of cash flow from their oil reserves. Due to inflation, $45 today is worth more than $45 in five years. As and when oil producers accept that global demand for oil will stagnate as the world switches to more environmentally friendly sources of energy, they will have an incentive to produce and sell as much crude as possible at current prices. Chart 13EM Sovereign Credit Spreads (Shown Inverted) Fluctuate With Commodities Prices
EM Sovereign Credit Spreads (Shown Inverted) Fluctuate With Commodities Prices
EM Sovereign Credit Spreads (Shown Inverted) Fluctuate With Commodities Prices
If Saudis lose control over output, they will ramp up their own production to increase their market share. Crude prices will plunge anew. The timing is uncertain, but we expect it to happen sooner rather than later. Overall, even though China’s business cycle recovery will continue in H1 2021, prices for certain important commodities like oil and copper will likely struggle. Setbacks in commodities prices will have ramifications for financial markets in resource-producing EM countries. EM currencies, as well as their sovereign spreads, correlate with commodities prices (Chart 13). (2) Domestic demand in EM ex-China, Korea and Taiwan will gradually improve but from a very low point. Many developing countries still face major hurdles, including banking systems that are struggling with non-performing loans, a looming fiscal drag, and a lack of control over the pandemic. Further, EM outside North Asia will lag behind advanced countries in procuring and deploying COVID-19 vaccines. Consequently, consumer and business confidence will be slow to recover in these countries, and their business cycle revival will continue to trail that of North Asia (China, Korea and Taiwan) and advanced economies. (3) Finally, any shakeout in the S&P500 will reverberate through EM. Having rallied considerably, North Asian equity and currency markets have already priced in a great deal of good news. In EM ex-North Asia, the level of economic activity, albeit reviving, remains low. This makes these EM ex-North Asian financial markets very sensitive to fluctuations in global/US financial markets. Chart 14EM Equities Have Been A Low-Beta Play On The S&P500
EM Equities Have Been A Low-Beta Play On The S&P500
EM Equities Have Been A Low-Beta Play On The S&P500
The resilience of US equity and credit markets in recent months in the face of numerous challenges has surprised us. US share prices and credit markets have not corrected meaningfully despite (1) the third wave of COVID-19 which has resulted in partial lockdowns and a deterioration in consumer sentiment; (2) the lack of a second fiscal stimulus package and (3) uncertainty surrounding the presidential elections. In retrospect, investors have been willing to buy any small dip. Interestingly, in the past three years, EM share prices outperformed DM share prices when the S&P500 sold off and underperformed when US stocks rallied (Chart 14). EM versus DM relative share prices are shown inverted on this chart. This reveals that EM stocks are not a high beta on the S&P 500 and rising US equity markets do not guarantee that EM share prices will outperform their DM peers. Overall, the outlook for EM risk assets is convoluted, warranting a neutral stance for now both in absolute terms and relative to DM. Chart 15The US Dollar Is Oversold
The US Dollar Is Oversold
The US Dollar Is Oversold
Ms. Mea: Where and how does the US dollar enter your analysis? Answer: The dynamics between EM and the US dollar is push-pull in nature, i.e., the causality runs both ways. EM fundamentals – that could be broadly defined as return on capital in these economies – drive their exchange rates’ trends versus the US dollar. Further, US dollar trends are also shaped by several global macro forces, including the global business cycle. The US fiscal position and monetary policy stance also drive fluctuations in the value of the greenback. Over the next several years, the US dollar will likely be in a bear market because US inflation will rise and the Federal Reserve will fall behind the inflation curve. US real rates will remain negative, which will continue to undermine the dollar’s value. All that said, the US dollar has become very oversold and investor sentiment is bearish on the greenback (Chart 15). From a contrarian perspective, the dollar might be set up for a countertrend rebound. Interestingly, after the 2016 US elections, the US dollar rallied strongly for several weeks before selling off violently. It seems that the broad trade-weighted dollar is now following a reverse pattern (Chart 16). The US dollar in 2016 is shown inverted in this chart. The greenback was selling off before the 2020 US elections and has continued weakening since. If this reverse pattern were to play out, the US dollar will near its bottom soon and then stage a playable rebound. Chart 16The US Dollar Before And After 2016 And 2020 Presidential Elections
The US Dollar Before And After 2016 And 2020 Presidential Elections
The US Dollar Before And After 2016 And 2020 Presidential Elections
Chart 17EM Stocks Are Cheap If The Structural EPS Trend Is Up
EM Stocks Are Cheap If The Structural EPS Trend Is Up
EM Stocks Are Cheap If The Structural EPS Trend Is Up
In short, a long-term bear market but near-term rebound in the US dollar is consistent with our view of a shakeout before a breakout for EM equities and risk assets. Ms. Mea: What about EM equity and currency valuations? Are they not still cheap despite their recent rally? Answer: From a secular perspective, EM equities appear modestly cheap as illustrated by our cyclically-adjusted P/E (CAPE) ratio (Chart 17). However, it is vital to realize that this CAPE valuation model assumes that EPS (earnings per share) in real (inflation-adjusted) US dollar terms will revert to its long-term trend sooner rather than later (Chart 17, bottom panel). There is a lot of uncertainty regarding the structural trend in EM EPS. For the past decade – and therefore well before the pandemic – EM EPS in nominal US dollar terms has been fluctuating in a wide range (Chart 18). Not surprisingly, EM share prices have been flat for the past ten years. Further, EM EPS has massively underperformed US EPS in local currency terms for the past ten years (Chart 19). Consistently, EM share prices have underperformed the S&P 500 even in local currency terms. Chart 18EM EPS: No Growth For 10 years
EM EPS: No Growth For 10 years
EM EPS: No Growth For 10 years
Chart 19EM Versus US: Relative Stock Prices And Relative EPS
EM Versus US: Relative Stock Prices And Relative EPS
EM Versus US: Relative Stock Prices And Relative EPS
As for EM currencies, the aggregate real effective exchange rate of EM ex-China, Korea, Taiwan currencies suggests that they are cheap (Chart 20). Overall, to argue that EM stocks are cheap, one should be confident that EM EPS in real (inflation-adjusted) USD terms will be expanding in the years to come (Chart 17, bottom panel). While some EM economies have undertaken some restructuring, there is currently no strong evidence to suggest that EM EPS will be in a structural uptrend. From a cyclical perspective, EM EPS will certainly be recovering in 2021 (Chart 21). However, a notable chunk of this profit recovery has already been largely priced in. Chart 20EM ex-China, Korea, Taiwan: Currency Valuations
EM ex-China, Korea, Taiwan: Currency Valuations
EM ex-China, Korea, Taiwan: Currency Valuations
Chart 21EM Profits Will Recover In 2021
EM Profits Will Recover In 2021
EM Profits Will Recover In 2021
To sum up, a bet on EM share prices breaking out above their decade-long trading range implies betting on EM EPS entering a period of structural growth. Over the past ten years, EM companies have not delivered the secular growth needed to warrant higher equity multiples. We are open to the idea that structural reforms carried out in several nations will allow for higher productivity, income and profit growth. However, it is still too early to jump to that conclusion. Chart 22Will Asian Markets Finally Break Out?
Will Asian Markets Finally Break Out?
Will Asian Markets Finally Break Out?
Ms. Mea: Where in your analysis and strategy might you be wrong? Answer: The key risks to our view are twofold: First, FOMO (fear of missing out) on the part of investors continues to propel EM risk assets higher while either their fundamentals remain mediocre or they are already very expensive. As we have shown in Chart 4, there is still a lot of US dollar cash sitting in US money market funds and these could feed the EM rally, preventing the materialization of a shakeout. Second, we might be late to recognize structural shifts in certain EM economies and, might therefore miss breakouts in those bourses. Notably, there is no single EM equity market that has clearly broken above its previous highs (Chart 22). Ms. Mea: What are your overweights and underweights for equity, currency and fixed-income portfolios? Answer: For an EM equity portfolio, our strong conviction overweights have been and remain China, Korea and Mexico. Chart 23 shows the performance of our fully-invested EM equity portfolio based on our recommended country allocation. It has outperformed the EM MSCI equity benchmark by 3.7% in 2020 and by 74% since its initiation in May 2008. The latter translates into a 4.7% CAGR outperformance versus the EM MSCI equity benchmark in 10.5 years. Critically, this outperformance has been achieved with very low volatility and small drawdowns. Chart 23Performance Of Our EM Equity Country Allocation Portfolio (Country Recommendations)
Performance Of Our EM Equity Country Allocation Portfolio (Country Recommendations)
Performance Of Our EM Equity Country Allocation Portfolio (Country Recommendations)
As for EM local bonds, we continue to recommend receiving ten-year swap rates in Korea, Malaysia, Russia, Mexico, Colombia, South Africa, China and India. We are looking for a setback in their currencies to switch to holding cash bonds, i.e., without hedging currency risk. Among EM currencies, our short basket consists of BRL, CLP, ZAR, TRY and IDR while our favored ones have been MXN, RUB, CZK, INR THB and SGD. All these country recommendations and positions as well as the one in the EM sovereign credit space (US dollar bonds) are always presented at the end of our reports (please refer to the following pages). Arthur Budaghyan Chief Emerging Markets Strategist arthurb@bcaresearch.com Footnotes Equities Recommendations Currencies, Credit And Fixed-Income Recommendations
Although the onshore corporate bond market is under stress, BCA Research’s China Investment Strategy service concludes that it will not be the force that buckles Chinese equities. Recent bond payment defaults by several SOEs have led to a spike in onshore…