Emerging Markets

The strength in China’s post-pandemic policy support likely peaked in October. Interbank rates have normalized to their pre-pandemic levels and bond yields have risen sharply since May. The renewed emphasis on financial de-risking is evident in China’s recent anti-trust regulations against domestic leading online retail and lending providers, rising corporate bond defaults and readouts from recent PBoC meetings. In the near term, US President-elect Joe Biden will focus on reviving the economy and this may restore some balance to the Sino-US trade relationship. Additionally, China’s economic recovery is on track. The odds are rising that next year the Chinese leadership will accelerate structural reforms and the de-risking campaign, which began in 2017 but was delayed due to the US-China trade war and the COVID pandemic. These policy actions will improve China’s productivity growth and industrial competitiveness in the medium to long term, but they will create short-term headwinds to the economic recovery and the stock market’s performance. The uptrend in China’s business cycle will likely be maintained for another two quarters, propelled by the momentum from this year's massive stimulus. Historically, turning points in China’s business activities lag credit cycles by six to nine months. Given that China’s policy support apexed in Q4 this year, a peak in the country’s business cycle will probably be reached by mid-2021. Qingyun Xu, CFA Senior Analyst qingyunx@bcaresearch.com Jing Sima China Strategist jings@bcaresearch.com Below is a set of market relevant charts along with our observations: Monetary policy has tightened, but fiscal spending by local governments should pick up in the next two quarters to support the ongoing business cycle expansion into H1 2021. Fiscal spending has been constrained due to shortfalls in revenues this year, despite record sales of special-purpose bonds.1 Government expenditures will gain strength as local governments’ tax revenues start to improve and the proceeds from bond sales are distributed. Chart 1Credit Impulse Has Peaked...
Credit Impulse Has Peaked...
Credit Impulse Has Peaked...
Chart 3Business Cycle Expansion To Continue In 1H21
Business Cycle Expansion To Continue In 1H21
Business Cycle Expansion To Continue In 1H21
Chart 2...But Fiscal Spending Should Pick Up
...But Fiscal Spending Should Pick Up
...But Fiscal Spending Should Pick Up
Part of the buildup in this year’s industrial inventory is due to the solid recovery in domestic demand and proactive restocking by manufacturers. However, the pace of inventory pileup this year has been the highest since 2014, while infrastructure investment and industrial output growth have barely recovered to pre-pandemic levels. The rapid expansion in industrial inventory may be the result of cheap credit and commodity prices and could lead to a period of destocking and slower imports of raw materials in Q1 2021. Chart 4Industrial Inventory Has Run Ahead Of Economic Recovery...
Industrial Inventory Has Run Ahead Of Economic Recovery...
Industrial Inventory Has Run Ahead Of Economic Recovery...
Chart 5...Propelled By Solid Recovery And Cheap Credit
...Propelled By Solid Recovery And Cheap Credit
...Propelled By Solid Recovery And Cheap Credit
Core CPI has reached its weakest level in more than a decade, while the PPI remains in negative territory. A delayed recovery in the household consumption and services sector has been disinflationary to core CPI along with the PPI’s consumer goods price subcomponent.2 Historically, when the growth rate in the PPI outpaces that in the CPI, industrial output and profits tend to improve even if the PPI is in contraction. However, a deflationary PPI is the result of depressed demand for both industrial products and household goods. Hence, neither the widening gap between the PPI and CPI nor the improvement in industrial profits can be sustained on the back of falling consumer prices. Credit impulse tends to lead an increase in both the PPI and CPI by six to nine months. Improving service sector activities and rebounding energy and commodity prices will also be reflationary to both the CPI and the PPI. Meanwhile, the peaking credit impulse coupled with tighter domestic monetary policy and a rapidly rising RMB will limit the upside in both the consumer and producer price indexes. Chart 6Rising Deflation Risks
Rising Deflation Risks
Rising Deflation Risks
Chart 7PPI Has Been Dragged Down By Its Consumer Goods Price Component
PPI Has Been Dragged Down By Its Consumer Goods Price Component
PPI Has Been Dragged Down By Its Consumer Goods Price Component
Chart 8Improvement In Industrial Profits Is Unsustainable In A Deflationary Environment
Improvement In Industrial Profits Is Unsustainable In A Deflationary Environment
Improvement In Industrial Profits Is Unsustainable In A Deflationary Environment
Chart 9While The Economic Recovery Should Support Prices...
While The Economic Recovery Should Support Prices...
While The Economic Recovery Should Support Prices...
Chart 10...A Rapidly Rising RMB Will Limit The Upside In Producer Prices Next Year
...A Rapidly Rising RMB Will Limit The Upside In Producer Prices Next Year
...A Rapidly Rising RMB Will Limit The Upside In Producer Prices Next Year
Retail sales growth further strengthened in October. However, despite a sharp rebound in auto sales, other consumption segments, such as catering, tourism and consumer durable goods, remain sluggish. Household disposable income and employment have improved from troughs earlier this year, but both continue to lag behind the recovery in the industrial sector. The sluggish household sector has prompted Chinese leaders to take actions. In a State Council executive meeting on November 18, Primer Li Keqiang pledged to promote the consumption of home appliances, catering, and automobiles.3 Stocks of consumer goods and automakers rallied following the pro-consumption stimulus announcement. We continue to favor consumer discretionary stocks in both onshore and offshore markets. Even though the valuations in both sectors are elevated compared with the broad market, their earnings outlook also shows a notable improvement. In the next 6 months, targeted pro-consumption stimulus policies should further boost investors’ sentiment as well as profits in these sectors. Chart 11The Ex-Auto Retail Sales Remain Sluggish
The Ex-Auto Retail Sales Remain Sluggish
The Ex-Auto Retail Sales Remain Sluggish
Chart 12Improving Household Income And Employment Will Support Consumption
Improving Household Income And Employment Will Support Consumption
Improving Household Income And Employment Will Support Consumption
Chart 13Policy Support Will Continue Boosting Auto Sales...
Policy Support Will Continue Boosting Auto Sales...
Policy Support Will Continue Boosting Auto Sales...
Chart 14...And Promote NEV Sales
...And Promote NEV Sales
...And Promote NEV Sales
Chart 15Auto Sector's Outperformance Should Continue
Auto Sector's Outperformance Should Continue
Auto Sector's Outperformance Should Continue
Chart 16Consumer Discretionary Sector Will Also Benefit From More Policy Support
Consumer Discretionary Sector Will Also Benefit From More Policy Support
Consumer Discretionary Sector Will Also Benefit From More Policy Support
Chart 17Housing Demand In Second- And Third-Tier Cities Has Already Rolled Over
Housing Demand In Second- And Third-Tier Cities Has Already Rolled Over
Housing Demand In Second- And Third-Tier Cities Has Already Rolled Over
In the past four weeks, the high-frequency data show that momentum in housing demand in second- and third-tier cities has quickly abated. Moreover, bank lending to property developers has rolled over, reflecting tighter financing regulations and pressure to deleverage in the property sector. Growth has flattened in medium- and long-term consumer loans while the propensity for home purchase has ticked up slightly. This divergence may be a sign that demand for real estate has not softened, but that home buyers are waiting for more discounts from property developers. As such, the rebound in floor space started in October should be short-lived as property developers’ profit margins continue to narrow and their financing remains constrained. We expect aggregate home sales growth to decelerate slightly in 1H21 from the past six months. However, real estate developers need to complete their existing projects, which will support construction activities into H1 next year. Chart 18Home Buyers May Be Expecting More Home Price Discounts Ahead
Home Buyers May Be Expecting More Home Price Discounts Ahead
Home Buyers May Be Expecting More Home Price Discounts Ahead
Chart 19Financing Constrains Will Limit Investments In New Building Projects
Financing Constrains Will Limit Investments In New Building Projects
Financing Constrains Will Limit Investments In New Building Projects
This year’s strong outperformance in China’s offshore equity prices has been driven by the TMT sector’s stocks (Information Technology, Media & Entertainment, and Internet & Direct Marketing Retail). Since October, however, Chinese stocks excluding the TMT sector have also started to outperform the global benchmarks. Moreover, domestic cyclicals, which do not feature some of China’s leading tech companies such as Alibaba and Tencent, have outpaced onshore defensive stocks. These developments indicate that as the upswing in China’s business cycle continues to strengthen, the outperformance in China’s ex-TMT stocks will likely be sustained into early 2021. Within cyclical sectors, we continue to favor the materials and consumer discretionary sectors aimed at policy dividends and a rebound in commodity prices. Chart 20China's Ex-TMT Stocks Starting To Outperform Global
China's Ex-TMT Stocks Starting To Outperform Global
China's Ex-TMT Stocks Starting To Outperform Global
Chart 21Domestic Cyclicals Are Now Breaking Out Relative To Defensives
Domestic Cyclicals Are Now Breaking Out Relative To Defensives
Domestic Cyclicals Are Now Breaking Out Relative To Defensives
Chart 22Accelerating Economic Recovery Will Continue To Support Chinese Cyclical Stocks
Accelerating Economic Recovery Will Continue To Support Chinese Cyclical Stocks
Accelerating Economic Recovery Will Continue To Support Chinese Cyclical Stocks
Chart 23Rebounding Commodity Prices Will Bode Well For Material Stocks
Rebounding Commodity Prices Will Bode Well For Material Stocks
Rebounding Commodity Prices Will Bode Well For Material Stocks
Recent bond payment defaults by several SOEs have led to a spike in onshore corporate bond yields. Nonetheless, the ripple effect on China’s financial markets has been limited outside of the corporate bond market; onshore stocks were little changed by news of the defaults. Moreover, the PBoC’s recent liquidity injections helped to stabilize the interbank rate. Historically, corporate bond defaults and rising bond yields have not had an imminent negative impact on China’s domestic stock market performance; none of the defaults in 2015, 2016 or 2019 led to selloffs in the equity market. However, during a business cycle upswing and following a large-scale stimulus, increasing corporate defaults typically mark the onset of tightening in financial regulations and the monetary cycle. We expect the upswing in the business cycle to begin losing momentum as the tightening policy cycle gains further traction in 2021. Prices in the forward-looking equity market will likely peak sooner on the expectation that the rate of economic and corporate earnings growth will slow in 2H21. Chart 24Stress In Chinese Onshore Corporate Bond Market
Stress In Chinese Onshore Corporate Bond Market
Stress In Chinese Onshore Corporate Bond Market
Chart 25Stress In Chinese Onshore Corporate Bond Market
Stress In Chinese Onshore Corporate Bond Market
Stress In Chinese Onshore Corporate Bond Market
Chart 26But So Far Negative Impacts On The Stock Market Are Limited
But So Far Negative Impacts On The Stock Market Are Limited
But So Far Negative Impacts On The Stock Market Are Limited
Table 1China Macro Data Summary
China Macro And Market Review
China Macro And Market Review
Table 2China Financial Market Performance Summary
China Macro And Market Review
China Macro And Market Review
Footnotes 1Please see China Investment Strategy Weekly Report "China Macro And Market Review," dated October 7, 2020, available at cis.bcaresearch.com 2Headline PPI is comprised of producer and consumer goods. The weights of producer and consumer goods are roughly 75% and 25%, respectively. As for producer goods by industry, the weight of the manufacturing sector is around 50%, followed by 20% for the raw material sector; the mining sector accounts for only around 5%. 3Pro-auto consumption plans include: providing subsidies to encourage urban car owners to replace older and higher-emission models with newer environmentally friendly ones; encouraging automobile sales and upgrades in rural areas; and promoting New Energy Vehicle (NEV) sales. The plan will also loosen some existing restrictions on auto sales and increase the permits for vehicle license plates. Cyclical Investment Stance Equity Sector Recommendations
Mr. X and his daughter, Ms. X, are long-time BCA clients who visit our office toward the end of each year to discuss the economic and financial market outlook for the year ahead. This report is an edited transcript of our recent conversation, which we held remotely due to the COVID-19 pandemic. Mr. X: As always, I welcome the opportunity to discuss the economic and financial outlook with you. The past year has been truly ghastly with the wretched COVID-19 disease wreaking extraordinary economic and social havoc. I take comfort from the hope that a vaccine will allow a gradual return to more normal conditions in 2021, but my concerns about the longer-run outlook have increased. The extreme monetary and fiscal responses to the virus-related economic collapse may have been necessary but will leave most developed economies much more vulnerable down the road. Risk assets have been propped up by easy money, but I fear that simply means lower returns in the future. Ms. X: The social impact of the virus has weighed heavily on me, making me quite depressed about the outlook. I can only hope that my normal optimism will return when a vaccine ends the pandemic. Of course, I am happy that equities have done much better than might have been expected in the past year, but I share my father’s concerns about long-term returns. I look forward to discussing ideas about how to position our portfolio. BCA: The past year has indeed been grim on many levels. The economic disruption has been severe, but the social toll of the virus has been even more damaging for many people in terms of being forcibly isolated from family and friends. It is very encouraging that vaccines should start to become widely available early in the year, but the return to normality likely will take time. During the northern hemisphere winter months, the pandemic may even get worse before it gets better. As far as the longer run outlook is concerned, the policy response to the crisis will indeed have consequences. Government debt has soared in most countries and this raises the issue of how this will be dealt with in the years ahead. Meanwhile, central bank support to the markets cannot continue indefinitely, which raises the prospect of severe withdrawal pains at some point. Furthermore, both fiscal and monetary trends pose the question of whether higher inflation is inevitable. It is therefore unlikely that voters will reward politicians who impose upon them the painful deflationary pressures. Markets are forward looking and one could take the view that the strength of equity markets in the past eight months has reflected optimism about the economic outlook. However, a more plausible explanation is that hyper-stimulative monetary policies have been the main driving force behind asset prices. If that is the case, then there is some cause for optimism because central banks have made it clear that they will not be tightening policy for quite some time. While you are both right to be concerned about low returns over the long run, risk asset prices seem likely to rise further in the coming year with equities continuing to outperform bonds. We can get into that in more details later. Ms. X: Before we get into our discussion of the outlook, let’s briefly review your predictions from last year. BCA: That will be a humbling experience given that we never built a global pandemic into our forecasts! A year ago, our key conclusions were that: Global equities would enter the end game of their nearly 11-year bull market. Stocks were expensive, but bonds were even more so. As a result, if global growth could recover and the US could avoid a recession in 2020, earnings would not weaken significantly and stocks would again outperform bonds. Low rates reflected the end of the debt super cycle in the advanced economies. However, the debt super cycle was still alive in EM, particularly in China. The global economic slowdown that began more than 18 months prior to our meeting started when China tried to limit debt growth. If Beijing continued to push for more deleveraging, global growth would continue to suffer as the EM debt super cycle would end. Nonetheless, we expected China to try to mitigate domestic deflationary pressures in 2020. As a result, a small wave of Chinese reflation, coupled with the substantial easing in global monetary and liquidity conditions should have promoted a worldwide reacceleration in economic activity. Policy uncertainty would recede in 2020. Domestic constraints would force China and the US toward a trade détente. The risk of a no-deal Brexit was seen as marginal, and President Trump was still the favorite in the election. A decline in policy risk would foster a global economic rebound. That being said, some pockets of geopolitical risk remained, such as in the Middle East. Global central banks were highly unlikely to remove the punch bowl. Not only would it take some time before global deflationary forces receded, monetary authorities in the G-10 would want to avoid the Japanification of their economies. As a result, they were already announcing that they would allow inflation to overshoot their 2% target for a period of time. This would ultimately raise the need for higher rates in 2021, which would push the global economy into recession in late 2021 or early 2022. These dynamics were key to our categorization of 2020 as the end game. US growth would reaccelerate. The US consumer was in good shape thanks to healthy balance sheets as well as robust employment and wage growth prospects. Meanwhile, corporate profits and capex should have benefited from a decline in global uncertainty and a pickup in global economic activity. China would continue to stimulate its economy but would not do so as aggressively as it did over the past 10 years. Consequently, EM growth would also bottom but was unlikely to boom. Europe and Japan would reaccelerate in 2020. Bond yields would continue to grind higher in 2020. However, Treasury yields were unlikely to break above the 2.25% to 2.5% range until much later in the year. Inflationary pressures would not resurface quickly, so the Fed was unlikely to signal its intention to raise interest rates until late 2020 or later. European bonds were particularly unattractive. Corporate bonds were a mixed offering. Investment grade credit was unattractive owing to low option-adjusted spreads and high duration, especially as corporate health was deteriorating. Agency mortgage-backed securities and high-yield bonds offered better risk-adjusted value. Global stocks would enjoy their last-gasp rally in 2020. As global growth would recover, we favored the more cyclical sectors and regions which also happened to offer the best value. US stocks were the least attractive bourse; they were very expensive and loaded with defensive and tech-related exposure, two groups that would suffer from higher bond yields. We were neutral on EM equities. We recommended that investors pare exposure to equities only after inflation breakevens had moved back into their 2.3% to 2.5% normal range and the Fed fund rates had moved closer to neutral. We anticipated this to be a risk in 2021. The dollar was likely to decline because it is a countercyclical currency. Balance of payment dynamics and valuation considerations were also becoming headwinds. The pro-cyclical European currencies and the euro were expected to be the main beneficiaries of any dollar depreciation. We anticipated oil and gold to have upside. Crude would benefit from both supply-side discipline and a recovery in oil demand on the back of the improving growth outlook. Gold would strengthen as global central banks would limit the upside to real rates by allowing inflation to run a bit hot. A weaker dollar would boost both commodities. We expected a balanced portfolio to generate an average return of only 2.4% a year in real terms over the next decade. This compares to average returns of around 6.5% a year between 1982 and 2018. Obviously, our forecasts were undone by the defining event of the year: the pandemic. Nonetheless, in February we warned that asset prices did not embed enough of a risk premium to protect investors against the threat that the pandemic could terminate the global business cycle. The more deflationary risk we confront today, the more inflation we will face in the future. At the beginning of the second quarter, we were quick to recommend buying stocks back, so we participated in the rally that followed. We erred in preferring foreign to US equities, which turned out to be key winners of the pandemic thanks to their heavy exposure to growth stocks (Table 1). The economic downturn meant that bond yields fell rather than rose. They have remained exceedingly low in response to exceptionally accommodative monetary conditions, a surge in savings and deeply negative output gaps. We were right to favor peripheral bonds, which benefited from the ECB’s purchases and the European Commission’s Recovery Fund (Table 1). Finally, the market rewarded our negative stance on the dollar and our bullish view on gold. However, we were offside on oil, where the continued impact of the pandemic on global transport has left crude prices at very depressed levels. Table 12020 Asset Market Returns
OUTLOOK 2021: A Brave New World
OUTLOOK 2021: A Brave New World
A Brave New World Mr. X: You mentioned that you prefer stocks over bonds for 2021. I can accept this view; while stocks are expensive, their valuations are less demanding than that of bonds. Moreover, I agree that policymakers around the world are very afraid of the deflationary consequences of removing accommodation too early but they cannot ease monetary policy much from here. This creates an asymmetric payoff in favor of stocks versus safe-haven securities. However, my favorite asset class for the near future is cash. Granted, I enjoy the luxury of not having to track a benchmark and my core focus is capital preservation. With both stocks and bonds richly valued, I see no margin of safety and I would rather stand on the sidelines. The longer-term outlook is particularly concerning. The extraordinary accommodation implemented this year was unavoidable, but its future consequences worry me greatly. Real rates have never been so low and we are leaving unprecedented public debt loads to our children and grandchildren. Moreover, I fear further adoption of populist policies because inequalities have risen in the wake of the crisis. The worst affected families stand at the bottom of the income distribution while people like me have benefited from inflated asset prices. Therefore, I am inclined to believe that we will suffer a large inflation shock in the coming decade. The global broad money supply has exploded and it is very unlikely that central banks will normalize interest rates in due time because of the burden created by gigantic public debt loads and the spectrum of further populism. My worries extend beyond these obvious concerns. Last year I was already anxious about the incredibly large stock of global debt with negative yields. This situation has only worsened since. Moreover, the various programs implemented by the Federal Reserve, the European Central Bank and other major monetary authorities to provide liquidity directly to the private sector at the apex of the crisis have prevented the purge of unhealthy firms necessary under a capitalist system. Instead of creative destruction, zombification has become the norm. Thus, I fear that more capital is misallocated than at any point in the past 10 years. Putting it all together, my expectations are that real returns will be poor for years to come, if not outright negative. I therefore believe that gold should stand at the core of my family’s portfolio. Ms. X: I share many of my father’s concerns. It is difficult to see how monetary and fiscal authorities will normalize policy. Hence, I agree that we will face the painful legacy of a large debt overhang and poor long-term returns. Moreover, the poor demographic profile in most advanced economies as well as China bodes ill for trend growth. I do see opportunities within this bleak picture. Healthcare stocks should benefit from an aging of the world’s population and tech equities will remain a source of disruption, innovation and profit growth in the coming decades. Thus, an equity portfolio built around these themes should generate positive real returns. In light of the positive vaccine news, next year will offer investors with both rapidly expanding profits and low discount rates and it is hard to imagine equities performing poorly. BCA: Clearly, we have many things to discuss. We should start with the COVID-19 pandemic. The news that vaccines developed by Pfizer/BioNTech and Moderna are around 95% effective is very encouraging. The Oxford/AstraZeneca announcement also is a source of optimism, even if the trial results have been less clear-cut. Moreover, other vaccines are currently in the mass-testing stage. By next winter, approximately 1.5 billion people globally should have been vaccinated. These positives hide many issues. First, transporting the Pfizer and Moderna vaccines (particularly the one produced by Pfizer, which needs to be kept at -70°C) will be challenging, especially for poorer countries. Second, the mRNA technology used in these vaccines is new and its long-term impact is unknown. Hence, many people will be reluctant to take this shot, especially as the confidence in the safety of vaccines has declined among the general public. Only 58% of Americans said they would probably take a COVID-19 vaccine, a number that will rise once the vaccine is demonstrated but which still highlights the challenge (Chart 1). Third, the virus could mutate and render the current generation of vaccines ineffective. The recent news of such mutations in mink farms in Denmark is worrisome, especially as the new strain of the virus has already jumped back into the human population. Chart 1The Vaccine Blues
OUTLOOK 2021: A Brave New World
OUTLOOK 2021: A Brave New World
Our base case is that the vaccines will allow a progressive reopening of the economic sectors currently still under lockdown. They will lead to a further improvement in employment, consumer and business sentiment, and aggregate demand. With less fear of getting infected, consumers will return to shops, restaurants, hotels, etc. This will have a very beneficial impact on capex and profit growth. It will result in higher stock prices, especially for value stocks, cyclical stocks, as well as higher yields and commodity prices. Despite this optimistic base case, investors must have contingencies ready. The three aforementioned risks around the vaccines suggest that additional waves of infections cannot be entirely ruled out and that lockdowns may continue in 2021. Thus, we could still face periods of downward pressure on activity, yields, and value stocks. For now it remains prudent not to tilt portfolios fully toward a post-COVID bias. In contrast to the past 40 years, a 60/40 portfolio will fare poorly once we account for higher inflation. Even if the vaccines enjoy widespread adoption, near-term threats to economic activity remain. The realization that the end of the pandemic is close may prompt a temporary period where households hunker down and behave in a very conservative fashion. After all, few consumers will want to contract the virus just before a vaccine becomes available. Moreover, the sight of the end of the lockdowns reduces the fiscal authorities’ urgency to provide additional support to the population and small businesses. These two dynamics could prompt a deep contraction in spending in the first quarter of 2021, which would hurt stock prices. Mr. X: Thank you. While these near-term dynamics are crucial, the emergence of the vaccine increases the importance of discussing the long-term implications of the extreme policy conducted in recent months. BCA: The long-term implications of aggressive policy stimulus tie into the evolution of the debt super cycle. As a share of US GDP, total private debt has spiked near a record high and total nonfinancial debt has surged to new all-time highs (Chart 2). This reflects two phenomena. First, the denominator of the ratio – GDP – has collapsed. Second, total nonfinancial debt also highlights the rapid increase in government deficits. Hence, climbing leverage was a consequence of the necessary dissaving by the public sector to alleviate the deflationary forces created by the crisis. This problem is repeated around the world. As Chart 3 demonstrates, nonfinancial debt levels across the G10 are rapidly rising. Moreover, debt loads in emerging markets are also extremely elevated. Chart 2COVID-19 Boosted Debt Ratios
COVID-19 Boosted Debt Ratios
COVID-19 Boosted Debt Ratios
Chart 3Elevated Debt Everywhere
Elevated Debt Everywhere
Elevated Debt Everywhere
Going forward, either rising savings or faster nominal GDP growth will cause the debt ratios to decline. The first option is difficult; increasing savings is deflationary and it could worsen the debt arithmetic by keeping real interest rates stubbornly high. Moreover, it is politically unpopular, especially when the public sector has been the borrower. Here, we echo the words of Keynes from his 1923 Tract On Monetary Reform: "The progressive deterioration in the value of money through history is not an accident, and has had behind it two great driving forces – the impecuniosity of governments and the superior political influence of the debtor class (…). No state or government is likely to decree its own bankruptcy or its own downfall so long as the instrument of taxation by currency depreciation through the creation of legal tender (money) still lies at hand… The active and working elements (i.e., debtors) in no community, ancient or modern will consent to hand over to the rentier or bond holding class more than a certain proportion of the fruits of their work. When the piled up debt demands more than a tolerable proportion, relief has usually been sought in (…) repudiation (…) and currency depreciation." Nominal rates cannot fall further, while large inequalities and social immobility are fomenting populism (Chart 4). Moreover, the recent COVID-19 crisis has deepened the angst of the general population and its dissatisfaction with policymakers. It is therefore unlikely that voters will reward politicians who impose upon them the painful deflationary pressures that result from the high savings necessary to reduce public sector debt loads. Even a Republican-controlled US Senate will have to allow larger deficits than usual in today’s climate. Chart 4Inequalities And Immobility Are The Roots Of Populism
OUTLOOK 2021: A Brave New World
OUTLOOK 2021: A Brave New World
Instead, we expect fiscal and monetary policy to work in tandem to lift inflation and deflate the global debt load. The rising popularity of Modern Monetary Theory fits within this paradigm shift. MMT posits that as long as governments issue debt in their own currency, central bank money printing can finance the deficit. The only constraint on policymakers becomes the level of inflation that society tolerates. Society is likely to tolerate a rise in inflation. MMT is unpalatable to savers, but the majority of citizens are debtors, not lenders. In an MMT framework where the median voter is a borrower, the tolerance for inflation will likely be high, which will hurt the value of financial assets. Moreover, the corporate sector is unlikely to fight strongly against large deficits funded by central banks. If we accept the Kalecki Equation of Profits, which can be simplified as: Profits = Investment – Household Savings – Government Savings – Foreign Savings + Dividends then business profits will suffer if deleveraging takes hold, whether in the public or private sector. Instead, MMT-like policies, which will keep savings at low levels and prevent deleveraging, offers a way to keep nominal profits afloat. For businesses too, the path of least resistance steers toward higher inflation. Different countries will vary in their ability to pass MMT-like policies, but the policy shift toward inflationary policies is clear. The specter of rising populism should result in heavier regulation, at least in the EU and the US under the incoming Biden administration. Regulation further hurts the growth rate of the supply-side of the economy. It limits competition, it protects workers and it increases the cost of doing business. We expect additional fiscal stimulus will come through in the coming months. Beyond political forces, the demographic deterioration highlighted by Ms. X points in the same direction. An aging population means that the dependency ratio (the number of dependents per worker) is increasing. Moreover, analysis by the UN underscores that in old age, consumption increases due to rising spending on healthcare (Chart 5). We are therefore likely to witness a slowing expansion of the supply side relative to the demand side of the economy. By definition, this process is inflationary. In the second half of the decade, inflation could average as high as between 3% and 5%. Keep in mind that inflation is not a linear process. Once it starts to rise, it becomes very hard to control. In this regard, the experience of the late 1960s is extremely instructive. Through the 1960s boom, inflation was well behaved, contained between 0.7% and 1.2%. Then it started to rise in 1966, and quickly hit 6.1% by 1970 (Chart 6). While the average-inflation target the Fed recently adopted is well intentioned, in an environment where governments are unlikely to curtail deficits as fast as the private sector cuts its savings, it could easily unleash a long-term inflationary trend. Chart 5Aging Doesn't Spell Less Spending
Aging Doesn't Spell Less Spensing
Aging Doesn't Spell Less Spensing
Chart 6Inflation Is Stable Until It Is Not
Inflation Is Stable Until It Is Not
Inflation Is Stable Until It Is Not
Ms. X: Why won’t technological advancements such as AI and automation cause low inflation to prevail for the rest of the decade? Chart 7Low Productivity
Low Productivity
Low Productivity
BCA: The great paradox of this crisis is that the more deflationary risk we confront today, the more inflation we will face in the future. This relationship is the consequence of financial repression. Debt arithmetic will only stay manageable as long as real interest rates remain low; consequently, central banks will only be able to increase interest rates if nominal growth rises significantly from its low average of the past decade. Both workforce and productivity growth are low, thus quicker inflation is the only solution. As you hinted, technology is a risk to our long-term inflation view. However, technology has most often been a deflationary force. The key question is whether we are experiencing a greater impact than normal on productivity from current technological developments. So far, the answer seems to be no. Even if the statistical estimation methods for GDP overestimate inflation and thus underestimate productivity, we are still nowhere near the kind of productivity gains registered in the post-WWII period or at the turn of the millennium. We remain much closer to the productivity recorded in the 1970s or early 1980s (Chart 7). As a result, we expect technology not to be enough of a game changer to undo the inflationary effect of the shift away from the pro-capital, deregulatory, pro-global-trade consensus that prevailed for the past forty years. Ms. X: Your view rests on an assessment that political forces are structurally moving toward populism. Doesn’t the most recent US election counter this argument? Was it not a victory of centrism over populism? Chart 8AValuations Point To Poor Long-Term Returns
Valuations Point To Poor Long-Term Returns
Valuations Point To Poor Long-Term Returns
Chart 8BValuations Point To Poor Long-Term Returns
Valuations Point To Poor Long-Term Returns
Valuations Point To Poor Long-Term Returns
Chart 8CValuations Point To Poor Long-Term Returns
Valuations Point To Poor Long-Term Returns
Valuations Point To Poor Long-Term Returns
Chart 8DValuations Point To Poor Long-Term Returns
Valuations Point To Poor Long-Term Returns
Valuations Point To Poor Long-Term Returns
BCA: It was a victory of moderation over populism, but it was a narrow victory that reveals powerful populist undercurrents, particularly the strong demand for economic reflation. Despite a pandemic and recession in the election year, President Trump narrowly lost in the key swing states, and managed to garner roughly 74 million votes, the second highest tally in history. Moreover he led the Republican Party to gain seats in the House of Representatives and (likely) to retain control of the Senate. Exit polls reveal that the economy was still the number one issue on voters’ minds – they rejected Donald Trump’s personality but embraced his “growth at any cost” approach. By the same token, the Democratic Party lost elections down the ballot because they became associated with lockdowns and revolutionary social causes. President-Elect Joe Biden won the election, first, by not being Donald Trump, and second, by campaigning on a larger government spending program, a moderately liberal social stance, and a less belligerent protectionism on trade and China. The fact that both candidates wanted large stimulus packages and infrastructure programs tells us something about the median voter’s stance on economic policy: it is reflationary. Going forward, if Republicans control the Senate then the Biden administration will have to appeal to moderate Republican senators to get enough votes for COVID relief and economic recovery. If Democrats gain control of the Senate on January 5, they will have a one-vote majority and their legislative agenda will depend on winning over moderate Democratic senators. The Republican scenario is less reflationary but more likely, while the Democratic scenario is more reflationary but less likely. What investors can count on in 2021 is that the US government will not enact the mammoth splurge of government spending but that Republican senators will also be cognizant of the need for some fiscal support. Mr. X: If you expect inflation to rise structurally, how should we position our portfolio on a long-term basis? Bonds will obviously suffer, but so will an extremely expensive equity market that requires low bond yields to justify current prices. It seems like there is nowhere to hide but gold. BCA: The next one to two decades will not look like the past four, which were extraordinarily rewarding for investors. The taming of inflation, the broadening of globalization and far-reaching deregulation both cut interest rates and boosted profit margins. These trends stimulated demand and lifted asset valuations. These dynamics fed exceptional returns for all financial assets. However, these tailwinds have dissipated. The Fed will look through next year’s temporary inflation rebound. This change has many important implications for portfolio construction. You are correct that it will be hard for equities to generate decent real returns in the coming decade. Valuations may be a poor gauge of immediate stock returns, but they are clearly correlated with long-term returns (Chart 8). The odds of higher inflation in the second half of the decade will eventually cause policymakers to raise interest rates and force a normalization of equities multiples. Moreover, greater regulation and rising populism will raise the share of GDP absorbed by wages. Profit margins are likely to decline from here (Chart 9). Chart 9Profit Margins Under Threat?
Profit Margins Under Threat?
Profit Margins Under Threat?
Despite the poor long-term outlook for real stock returns, equities should still outperform bonds. Over the past 150 years, shares beat bonds in each episode of cyclically rising inflation, even if stocks generate paltry inflation-adjusted returns (Table 2). This time will not be different. Equities are significantly cheaper than bonds. Based on the current level of bond and dividend yields, US, Eurozone, UK and Japan bourses need to fall in real terms 23%, 32% 50% and 20%, respectively, over the next 10-year to underperform local government bonds (Chart 10). Additionally, the duration of bonds is very high due to their extremely low yields, which means that bond prices are exceptionally sensitive to rising rates. Table 2Stocks Beat Bonds, Part I
OUTLOOK 2021: A Brave New World
OUTLOOK 2021: A Brave New World
In contrast to the past 40 years, a 60/40 portfolio will fare poorly once we account for higher inflation. During the period from 1965 to 1982, when US core CPI inflation rose from 1.2% to 13.6%, the 60/40 portfolio lost 30% of its value in real terms (Chart 11). Moreover, the portfolio started to suffer poor inflation-adjusted returns well before inflation moved into double digits. As soon as CPI accelerated in 1966, the standard portfolio began to lose value. This time, inflation will not reach the dizzying height of the late 70s, but equities are trading at price-to-sales, price-to-book or Shiller P/E 33% above that of 1965 and Treasury yields stand at 0.88%, not 4.65%. Chart 10Stocks Beat Bonds, Part II
Stocks Beat Bonds, Part II
Stocks Beat Bonds, Part II
Chart 11The 60/40 Portfolio Doesn't Like Inflation
The 60/40 Portfolio Doesn't Like Inflation
The 60/40 Portfolio Doesn't Like Inflation
The problematic long-term outlook for the 60/40 portfolio will demand greater creativity from investors than over the past 40 years. We like assets such as farmland, timberland, and natural resources as inflation hedges. We also like precious metals. Silver is particularly attractive; like gold it thrives from rising inflation, but unlike its yellow counterpart, silver trades at a discount to its fair value implied by the long-term trend in consumer prices (Chart 12). Industrial metals are also interesting; the effort to reduce carbon emissions will hurt fossil fuel prices but will require greater reliance on electricity. Hence, the demand for copper will stay robust while investments in extraction capacity have been poor for the last decade. Silver, a great electricity and heat conductor, will also benefit from this trend. Chart 12Silver Is Cheaper Than Gold
Silver Is Cheaper Than Gold
Silver Is Cheaper Than Gold
Within equity portfolios, winners and losers will also change. Empirically, technology, utilities and telecom services underperform when inflation rises durably. On the other hand, healthcare, materials and real estate outperform. The first group does not possess much pricing power in an accelerating CPI environment while the second does, justifying the bifurcated relative performances. We recommend tilting long-term equity exposure this way. Finally, this sectoral view implies a structural overweight in Europe and Japan at the expense of the US and emerging markets. Mr X: Thank you. This discussion about long-term risks and portfolio construction was very useful. That being said, the thought of MMT becoming more mainstream leaves me extremely uncomfortable. The Economic Outlook Ms. X: From your observations on the vaccine rollout, I presume you expect the recovery to remain robust next year. Aren’t you concerned that a big part of the G-10 could experience a double dip recession in the first half of the year? BCA: Near-term risks are very elevated and it is likely that Europe is experiencing a renewed slump in activity as we speak. In response to the recent violent second wave of infections, consumers have avoided public spaces and governments across the continent and in the UK have implemented increasingly stringent lockdowns. Various high-frequency indicators and live trackers for the regions already indicate that another contraction in activity is taking place (Chart 13). The US is not immune to a slowdown. The country is in the thrall of its third wave of infections and local governments are increasingly imposing lockdowns. Just look at New York City, which is somewhat of a canary in the coalmine for the nation, where schools have closed. This development is happening as the economy was already slowing down after a blistering recovery in the third quarter. Naturally, the US economic surprise index is quickly declining, which indicates that economic data is falling short of expectations (Chart 14). Chart 13The European Economy Is Slowing Right Now
The European Economy Is Slowing Right Now
The European Economy Is Slowing Right Now
Chart 14The US Economy Is Decelerating
The US Economy Is Decelerating
The US Economy Is Decelerating
Growth is slowing but the level of US GDP is not doomed to contract. First, inventory restocking could add as much as 3.5% to current quarter GDP. Second, consumer spending is still robust. This summer, household savings jumped massively in response to both the large transfers created by the CARES act as well as the low marginal propensity to spend caused by depressed consumer confidence. Now, consumers are deploying this large pool of funds, which is buttressing expenditures. Despite these short-term headwinds, growth in 2021 should be well above trend in the US and in Europe. The ECB Target II balance permanently attaches Germany to its weaker neighbors. Mr. X: What about the risk that a lack of fiscal stimulus could scuttle the recovery? BCA: We are not overly concerned about that as we expect additional fiscal stimulus will come through in the coming months. Chart 15Borrowing Costs Are Not A Constraint To Spending
OUTLOOK 2021: A Brave New World
OUTLOOK 2021: A Brave New World
In Europe, the case for additional fiscal support is clear. All the major euro area countries, including Greece, can borrow at negative interest rates, depending on the maturity (Chart 15). This too is true for Sweden, Switzerland and even the UK. Within the Eurozone, the issuance linked to the European Commission’s Recovery Fund represents the first wave of common-debt issuance. It is an embryonic tool for fiscal risk sharing, one that goes further than the European Stability Mechanism, and it is an important driver of the spread compression in the European bond market. European governments are under little pressure to apply any fiscal brake because of these low borrowing costs. Moreover, the various European central banks are buttressing government bond markets. Thus, fiscal authorities have a free hand to provide additional support if they choose to do so while lockdowns remain in place. The loose fiscal setting will allow activity to recover quickly. In the US, the situation is more complex, but we expect at least a minimal level of support. The gridlock in Washington prevents the large stimulus that would have passed under a unified Democratic control of Congress. However, a Biden administration faced with a Senate controlled by the GOP also cannot increase taxes significantly. Meanwhile the Republicans are willing to provide additional help as long as it targets households and small businesses. Netting these forces out, we expect a stimulus package of $500 billion to $1 trillion. This is smaller than the various offers on the table prior to the election, but the more concrete eventuality of a vaccine deployment in the first half of 2021 also means that the economy needs help for a shorter period. While the risk to the forecast is that the Democrats and the Republican reach a larger compromise, investors may have to wait months for a deal. This delay could magnify the underlying weakness in the US economy. Chart 16The Chinese Locomotive Is Intact
The Chinese Locomotive Is Intact
The Chinese Locomotive Is Intact
In Japan, the law prescribes a negative fiscal thrust of –7.1% of GDP. We doubt this will transpire. Prime Minister Suga does not want to kill a nascent recovery and feed powerful deflationary pressures. Hence, supplementary budgets will provide more support to growth. Ms. X: Last year, we spoke a lot about China as an important driver of the global manufacturing cycle and growth. Is this still the case? BCA: China remains an important factor supporting our positive stance on global growth in 2021. Thanks to the aggressive use of testing and tracing, China has contained the virus, which is letting the economy heal and respond normally to monetary policy. On this front, the lagged impact of the easing enacted since 2019 will continue. Total social financing flows have rebounded to 33% of GDP and are consistent with a further improvement in our China Activity Indicator (Chart 16). Strengthening Chinese cyclical spending will lift imports of raw materials and machinery. The uptick in the Chinese credit and fiscal impulse suggests that China will remain a positive force for the rest of the world until the second half of 2021. After the summer, the positive impact of China on global growth will ebb. The PBoC is already allowing market interest rates to increase, which suggests that the apex of the credit easing was reached in Q4. Nonetheless, President Xi Jinping cannot tolerate any kind of instability ahead of the 100th anniversary of the CCP in October 2021. Thus, the fiscal and monetary policy tightening will be calibrated before that date and will only become a major risk afterwards. As a result, global growth will enjoy its maximum contribution from Chinese demand around Q2 2021. After that, Chinese activity will still be high enough to keep global industrial production elevated, but not enough to cause a further acceleration. Chart 17China's Marginal Propensity To Consume Augurs Well
China's Marginal Propensity To Consume Augurs Well
China's Marginal Propensity To Consume Augurs Well
Another good news for the Chinese and global economies is the recent pickup in China’s marginal propensity to consume (MPC), as approximated by the gap between the growth rate of M1 and M2 money supply (Chart 17). When M1 accelerates faster than M2, demand deposits are growing quicker than savings deposits, which highlights that economic agents are positioning their liquidity for increased spending. The MPC’s uptick will reinforce the positive signal for global economic activity from China’s credit trend. It also creates upside risk for China’s economy in the second half of the year compared to what policy dynamics imply. Ms. X: Beyond China and fiscal policy, do you foresee any other tailwinds for the global business cycle? BCA: Yes, there are plenty. As we already mentioned, the vaccine should allow the service sector to normalize progressively over the course of the year. Households’ healthy balance sheets will underpin US consumer spending next year. At the end of 2019, debt to disposable income stood at an 18-year low and the debt servicing-costs ratio was near generational troughs. In addition, both of these measures of financial health only improved during the crisis. Collapsing interest rates allowed households to refinance their mortgages and government transfers boosted disposable income. Likewise, after a very negative shock in Q1, household net worth quickly rebounded in Q2 when asset prices surged and household savings grew (Chart 18). The wealth effect will therefore help consumption, especially because employment continues to improve. The odds of higher yields are most pronounced for longer maturities. The outlook for capex is also bright. Capex intentions have been surprisingly robust in recent months and core durable goods shipments have reached all-time highs (Chart 19). Admittedly, capex is a lagging economic variable – companies take their cues from the behavior of households. But, this means that, as household spending continues to recover, so will capital investment. Another way to approach this topic is to think about the link between capex and corporate profitability. In capital budgeting, the pecking order theory argues that retained earnings are the preferred source of financing for corporate investments. This theory is echoed by empirical evidence. Business capital formation follows operating profits by roughly six months (Chart 20). The positive outlook for profits therefore bodes well for capex. Chart 18Solid Household Balance Sheets In The US
Solid Household Balance Sheets In The US
Solid Household Balance Sheets In The US
Chart 19Surprising Capex Rebound
Surprising Capex Rebound
Surprising Capex Rebound
Chart 20Earnings Drive Capex
Earnings Drive Capex
Earnings Drive Capex
A major concern for the US economy is commercial real estate. This sector’s losses will likely be very large because many buildings are now uneconomical. Even if vaccines normalize daily activities, post-pandemic life has in some ways been reshaped. Workers are likely to conduct more of their job from home and shoppers have become used to the convenience of E-commerce. As a result, the need for office and retail space will decrease, which falling rents are already reflecting. The hit to the US banking system is still unknown. While CRE accounts for 13% of bank assets, this exposure is concentrated within smaller regional banks, which are much frailer than their SIFI counterparts (Chart 21). We could therefore see some localized troubles within a banking system that is tightening credit standards already (Chart 22). This danger warrants close monitoring. Chart 21CRE Is A Threat For Small Banks
CRE Is A Threat For Small Banks
CRE Is A Threat For Small Banks
Chart 22Another Tightening In Standards Would Be Dangerous
Another Tightening In Standards Would Be Dangerous
Another Tightening In Standards Would Be Dangerous
Chart 23Europe Is More Exposed To Chinese Demand
Europe Is More Exposed To Chinese Demand
Europe Is More Exposed To Chinese Demand
It is not clear whether the US or the euro area will enjoy the sharpest growth improvement in 2021. Normally, Europe benefits the most during a manufacturing upswing, especially when China’s marginal propensity to consume is expanding (Chart 23). The European economy is more cyclical than that of the US because exports and manufacturing constitute a larger share of employment and gross value added (Chart 23, bottom panel). Moreover, the fiscal drag in Europe is likely to subtract roughly 3% from GDP next year while it could subtract 5% to 7% from the US GDP. However, an important handicap will counterbalance these advantages for Europe; the biggest source of economic delta next year should be the service sector because spending on goods began to recover in earnest in 2020. There is simply more pent-up demand left in services than goods and the service sector accounts for a larger share of output in the US than in Europe. Three additional factors could also favor the US against both Europe and Japan. First, residential activity is rebounding more quickly in North America. Historically, residential investment makes a large contribution to cyclical expenditures and it galvanizes additional spending on durable goods. Second, the Fed was able to engineer deeper declines in real interest rates than the ECB or the BoJ while Washington expanded the deficit faster than Tokyo or most European capitals. Finally, the weak dollar is creating another relief valve unavailable to Japan and Europe. In fact, the euro’s strength is potentially the greatest dampener of the European recovery in the coming quarter. Finally, emerging economies face important domestic hurdles that will handicap them significantly versus advanced economies in the first half of the year. EM banking systems remain fragile after the violent capital outflows witnessed in the first half of 2020. Thus, their ability to expand credit is comparatively limited. Moreover, EM economies have yet to withstand the inevitable second wave of infections, and their healthcare systems are even weaker than in advanced economies. The logistical complications associated with the rollouts of the vaccine will be most acute in poorer countries. Mr. X: I share your worries about long-term inflation, but where do you stand regarding near-term dynamics? A faster inflation recovery would amount to the kiss of death for asset markets. BCA: You are correct that faster inflation would threaten asset markets. It would force a rapid re-pricing of the Fed’s policy path and lift yields higher. Expensive stocks would buckle under this impulse. However, while it is a risk we monitor closely, it is far from our base case. We particularly like real yield curve steepeners. To begin with, both the output gap and the unemployment gap will remain meaningful in 2021. Our US Composite Capacity Utilization Indicator is not consistent with higher inflation (Chart 24). Additionally, at 6.9%, the US unemployment rate understates the amount of slack in the labor market. The employment-to-population ratio for prime-age workers offers a more accurate read of the labor market because it accounts for discouraged workers. This labor market indicator points toward limited inflation in the Employment Cost Index (Chart 25). Chart 24Limited Immediate Inflationary Pressures
Limited Immediate Inflationary Pressures
Limited Immediate Inflationary Pressures
Chart 25The Labor Market Is Replete With Slack
OUTLOOK 2021: A Brave New World
OUTLOOK 2021: A Brave New World
Inflation is still likely to spike in the first half of the year, but this jump will prove temporary. In the second quarter, both the core CPI and the core PCE inflation will incorporate a strong base effect when annual comparisons include the extremely depressed numbers that prevailed at the nadir of the recession. Moreover, once the service sector reopens in response to broadening vaccination programs, service sector inflation could pop higher, as goods prices did once the goods sector reopened last summer. The base effect will quickly ebb and the initial surge in service inflation should also dissipate because shelter inflation will remain dampened by stubborn permanent unemployment (Chart 26). The Fed will look through next year’s temporary inflation rebound. Its new average inflation target officialized last September is designed to avoid this kind of premature response and Fed officials are currently more afraid of committing deflationary errors than inflationary ones. Markets understand this well. Hence, as long as inflation breakeven rates remain below the 2.3% to 2.5% band consistent with market participants believing in the Fed’s ability to achieve 2% inflation durably (Chart 27), market wobbles caused by higher inflation will create buying opportunities. Chart 26Shelter Inflation Will Remain Downbeat
Shelter Inflation Will Remain Downbeat
Shelter Inflation Will Remain Downbeat
Chart 27The Fed Monitors Inflation Expectations
The Fed Monitors Inflation Expectations
The Fed Monitors Inflation Expectations
One factor could cause inflation to start moving durably higher than our base case anticipates. So far, money supply is behaving very differently than in the wake of the GFC. Back then, the Fed aggressively expanded its balance sheet, but the private sector’s deleveraging compressed money demand. Consequently, the Fed’s money injections stayed trapped in the banking system where excess reserves swelled. Broad money growth was tepid and the money multiplier collapsed. Today, the private sector is not deleveraging and M2 has surged at its fastest pace since 1944. Thanks to this lack of monetary bottlenecks, real interest rates fell much faster than in 2008/9 even if the nominal Fed Funds rate dropped to zero in both instances (Chart 28). Monetary conditions are therefore much more accommodative than they were 12 years ago. Another consequence of a functioning monetary system is that the broad money supply’s advance is outstripping the Treasury’s issuance. Historically, when money supply grows quicker than government debt, inflation emerges (Chart 29). We are tracking the velocity of money closely to gauge whether this risk is morphing into reality. Chart 28Policy Is More Accommodative Than During the GFC
bca.ems_ctm_2024_04_29_c6
Policy Is More Accommodative Than During the GFC
Policy Is More Accommodative Than During the GFC
Chart 29An Inflationary Risk
An Inflationary Risk
An Inflationary Risk
Ms. X: Before we move on to asset market forecasts for 2021, I would like to hear your thoughts on Brexit and the extraordinary showing of European unity last summer. BCA: We came very close to ending the Brexit transition period without a free-trade agreement between the UK and the EU. First, PM Boris Johnson had been under attack from the right wing of the Conservative party. In response, his government ramped up the hard rhetoric in recent months. However, the negative impact on the British economy in the absence of a free trade agreement with the EU was always a binding constraint on the PM. Hence, the tough rhetoric was mostly bluster and negotiation tactic with Brussels. Second, the electoral defeat of President Donald Trump in the US means that the UK is unlikely to receive preferential treatment from the US if it cannot reach a trade deal with the EU. The UK would be on its own, especially because President-Elect Joe Biden is likely to side with the EU, with whom he wants to rebuild a relationship. On the EU side, it is highly unlikely that Berlin will let French demands on fishing rights threaten its capacity to sell to its 5th export market. Thus, we expect a deal to come to fruition imminently. The move toward fiscal integration in Europe is also crucial beyond its near-term bullish impact on Italian, Spanish or Portuguese bonds. Jean Monnet, one of the architects of the 1951 Treaty of Paris that created the European Coal and Steel Community (the EU’s embryo), famously wrote in his memoirs that: “Europe will be forged in crises, and will be the sum of the solutions adopted for those crises.” We witnessed these dynamics last summer. The EUR750 billion Recovery Fund created by the European Commission to help economies struggling with the pandemic will issue its own bonds. It is the first step toward a permanent common bond issuance mechanism and fiscal risk sharing in the euro area. As expensive as stocks may be in absolute terms, the monetary and yield backdrop creates a large enough buffer for now. The experience of last decade’s euro crisis shows that temporary solutions often become permanent features of the EU, even if its treaties originally forbade them. The latest move will be no exception. The euro is popular; it is supported by 83%, 60%, 72%, 76% and 82% of the Spanish, Italian French, Dutch and German populations, respectively (Chart 30). Moreover, German support for the euro is particularly important. Germany’s current account surplus equals 7% of GDP because of the euro. The euro is a lot weaker than the Deutsche mark would be, which boosts German exporters’ competitiveness in international markets and within the euro area. Without the common currency, German cars would be much more expensive in France, Italy or China than they are today. Chart 30The Glue That Binds Europe Together
The Glue That Binds Europe Together
The Glue That Binds Europe Together
Likewise, the ECB Target II balance permanently attaches Germany to its weaker neighbors. Italy and Spain owe EUR 1 trillion to this settlement system while Germany is owed EUR915 billion. If Italy or Spain were to go bankrupt or to leave the euro and redenominate their debt in lira or pesetas, the resulting hit would threaten the viability of the German banking system (Chart 30, bottom panel). Chart 31Competitiveness Convergence
Competitiveness Convergence
Competitiveness Convergence
The past competitiveness problems of the European periphery are also steadily diminishing. Compared to Germany, harmonized unit labor costs in Italy or Spain have fallen 15% since 2009 and are not far from the levels prevailing at the introduction of the euro in 1999 (Chart 31). Consequently, current account deficits in Spain and Italy are narrowing considerably. Germany’s euro benefits, the tie created by the Target II imbalances and the periphery's improved competitiveness only bring Europe together and they allow the COVID-19 crisis to force a closer union. While these developments have little implication for Europe’s growth next year, they constitute a major long-term positive because they will curtail the cost of capital in the periphery and permit the sharing of funds necessary to build a lasting monetary union. Ms. X: To summarize; at the beginning of 2021, global growth should remain volatile. However, the recovery will ultimately strengthen over the remainder of the year thanks to the rollout of vaccines, the sustained fiscal support across major economies, the continued positive impact of China’s economic healing, and the strength of household balance sheets. Capex will remain robust as well, even if commercial real estate is a dangerous spot that we must monitor. Moreover, it is too early to ascertain whether the US or the EU will experience the strongest recovery in 2021, but emerging economies should lag behind. In addition, while you are concerned about the long-term inflation risk, consumer prices should not experience a durable pickup this year. Likewise, you foresee a benign outcome to the UK-EU trade negotiations and are positive on European integration. BCA: Yes, you summed it up nicely. Bond Market Prospects Ms. X: I find the Treasury market very puzzling right now. On the one hand, demanding valuations of US government bonds worry me, particularly in light of the upbeat economic outlook for 2021. On the other hand, if inflation remains low and the Fed is unlikely to push up rates until 2022 at the earliest, the upside for yields should be limited. BCA: We recommend a below-benchmark duration for fixed-income portfolios with an investment horizon of 12 months or so. Valuations partially underpin this recommendation. Our Global and US Bond Valuation Indices highlight that government bonds are at the level of overvaluation that, over the past 30 years, often produce a negative return in the following 12 months (Chart 32). However, valuations only indicate the degree of vulnerability of an asset but they rarely trigger price moves. Instead, timing most often relies on cyclical and technical factors. Favor cyclical equities relative to defensive ones. Cyclical forces are increasingly negative for bonds. In the US, our BCA Pipeline Inflation Indicator has perked up. It is not pointing toward an imminent rise in inflation but it suggests that deflationary risks are ebbing, something BCA’s Corporate Pricing Power Proxy also captures (Chart 33). A removal of the left-tail risk in CPI should push up yields, especially as our BCA Nominal Cyclical Spending Proxy is also firming, which normally happens ahead of meaningful yield pickups (Chart 33, bottom panel). Chart 32Pricey Bonds
Pricey Bonds
Pricey Bonds
Chart 33Cyclical Risks For Bond Prices
Cyclical Risks For Bond Prices
Cyclical Risks For Bond Prices
Chart 34Investors Will Want Protection Against Inflation Uncertainty
Investors Will Want Protection Against Inflation Uncertainty
Investors Will Want Protection Against Inflation Uncertainty
The odds of higher yields are most pronounced for longer maturities. First, our central forecast expects a significant rise in inflation in the latter part of the decade. Second, monetary and fiscal policy will remain very accommodative over the coming years even as private demand increases, which will lift medium- to long-term inflation uncertainty. Rising inflation uncertainty usually facilitates a steepening of the yield curve (Chart 34). Despite these forces, the upside to yields will prove limited in 2021. The Fed’s new inflation target means that it will be patient, and waiting for core PCE inflation to move sustainably above 2% could take time. The US central bank is therefore unlikely to increase interest rates for many years. This inertia limits the immediate upside in Treasury yields, but does not preclude it. While the Fed will not be quick to lift off, its forward interest rate guidance is not going to get any more dovish and the bond market is already pricing-in the first rate hike for late 2023. This expected liftoff date will be brought forward as the economy recovers, meaning that long-maturity nominal yields, real yields and inflation breakeven rates all have moderate upside. The recent equity market leadership of growth stocks is another limiting factor for higher yields. Growth stocks are extremely sensitive to long bond yields. If the latter back up too fast, it will scuttle bourses and unleash risk aversion and deflationary pressures. This creates an upper bound on the speed at which yields can move up. Mr. X: Even with their limited room to fall in the near term, the meaningful long-term and valuation risks of bonds make them so unappealing to me that I refrain from using them as near-term portfolio hedges. How can I protect my equity holdings right now? BCA: Hedging near-term risks to stocks has become one of the most hotly discussed topic with our clients because investors are witnessing the increasingly asymmetric payoffs of bonds. When equity prices rise, bond prices typically decline, but when stocks correct, bond prices barely rally. This newfound behavior of safe-haven bonds is a consequence of global policy rates having moved to or near their lower bound. We increasingly like small-cap firms relative to large-cap ones. For non-US based investors, there is a simple solution to this problem: parking some funds in US cash because the USD still acts as an effective hedge against market corrections. For US-based investors, finding adequate protection is more challenging. Those who can short and use leverage should sell currency pairs with an elevated sensitivity to changes in risk aversion, such as the EUR/CHF, AUD/JPY or MXN/JPY, to achieve some protection. Otherwise, holding cash to buy back stocks at lower levels remains an appropriate strategy. Mr. X: Which government bond market do you like most, or more accurately, which one should I avoid most right now? BCA: At the moment, we prefer the European periphery. The valuation ranking we often use when we see you is clear: Portuguese, Greek, Italian or Spanish bonds are the cheapest while German Bunds and US T-Notes are exceptionally expensive (Chart 35). Real bond yields confirm this estimation. Additionally, the nascent fiscal risk-sharing created by the European Commission’s Recovery Fund should result in declining breakup risk premia embedded in peripheral bonds. Furthermore, the ECB’s asset purchases are set to rise in response to Frankfurt’s efforts to fight off the deflationary effect of both the euro’s appreciation and the second wave’s lockdowns. Chart 35The Value Is In Europe’s Periphery
OUTLOOK 2021: A Brave New World
OUTLOOK 2021: A Brave New World
We are more negative on US Treasuries than Bunds. The valuation difference between the two safe havens is minimal. However, in 2020 the US has been more reflationary than Europe and the recent decline in the USD should lift US inflation relative to Germany’s, which will widen yield differentials in favor of Bund prices (Chart 36). Besides, the US economy has a higher potential GDP growth than Europe, which warrants a superior neutral rate of interest. Consequently, investors should expect US real yields to rise relative to the euro area’s benchmark. Outside of these markets, dedicated fixed-income investors should also overweight JGBs within their portfolio. JGBs have a low yield beta, which will limit their price declines if global yields move up. If the global recovery peters off, this feature will not create a major handicap because global yields have limited room to fall from here. Moreover, Japanese bonds are the cheapest safe haven (Chart 37). Chart 36Bunds vs Treasuries: Follow The Inflation Gap
Bunds vs Treasuries: Follow The Inflation Gap
Bunds vs Treasuries: Follow The Inflation Gap
Chart 37JGBs Are The More Attractive Safe Haven
OUTLOOK 2021: A Brave New World
OUTLOOK 2021: A Brave New World
We are neutral Canadian and Australian bonds. Historically, Canadian and Australian yields tend to have high betas to US T-Note yields. However, the BoC and the RBA are very active purchasers in their domestic markets, which will dampen the volatility of Canadian and Australian bonds. Ms. X: Considering the limited scope for major interest rate moves next year, what are your high-conviction trades for fixed-income portfolios? BCA: Within US government bond markets, we like curve steepeners. We also recommend positioning for rising inflation expectations by going overweight TIPS relative to nominal Treasuries. We particularly like real yield curve steepeners (within the TIPS curve). The cost of short-maturity inflation protection is below that of long-maturity protection, which means that short-term inflation breakeven rates have more upside as core PCE returns to the Fed’s target. A TIPS-curve steepener benefits from both a flattening of the inflation breakeven curve and a steepening of the nominal Treasury curve. It is therefore a high-octane play on both our favored strategies. We like both Europe and Japan. Within US corporate credit, we are currently overweight investment grade and Ba-rated high-yield bonds. However, valuation at the upper-end of the credit spectrum heavily favors tax-exempt municipal bonds over corporates. Investors that can take advantage of the tax exemption should prefer munis over investment grade corporates. Elsewhere, we are underweight MBS as pre-payment risk is elevated, but we like consumer ABS due to the strong position of household balance sheets. Ms. X: Before we moved on to equities, where do you stand on EM credit? Do you expect any global search for yield to push EM bond prices higher? BCA: With a few exceptions like Mexico and Russia, we prefer US corporate bonds to dollar denominated EM bonds of similar credit quality. EM bonds offer poorer value, but EM spreads will continue to evolve in line with US corporate spreads. Because of this directional correlation, our preference for US investment grade bonds translates to EM bonds as well. Our more circumspect attitude toward EM high-yield bonds also reflects our more conservative stance on US high-yield bonds. For local-currency rates, we are receivers in the swap market because the near-term outlook for EM currencies is difficult. Most EM countries have a deflation problem, not inflation troubles. Hence, real and nominal rates in emerging economies will fall as central banks try to stimulate their economies. These declines will be positive for the local-currency performance of EM bonds but it will hurt their currencies. Over the next twelve months, this challenge will be most pronounced against non-US DM currencies. In the short-term, this hindrance will also exist against the USD because the Greenback should rebound temporarily, something we can discuss in more detail in our chat about the currency and commodity markets. Our favorite bets are to receive Mexican, Colombian, Russian, Indian, Chinese and Korean swap rates. Mr. X: I agree that the case to make a major duration bet next year is limited, but risks are slightly skewed toward upside for yields. I am a little surprised that you like European peripheral bonds so much and yet prefer Bunds to Treasuries. I will have to digest your view on EM bonds because I would have bought EM currencies outright. Finally, I find your real yield curve steepener idea extremely intriguing. Thank you for giving me ideas to ponder. Now, shall we move to next year’s equity outlook? Equity Market Outlook Chart 38The Bubble Can Grow
The Bubble Can Grow
The Bubble Can Grow
Mr. X: I am a firm believer that growth stocks, tech in particular, are in a massive bubble. My daughter tries to convince me that we cannot generalize. Yet, both my gut and my brain tell me to seek refuge in value stocks. I appreciate that the outlook for tech stocks hinges on the evolution of monetary policy. Nonetheless, I think that any small shock can topple the so-called FANGs because they are so expensive and over-owned. I fear that where the FANGs go, so will the market. BCA: We have recently published a report broaching the question of bursting bubbles. When real interest rates are negative, when money supply is expanding at a double digit pace and when the Fed is extremely reluctant to tighten policy, the chances that a bubble will deflate are extremely low, even if stocks are furiously expensive (Chart 38). Beyond monetary tightening, an escalation in the supply of financial instruments also caused some bubbles to deflate. For example, an increase in the number of tulips following a harvest contributed to the end of the tulip mania. Bubbles from the eighteenth century, such as the South Sea Bubble and the Mississippi Company Bubble, followed stock issuances or regulatory changes. Even during the tech bubble, the large IPOs of the late 1990s added to the supply of securities available to investors. Right now, we are not witnessing this surge in supply. Buybacks, which are a contraction in supply, have acted as a key fuel to the bubble in the tech sector. Moreover, dominant tech titans have built large moats around their businesses because they often rely on pronounced network effects, if they are not a network themselves. These monopolistic behaviors account for their large profit margins, but they also prevent the emergence of viable competitors in the near term. Meanwhile, the mushrooming of Special Purpose Acquisition Companies (SPACs) is worrisome in the long-term. They are mostly vehicles to conduct backdoor IPOs of private firms. For now, they remain too small to topple the bubble. The real worry for tech investors is the eventual resurgence of inflation. During the tech bubble at the turn of the millennium, the rise in core CPI in early 2000 forced investors to discount more rate hikes, which toppled tech equities (Chart 39). As we discussed already, the outlook for inflation is benign for 2021, but if it were to change, tech stocks could fall in absolute terms. We expect tech names to underperform the S&P 500 over the next 12 months, but not to fall outright. This is akin to the experience of Japanese banks in the 1980s. In the first half of that decade, Japanese lenders stood at the forefront of the equity bubble. However, in the late 1980s, they lagged behind the rest of the Nikkei, even if they generated positive absolute returns (Chart 40). Chart 39Inflation Is The Threat To Tech Stocks
Inflation Is The Threat To Tech Stocks
Inflation Is The Threat To Tech Stocks
Chart 40Without Falling, Bubble Leaders Can Still Lag
Without Falling, Bubble Leaders Can Still Lag
Without Falling, Bubble Leaders Can Still Lag
Ms. X: I agree, it is hard to be too negative on stocks next year with the Fed standing firmly on the sidelines. What do you see as the market’s main driver in 2021 and what is the biggest risk to the outlook? BCA: Many important factors underpin global equities. First, we still are in the early innings of a new business cycle upswing. Statistically, bull markets most often end when earnings permanently decline. This observation means that equity bear markets rarely develop in the absence of recession (Chart 41). Chart 41Recessions And Bear Markets Travel Together
Recessions And Bear Markets Travel Together
Recessions And Bear Markets Travel Together
Second, as expensive as stocks may be in absolute terms, the monetary and yield backdrop creates a large enough buffer for now. The combination of our Valuation and Monetary Indicators remains in low-risk territory, which historically is consistent with positive absolute returns for the S&P 500 over the coming 12 to 18 months (Chart 42). However, the gap between the two indicators is narrower than it was last spring, which suggests that the easy market gains lie behind us. Another tool to think about valuations is the Equity Risk Premium. Our measure, which adjusts for the lack of stationarity of the ERP’s mean as well as for the expected growth of cash flows, is not as wide as it was in Q2 or Q3, but it remains congruent with positive prospective equity returns (Chart 43). Chart 42Monetary Policy Beats Valuations, For Now
Monetary Policy Beats Valuations, For Now
Monetary Policy Beats Valuations, For Now
Chart 43The ERP Points To Positive Stock Returns in 2021
The ERP Points To Positive Stock Returns in 2021
The ERP Points To Positive Stock Returns in 2021
Third, forward earnings estimates will rise further. The gap between the Backlog of Orders and the Customers’ Inventories subcomponents of the ISM survey indicates that earnings revisions will continue to climb from here (Chart 44). Additionally, our Corporate Pricing Power Proxy is back into neutral territory after having flashed dangerous deflationary pressures. Thanks to the operating leverage embedded in equities, improving selling prices can quickly push the bottom line higher (Chart 45). The rollout of vaccines next year will only feed these dynamics and help profit growth even further. Chart 44Room For Positive Earnings Revisions
Room For Positive Earnings Revisions
Room For Positive Earnings Revisions
Chart 45Less Deflation Is Good For Earnings
Less Deflation Is Good For Earnings
Less Deflation Is Good For Earnings
Fourth, our benign expectations for the credit market is consistent with both higher multiples and earnings. A well-functioning credit market is essential to risk taking and multiples. It also allows capex to remain well sustained and cyclical spending to expand. Both these forces are bullish for profits. Fifth, our negative stance on the dollar will ease global financial conditions. A weaker dollar pushes down the global cost of capital, which strengthens the global industrial cycle. Global stock markets overweight the industrial and goods sectors relative to the economy. Therefore, global bourses benefit from a weaker dollar. The greatest risk for stocks is an uncontrolled jump in bond yields, where 10-year Treasury yields climb above 1.2% in a short period, especially if real rates drive the leap. Too quick an adjustment in the cost of capital would threaten the ERP and it would hurt the multiples of growth stocks that are highly sensitive to fluctuations in the discount rate. Moreover, a rapid rise in borrowing costs would likely force a more precipitous deceleration in the housing sector, which is a key locomotive of the recovery. Another risk is that vaccine rollouts are delayed, which would rapidly sap growth expectations. Mr. X: Rather than taking a large net long exposure in equities, I would favor value stocks at the expense of growth stocks. The valuation gap between both styles is exceptionally wide, and value equities have not been this cheap on a relative basis since at least 2000, or more, depending on the indices used . As a result, they embed a much greater margin of safety than growth stocks, which makes me rest easier because I am less comfortable than you are about this equity bubble’s near-term prospects. Chart 46Favor Cyclicals Over Defensives
Favor Cyclicals Over Defensives
Favor Cyclicals Over Defensives
Ms. X: As I mentioned at the beginning of our chat, I, however, prefer growth stocks. The sectors most represented in the value indices face secular headwinds such as low rates, a move away from carbon, and the increasing role of software, not goods, as the source of value added in our economies. Meanwhile, growth stocks also benefit from the aging of the population, the historically low trend growth rate of the global economy, and the network effects, which protect the profit margins of large tech firms. As you can see, my father and I have been clashing on this topic. Where do you stand? BCA: Within the firm, we have had our disagreements on this topic as well. One thing we all agree upon is that the growth-versus-value debate amounts to a sector call. One common preference we share is to favor cyclical equities relative to defensive ones. Over the coming 12 months, a weak dollar, rising inflation expectations, the strengthening of the Chinese and global economy and improving capex will all conspire to boost the profit and multiples of cyclical stocks at the expense of defensive sectors (Chart 46). Nonetheless, if the Chinese economy starts to slow in the second half of 2021, we will have to evaluate if this bet remains valid. Within the cyclicals, we prefer the more traditional ones, like industrials and materials at the expense of the tech sector. The expected growth rate embedded in tech stocks is extremely elevated compared to the rest of the market in general and other cyclicals in particular (Chart 47). This aggressive pricing is rooted in the recent experience, whereby tech earnings significantly outperformed the rest of the market. However, this outperformance mirrored strong sales of techs goods and services during the pandemic, when households and firms prepared for long lockdowns and remote working. Gravity-defying sales in the midst of the deepest recession in 90 years stole demand away from the future. Now that the economy recovers, pent-up demand for tech goods is smaller than for other categories of cyclical spending. Thus, the current pricing of tech earnings growth leaves room for disappointments. Within traditional cyclicals, financials are a question mark. The broadening of the economic reopening subsequent to the rollout of the vaccines is positive for the quality of banks’ loan books. However, the scope for yields to rise is restricted, which will limit how steep the yield curve will become and how wide net interest margins will swell. Thus, for 2021, industrials and materials remain our favored sectors. Chart 47Too Much Earnings Optimism For Tech Stocks
Too Much Earnings Optimism For Tech Stocks
Too Much Earnings Optimism For Tech Stocks
We also favor a basket of “back to work” stocks at the expense of “COVID-19 winners”. With vaccines coming through next year, this trade has further to run. The first group includes some airlines, hotels, oil producers, restaurant operators, capital goods manufacturers, credit card companies, automobile manufacturers and a steel producer.1 The second basket includes a bankruptcy consultant, a software company, some grocers, some biotech names, a Big Pharma company, a large e-commerce business, an online streaming service, a teleconferencing company and two household products leaders.2 For the next 12 to 18 months, we favor value stocks at the expense of growth stocks, which is a consequence of our preference for traditional cyclical names and of the “back to work” names. Moreover, since 2008, periods of economic acceleration correspond to quicker earnings growth of value stocks compared to growth equities (Chart 48). Additionally, if bond yields move up – even if not much, the multiples of value stocks should expand relative to growth firms (Chart 48, bottom panel). We also increasingly like small-cap firms relative to large-cap ones. Small cap indices have substantial underweights in healthcare and tech names, which contrasts with the S&P 500 or the S&P 100. Accordingly, the Russell 2000 both has a cyclical and value bend relative to large-cap benchmarks. Moreover, small call equities outperform the S&P 500 when the dollar declines and when commodity prices appreciate (Chart 49). Additionally, the recent sharp rebound in US railroad freight volumes will support the more-cyclical Russell 2000. Besides, greater shipments lead to upgrades of junk-bond credit ratings, which decreases the perceived riskiness of the heavily levered small cap firms (Chart 50). Chart 48Value Investors Will Like 2021
Value Investors Will Like 2021
Value Investors Will Like 2021
Chart 49The Case For Small Cap Stocks, Part I
The Case For Small Cap Stocks, Part I
The Case For Small Cap Stocks, Part I
Chart 50The Case For Small Cap Stocks, Part II
The Case For Small Cap Stocks, Part II
The Case For Small Cap Stocks, Part II
The long-term picture is less clear. Many key supports for growth stocks remain in place. Principally, the aging of the population and the risk of rising inflation in the second half of the decade should flatter healthcare stocks. In addition, the wide profit margins of tech stocks are unlikely to fully mean-revert because firms like Amazon, Google or Microsoft benefit from monopolistic positions that have decoupled their profitability from their capital stock. For now, the biggest risk to these sectors would be a regulatory onslaught from Washington and Brussels. Meanwhile, the sectors composing value indices suffer from the structural headwinds that Ms. X already noted. Counterbalancing this narrative, the extreme relative overvaluation of growth stocks suggests that their prices reflect these long-term forces already. On a very near-term basis (next two to three months), the rapid rise in investor sentiment as well as the collapse in the put-call ratio are consistent with a correction or sideways move in equities (Chart 51). When this correction materializes, no meaningful trend in growth relative to value stocks should emerge. Therefore, we recommend tactical traders play relative value within growth stocks and within value equities, where overextended sectors should correct. Within growth, we would like to rotate away from tech into healthcare. Within value, the next three months should reward financials at the expense of materials. Chart 51Near-Term Risks For Stocks
Near-Term Risks For Stocks
Near-Term Risks For Stocks
Ms. X: Based on these sectoral views, I gather you would underweight the US market. But where do you stand on emerging markets? BCA: You are correct, in 2021, we expect US equities to underperform the rest of the world. Their large weight in healthcare combined with the low beta of the US economy to global growth gives a defensive twist to the S&P 500. In addition to healthcare, the most significant overweight in the US equity benchmark is tech, which reinforces the growth style of US stocks. The US’s tech overweight is greater than appears because US communication services and consumer discretionary sectors are mostly tech names such as Facebook, Google, Netflix or Amazon (Table 3). Finally, our bearish outlook on the USD creates an additional hurdle for US equities relative to the rest of the world (Chart 52). Table 3Sector Representation In Various Regions
OUTLOOK 2021: A Brave New World
OUTLOOK 2021: A Brave New World
While we like both Europe and Japan, the latter stands out for 2021. Japanese stocks have particularly large allocations to the most attractive deep cyclicals (industrial and consumer discretionary equities) and are very cheap, even on a sector-to-sector comparison (Chart 53). To like Japan, we do not need to bet on a multiples convergence. This equity market’s low valuations mean that we are buying each unit of profit growth at a discount to the same sectors in the rest of the world. As a result, Japanese equities are more levered to our positive view on the earnings of deep cyclicals than any other major bourse. Chart 52US Stocks Underperform When The Dollar Weakens
US Stocks Underperform When The Dollar Weakens
US Stocks Underperform When The Dollar Weakens
Chart 53Japan Offers The Right Exposure At The Right Price
OUTLOOK 2021: A Brave New World
OUTLOOK 2021: A Brave New World
Finally, we are neutral on EM stocks. We like them more than US equities but less than Japan or Europe. EM stocks will benefit from a weaker dollar, but they have become tightly correlated to the NASDAQ due to the leadership of a few large tech names in Asia. Essentially, like the US, EM stocks have a very large weighting in the tech sector. If our view is correct that growth underperforms value next year, North Asian EM, which have driven EM stocks since March, will lag behind Latin America in 2021. Mr X: Thank you for your thoughts on equities. I agree that a monetary shock normally is needed to burst bubbles, but I also worry that the current extreme overvaluation of tech stocks could lead to gravity taking hold without the help of the Fed. This means that I am slightly less confident than you are that equities will rise this year. However, I agree with you that value stocks should beat growth stocks and that US equities should become the laggards after years of leadership. Ms. X: Should we move on to the currency and commodity markets? Currencies And Commodities Chart 54The Dollar Is Vulnerable Technically
OUTLOOK 2021: A Brave New World
OUTLOOK 2021: A Brave New World
Mr. X: I was skeptical last year, but your bearish dollar view panned out very well. However, you did not get its cause correctly. For one, you were constructive on global growth and consequently, negative on the dollar. I am skeptical that the dollar will depreciate much further in 2021 because it possesses a considerable yield advantage over other G-10 currencies. BCA: Today, the dollar sits at a critical spot. As you mentioned, we were negative on the USD last year; since then, it has breached all the major trend lines that have defined its bull market over the past nine years (Chart 54). This technical configuration suggests that more weakness is in store. One thing is very clear, dollar bulls have gone missing. Speculators are heavily selling the USD. Bullish sentiment on the euro is at its most elevated level in a decade. Historically, when it faces such one-sided negativity, the dollar enjoys temporary rebounds. Nonetheless, the DXY’s upside should be limited, at 2-4%, not more. A few forces cap the dollar’s upside. The currencies with the most upside against the dollar in 2021 are the European currencies. The liquidity crunch that handicapped global markets in March is over. Most foreign central banks have ample access to dollar liquidity and do not rely on the Fed anymore, as its outstanding swap lines stand close to zero (Chart 55). In 2009, this was a clear signal that the dollar liquidity shortage was behind us. The Fed has increased its supply of domestic currency more aggressively than other central banks. Today, interest rates around the world are at zero. Therefore, central banks’ balance sheet policy and forward guidance are the main tools to communicate the future path of interest rates. Chart 56 shows that other G-10 central banks have been lagging the Fed in terms of their balance sheet expansion. This has hurt the dollar and benefitted other currencies. Chart 55No More Liquidity Crunch
No More Liquidity Crunch
No More Liquidity Crunch
Chart 56Currencies Respond To Balance Sheets
Currencies Respond To Balance Sheets
Currencies Respond To Balance Sheets
US growth is lagging the rest of the world. This might not last, but growth differentials will continue to drive the performance of currencies, as they did in recent years. The November PMIs showed that the US economy held up well, but 2021 growth expectations from the IMF and other agencies favor the Eurozone. Finally, we are also deeply uncomfortable with negative interest rates. However, negative rates are the symptom and not the disease. China has positive interest rates because its domestic demand is strong. Europe or Japan are very sensitive to Chinese growth, which could cause the US rate advantage to evaporate. Ms. X: Earlier, you mentioned that the dollar is the perfect hedge for non-US based investors, which is a view I share. Are there any other currencies outside the dollar that we should hold that provide some safety? BCA: The currencies with the most upside against the dollar in 2021 are the European currencies, especially the Norwegian krone and the Swedish krona. They are the most undervalued currencies within the G-10, and they offer some margin of safety. While less attractive than the Scandinavian currencies, the pound will nonetheless appreciate more than the euro next year. Even if most currencies should gain against the USD, the yen is the one that will offer the most protective ability in a portfolio. It would be an excellent defensive complement to the dollar for investors looking to hedge portfolio risk. Gold will not perform effectively as a deflation hedge, but its ability to protect portfolios against long-term inflation risks remains intact. First, the yen is cheap. Over the years, falling Japanese price levels have tremendously improved the value of the yen. This cheapness makes Japanese equities an attractive investment, especially on an unhedged basis. These unhedged flows into Japan are very positive for the yen. Second, Japan offers the highest real interest rates in the G10. This attribute will incite investors to purchase JGBs. Moreover, Japanese investors could represent a major source of fixed-income flows into the country because of a large proportion of US Treasuries will mature, which will invite repatriation flows. Chart 57The Yen Likes A Weaker USD
The Yen Likes A Weaker USD
The Yen Likes A Weaker USD
Finally, the yen is a low beta currency versus the USD. Both the DXY and the USD/JPY are positively correlated, thus when the dollar declines, the yen rises, but less so than other currencies (Chart 57). This means that when global equity markets enter risk-off phases, the yen appreciates against non-dollar currencies, but it loses less value against these same currencies when markets are rallying. This places the yen in a very enviable “heads I win, tails I don’t lose too much” position, which is what we need out of a portfolio hedge. Mr. X: I find it difficult to share your enthusiasm for the yen, but I agree that it is an interesting portfolio hedge. Nonetheless, my precious metals still provide me with a lot more comfort than any fiat currencies. Moving to commodities; it has been a remarkable year. Oil was crushed by the COVID-19 pandemic – more so than other commodities. Crude now appears to be attempting a comeback. Gold did well this year, but it recently dipped below $1,800/oz., and seems to be struggling to get back above that level. Let’s start with oil. Where do you see it going and how should we play it? BCA: Oil is about one principle: Supply and demand have to clear the market. Even more than with other commodities, the COVID-19 pandemic clobbered oil demand, especially those segments of the market tied to transportation, such as motor fuels (gasoline and diesel fuel), jet and marine fuels. While the news around vaccines are encouraging, it will be months before these treatments are available on the massive scale required to revive transportation demand. Chart 58Crude Forecasts
Crude Forecasts
Crude Forecasts
Ms. X: Are you saying the oil prices will remain depressed in 2021? BCA: Not really. We expect demand to recover following local – as opposed to national – lockdowns in the US and Europe. This process will become evident even before the vaccines have been rolled out on a large-enough scale to affect transportation demand. The impact on energy demand of the vaccines themselves should become visible toward the end of the first half of 2021. On the supply side, we believe the producer coalition lead by Saudi Arabia and Russia will continue to adjust supply to meet demand. Hence, global oil inventories will fall further, which will tighten the market. Based on these supply/demand dynamics, Brent crude-oil prices will average $63/bbl next year, which is above the forward curve in oil markets (Chart 58). Mr. X: Oil-market risk seems very difficult to pin down right now. Do you expect downside or upside risks to dominate prices next year? BCA: At the current juncture, risks to the oil market are exceptionally two-sided. On the downside, with the exception of China, most major economies have been unable to control the rapid spread of COVID-19. If the health crisis lingers, oil demand could remain weaker than our base case anticipates. On the upside, Big Pharma has acted with unprecedented speed in developing vaccines to combat this coronavirus. Netting all these forces out, the balance of risks, in our view, favors the upside, as our price forecast indicates. Mr. X: Thank you. I would like to move on to gold. You mentioned that the dollar was your favourite hedge against equity risk for non-US based investors. As I mentioned earlier, I tend to prefer gold. BCA: Gold and the US dollar are both safe-haven assets; when risk aversion and uncertainty increase, investors buy both these assets to hedge their portfolios. Typically, a weaker dollar is good for gold, and vice versa. The past four or five years have been extraordinarily uncertain – trade wars, political uncertainty, the global rise of nationalist populism, the COVID-19 pandemic, you name it. All of these factors drove investors to hold dollars and gold at the same time. While the bullish dollar forces are dissipating, we cannot say the same for gold. The Fed is committed to maintaining an ultra-accommodative monetary policy indefinitely, which, along with the US government’s ever-expanding budget deficits, will keep the supply of money and credit extremely high for years. As we already argued, this policy setup will have a positive impact on inflation expectations. On the geopolitical front, even if the Sino-US tensions become less acute in the near-term, an undercurrent of distrust and rivalry will prevail. This combination will let bullion prices reach $2,000/oz. next year. Despite these positive fundamentals, gold will not hedge portfolios well against temporary deflationary shocks. Stuck at their lower bound, interest rates cannot decline any more. Consequently, negative growth shocks weigh on inflation expectations, which lifts real interest rate and the dollar, albeit briefly. This process is bearish for gold. Thus, gold will not perform effectively as a deflation hedge, but its ability to protect portfolios against long-term inflation risks remains intact. Mr. X: Thank you. Any other natural resource you would highlight for 2021? BCA: In our research, we heavily focus on the evolution of the global economy toward a low-carbon regime. Hence, we have opened up a whole line of investigation on CO2 markets, particularly in the EU, which is the largest such venue in the world. We are expecting it to become a leading indicator of global efforts to price carbon going forward. On a related note, we are very interested in the buildout and modernization of China’s electric grid as it embarks on its 14th Five-Year Plan in 2021. Similar efforts are arising globally. We think this will be very important for base metals prices, particularly copper and aluminium. Geopolitics Mr. X: Before we conclude, let us talk about global geopolitical risks. The past two years were replete with tensions, many stocked by the Trump administration. Does a change of leadership in the US will fundamentally alter global relations, especially between the US and China? Chart 59Peak US Polarization
Peak US Polarization
Peak US Polarization
BCA: The fundamental geopolitical dynamic at the outset of the 2020s is the division of the United States and the rise of China. The sharp increase in US political polarization began with the decline of a common enemy, the Soviet Union, in the 1980s. Pro-growth policies that widened the wealth gap, and a series of political, military, economic, and financial shocks in the twenty-first century, drove polarization to levels not witnessed since the late nineteenth and early twentieth centuries. The anti-establishment Trump administration marked the latest peak in polarization (Chart 59). Now, in 2020, the Democratic Party-led political establishment has reclaimed the White House, but only narrowly. The popular vote was roughly evenly divided (47% to 51%) and the Republicans have likely retained the Senate. Because the popular vote and Electoral College vote are now aligned, and because Biden looks limited to center-left policies, polarization is likely to come off its highs. But it will remain elevated due to gridlock in Congress and persistent socio-economic disparities. President Xi Jinping’s “New Era” has led to a backlash from foreign powers. Polarization is globally relevant because it increases uncertainty over the US’s role in the world, particularly on fiscal policy and foreign policy. At home, gridlock produces periodic budget crises that weigh on global risk appetite. Abroad, partisanship causes new presidents to reverse the foreign policies of their predecessors (see President Obama on Iraq and President Trump on Iran). These dramatic reversals increase global policy uncertainty and geopolitical risk (Chart 60). Chart 60A Bull Market In Policy Uncertainty
A Bull Market In Policy Uncertainty
A Bull Market In Policy Uncertainty
As the US descended into internal partisan conflict, China expanded its global influence. In the wake of the 2008 crisis, the Communist Party was forced to change its national strategy to better handle demographic decline, structural economic transition, rising social ills, and foreign protectionism. Slower trend growth increases long-term risks to single-party rule, forcing the CCP to shift the basis of its legitimacy from rapid income growth to Chinese nationalism. Hence Beijing has aggressively sought a technological “Great Leap Forward” to improve productivity while adopting a much more assertive foreign policy to build a sphere of influence in Asia Pacific. President Xi Jinping’s “New Era” has led to a backlash from foreign powers, most markedly with COVID-19 but also with the removal of Hong Kong’s autonomy, saber-rattling in neighboring seas, and politically motivated boycotts of neighboring countries like Australia. The sharp decline in China’s international image has occurred despite the damage that President Trump did to America’s image at the same time (Chart 61). The Xi administration is not likely to change course anytime soon as it seeks to consolidate power even further ahead of the critical 2022 leadership transition. Chart 61A Broadening Distrust Of China
OUTLOOK 2021: A Brave New World
OUTLOOK 2021: A Brave New World
American polarization and Chinese nationalism are a dangerous combination. China is increasingly fearful of US containment policy and is adopting a new five-year plan built on accelerating its quest for economic self-sufficiency and technological leadership. The US is fearful of China as the first peer competitor that it has faced since the Soviet Union, and one of the few sources of national unity is the bipartisan agenda of confronting China over its illiberal policies. The Biden administration will mark the third US presidency in a row whose foreign policy will be preoccupied with how to handle Beijing. With Biden likely facing gridlock at home, and likely a one-term president due to old age, his administration will largely amount to restoring the Obama administration’s policies. Internationally, this means an attempt to rejoin or renegotiate the Iranian nuclear deal of 2015 so that the US can reduce its involvement in the Middle East and pivot to Asia. Assuming that any American or Israeli action against Iran in the waning days of the Trump administration is limited, Biden will probably achieve a temporary solution with Iran, which otherwise faces economic collapse just ahead of a critical presidential election and eventual succession of the supreme leader. But the process could involve force or the threat of force before a solution is reached, and this would temporarily trouble markets. The greatest geopolitical opportunity in 2021 lies in Europe. Biden will also seek to re-engage China to manage the dangerous rise in tensions, while making amends with US allies for Trump’s “America First” approach. There is already a tension between Biden’s commitment to multilateralism and his need to get things done. The Trump tariffs are viewed as illegal according to the WTO but give Biden leverage over China. Biden is forced to confront China and Russia over their authoritarian actions, but he also needs their assistance on Iran and North Korea. Meanwhile unforeseen crises will emerge, likely in emerging markets badly shaken by this year’s deep recession. Chart 62The Taiwan Strait Is The Top Geopolitical Risk In 2021
OUTLOOK 2021: A Brave New World
OUTLOOK 2021: A Brave New World
The greatest geopolitical risk in 2021 lies in the Taiwan Strait. If China becomes convinced that Biden is not attempting a real diplomatic reset, but is instead pursuing a full-fledged containment policy and technological blockade, then it will be increasingly aggressive over rising Taiwanese pro-independence sentiment (Chart 62). A fourth Taiwan Strait crisis is still possible and would have a cataclysmic impact on markets. But Biden will start by trying to lower tensions with Beijing, which is positive for global equity markets until otherwise indicated. China’s long-run strategy has paid off in Hong Kong so it will likely think long-term on Taiwanese matters as well. Ms. X: In your opinion, which region will experience the greatest geopolitical tailwind next year? The greatest geopolitical opportunity in 2021 lies in Europe. The UK will likely be forced to accept a trade deal with the EU for the sake of the economy and internal unity with Scotland. Meanwhile Trump will not be able to impose sweeping unilateral tariffs on Europe and his maximum pressure policy on Iran will dissipate, reducing the risk of a major war in the Middle East. Germany’s transition from the era of Chancellor Angela Merkel will bring debates and concerns, but Germany is fundamentally stable and its agreement with France to upgrade European solidarity puts a lid on Italian political risk as well (Chart 63). Russia remains aggressive, but it is increasingly worried about domestic stability, and now faces an onslaught of democracy promotion from the Biden administration. Chart 63EU Solidarity Is The Top Geopolitical Opportunity In 2021
EU Solidarity Is The Top Geopolitical Opportunity In 2021
EU Solidarity Is The Top Geopolitical Opportunity In 2021
Investors are rightly optimistic about 2021 because of the vaccine for COVID-19 are the reduction in global policy uncertainty and geopolitical risk as a result of the change in the White House. But a lot of optimism is being priced as we go to press, whereas the US-China and US-Russia rivalries have gotten consistently more dangerous since 2008. While geopolitical risk is abating from the extreme peaks of 2019-20, it will remain elevated in 2021 and the years after. Conclusions Mr. X: This is a good place to conclude our discussion. We have covered a lot of ground but I remain deeply concerned. On the one hand, the global reflationary policies forced through the system this year remains positive for risk assets. On the other, valuations of both stocks and bonds are uncomfortably stretched for my taste. Moreover, the pandemic is still not under control and while the news on the vaccine front is encouraging, the economy still has ample room to negatively surprise next year. Furthermore, I find the long-term picture particularly concerning, especially if inflation and populism rear their ugly heads. As a result, while I feel like I must be invested in equities rights now, I prefer to slant my portfolio toward value stocks and to keep generous holdings of cash and gold to protect myself. Ms. X: I agree with my father that the uncertain nature of the evolution of the pandemic, especially when contrasted with the demanding valuations of equities, creates many risks for investors. Nonetheless, I do not expect inflation to come back anytime soon. Thus, monetary policy will not become a threat in the near future. Moreover, I am quite optimistic on the earnings outlook. Accordingly, I am more comfortable than my father is with taking some risk in our portfolio this year, even if a slightly larger-than-normal allocation to cash and gold is reasonable. Unlike the BCA team, I believe growth stocks, not value stocks, will generate excess returns from equities in the coming years. Thus, I favor US markets and I am less negative on the US dollar than you are. BCA: Your family debate mirrors our own internal discussions. There is always a trade-off between maximizing short-term returns and taking a longer-term approach to investing. Nonetheless, many assets have become more expensive this year and long-term inflation risks are increasing. Thus, real long-term returns are likely to be uninspiring compared to recent history. Table 4 shows our baseline calculations of what a balanced portfolio will earn over the coming decade. We estimate that such a portfolio will deliver average annual returns of 4.0% over the next ten years, or 1.0% after adjusting for inflation. That is a deterioration from our inflation-adjusted estimate of 2.4% from last year, and also still well below the 6.1% real return that a balanced portfolio earned between 1990 and 2020. Table 4Lower Long-Term Returns
OUTLOOK 2021: A Brave New World
OUTLOOK 2021: A Brave New World
The uncertainty around the base case scenario for the global economy and asset markets remains very large. Hence, as we did last year, we recommend a list of guideposts to evaluate whether global markets stay on track to generate gains in 2021: The rollout of the vaccines: Much of the outlook will depend on the global health crisis. As the recent weeks have shown, the subsequent waves of COVID-19 are still debilitating and deadly, even if recent lockdowns are not as stringent as in the spring. Thus, if the vaccines take longer to be distributed, the economy will suffer a greater risk of relapse, which will hurt asset prices. Realized and expected inflation: If both realized and expected inflation rise quickly, the market will price in a faster withdrawal of monetary accommodation. The market is too expensive to withstand this shock, which would prove more painful than another wave of lockdowns. A stronger dollar and a flattening yield curve: If these two phenomena develop in tandem, this will indicate that the global economy is suffering another deflationary shock. Because fiscal and monetary authorities remain on guard, this may not force any meaningful equity correction. However, growth stocks and defensive names will outperform the rest of the market. US diplomacy: Starting January 20, a new president will occupy the Oval Office. Markets have rejoiced at the anticipation of a more conciliatory approach by the US toward its allies and commercial partners. If the US proves colder than expected, markets will have to reprice their optimistic take on global relations. Bank health: We expect sour commercial real estate loans to create limited damage to the banking system. If we are wrong, credit standards will tighten further instead of easing. This would be a bad omen for global demand and would suggest that yields have downside and that growth stocks would beat value stocks. Fiscal policy: We expect fiscal policy to remain accommodative next year, even if less so than in 2020. An absence of a deal in Washington and a quicker return to fiscal rectitude in the rest of the world would mean that global growth will be weaker than we expect. This would impact equities negatively, especially value stocks. Ms. X: Thank you for this list of variables to monitor. As always, you have left us with much to think about. We look forward to these discussions every year. Before we conclude, it would be helpful to have a recap of your key views. BCA: It would be our pleasure. The key points are as follows: In 2021, stocks will outperform bonds thanks to the global economic recovery, the lack of immediate inflationary pressures and the prospects of a resolution to the pandemic. Imbalances in the global economy are growing, and the explosion in debt loads witnessed this year will carry significant future costs. Rising inflation is the most likely long-term consequence because of rising populism and the meaningful chance of financial repression. This change in inflation dynamics will generate poor long-term returns for a 60/40 portfolio, especially because asset valuations are so expensive. Compared to the past two years, geopolitical uncertainty will recede in 2021, but will remain elevated by historical standards. China and the US are interlocked in a structural rivalry, which means that flashpoints, such as Taiwanese independence, will remain a source of tensions. Europe will enjoy geopolitical tailwinds next year. For now, no central bank or government wants to remove economic support too quickly. Monetary policy will remain very stimulative as long as inflation is low, which means no tightening until late 2022, at the earliest. Fiscal deficits will narrow, but more slowly than private savings will decline. The US will grow faster than potential thanks to this policy backdrop. Moreover, household finances are robust and industrial firms are taking advantage of low interest rates as well as surprisingly resilient goods demand to increase their capex plans. Outside of the US, China’s stimulus and an inventory restocking will fuel a continued upswing in the global industrial cycle that will push 2021 GDP growth well above trend. However, at the beginning of the year, we will likely feel the remnants of the lockdowns currently engulfing Western economies. The uncertainty around the base case scenario for the global economy and asset markets remains very large. Bond yields can rise next year, but not by much. Ebbing deflationary pressures and the global industrial cycle upswing will lift T-Note and T-Bond yields. However, the extremely low probability of monetary tightening in 2021 and 2022 will create a ceiling for yields. We favor peripheral European bonds at the expense of German Bunds and US Treasuries. Corporate spreads should stay contained thanks to a very easy policy backdrop and the positive impact on cash flows and defaults of the ongoing recovery. We also like municipal bonds but worry about pre-payment risks for MBS. Global stocks should enjoy a robust advance in 2021, even if the market’s gains will be smaller and more volatile than from March 2020 to today. Easy monetary conditions will buttress valuations while recovering economic activity will support earning expectations. Within equities, we favor cyclical versus defensive names and value stocks relative to growth stocks. As a corollary, we prefer small cap to large cap and foreign DM-equities to US equities. We are neutral on EM equities due to their large tech sector weighting. The dollar bear market is set to continue, and high-beta European currencies will benefit most. The yen remains an attractive portfolio hedge. Oil and gold have upside next year. Crude will benefit from both supply-side discipline and a recovery in oil demand. Gold will strengthen as global central banks will maintain extremely accommodative conditions and global fiscal authorities will remain generous. A weaker dollar will flatter both commodities. A balanced portfolio is likely to generate average returns of only 1.0% a year in real terms over the next decade. This compares to average returns of around 6.1% a year between 1990 and 2020. We sincerely hope that next year, we will get to see each other in person instead of via computer screens. Finally, we would like to take this opportunity to wish you and all of our clients a very peaceful, healthy and prosperous New Year. The Editors November 30, 2020 Footnotes 1 The tickers of the stocks in the “back to work” basket are: LUV, DAL, MAR, HLT, CVX, EOG, SBUX, MCD, CAT, HON, AXP, COF, NUE, GM. 2 The tickers of the stocks in the “COVID-19 winners” basket are: TDOC, FCN, ZM, CTXS, JNJ, AMGN, REGN, CLX, RBGLY, WMT, COST, KR, NFLX, AMZN.
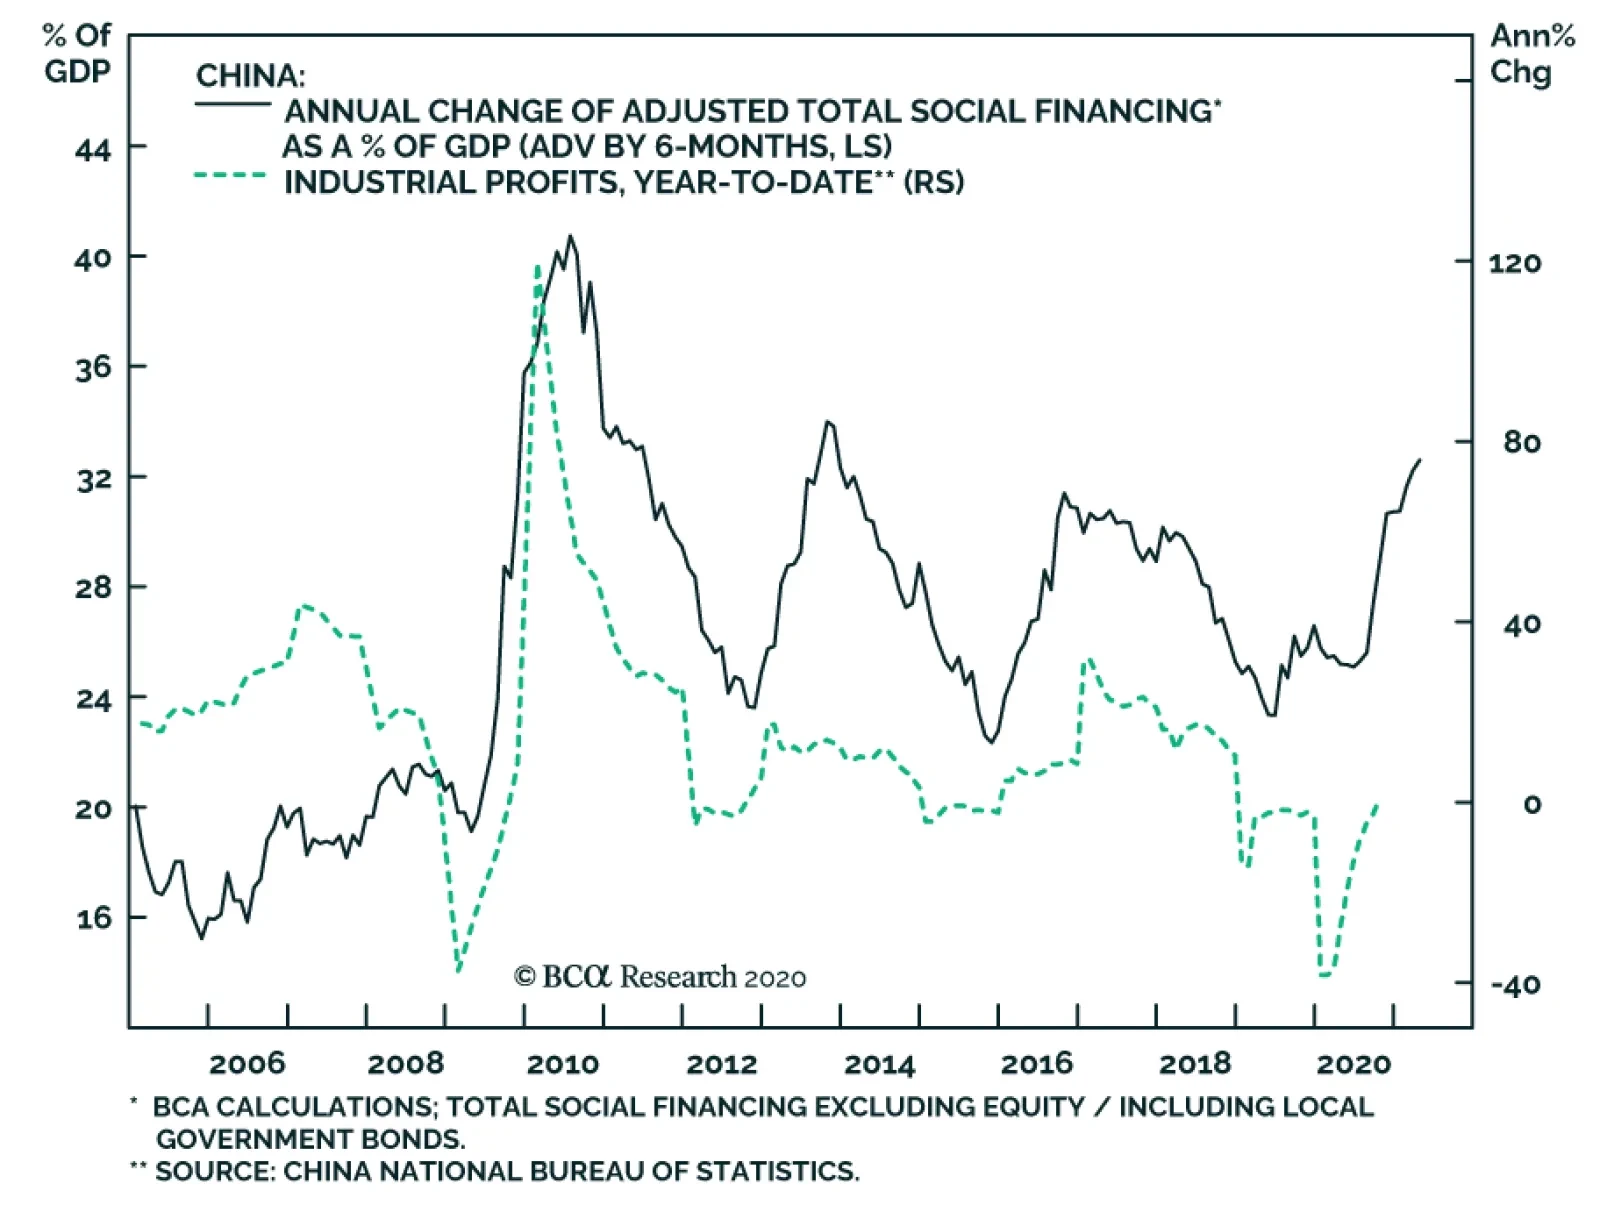
China’s industrial profits rose by a headline-grabbing 28.2% on a year-on-year (y/y) basis in October from 10.1% y/y the prior month. However, the data print overstates the underlying conditions. For one, the strong figure in part reflects a catching-up…
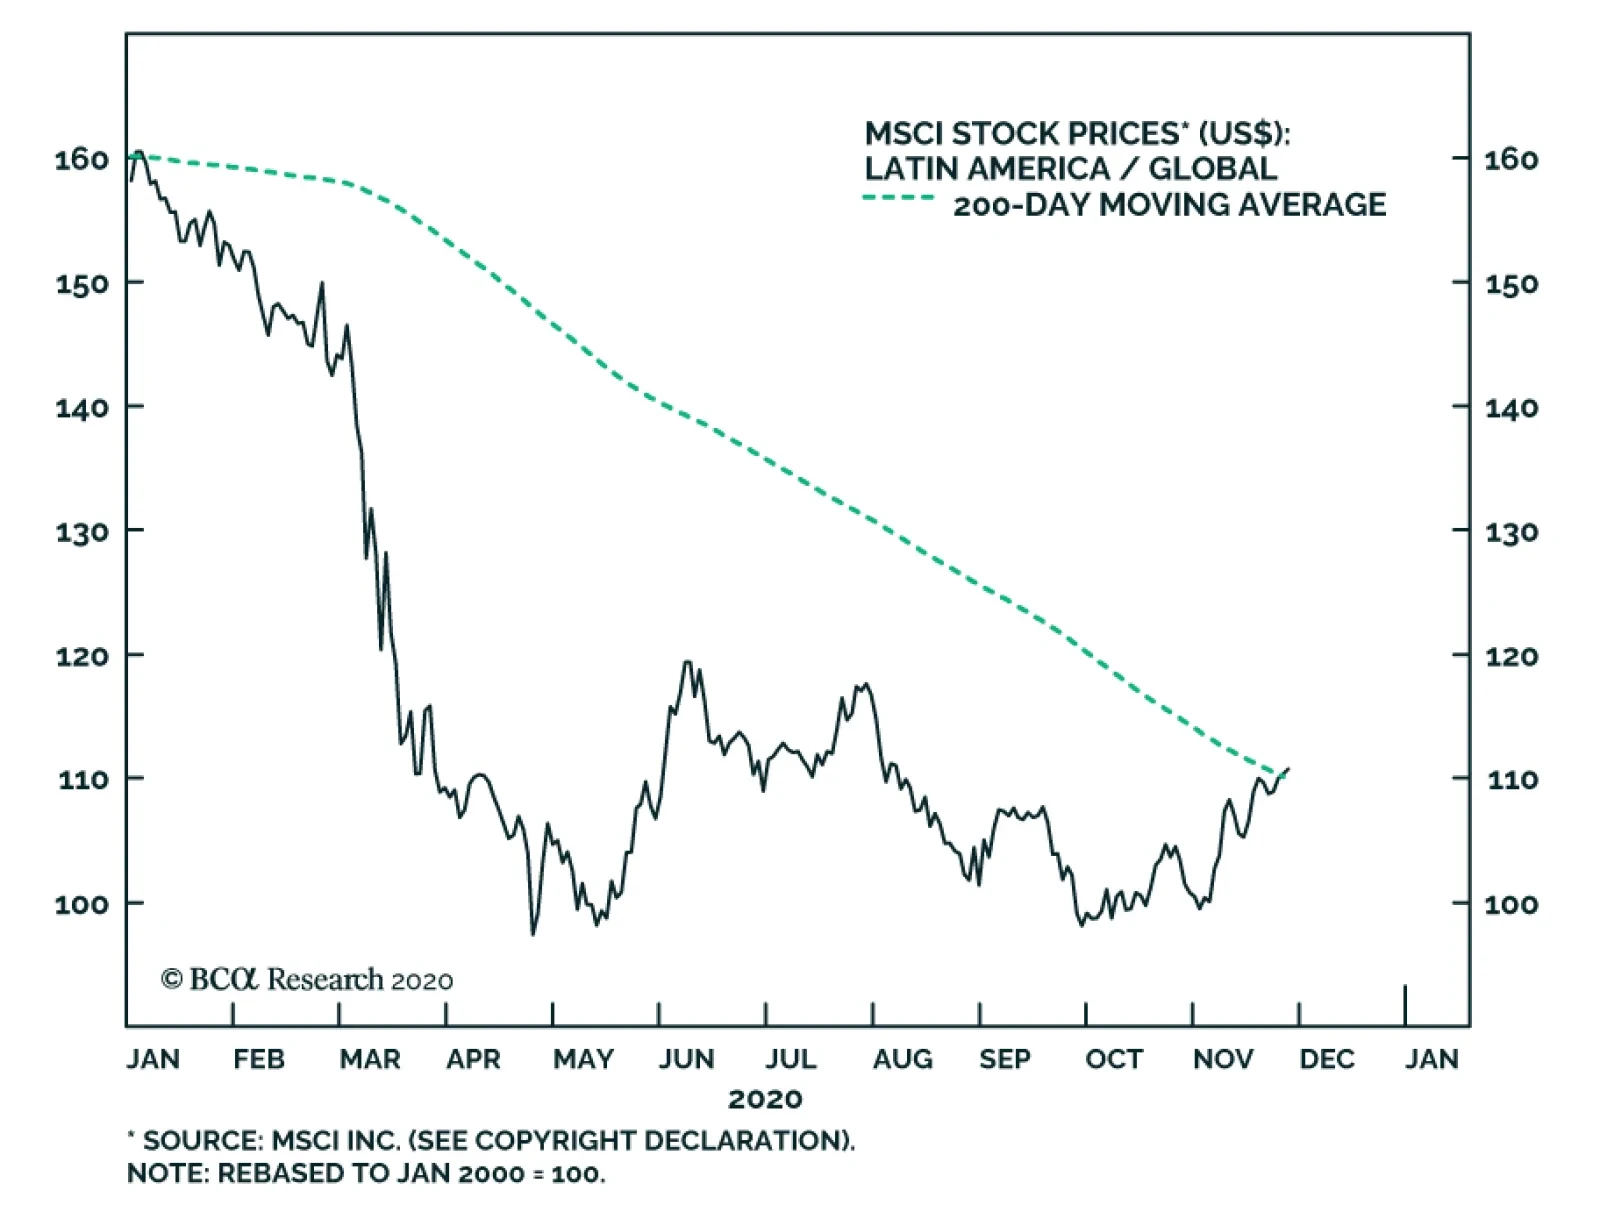
In late-October, Latin American (“LATAM”) relative equity performance was not meaningfully higher than its late-April low. This month, LATAM has outperformed global stocks significantly and is now challenging its 200-day moving average in relative terms.…
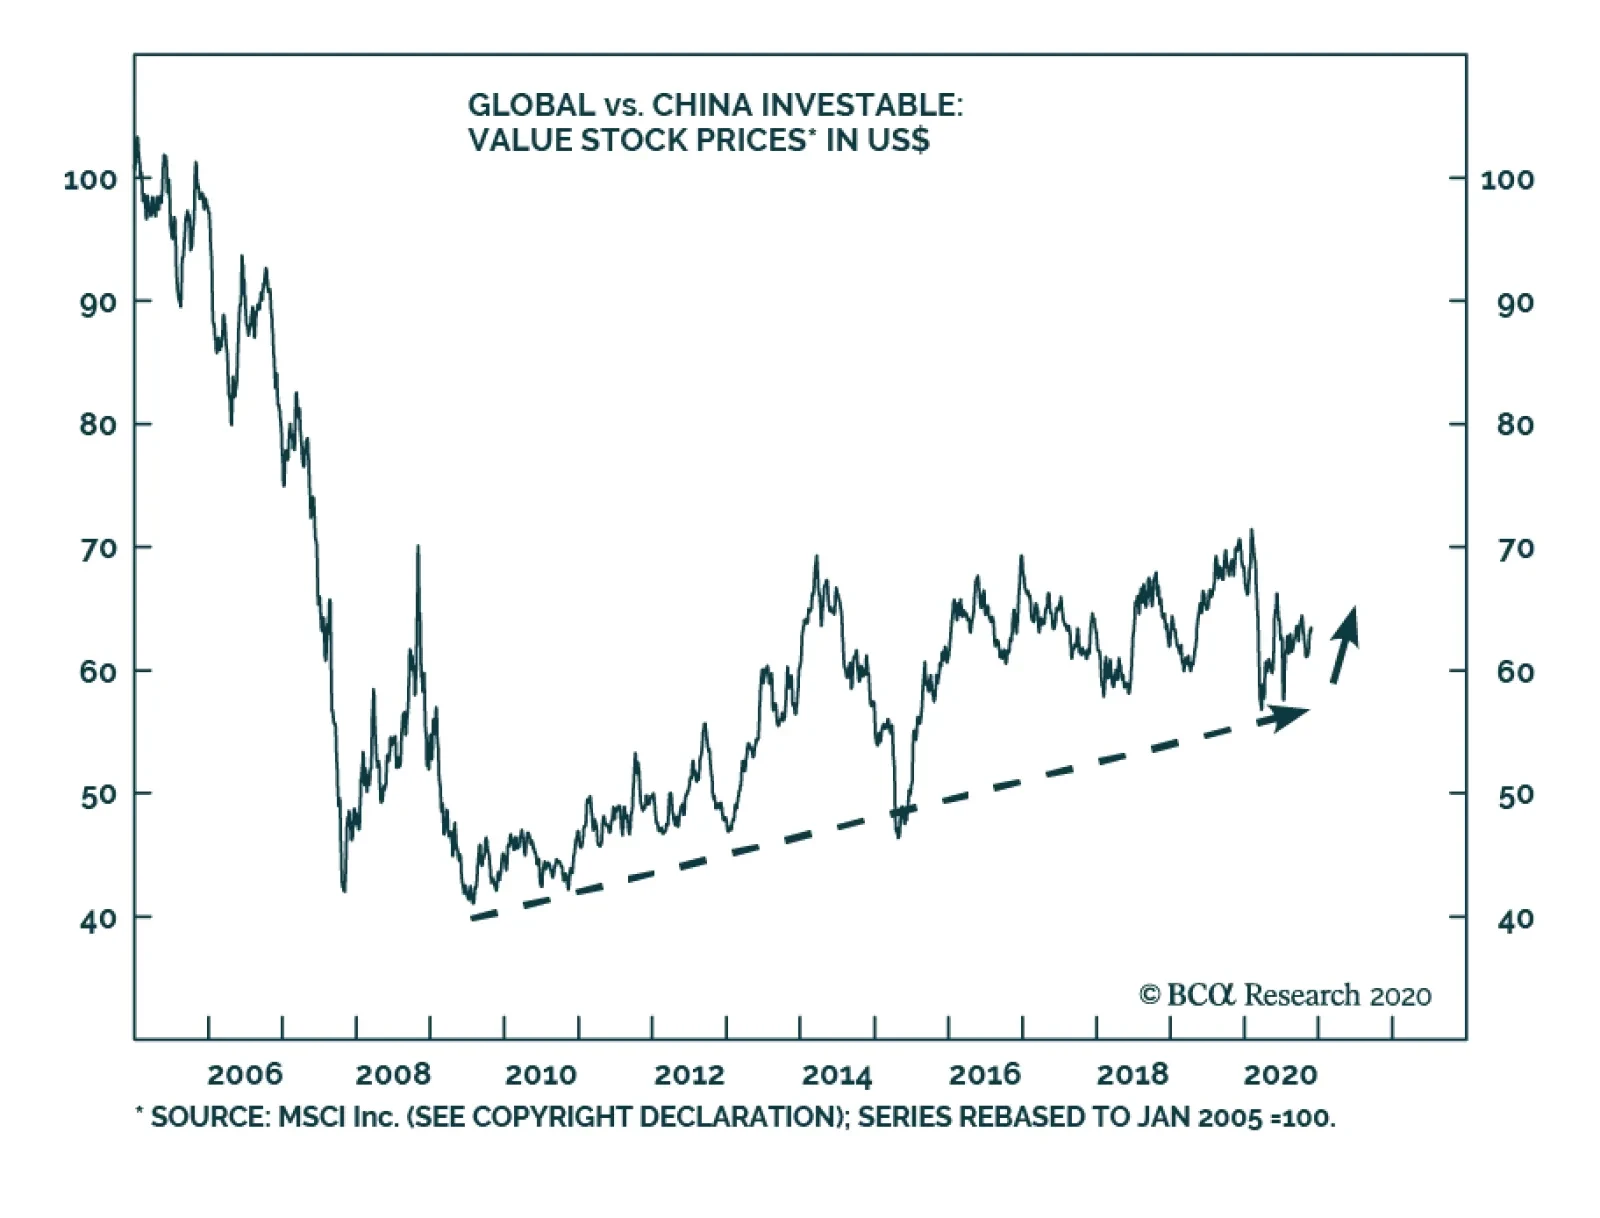
BCA Research's Emerging Markets Strategy service recommends going long global value / short Chinese value stocks. The upcoming anti-trust regulation for platform companies is a positive development for the entire Chinese economy in the long run. That said,…
Highlights New recommendation: Go neutral growth versus value on a 6-12-month horizon… …and exploit the greater opportunities within the growth universe and within the value universe. Within the growth universe, overweight healthcare versus technology. New recommendation: Within the value universe, overweight utilities versus banks. Downgrade tech-heavy Netherlands from overweight to neutral. Upgrade utilities-heavy Portugal from neutral to overweight. Fractal trade: Overweight Portugal versus Italy. Feature Chart of the WeekBank Profits In Structural Decline
Bank Profits In Structural Decline
Bank Profits In Structural Decline
Last week, Fed Chair, Jay Powell explained: “We’re not going back to the same economy. We’re going back to a different economy.” What will the different economy look like? We will only really know when the pandemic ends and short-term palliatives like government-funded job furlough schemes and rent and debt payment moratoriums are removed. Only then will we get the true price discovery to know which activities, jobs, and debts are viable and which are not. At the very least, the now widespread acceptance of remote working, remote shopping, and remote business meetings means that city centres, bricks and mortar retailers, and business aviation will become pale shadows of their former selves. This is worrying because the retail sector, on its own, employs 10 percent of all workers. Furthermore, economic shocks give impetus to structural changes that were already underway. Case in point, the UK government has just announced a ban on petrol and diesel cars from 2030. The lockdowns gave the British people the taste of clean air, and the British people liked it, so the government accelerated its initiative to abolish fossil fuels. To paraphrase Ernest Hemingway, there are two ways that sectors go bankrupt: gradually, then suddenly. A Textbook Market Slump… But Will We Get A Textbook Recovery? During an economic slump and the subsequent recovery, three fundamental drivers shape the evolution of stock prices. The first two drivers are well understood by any student of Financial Markets 101, but the third driver is not so well understood. More on that later. The first well understood driver of stock prices is the outlook for near-term profits. During a slump, the profits of ‘defensive’ sectors that are insensitive to fluctuations in the economy, outperform those of ‘cyclical’ sectors that are sensitive to the economy. For example, during this year’s slump, the profits of defensive healthcare remained remarkably resilient, whereas the profits of cyclical banks collapsed by 30 percent (Chart I-2). During the recovery, this should reverse, says the textbook. Cyclical profits should outperform defensive profits. Chart I-2Defensive Profits Outperformed In The Slump, But What About The Recovery?
Defensive Profits Outperformed In The Slump, But What About The Recovery?
Defensive Profits Outperformed In The Slump, But What About The Recovery?
The second well understood driver of stock prices is the discount rate applied to long-term profits. The present value of long-term profits is highly sensitive to the (inverted) bond yield. As discussed last week, this sensitivity becomes hyper-sensitivity at ultra-low bond yields. When the bond yield collapses to an ultra-low level, the present value of long-term profits surges. This favours ‘growth’ sectors like technology, whose profits are weighted to the distant future, versus ‘value’ sectors like utilities, whose profits are weighted closer to the here and now. ‘Cyclical value’ stocks should outperform when the economy recovers, but markets do not always follow the textbook. During this year’s slump, the near-term profits of technology and utilities performed similarly (Chart I-3). But when the bond yield collapsed and boosted the value of long-term profits, the multiple paid for near-term profits surged by 20 percent for technology, while remaining unmoved for utilities (Chart I-4). When the bond yield rises, this relative move should reverse, says the textbook. Value sector multiples should outperform growth sector multiples. Chart I-3Tech And Utilities Profits Performed Similarly...
Tech And Utilities Profits Performed Similarly...
Tech And Utilities Profits Performed Similarly...
Chart I-4But 'Growth' Tech Got A Bigger Valuation Boost Than 'Value' Utilities
But 'Growth' Tech Got A Bigger Valuation Boost Than 'Value' Utilities
But 'Growth' Tech Got A Bigger Valuation Boost Than 'Value' Utilities
So far, so good. The student of Financial Markets 101 will tell you that ‘defensive growth’ stocks outperform when the economy slumps, and bond yields collapse. Whereas ‘cyclical value’ stocks should outperform when the economy recovers, and bond yields rise. Yet as we all know, the real world is not that simple. Financial markets do not always follow the textbook. Major Economic Shocks Can Destroy Industries One real-world complication to the textbook recovery is that the bond yield might not be able to rise meaningfully before causing a relapse in the economy. This could be because of a high structural level of debt, a high structural level of unemployment, or a high structural level of risk-asset valuations. Any one of these three structural fragilities would make the economy incapable of tolerating a higher bond yield. Yet today the worry is not one fragility, it is all three of the above! Still, even if the bond yield cannot rise meaningfully, it might not fall much either, making the choice between value and growth unclear. The other real-world complication to the textbook is that major economic shocks cause structural breaks from the past. The point that Jay Powell made last week, and which forms the title of this report. Major economic shocks cause structural breaks from the past. This brings us to the third – less well-understood – driver of stock prices during and after a slump: the structural change in the sector’s long-term profit outlook. For some sectors, the long-term profit outlook phase-shifts down. Meaning that even if the bond yield does not keep falling, value sectors could continue to underperform as the collapse in their long-term profits gets recognised. For example, after oil and gas profits reached an all-time high in 2008, each slump has been followed by a progressively lower subsequent peak (Chart I-5). European banks look even worse. In the recovery following each slump since 2008, profits have regained only a third of the preceding slump’s losses. This implies that after each slump, the long-term profit outlook for the banks is phase-shifting down (Chart of the Week). Chart I-5Oil And Gas Profits In Structural Decline
Oil And Gas Profits In Structural Decline
Oil And Gas Profits In Structural Decline
Hence, European banks have failed to generate sustained outperformance in any recovery, even though the textbook says that as ‘cyclical value’ stocks, they should. Only a brave person would bet that it will be any different this time (Chart I-6). Chart I-6European Banks Have Failed To Generate Sustained Outperformance In Any Recovery
European Banks Have Failed To Generate Sustained Outperformance In Any Recovery
European Banks Have Failed To Generate Sustained Outperformance In Any Recovery
The Big Opportunities Are Within The Growth And Value Universes After a major economic shock, a structural change in a sector’s long-term profit outlook renders any backward-looking valuation framework obsolete. In such cases we cannot use mean-reversion to inform our investment strategy, because the past will be a poor guide to the future. As European banks have taught us for fifteen years, it is extremely dangerous to follow the textbook recovery play of value versus growth on any sustained basis. It is extremely dangerous to follow the textbook recovery play of value versus growth on any sustained basis. Right now, there is a much smarter investment strategy. Go neutral growth versus value, and exploit the bigger opportunities within the growth universe and within the value universe where mean-reversion strategies are more justified. Specifically, within the growth universe, the valuation premium on technology versus healthcare is at its highest level since 2009 (Chart I-7). Even more extreme, the US technology versus US healthcare valuation premium is approaching the peak of the dot com bubble (Chart I-8). Hence, we reiterate last week’s recommendation. Chart I-7The Valuation Premium On Tech Versus Healthcare Is High...
The Valuation Premium On Tech Versus Healthcare Is High...
The Valuation Premium On Tech Versus Healthcare Is High...
Chart I-8...And In The US, Approaching The Dot Com Bubble Peak
...And In The US, Approaching The Dot Com Bubble Peak
...And In The US, Approaching The Dot Com Bubble Peak
Go overweight healthcare versus technology. The regional and country allocation implications are to go overweight healthcare-heavy Europe versus technology-heavy Emerging Markets. And within Europe, to go overweight healthcare-heavy Denmark and Switzerland versus technology-heavy Netherlands. The upshot is that today we are downgrading Netherlands from overweight to neutral. Turning to the value universe, the performance of cyclical banks versus defensive utilities just tracks the bond yield (Chart I-9). This means that the recent snapback rally in banks versus utilities needs higher bond yields for support. Absent a sustained rise in bond yields, the rally is fragile and vulnerable to reversal. Chart I-9Banks Vs. Utilities = The Bond Yield
Banks Vs. Utilities = The Bond Yield
Banks Vs. Utilities = The Bond Yield
Yet as we explained last week, the 10-year T-bond yield can rise by only 30 basis points or so before undermining the broad stock market. On this basis, we are making a new recommendation. Go overweight utilities versus banks. Within Europe, the implication is to go overweight utility-heavy Portugal versus bank-heavy Spain and Italy (Chart I-10). Chart I-10Portugal Vs. Italy = Utilities Vs. Banks
Portugal Vs. Italy = Utilities Vs. Banks
Portugal Vs. Italy = Utilities Vs. Banks
The upshot is that today we are upgrading Portugal from neutral to overweight. Fractal Trading System* Fractal analysis confirms that Portugal’s underperformance is approaching a potential reversal point if bond yields do not rise meaningfully. Accordingly, this week’s recommended trade is overweight Portugal versus Italy. Set the profit target and symmetrical stop-loss at 6.6 percent. In other trades, long coffee versus corn achieved its 12 percent profit target. The rolling 12-month win ratio now stands at 53 percent. Chart I-11MSCI: Portugal Vs. Italy
MSCI: Portugal Vs. Italy
MSCI: Portugal Vs. Italy
When the fractal dimension approaches the lower limit after an investment has been in an established trend it is a potential trigger for a liquidity-triggered trend reversal. Therefore, open a countertrend position. The profit target is a one-third reversal of the preceding 13-week move. Apply a symmetrical stop-loss. Close the position at the profit target or stop-loss. Otherwise close the position after 13 weeks. * For more details please see the European Investment Strategy Special Report “Fractals, Liquidity & A Trading Model,” dated December 11, 2014, available at eis.bcaresearch.com. Dhaval Joshi Chief European Investment Strategist dhaval@bcaresearch.com Fractal Trading System Cyclical Recommendations Structural Recommendations Closed Fractal Trades Trades Closed Trades Asset Performance Currency & Bond Equity Sector Country Equity Indicators Bond Yields Chart II-1Indicators To Watch - Bond Yields
Indicators To Watch - Bond Yields
Indicators To Watch - Bond Yields
Chart II-2Indicators To Watch - Bond Yields
Indicators To Watch - Bond Yields
Indicators To Watch - Bond Yields
Chart II-3Indicators To Watch - Bond Yields
Indicators To Watch - Bond Yields
Indicators To Watch - Bond Yields
Chart II-4Indicators To Watch - Bond Yields
Indicators To Watch - Bond Yields
Indicators To Watch - Bond Yields
Interest Rate Chart II-5Indicators To Watch - Interest Rate Expectations
Indicators To Watch - Interest Rate Expectations
Indicators To Watch - Interest Rate Expectations
Chart II-6Indicators To Watch - Interest Rate Expectations
Indicators To Watch - Interest Rate Expectations
Indicators To Watch - Interest Rate Expectations
Chart II-7Indicators To Watch - Interest Rate Expectations
Indicators To Watch - Interest Rate Expectations
Indicators To Watch - Interest Rate Expectations
Chart II-8Indicators To Watch - Interest Rate Expectations
Indicators To Watch - Interest Rate Expectations
Indicators To Watch - Interest Rate Expectations
Highlights Prices of global major commodities such as copper and iron ore have rallied significantly this year. It seems that strong Chinese imports once again became the major driving force for both commodities. Is the rally in commodity prices sustainable in 2021? This is the first of three reports focusing on copper, iron ore, and energy. In this week’s report, our views on copper are highlighted below: Chinese imports of copper have substantially outpaced Chinese underlying copper consumption this year, resulting in considerable inventory accumulation. Destocking and underlying demand weakness in 2021 suggest that China’s copper imports are likely to decline next year. In the meantime, the global refined copper supply will grow at 1.5-2.5% in 2021 from 2020. Copper prices are vulnerable to the downside next year. Short December 2021 LME copper futures. Feature China’s total demand and imports have surged by 23% and 62% year on year, respectively, in the last six months (Charts 1A and 1B). Both growth rates were the fastest they have been since 2010 (Chart 2). Chart 1AWill Chinese Total Copper Demand Surge Into 2021?
Will Chinese Total Copper Demand Surge Into 2021?
Will Chinese Total Copper Demand Surge Into 2021?
Chart 1BWill Chinese Copper Imports Surge Into 2021?
Will Chinese Copper Imports Surge Into 2021?
Will Chinese Copper Imports Surge Into 2021?
Please note throughout of this report, total demand is defined as the formula below: Total demand = underlying consumption1 + change in inventories Solely due to the surging total demand from China, global copper demand rose by 5% year on year so far this year (Chart 3). China’s total copper demand accounted for 58.4% of global copper demand for the first nine months of this year, increasing from a 53.6% share last year. Chart 2Unusual Strong Growth In Chinese Total Copper Demand And Imports
Unusual Strong Growth In Chinese Total Copper Demand And Imports
Unusual Strong Growth In Chinese Total Copper Demand And Imports
Chart 3China Alone Has Pushed Up Global Copper Demand This Year
China Alone Has Pushed Up Global Copper Demand This Year
China Alone Has Pushed Up Global Copper Demand This Year
In the meantime, global copper ore and refined copper outputs were curbed by the pandemic. As a result, the global copper market balance2 swung from a small surplus in March to a record high deficit in September (Chart 4). However, based on our estimates, China’s total demand for copper this year has meaningfully outpaced its underlying consumption, implying there has been substantial inventory buildup in the country. As a result, China’s strong copper imports will not continue into 2021. Moreover, global copper output is set to increase in 2021, adding further downward pressure on copper prices next year. Chart 4Global Copper Market Balance Has Swung From A Small Surplus To A High Deficit
Global Copper Market Balance Has Swung From A Small Surplus To A High Deficit
Global Copper Market Balance Has Swung From A Small Surplus To A High Deficit
Chart 5China's Total Copper Demand: A Big Deviation From Its Long-Term Underlying Consumption Growth
China's Total Copper Demand: A Big Deviation From Its Long-Term Underlying Consumption Growth
China's Total Copper Demand: A Big Deviation From Its Long-Term Underlying Consumption Growth
Understanding Strong Chinese Copper Demand In 2020 For the past five years, the annual increase in China’s total copper demand grew at a compound annual growth rate (CAGR) of only 2.5%, reflecting the country’s long-term underlying copper usage growth (Chart 5). However, China’s total copper demand (consumption plus change in inventories) has increased by 18.4% year on year for the first nine months of this year. This surge in total demand has significantly outpaced its long-term underlying consumption growth. Our research shows that slightly more than half of China’s total copper demand growth so far this year can be attributable to a solid underlying consumption rebound boosted by the stimulus. The government’s strategic purchases and commercial restocking may have contributed to the other half of the country’s total copper demand growth. Copper Consumption By Real Economy Chart 6The Structure Of China’s Underlying Copper Consumption In 2019
Chinese Commodities Demand: An Unsustainable Boom? Part I: Copper
Chinese Commodities Demand: An Unsustainable Boom? Part I: Copper
The structure of China’s underlying copper consumption in 2019 stemmed from the following industries and sectors: power (about 49% of Chinese copper usage); refrigeration and air conditioning (15%); transportation (10%); electronic communication (9%); buildings and construction (8%); and others (Chart 6). Table 1 shows our rough estimations of the copper consumption growth in each sector in 2020, respectively. Based on this, we concluded that China’s underlying copper consumption might grow by approximately 10% this year. Table 1Chinese Underlying Copper Consumption Year-On-Year Growth Estimates For 2020
Chinese Commodities Demand: An Unsustainable Boom? Part I: Copper
Chinese Commodities Demand: An Unsustainable Boom? Part I: Copper
Chart 7Copper Consumption In The Power Industry Has Been Strong
Copper Consumption In The Power Industry Has Been Strong
Copper Consumption In The Power Industry Has Been Strong
The power sector is the largest copper user as copper is among the best conductors of electricity and heat. The metal is used in high, medium and low voltage power networks. Following the pandemic, China significantly boosted investment in the power sector by 17% (year to date, January - October) from the same period last year (Chart 7). The power generation equipment output has surged by 28.7% year on year during the same period, while the electrical cable output increased only slightly. All together, we estimated that the copper consumption from the power sector grew by approximately 16% from last year. While air conditioner output declined moderately from 2019, freezer and refrigerator production has gone up significantly this year (Chart 8). The global “stay-at-home” economy due to the pandemic boosted Chinese exports of freezers and refrigerators. Considering air conditioner copper usage per unit is generally higher than that in freezers/refrigerators, we assumed this year’s copper consumption in the home appliance sector to be up by 6% from the previous year. Despite a recent sharp rebound in transportation investment and automobile output, in the first ten months of this year the transportation investment grew by only 2% year on year while automobile output still contracted by 4% from the previous year (Chart 9). Hence, we assumed a 2% year-on-year contraction of copper usage in this sector this year.3 Chart 8Moderate Growth In Copper Usage In The Home Appliance Sector
Moderate Growth In Copper Usage In The Home Appliance Sector
Moderate Growth In Copper Usage In The Home Appliance Sector
Chart 9Contracted Automobile Output May Have Reduced Copper Consumption In The Transportation Sector
Contracted Automobile Output May Have Reduced Copper Consumption In The Transportation Sector
Contracted Automobile Output May Have Reduced Copper Consumption In The Transportation Sector
Copper or copper-base alloys are used in printed circuit boards, in electronic connectors, as well as in many semiconductor products. This year, China had set a strategic goal to develop the tech-related new infrastructure, which includes information transmission, software and information technology services, such as 5G networks, industrial internet, and data centers. The tech-related new infrastructure investment has increased by 20% year on year during January - October (Chart 10). We expect the year-on-year copper usage growth in this sector to be 20% this year as well. The buildings and construction sector accounts for 8% of China’s copper usage. During the first nine months of this year, our broad measure of China’s building construction activity—specifically building area starts and completions—have contracted 3.2% and 9.6% year on year, respectively (Chart 11). Assuming half of this sector’s usage is in building area starts and the other half in completions, we expect the copper consumption in this sector to contract by 6% year on year this year. Chart 10Copper Usage Rising Due To Strong Tech-Related New Infrastructure Investment
Copper Usage Rising Due To Strong Tech-Related New Infrastructure Investment
Copper Usage Rising Due To Strong Tech-Related New Infrastructure Investment
Chart 11Weak Property Market May Have Also Cut Copper Consumption In The Construction Sector
Weak Property Market May Have Also Cut Copper Consumption In The Construction Sector
Weak Property Market May Have Also Cut Copper Consumption In The Construction Sector
Altogether, our calculation shows that the Chinese underlying copper consumption growth for the full 2020 year is likely to be up 10% from last year. Copper Restocking Although the most tracked official data does not show a significant pileup in copper inventories in China, our research indicates that the Chinese government’s strategic and enterprises’ speculative restocking might have accounted for nearly half of China’s total copper demand growth this year. Chinese total copper demand (consumption plus change in inventories) was approximately 9,120 thousand metric tons (kt) during last January - September.4 A 10% growth from this number will equal an increase of 912 kt, still 770 kt (or 46%) short of the total increased amount of 1,678 kt year on year in Chinese total copper demand. First, of the 770-kt gap between China’s total demand and our estimated underlying consumption, we believe that about 200-400 kt of copper—about 4%-8% of Chinese copper imports in the first nine months of this year—were purchased by the Chinese government.5 Many market analysts have been suspecting that China’s State Reserve Board (SRB) has been buying copper this year, as there was no way Chinese underlying consumption could grow as strong as what its total demand and imports suggested. Historically, the SRB bought copper whenever prices declined significantly, and stopped or reduced its purchases when prices had a significant rally. For example, many believe that the SRB bought 200-400 kt in 2008,6 200-500 kt in 2014,7 and 200 kt in 2015,8 when prices dropped considerably. Copper prices have been trading well below US$3 per pound for most of the year, and the Chinese currency has been strengthening. Thus, it is reasonable to assume that the SRB purchased at least a similar amount as in previous cycles to strategically stock up on cheap commodities. Second, Chinese enterprises may have bought 370-570 kt of copper this year.9 Easy money and abundant credit with lower borrowing costs have probably allowed some Chinese enterprises to accumulate copper inventories, representing financial speculative demand (with a motive of selling at higher prices) and/or inventories to be used in future. Chart 12The SHFE Copper Warehouse: No Inventory Accumulation Based On This Measure
The SHFE Copper Warehouse: No Inventory Accumulation Based On This Measure
The SHFE Copper Warehouse: No Inventory Accumulation Based On This Measure
The most often tracked China copper inventory data by market analysts is the copper inventory at Shanghai Futures Exchange (SHFE), which has been highly volatile this year. Its current level is near its level at the end of last year (Chart 12). This means no inventory accumulation in the SHFE copper warehouse. This also implies that Chinese companies may have restocked their copper inventories in their own warehouses, for which no official data can be tracked. Bottom Line: Chinese underlying consumption accounts for slightly more than half of the increase in the country’s total copper demand this year, whereas the government’s strategic purchases and commercial restocking have most likely contributed to the other half. China’s Copper Demand Boom Is Unsustainable This year’s surging total demand for copper in China was due to the stimulus as a result of the pandemic, as well as government and commercial copper restocking. Looking forward in 2021, these driving forces will either diminish or disappear. First, China’s copper restocking will be followed by destocking. With copper prices having risen by 57% from their trough in March, and now well above US$3 per pound, odds are that the SRB and commercial buyers that have been accumulating copper inventories will considerably reduce their copper purchases next year. Moreover, as China’s financial regulations have become stricter and the monetary stance more hawkish of late, we expect Chinese enterprises will largely refrain from speculative activities in the commodity market next year. Second, the country’s underlying copper consumption growth will likely drop considerably to the range of -3% to zero next year (Table 2). Table 2Chinese Underlying Copper Consumption Year-on-Year Growth Estimates For 2021
Chinese Commodities Demand: An Unsustainable Boom? Part I: Copper
Chinese Commodities Demand: An Unsustainable Boom? Part I: Copper
As government stimulus will likely be scaled back substantially next year, infrastructure investment in the power sector will fall from the current level. In 2019, the year-on-year growth of power investment, power generation equipment, and electrical cable output was -0.2%, -15% and 3.3%, respectively. We expect the level of Chinese investment in the power sector to normalize to its long-term trend next year from this year’s substantial increase. Therefore, we estimate a 5%-8% contraction in this sector’s copper consumption next year. Next year’s government-targeted stimulus in the consumption segment may provide a boost in output of home appliances, albeit a modest one. In addition, global demand for freezers and refrigerators due to the pandemic may diminish, as global supply chains as well as production from pandemic-struck countries will likely recover next year. Hence, we expect the copper usage growth in the “refrigeration and air conditioning” sector will drop to a 0-2% year-on-year growth in 2021 from this year’s 6% growth. For copper usage in the transportation sector, we expect a 3%-5% growth next year as the automobile sector will likely continue to recover, and transportation infrastructure investment may also increase slightly due to the government’s effort to expand its electric car charging infrastructure. We expect the investment in the tech-related new infrastructure to increase by 12%-15%, which will be a drop from this year’s sharp growth of 20%. The copper usage in the buildings and construction sector is likely to continue until the fall of next year. However, as property developers need to complete their existing projects, copper consumption in this sector may decline by 2%-4%, smaller than this year’s 6% contraction. All together, we conclude that the underlying Chinese copper consumption will likely contract by 0-3% next year from 2020. Bottom Line: China’s underlying copper consumption is likely to contract slightly next year, which will weigh on the country’s copper imports. Additionally, as China had accumulated considerable copper inventories this year, the country’s destocking will also depress its copper imports next year. More Global Copper Supply In 2021 Chart 13Global Copper Ore And Refined Copper Supply Are Set To Increase In 2021
Global Copper Ore And Refined Copper Supply Are Set To Increase In 2021
Global Copper Ore And Refined Copper Supply Are Set To Increase In 2021
Global supply of both copper ore and refined copper outside China will go up next year, by about 3-5% in 2021, a sharp contrast with the declines of 2.2% and 3.2% year on year, respectively, for the first nine months of this year (Chart 13). Table 3 shows the world’s top 10 copper producing companies’ capex this year and in 2021. Most of these companies slashed their capex this year due to the pandemic. However, the capex of all these companies will likely be much higher in 2021, which will facilitate copper output growth. The companies that will increase their capex in 2021 are largely outside China. The aggregate capex for the world’s top 10 copper producing companies will increase by nearly 20% year on year in 2021. Some mining giants such as BHP and Rio Tinto produce many other commodities rather than copper, so only part of their investment will go to copper-related assets/operations. For companies with a significant amount of revenue coming from copper, such as Codelco, Glencore, Southern Copper, KGHM, and Antofagasta, all will have more than 20% growth in their 2021 capex. Table 3The World’s Top 10 Copper Producing Companies’ Capex Investment In 2020 & 2021
Chinese Commodities Demand: An Unsustainable Boom? Part I: Copper
Chinese Commodities Demand: An Unsustainable Boom? Part I: Copper
As these companies account for about half of the global copper production, we believe the 20% increase in their aggregate capex will likely result in a 3%-5% increase in their copper ore and refined copper outputs. China’s copper production growth rate is expected to accelerate within the next few years, mainly driven by the construction of Tibet's Qulong copper mine, the second phase expansion of Duobaoshan, the second phase of the Jiama copper mine, and the Chifeng Fubo project. China is currently the world’s third-largest copper ore producer, accounting for 9% of the global copper ore supply. The country is also the world’s largest refined copper producer, contributing 43% of global refined copper production. After having managed to add a 430-kt smelting capacity and a 640-kt refining capacity this year, the country plans to increase its new smelting capacity of 525 kt and new refinery capacity of 110 kt in 2021, most of which will need copper ore and concentrates. If the 110-kt new refinery capacity is fully utilized, it will increase global refined copper output by about 0.5% next year. Chart 14China: Rising Imports Of Copper Ore Will Likely Reduce Its Refined Copper Imports
China: Rising Imports Of Copper Ore Will Likely Reduce Its Refined Copper Imports
China: Rising Imports Of Copper Ore Will Likely Reduce Its Refined Copper Imports
This year, due to constrained copper ore supply outside China, Chinese copper ore imports only increased 2% year on year during January - September. This has also prompted Chinese refined copper imports. In 2021, rising imports of copper ore by China will likely boost the country’s domestic production of refined copper and reduce imports (Chart 14). In addition, the significant increase in Chinese refined copper imports this year was partially due to the substitution effect of the shortage in global copper scrap supply. This is likely to change. We expect global secondary copper production—refined copper produced from scrap copper—to rise next year from the current level. Global secondary copper output accounts for 17% of global total refined copper supply. The pandemic-triggered lockdowns disrupted the global scrap copper supply chains, including collection, processing, and transportation. According to the International Copper Study Group (ICSG), global secondary refined copper production is expected to decline by 5.5% year on year this year due to a shortage of scrap metal in many regions. This is likely to reverse next year, as fewer countries will force complete lockdowns. Chart 15China: Rising Imports Of Scrap Copper Will Also Likely Reduce Its Refined Copper Imports
China: Rising Imports Of Scrap Copper Will Also Likely Reduce Its Refined Copper Imports
China: Rising Imports Of Scrap Copper Will Also Likely Reduce Its Refined Copper Imports
Also, in order to reduce domestic pollution, starting from the second half of 2019, China has moved the metal scraps10 from the non-restricted category to the restricted category. As a result, importing copper scrap into China requires approval, and the number of approvals is strictly controlled. This had resulted in a sharp drop in the amount of imported copper scrap (Chart 15). China’s imported volumes of copper scrap plunged 38% year on year in 2019 and will likely fall further this year. Next year, the newly implemented "Solid Waste Pollution Prevention and Control Law" will allow China to import high-quality copper scrap. This will also reduce the country’s need to import refined copper from overseas. Bottom Line: Both rising global ore output and recovering global secondary copper supply will increase the global refined copper supply next year. China will likely boost its imports of ore and high-quality scrap copper while considerably reducing its imports of refined copper. This will be negative to global refined copper prices. Investment Implications Chart 16Net Speculative Positions Of Copper Are At A Multi-Year High
Net Speculative Positions Of Copper Are At A Multi-Year High
Net Speculative Positions Of Copper Are At A Multi-Year High
Fundamentally, China’s contracting underlying copper consumption and destocking, as well as the rising global refined copper supply, are all set to create a bearish backdrop for copper prices in 2021. Meanwhile, net speculative positions of copper in the US as a share of total open interest have risen to a multi-year high (Chart 16). This is a bearish technical signal for copper prices. In addition, LME warehouse copper inventories rebounded recently, which may also be a sign of easing supply bottlenecks and slower market demand (Chart 17). To conclude, copper prices are vulnerable to the downside next year. Short December 2021 LME copper futures outright (Chart 18). We expect a 10%-15% downside in copper prices next year from the current level. Chart 17Rebounding LME Copper Inventories: A Sign Of Easing Supply Bottlenecks And Slower Demand?
Rebounding LME Copper Inventories: A Sign Of Easing Supply Bottlenecks And Slower Demand?
Rebounding LME Copper Inventories: A Sign Of Easing Supply Bottlenecks And Slower Demand?
Chart 18Short December 2021 LME Copper Futures Outright
Short December 2021 LME Copper Futures Outright
Short December 2021 LME Copper Futures Outright
Ellen JingYuan He Associate Vice President ellenj@bcaresearch.com Footnotes 1 Underlying consumption is defined as the usage of copper in the real economy and excludes changes in inventories. 2Market balance measured as refined copper total demand minus refined copper production. The market balance is in deficit if total demand exceeds production and it is in surplus if total demand falls short of production. 3Transportation investment is for the transportation infrastructure sector. Here we assumed the copper usage in the transportation sector is evenly divided between transportation infrastructure and automobile production in China. 4According to WBMS data, China’s total demand during last January - September 2019 was 9,120 kt. Since China’s total demand for copper last year was within the range of its long-term underlying consumption, our estimates for China’s real economy driven consumption in 2020 are based on this number. 5Precise numbers are not available, and these data represent our estimates. 6Please refer https://news.smm.cn/news/66571 7Please refer https://www.reuters.com/article/copper-reserve-source-buy-idCNCNEA3N02F20140424 8Please refer https://news.cnpowder.com.cn/31981.html 9We derived this estimate by deducting SRB’s 200-400 kt from the 770-kt gap. 10In early 2019, China announced plans to restrict imports of eight different scrap categories – including aluminum, steel and copper – starting July 1, 2019. Cyclical Investment Stance Equity Sector Recommendations
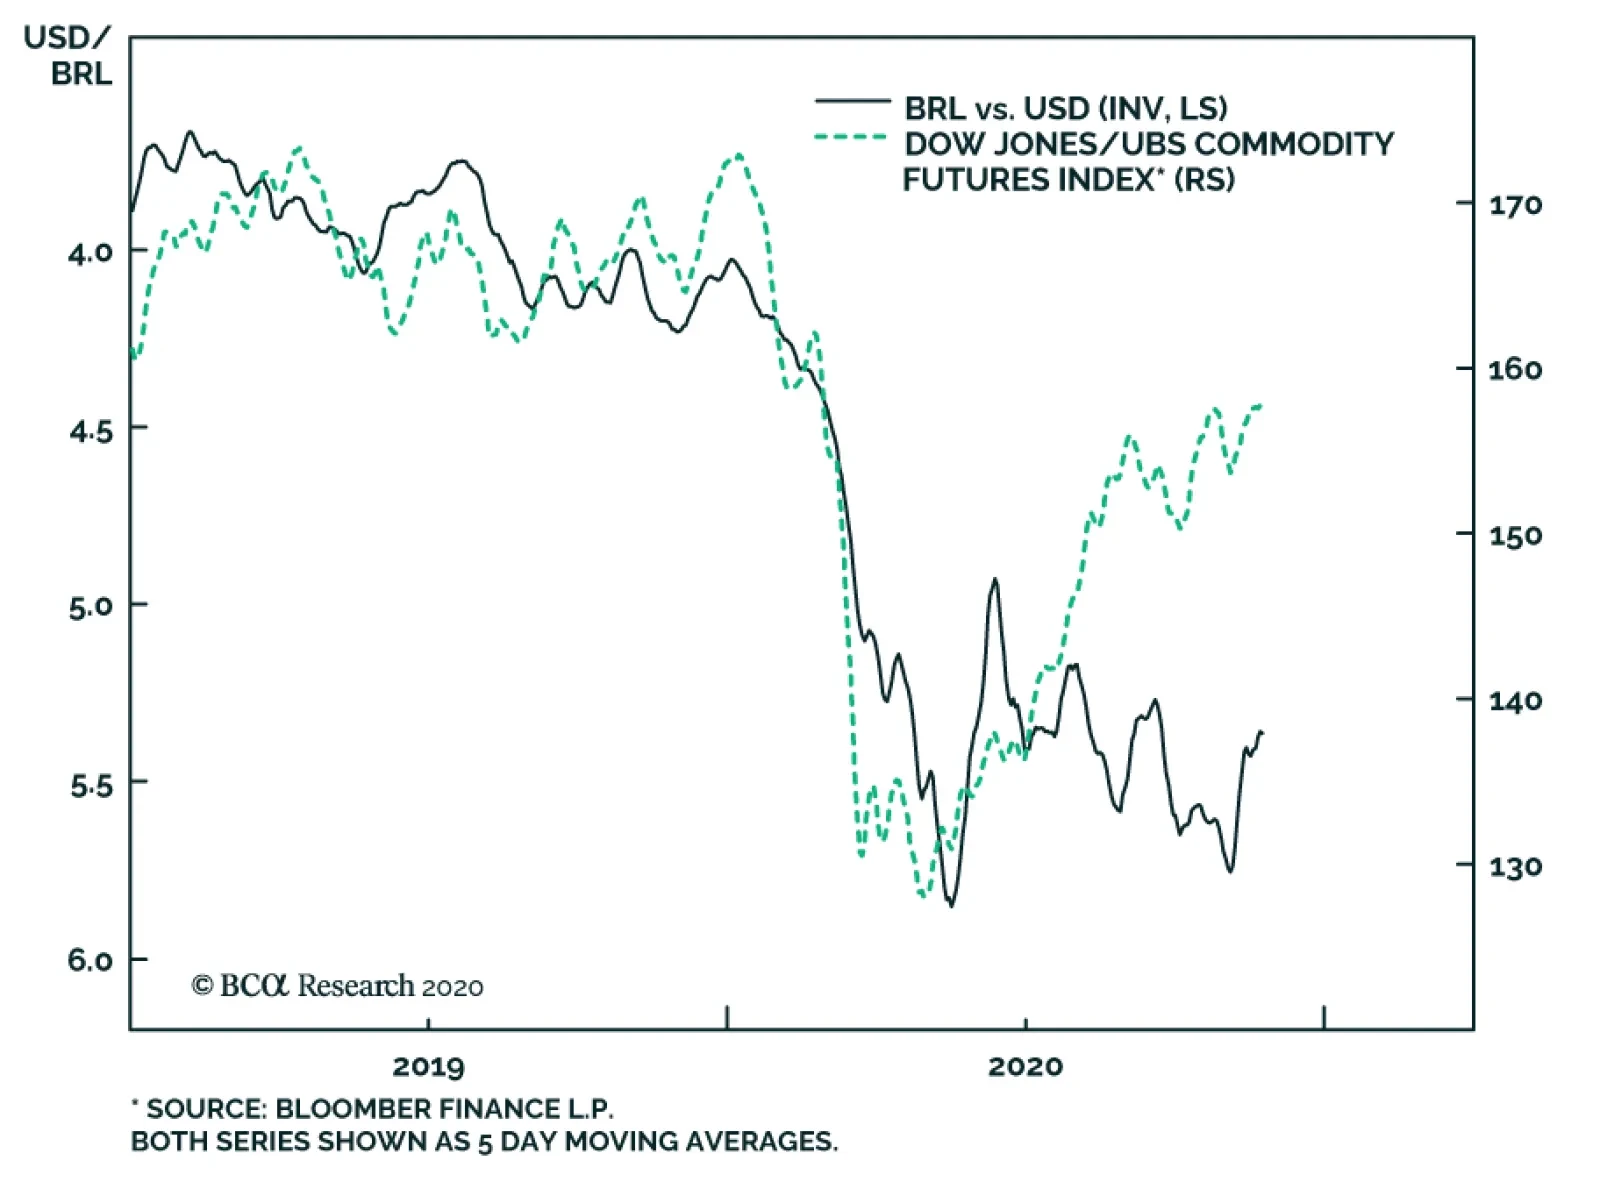
On Monday, Paulo Guedes, Brazil’s economy minister, argued that the Brazilian real has likely overshot its equilibrium level of around USD-BRL = 5. The chart above highlights the divergence that has developed between the real and commodity futures prices, and…
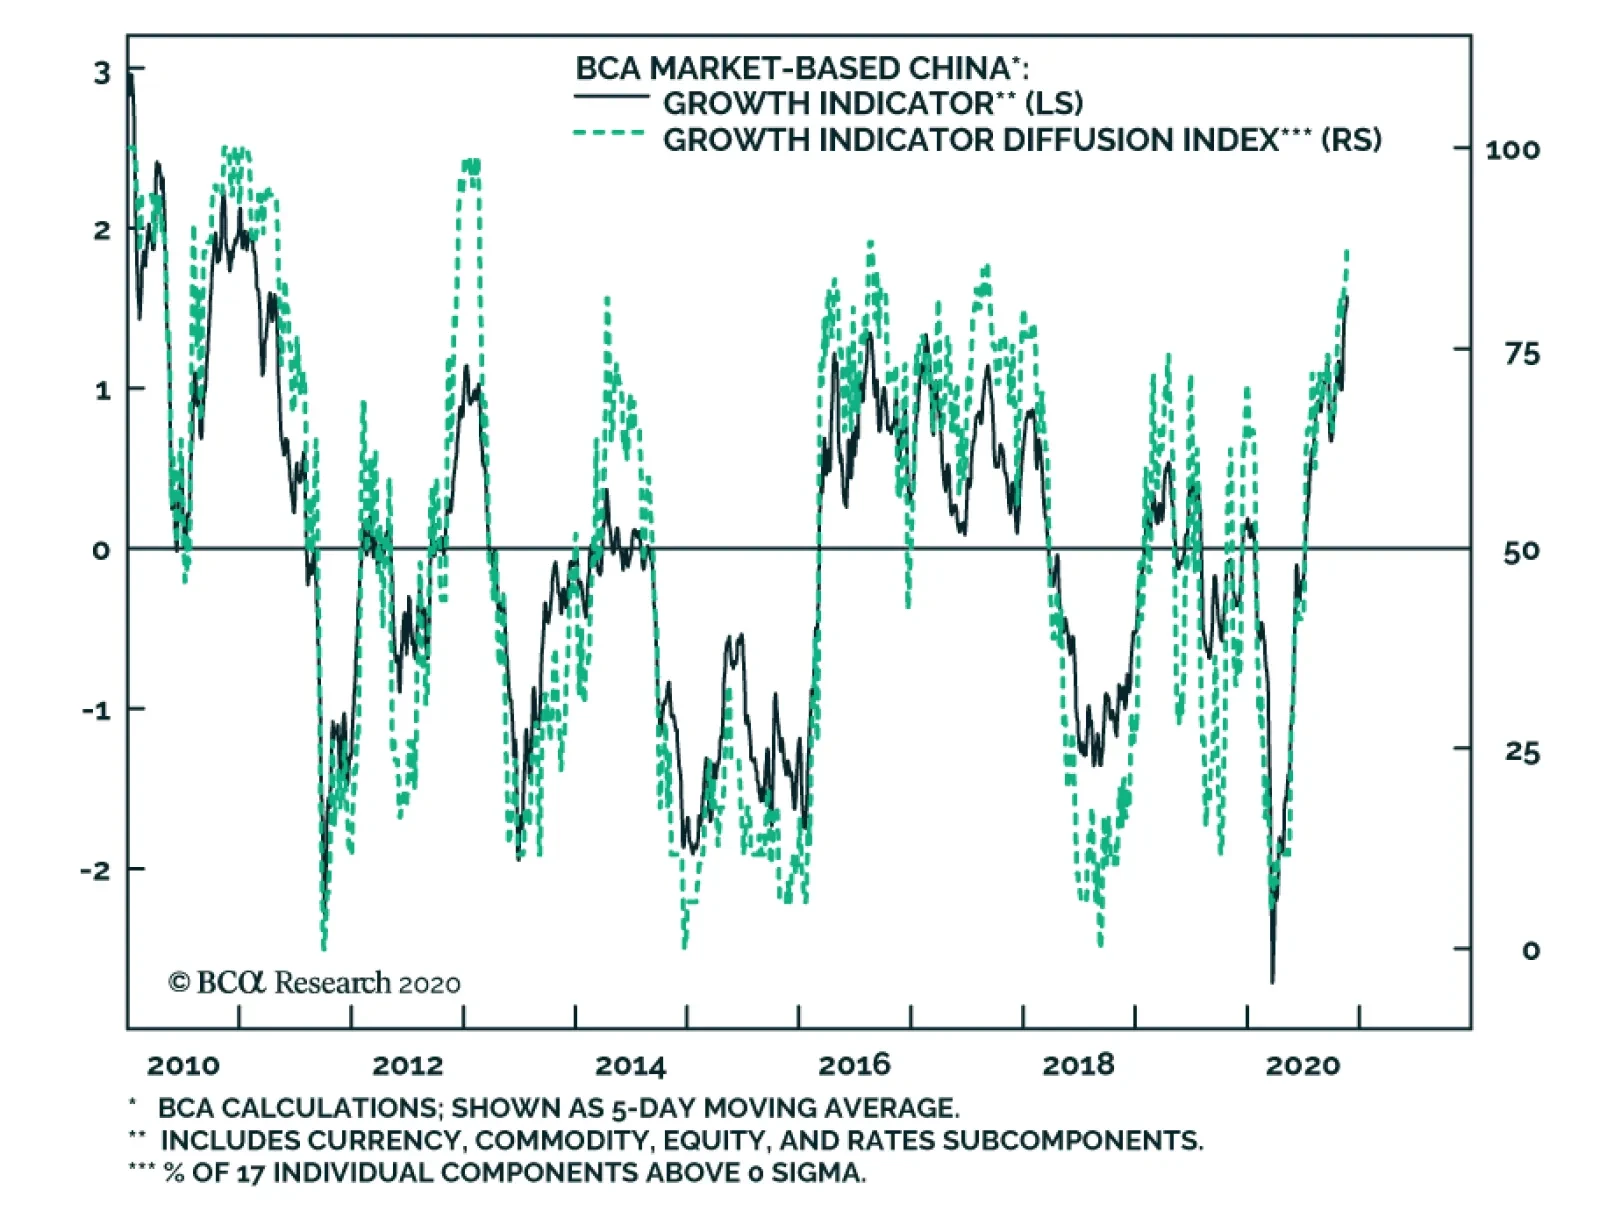
The chart above highlights BCA’s Market-Based China Growth Indicator, along with its diffusion index. The purpose of the indicator is to act as a broad proxy of investor expectations for Chinese growth, and to illustrate which asset classes are providing the…
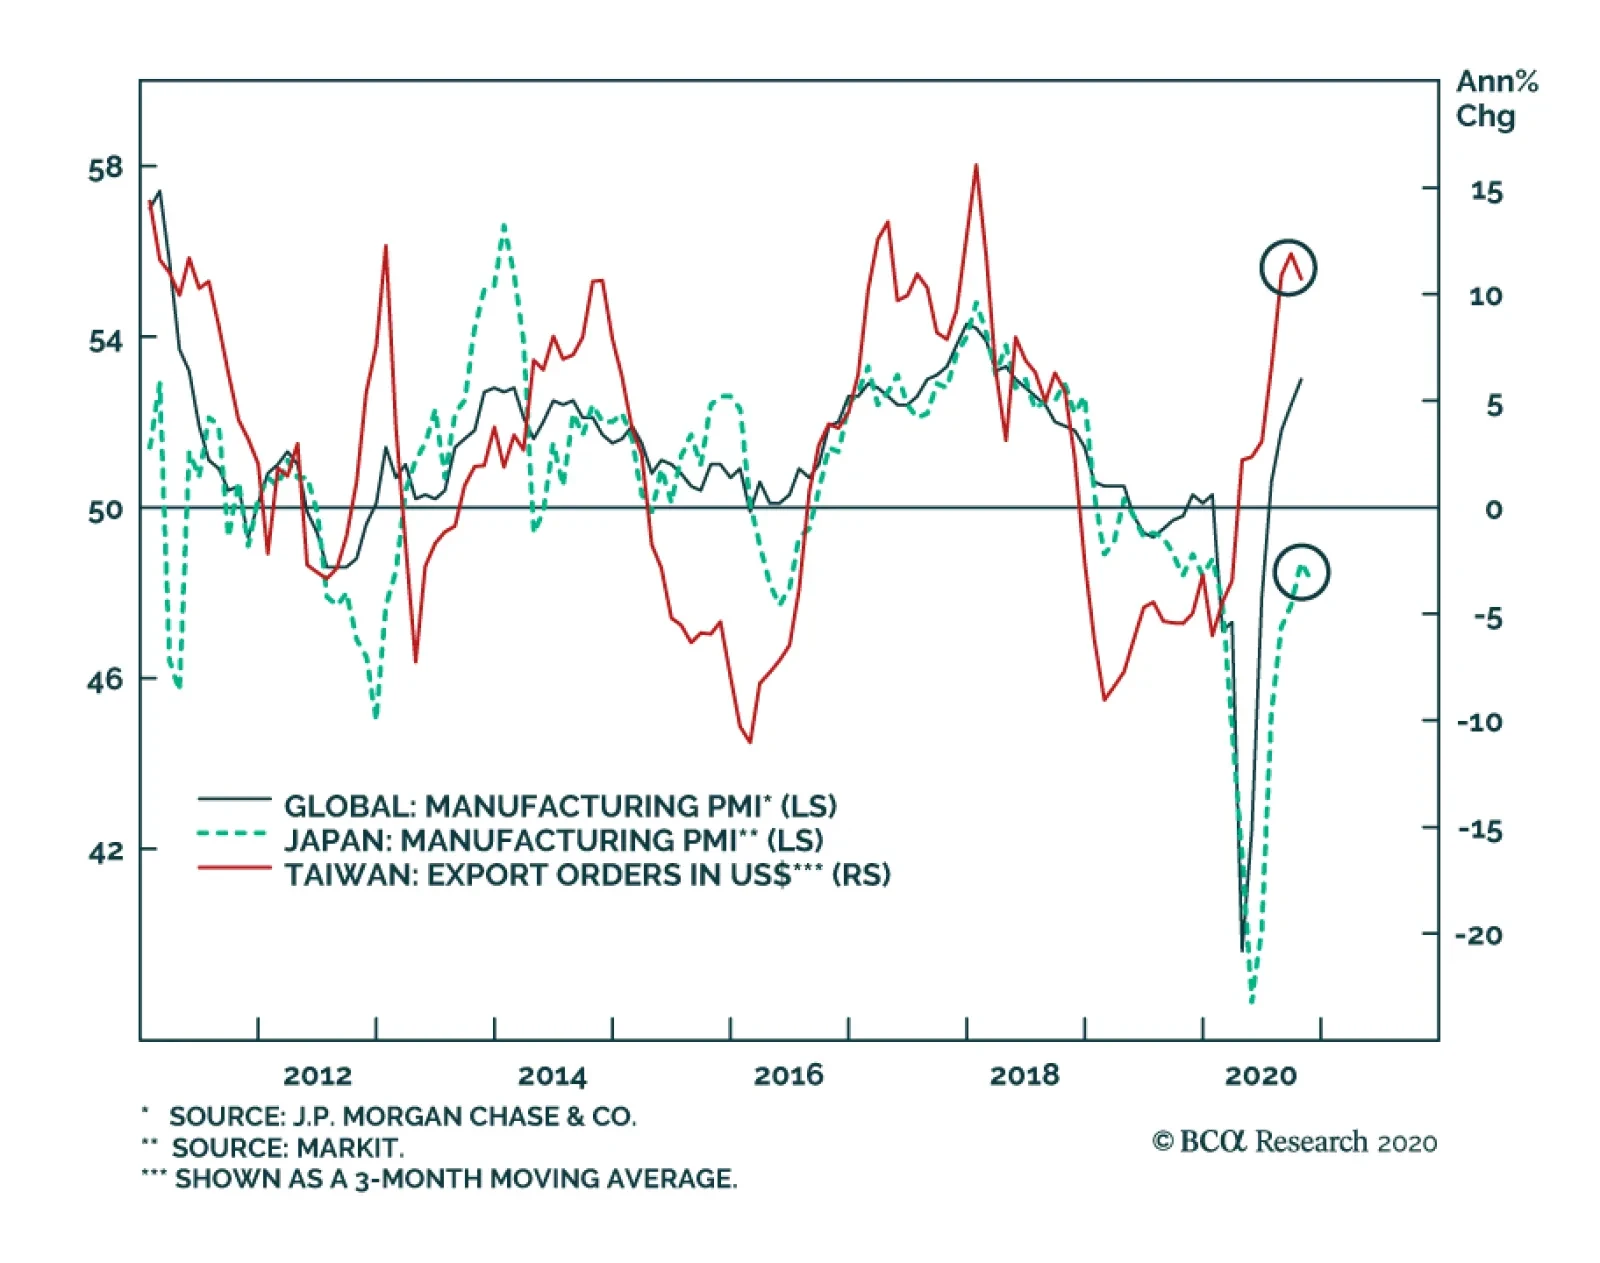
Taiwanese export orders remained resilient in October, ticking down to 9.1% year-on-year (y/y) from 9.9% y/y. An acceleration in the pace of shipments to the US supported the continued strength in Taiwanese exports, and while exports to Hong Kong and China…