Emerging Markets

Highlights Iran is second only to China as a target for President Trump during his “lame duck” two months in office. There is plenty of spare capacity to absorb oil supply disruptions, however. President-Elect Biden will rejoin the 2015 Iranian nuclear deal, but the process will be rocky and we are far from a balance of power in the Middle East. The impact on oil supply is positive but the recovery of global demand will push oil prices up over time regardless. Now is not the right time to go long Middle Eastern equities as a reflation trade. We favor the Trans-Pacific Partnership countries. Israeli stocks can continue outperforming Middle East bourses as a whole, but the rotation from growth to value stocks will benefit other bourses. Prefer the UAE to Turkey, where a large political risk premium will persist. Feature Dear Client, With the US election largely complete, this week marks the return to our regular coverage of global market-relevant political risks. Over the past several months we have focused heavily on every aspect of the US election. The effort was worth it: our final forecast of Democratic White House and a Republican Senate came to pass and our trade recommendations generally performed as expected. Nevertheless it is time to refresh and expand our views on other markets and topics. Geopolitical Strategy has always been – necessarily – a global service offering global coverage. Recent events in China, Europe, Russia, Turkey, and the Middle East demand greater attention – and clients have told us as much. Moreover, with promising vaccine candidates on the horizon, major questions are emerging about what the post-pandemic world will bring. To this end we are returning to our roots with weekly offerings on the full range of global affairs. This week we give you a Special Report on the future of the Middle East by one of BCA’s up-and-coming strategists, Roukaya Ibrahim. We know you will find her post-Trump outlook on the region insightful. As always, we look forward to hearing from you about your research needs and what we can do to answer your geopolitical and investment questions in a timely and actionable manner. Sincerely, Matt Gertken Vice President Geopolitical Strategy The Middle East is about to become a major source of geopolitical risk again. First, President Trump remains in office for two months and is rushing to cement his legacy on the way out. Second, President-Elect Joe Biden will likely face gridlock at home and therefore concentrate the first two years of his presidency on foreign policy. Iran is a priority for both presidents. Biden will rejoin the Joint Comprehensive Plan of Action (JCPA), the 2015 nuclear deal with Iran, which Trump pulled out of in 2018. The purpose of the JCPA was to wind down the US war in Iraq and then “pivot” to Asia, where the US has a much greater interest at stake in managing China’s rise (Chart 1). Chart 1Biden To Restore Obama's 'Pivot To Asia'
Biden To Restore Obama's 'Pivot To Asia'
Biden To Restore Obama's 'Pivot To Asia'
Chart 2Squint To See Iran ... US Will Focus On China
Squint To See Iran ... US Will Focus On China
Squint To See Iran ... US Will Focus On China
China poses a major challenge to the US while Iran poses a minor challenge (Chart 2). Biden’s aim will be to restore President Obama’s legacy. Given that the US president has unilateral authority on foreign policy, and that the 2015 deal was an executive deal without Senate approval, Biden has a good chance of success. But conditions are much less propitious than in 2015. He will not improve on the terms of the 2015 deal. Any return to a nuclear agreement and deeper understanding with Iran should ultimately reduce tensions in the Middle East. But the pathway to a new regional power equilibrium is rocky. So geopolitical risk is frontloaded and will be a near-term negative factor for Middle Eastern equities, which otherwise stand to benefit from global economic recovery. Restoring Iranian oil exports will increase global oil supply but geopolitical conflict will occasionally reduce supply. As always Iraq, wedged between Iran and US allies, is the central battleground for the power struggle in the Middle East (Map 1). Over a six-to-twelve month time frame, the global economy should recover and oil prices should trend upward. Map 1The Persian Gulf Is Filled With Black Swan Risks
The Middle East After Trump And COVID-19
The Middle East After Trump And COVID-19
Biden Looks To Withdraw Like Obama And Trump Chart 3Biden May Regulate, But US Stays Energy-Independent
Biden May Regulate, But US Stays Energy-Independent
Biden May Regulate, But US Stays Energy-Independent
The US’s ascent toward energy self-sufficiency and its geopolitical decline vis-à-vis China have forced Washington to revise its foreign policy over the past decade, resulting in a strategic divestment from the Middle East (Chart 3). The “Pivot to Asia” is a strategic reality evident in the shift in US military commitments – and Trump has ordered new drawdowns on his way out of office. China’s increasing geopolitical pressure on Australia and rising saber-rattling in the Taiwan Strait highlights the need for the energy-independent US to attend to allies elsewhere. The American public’s view of the Middle East as a strategic quagmire is now producing its third presidency. Obama, Trump, and Biden have all pledged to end the country’s “forever wars” in various ways. The risk to this trend, ironically, was Trump’s aggressive policy on Iran. He revoked Obama’s signature diplomatic achievement and tried to squash Iran’s regional role through “maximum pressure” sanctions and occasional military strikes. He also reinforced US allies Israel and Saudi Arabia, rather than trying to rein them in as Obama had done. Biden’s victory implies that the US will once again favor diplomacy and détente with Iran. Although Iran may make a show of resistance to Biden’s overtures and raise its price so as not to appear to have capitulated to the US, it ultimately has little choice. Its economy is on its last legs, it faces widespread popular unrest, and its sphere of influence is crumbling. Hence constraints on both sides point to a restored nuclear deal. The first obstacle is immediate. President Trump’s “lame duck” period through January 20 is a window of opportunity for Israel or Saudi Arabia to make strategic gains while still enjoying full American support. We highlight the allies because they have much more to fear from Iranian power than the US, and more to lose if the Biden administration appeases Iran. The Trump administration has allegedly reviewed options to launch strikes against Iran since the election, but he has also allegedly ruled against them (as in June 2019). While Trump could still take some kind of action, he would likely face obstruction from the Department of Defense if he tried to do anything that would trigger a full-fledged war in his final two months. It falls to the allies then – or Iran – if conflict is to erupt in the near term. Obama, Trump, and Biden have all pledged to end the country’s "forever wars" in various ways. Cyber-attacks on Iranian nuclear sites this summer are a case in point (Table 1). Suspicious explosions, including at the preeminent Natanz nuclear site, were rumored to be the work of Israel and the United States and raised the specter of a military escalation. However, Iran stuck to its policy of “strategic patience,” hoping for a Biden win. Table 1US And Israel Suspected Of Sabotaging Iran This Year
The Middle East After Trump And COVID-19
The Middle East After Trump And COVID-19
It is possible that elements within the Iranian regime, such as the Iranian Revolutionary Guard Corps (IRGC), could launch attacks to deter further sabotage against their infrastructure and capabilities. The IRGC is focused on rigging the 2021 presidential election and ensuring its ascendancy within the Iranian state ahead of the 82 year-old Supreme Leader Ali Khamenei’s succession, so it cannot be assumed to be quiet. The legacy of the outgoing President Rouhani – a relative moderate in Iran’s political scene – hinges on the success of the 2015 agreement, which he pledged would bring economic prosperity to Iran. The deal’s near-collapse has blighted this legacy and triggered a resurgence of hardliners in Iranian politics. This is clear from the February legislative elections in which hardliners won by a landslide (Chart 4). The hardening of the regime will continue, as Khamenei and the IRGC are increasingly focused on solidifying the regime’s security and authority prior to the succession. The next president will almost certainly be a hardliner reminiscent of Mahmoud Ahmadinejad. Oil price volatility should be expected, but over time the vaccine will secure the global economic recovery and oil prices will rise. Still, we assign low odds to Iran instigating a war or pulling out of the JCPA. The past two years have raised the specter of regime collapse. Khamenei is more likely to keep his eye on the prize: a diplomatic agreement with Biden that eases sanctions and thus enables the regime to live to fight another day. This would be his crowning achievement. The change in US leadership offers Tehran an excuse to renegotiate the 2015 deal and blame Trump as an idiosyncratic deviation from an agreement that lay in Iran’s interest. As long as Khamenei retains control of the IRGC this is our base case. Israel is limited in its ability to wage war against Iran alone, but it is not incapable of surgical strikes to set back the clock on the nuclear program, especially if the Trump administration is there to provide assistance in an exigency. The risk is not negligible. Trump’s former National Security Adviser H. R. McMaster has already warned that Israel could act on the “Begin Doctrine” of preemptive strikes against would-be nuclear powers in its neighborhood. While the near-term risk of conflict would remove oil supply, there is a simultaneous risk that cartel behavior would increase supply. Iran’s regional rivals have an interest in preventing a US-Iran deal, but they could not do so in 2015 and ultimately cannot do so today. Therefore they will seek to shore up their political strength in Iraq while undermining the Iranian economy. Saudi Arabia and other oil-producing GCC states benefit from the maximum pressure sanctions that have wiped out Iranian crude exports. The collapse in oil markets is weighing heavily on these economies. An Iranian deal would bring an additional 1mm b/d – 1.5 mm b/d of crude to global markets in short order. Arab petro-states will not cut back on their own production to make room for Iranian crude. They may try to grab greater oil market share ahead of any surge in Iranian exports. In the current oil market environment, Iran has more to lose from the status quo than do its Arab rivals. While ongoing conflict would add to the multiple crises facing Arab oil producers, the risk to oil production is less relevant today than it was at the top of the business cycle. OPEC 2.0 production is ostensibly capped at 36.42 mm b/d but there is plenty of spare capacity to make up for conflict-induced losses (Chart 5). Chart 4Hardliners Roaring Back To Power In Iran
The Middle East After Trump And COVID-19
The Middle East After Trump And COVID-19
Chart 5Plenty Of Spare Oil Production Capacity
Plenty Of Spare Oil Production Capacity
Plenty Of Spare Oil Production Capacity
Bottom Line: Biden’s election ensures that he will try to revive the Iranian nuclear deal and pivot to Asia. While this is positive for Middle Eastern stability over the medium term, it comes with near-term risks. A “lame duck” President Trump or Israel could strike out against Iran. The Gulf Arabs will do what they can to undermine Iran as well. Oil price volatility should be expected, but over the long run the main tendency will be for the global economy to recover and hence for oil prices to rise. Iraq: A Persistent Source Of Instability Iraq is the fulcrum of the US-Iran conflict, as witnessed in January with the US assassination of Quds Force commander Qassem Suleimani. Torn between Tehran and Riyadh, Baghdad remains in political crisis and is the chief battleground in the regional power struggle. Prime Minister Mustafa al-Kadhimi is still struggling to bring Iraq’s various militias, many backed by Iran, under the control of the state. The US embassy, military bases, and other interests have been under attack throughout the summer, prompting Secretary of State Mike Pompeo to threaten to withdraw the US embassy from Baghdad (Table 2). As in the past any escalation between Iran and the US will likely occur in Iraq. Table 2Iran Adopting Deterrence Strategy In Iraq
The Middle East After Trump And COVID-19
The Middle East After Trump And COVID-19
Beyond Trump’s lame duck period, if Washington looks to normalize relations with Iran, then various Iraqi and Saudi forces will try to make sure that Iraq remains independent. Iraq is the critical strategic buffer zone for Saudi Arabia and it will use its leverage with Sunni forces inside Iraq to oppose Iranian domination and warn the US against giving too much to Iran. The problem for Iraq is that the US is divesting from the region and Biden will focus on the Iranian deal to the neglect of other issues. As a result the Saudis will escalate their influence campaign and Iraq will remain unstable. Bottom Line: Iraq is ground zero for the creation of a new regional power equilibrium. If the US manages to secure its allies, even while reviving the Iranian deal, then Iraq has a prospect of stabilization. But the insecurity of US allies will predominate so Iraq remains at risk of instability, militancy, and oil supply disruptions. A New Dawn? Unification to counter Iran is the chief motive behind the Abraham Peace Accords signed between Israel and the UAE, Bahrain, and Sudan with the Trump administration’s mediation (Table 3). Table 3The Abraham Accords Unify Iran’s Regional Rivals
The Middle East After Trump And COVID-19
The Middle East After Trump And COVID-19
Although Israel and the UAE had already been cooperating and sharing intelligence, the deal creates a formal diplomatic partnership against Iran that the countries will need even more as the US pivots to Asia. From Washington’s perspective, the deal enables it to reduce its direct management of the region and delegate authority to its ally and partners. While Saudi Arabia did not sign a deal with Israel, it has signaled a change in strategy. Bahrain is ultimately a Saudi proxy and would not have signed the agreement without Riyadh’s blessing. Moreover, the decision to open Saudi airspace to Israeli airplanes highlights closer cooperation. Additional motives that helped seal the deal: President Trump sought a foreign policy win ahead of the election. The deal reflects his promise to withdraw from the Middle East. Having won 48% of the popular vote, Trump’s approach will loom large over the Republican Party. Israeli Prime Minister Benjamin Netanyahu hoped the deal would secure him a political win amid unpopularity at home. Israel was not even forced to accede to the UAE’s demand to halt the annexation of the West Bank: Netanyahu merely announced that annexation was postponed. And on October 14, only a month after the accords were signed, Israel approved new settler homes in the occupied West Bank. For the UAE, the deal requires little effort but is economically and militarily beneficial. It improves its chances of purchasing long-sought F-35 fighter jets from the US. It is also consequential that the UAE was the first to sign the deal. Abu Dhabi is seeking to raise its stature as a regional power. It has engaged in various Middle Eastern conflicts including in Libya and Yemen and is the only Arab state to have committed troops to Afghanistan for security and humanitarian missions. The UAE has also expanded its influence by being the top source of capex investments in the region (Chart 6). It has emerged as a model Arab state and seeks to replicate that success in its geopolitical status (Chart 7). Chart 6UAE The Top Mideast Investor
The Middle East After Trump And COVID-19
The Middle East After Trump And COVID-19
Ultimately the Abraham Accords reflect a shift in Middle Eastern politics to address the US’s withdrawal and changing landscape. The deal’s signatories seek to improve ties not only to face Iran but also to face Turkey, Russia, and even China. Chart 7UAE Leads The Pack
The Middle East After Trump And COVID-19
The Middle East After Trump And COVID-19
Opinion polls suggest that young Arabs’ favorable perception of the US are linked to its involvement in the region. Their perception of the US as an ally, or somewhat of an ally, increased post-2018 when President Trump initiated his maximum pressure campaign on Iran (Chart 8). Chart 8US Image Has Bottomed Among Arab Youth
The Middle East After Trump And COVID-19
The Middle East After Trump And COVID-19
The Abraham Accords are also significant in that they mark a departure from the Arab Peace Initiative. The Initiative conditions normalization of Arab relations with Israel on Israeli withdrawal from the West Bank, Gaza Strip, Golan Heights, and Lebanon. Until recently, this initiative was a hallmark of regional diplomacy. Palestinians of course have rejected the Abraham Accords and expressed dismay at what they perceive to be disloyalty. Their sidelining could result in an increase in radicalism and militant activity in Israel, though Biden’s election will now blunt that effect and put new demands on Israel. Similarly, Turkey and Qatar oppose the agreement. The rift will widen between the authoritarian states (the GCC and Egypt) and those in favor of political Islam (Turkey and Qatar). Unlike Israel’s previous peace treaties with Egypt and Jordan, which did not result in any economic gains, bilateral economic cooperation is a cornerstone of the Abraham Accords (Table 4). Thus the agreement not only explicitly aligns geopolitical positions in the Middle East, it also weaves Israel into the region’s economies, generating gains for all sides and cementing the partnership. This is a positive example of Trump’s transactional approach to foreign policy. Table 4The Abraham Accords By Sector
The Middle East After Trump And COVID-19
The Middle East After Trump And COVID-19
Bottom Line: The Abraham Accords reflect long-developing structural changes in the Middle East. With the US reducing its direct management in the region, Israel and the Arab states are drawing together – particularly in opposition to Iran. If Biden restores the Iranian nuclear deal, there may be a semblance of balance in the region. But its durability will depend on the uncertain willingness of the US to keep the peace. Great Power Struggle Instability stemming from Washington’s shift away from the Middle East is being exacerbated by the competition by great powers and middle powers over filling the power vacuum. Russian and Turkish interference has had mixed results. Both are exerting their influence through greater military engagement in Syria and Libya, in which they have partially stabilized these countries. For instance, Moscow’s 2015 decision to send its air force and some ground troops to Syria reversed President Bashar al-Assad’s fate in Syria, giving him new life. Similarly, Ankara’s increased involvement in the Libyan crisis earlier this year helped the Tripoli-based government drive General Khalifa Haftar’s Libyan National Army back to its eastern enclave. Chart 9AChina Pivots To Middle East
China Pivots To Middle East
China Pivots To Middle East
Yet Russia’s commitment is deliberately limited and likely to become more limited due to increasing domestic political risks. Turkey’s ruling Justice and Development Party has been in power for two decades, is showing economic and political weakness, and is overreaching in international conflicts. Therefore these countries’ interventions do not have a high degree of staying power or predictability. A more durable trend is China’s growing influence in the region. China’s approach emphasizes soft power rather than hard power, but the latter will gradually come into play. China’s main motive is to secure oil supplies. It has emerged as the top oil importer, 46% of which are sourced from the Middle East (Charts 9A and 9B). Chinese interest in the region is evident in its “Comprehensive Strategic Partnerships” (the highest of China’s diplomatic levels) with several key regional actors (Table 5). Chart 9BChina’s Mideast Dependency Grows
The Middle East After Trump And COVID-19
The Middle East After Trump And COVID-19
Rather than interfering in regional politics, China has favored economic cooperation. It has emerged as a top foreign investor in the Arab region (Chart 10 and see Chart 16 below). Table 5China Cultivates Mideast Relations
The Middle East After Trump And COVID-19
The Middle East After Trump And COVID-19
Chart 10Awaiting Return Of Chinese Investment
The Middle East After Trump And COVID-19
The Middle East After Trump And COVID-19
This approach has been well received by the Arab population, at least the younger generations. The Arab youth see China the most favorably among all the competing foreign actors (Chart 11). Chart 11Arab Youth Have Positive Views Of China
The Middle East After Trump And COVID-19
The Middle East After Trump And COVID-19
However, China is also becoming more scrutinizing of its investments in the region. The Belt and Road Initiative is no longer just a blank check. Beijing’s investments are starting to pick up and will continue to revive as its economy recovers in the coming years, but Middle Eastern states will not be able to assume they have China’s unconditional support (Chart 12). Chart 12China's Investment Just Starting To Revive, At Best
China's Investment Just Starting To Revive, At Best
China's Investment Just Starting To Revive, At Best
While China has improved relations with Saudi Arabia and the GCC during the Trump administration’s conflict with Iran, Biden raises the possibility of China reviving its interest in Iran, which is a key linchpin of its Belt and Road Initiative and other strategies of deepening economic relations across Eurasia. Gradually China will take a more obtrusive role. It built its first overseas military base in Djibouti in 2017. Moreover, the strategic pact with Iran it is negotiating, which is likely to be very large even if lower than the official price tag of $400 billion over 25 years, also includes military cooperation. If US-China tensions persist at today’s high levels, China will try to improve its supply security in the Middle East, which will eventually become another front in the new cold war. Bottom Line: The power vacuum left by the US’s reduced commitment to the region has not been filled by any of the major or middle powers. Russian, Chinese, and Turkish actions are unclear and in some cases contradictory. China has the potential to fill in some of the vacuum, but at the moment Chinese strategic involvement is nascent. Détente between the US and Iran clears the way for China to revive relations with Iran, a linchpin of its global, regional, and Eurasian strategy. Economic Progress … Interrupted While these cyclical and structural geopolitical shifts play out, Middle Eastern states also find themselves in a weak economic situation. The double whammy of pandemic and the collapse in oil prices is weighing on household, corporate, and government budgets. It is exposing long-standing vulnerabilities, unwinding recent progress, and introducing new challenges. Arab petro-states face a funding gap in the midst of economic contraction. With oil prices significantly below those needed to balance their budgets, they are re-prioritizing their spending (Chart 13). Chart 13Fiscal Squeeze Hits Arab Petro-States
The Middle East After Trump And COVID-19
The Middle East After Trump And COVID-19
While this adjustment has come at the expense of strategic economic plans, in some cases it has also led to an acceleration of fiscal reforms. Oman and Saudi Arabia are cases in point. Oman has been implementing a 5% value-added tax (VAT) since April and plans to impose taxes on high-income earners beginning 2022. Similarly, Saudi Arabia tripled its VAT from 5% to 15%, eliminated a bonus cost-of-living allowance previously granted to public sector employees, and increased custom duties for several imported goods. The immediate aim of these measures is to offset some of the weakness in oil revenues (Chart 14). But over the long run they align with the strategic objective of transitioning from resource-dependent rentier states to economically diverse ones. While the economic shock has weighed on both household and government budgets, the GCC oil producers generally enjoy low debt-to-GDP ratios and comfortable government coffers. They are better positioned than their neighbors to survive the downturn without it morphing into a social, political, or economic crisis. Oil-importing Arab states, on the other hand, face limited fiscal space and have been forced to walk back recent structural reform progress while limiting their fiscal response to the recession (Chart 15). Egypt is highly dependent on tourism and remittances from Arab petro-states. The recession has reversed the improvement in its fiscal situation following austerity measures imposed as part of the three year IMF program. Chart 14Fiscal Reforms Underway
The Middle East After Trump And COVID-19
The Middle East After Trump And COVID-19
Chart 15More Stimulus Needed
The Middle East After Trump And COVID-19
The Middle East After Trump And COVID-19
That said, as long as nominal GDP outpaces interest on the debt, these countries will avoid a debt crisis. Although Egypt’s 10-year yield is 14.8%, its expected nominal GDP growth of 19.7% this year will ensure debt sustainability. By contrast, Tunisia is more at risk, as the yield on its 10-year government bond is near 10% yet nominal growth lags in the single digits. While policymakers across the region have implemented measures to ease burdens on households through various policies, Gulf Arab states have in some cases limited the benefits to nationals. For instance, the Qatari government announced on June 1 that it would reduce non-Qatari employee wage bills by 30%. While this protects the incomes of GCC nationals, it puts non-nationals at risk of income loss, raising the possibility that weakness among oil-producers will be transferred to non-oil producers. Chart 16Iran Teetering On Edge
Iran Teetering On Edge
Iran Teetering On Edge
This is not to say that GCC nationals are completely immune to income or employment loss. In fact, the unemployment rate among Saudi nationals, which was already higher than the overall unemployment rate, jumped 2.5 pp in the second quarter to 15.5%. The Shia Crescent remains the most vulnerable neighborhood in the Middle East. Syria collapsed over the past decade, Lebanon is in the process of collapse, and Iran and Iraq are teetering (Chart 16). The IMF estimates that Iran needs oil prices at $521.2/bbl to balance its fiscal account! Weakness in Iran has spread across its sphere of influence — i.e. other predominantly Shia states and non-state actors who depend on Tehran for informal funding. Mass protests against poor economic conditions and corruption afflicted Iraq and Lebanon in the fall of 2019, forcing both governments to resign late last year. The political and economic situations have only deteriorated since. The August 4 blast at the Port of Beirut was the final straw for Lebanon which is now facing financial meltdown. Meanwhile, Iraq’s stability continues to be tested. The collapse in oil markets has weighed on government revenues as well as on the current account, which is projected to record a deficit worth 12.6% of GDP this year, following surpluses in the previous years. The good news is that the discovery of a COVID-19 vaccine points to a rebound in global economic activity over the coming 12 months. The bad news is that the virus is breaking out again and the distribution of the vaccine will take time. Eventually the combination of vaccines and additional monetary and fiscal stimulus in the developed world will alleviate some of the Middle East’s deepest strains, but it will be a rocky road. Social and political problems will escalate for some time even after the economy bottoms. Regarding the outlook for oil markets, BCA’s Commodity & Energy Strategists see the confluence of steadily improving demand, a decline in US shale-oil production, and OPEC 2.0 production management pushing oil prices higher. They forecast Brent will average $63 per barrel next year, compared to $44 per barrel at current prices, and they make a good fundamental case for oil to average between $65 - $70 per barrel over the coming five years. The latest readings from global manufacturing PMIs send bullish signals, suggesting that Middle Eastern recovery is gradually underway (Chart 17). It is the near-term that is most treacherous. Chart 17Global Rebound Not A Moment Too Soon
Global Rebound Not A Moment Too Soon
Global Rebound Not A Moment Too Soon
Chart 18New Lockdowns Pose Near-Term Risks
The Middle East After Trump And COVID-19
The Middle East After Trump And COVID-19
On the demand-side, COVID-19 cases globally are trending upward with several European countries imposing partial lockdowns (Chart 18). While the lockdowns are unlikely to be as severe as earlier this year, they threaten to delay the recovery in oil markets. In response, the OPEC 2.0 coalition of producers, which was planning to reduce production cuts to 5.7 mm barrel per day in January (leading to higher output) may instead extend the current 7.7 mm barrel per day cuts when it meets again in December 2020. This means petro-states will need to contend with low prices and revenues for longer, while oil importers see shortfalls in remittances. Aside from risks to the oil market, the resurgence in COVID-19 cases adds further uncertainty to the expected recovery in global growth through knock-on effects on activity. Even though not all Middle Eastern countries are experiencing the second wave of the disease, governments have generally tightened stringency measures recently (Chart 19). Chart 19COVID-19 Restrictions Vary By Country
The Middle East After Trump And COVID-19
The Middle East After Trump And COVID-19
Bottom Line: Middle Eastern economies have been hit hard by the double whammy of pandemic and oil price collapse. Policy responses have been measured to limit deviation from long-term goals. This is a positive for the long-term outlook. We expect improvements in the global economy and the recovery in oil markets over the coming 12 months to alleviate some of the pressure. However, risks are skewed to the downside and a protracted downturn could put to waste recent structural improvements. Countries that lie in the so-called “Shia Crescent” – Iran, Iraq, and Lebanon – are in dire need of resuscitation. Oil importers face the risk that the cyclical downturn unwinds recent economic improvements and uncovers structural vulnerabilities, weighing on the strategic outlook. Arab petro-states enjoy the most comfortable coffers. But even their economies are at risk, especially in the high-risk scenario in which oil markets do not recover anytime soon. Saudi Arabia and Oman are at a disadvantage versus Qatar in this sense given their outsized dependence on oil and higher fiscal breakeven oil price. Investment Implications Middle Eastern equity market capitalization is growing over time relative to the rest of the world (Chart 20). The region remains a reflation play, with a heavy sectoral focus on materials and financials as well as energy. Thus it stands to benefit over the long run as the global recovery gets underway. Chart 20Investors Gaining Interest In Mideast Over Time
Investors Gaining Interest In Mideast Over Time
Investors Gaining Interest In Mideast Over Time
However, today is not an attractive entry point for the Middle East relative to other emerging markets. The rebalancing of oil markets, the current wave of COVID-19 before the vaccine rollout, and near-term geopolitical risks outlined above imply that the Middle East will face a period of heightened uncertainty and uninspiring equity performance. Protracted economic weakness will weigh on social stability. The oil-rich GCC is least vulnerable to popular unrest as it has the space to be generous to its citizens. But even these countries have had to cut some benefits. The pandemic will erode the social contract currently in place whereby monetary incentives are awarded to make up for the lack of political voice. The Shia Crescent is already in crisis as bouts of mass protests have been occurring in Iran, Iraq, and Lebanon for the past year. And the pandemic has derailed the economic recovery of various states that had only recently gotten back on track after the Arab Spring. Another bout of economic weakness will push people back into the streets, threatening to topple governments again (Chart 21). Chart 21Unrest Will Rise Even After Economic Bottom
The Middle East After Trump And COVID-19
The Middle East After Trump And COVID-19
A good entry point into Middle Eastern equities will emerge once the global economy gets onto a better footing as the US and Iran will likely achieve a precarious balance. Geopolitics and the recession are forcing Arab states to adopt greater pragmatism in their economic and foreign policies. Reform policies are creating more diverse economies, as in the case of the UAE (Chart 22), which, unlike Saudi Arabia, is decoupling its equity performance from oil prices. Chart 22UAE About Financials, Saudi About Oil
UAE About Financials, Saudi About Oil
UAE About Financials, Saudi About Oil
The risk to Israel, aside from politics, is that it is a tech-heavy bourse that could start to underperform neighbors like the UAE amid the likely global rotation into value stocks and cyclicals. Chart 23Israel Outperforms, But Beware Rotation To Value
Israel Outperforms, But Beware Rotation To Value
Israel Outperforms, But Beware Rotation To Value
Israel has been outperforming the broad Middle East basket, including the UAE, and that trend looks to continue. But it does not look attractive relative to emerging markets as a whole. The risk to Israel, aside from politics, is that it is a tech-heavy bourse that could start to underperform neighbors like the UAE amid the likely global rotation into value stocks and cyclicals. Israel equity performance relative to Turkey closely tracks global growth versus value stocks (Chart 23). However, we do not recommend playing this specific pair trade. For that we would also need to see an improvement in Turkish governance. Turkey may benefit from global macro developments but its country risk will remain extreme. The recent change of central bank leadership temporarily improved Turkey’s relative performance but does not mark a fundamentally positive turning point in policy, according to BCA’s Emerging Markets Strategist Arthur Budaghyan. President Recep Erdogan is unlikely to adopt orthodox monetary policy and austerity prior to the 2022 elections. The approach of the elections, and several simultaneous foreign adventures, will keep the Turkish political risk premium elevated. Therefore the UAE provides the better long end of a value play on the Middle East. Roukaya Ibrahim Editor/Strategist Geopolitical Strategy RoukayaI@bcaresearch.com
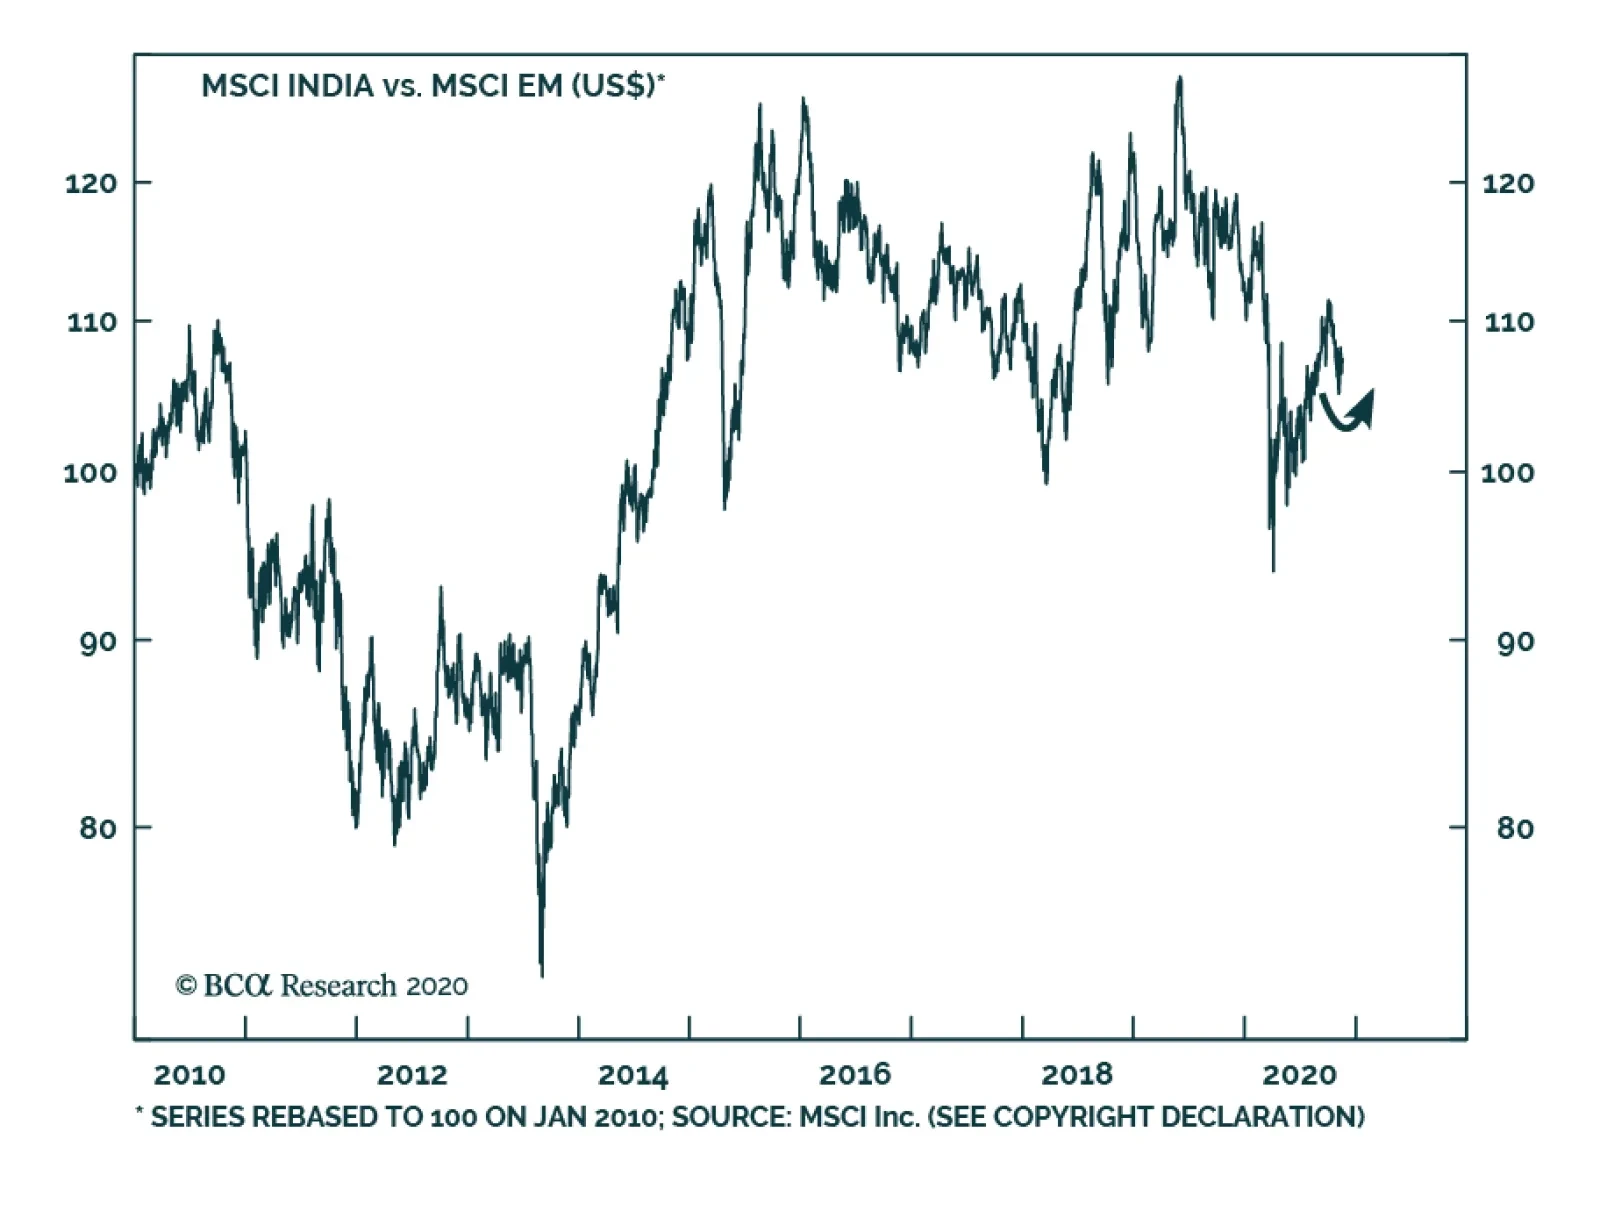
According to BCA Research's Emerging Markets Strategy service, India's structural reform agenda warrants upgrading Indian stocks to neutral within an EM equity portfolio. While valuations are expensive, part of the premium can be attributed to India being one…
We are publishing the November issue of Charts That Matter. The key message from the charts on the following pages is that investor sentiment on global growth is elevated and the reflation trade is a bit overstretched. As a result, risk assets and commodities prices will likely correct, and the US dollar will rebound. Investors should keep dry powder to buy EM assets at a better entry point. A trigger for a selloff could be one or a combination of the following: the lack of a large US fiscal stimulus package, falling activity in Europe, peak stimulus in China or the recent jitter in the Chinese onshore corporate bond market. CHART OF THE WEEKThe Global Stock-To-Bond Ratio Is At A Critical Juncture
The Global Stock-To-Bond Ratio Is At A Critical Juncture
The Global Stock-To-Bond Ratio Is At A Critical Juncture
US Equity Sentiment Is Elevated US equity sentiment is somewhat elevated and is consistent with a correction in share prices. Chart 1US Equity Sentiment Is Elevated
US Equity Sentiment Is Elevated
US Equity Sentiment Is Elevated
Chart 2US Equity Sentiment Is Elevated
US Equity Sentiment Is Elevated
US Equity Sentiment Is Elevated
Peak Growth Sentiment Investors are quite optimistic on global growth. A record large net long positions in copper corroborate a very bullish investor stance on China/EM growth. From a contrarian perspective, this heralds a correction in commodities prices and EM as well as a rebound in the US dollar. Chart 3Peak Growth Sentiment
Peak Growth Sentiment
Peak Growth Sentiment
Chart 4Peak Growth Sentiment
Peak Growth Sentiment
Peak Growth Sentiment
Defensive Versus Cyclical Equity Segments Defensive sectors/markets have been underperforming and are oversold. Their outperformance is likely in the near term. Chart 5Defensive Versus Cyclical Equity Segments
Defensive Versus Cyclical Equity Segments
Defensive Versus Cyclical Equity Segments
Chart 6Defensive Versus Cyclical Equity Segments
Defensive Versus Cyclical Equity Segments
Defensive Versus Cyclical Equity Segments
Near-Term Risks To Industrial Metal Prices The Baltic Dry index is falling and iron ore prices have relapsed. This is consistent with diminishing Chinese imports of iron ore. However, iron ore inventories in China are not excessive, so odds are it is a correction and not a bear market in iron ore prices. Chart 7Near-Term Risks To Industrial Metal Prices
Near-Term Risks To Industrial Metal Prices
Near-Term Risks To Industrial Metal Prices
Chart 8Near-Term Risks To Industrial Metal Prices
Near-Term Risks To Industrial Metal Prices
Near-Term Risks To Industrial Metal Prices
Chart 9Near-Term Risks To Industrial Metal Prices
Near-Term Risks To Industrial Metal Prices
Near-Term Risks To Industrial Metal Prices
Chinese Imports Of Commodities Are At Risk From Destocking Starting April-May, Chinese imports of copper and other commodities was running at very high rates, exceeding any reasonable estimates of final demand. This suggests China has been accumulating commodities. Even as final demand continues recovering, China might diminish imports of commodities weighing on their prices in the near term. Chart 10Chinese Imports Of Commodities Are At Risk From Destocking
Chinese Imports Of Commodities Are At Risk From Destocking
Chinese Imports Of Commodities Are At Risk From Destocking
Chart 11Chinese Imports Of Commodities Are At Risk From Destocking
Chinese Imports Of Commodities Are At Risk From Destocking
Chinese Imports Of Commodities Are At Risk From Destocking
Oil Prices, Energy Stocks And Glencore Share Price Oil prices and energy stocks are facing a technical resistance. Yet, the share price of the world’s largest global commodity trader – Glencore – seems to be breaking out. The coming weeks will reveal which way the commodities complex will trade. Our bias is that a near-term correction is overdue. The US dollar holds the key, please refer to the next page. Chart 12Oil Prices, Energy Stocks And Glencore Share Price
Oil Prices, Energy Stocks And Glencore Share Price
Oil Prices, Energy Stocks And Glencore Share Price
Chart 13Oil Prices, Energy Stocks And Glencore Share Price
Oil Prices, Energy Stocks And Glencore Share Price
Oil Prices, Energy Stocks And Glencore Share Price
Rising US Real Rates (TIPS Yields) Will Lead To A US Dollar Rebound US inflation expectations – which have risen sharply since March – are likely to retreat as the US Senate does not approve a large fiscal stimulus package. Falling US inflation expectations will translate into higher TIPS yields. The latter and very bearish sentiment/positioning on the US dollar will trigger a rebound in the greenback. Chart 14Rising US Real Rates (TIPS Yields) Will Lead To A US Dollar Rebound
Rising US Real Rates (TIPS Yields) Will Lead To A US Dollar Rebound
Rising US Real Rates (TIPS Yields) Will Lead To A US Dollar Rebound
Chart 15Rising US Real Rates (TIPS Yields) Will Lead To A US Dollar Rebound
Rising US Real Rates (TIPS Yields) Will Lead To A US Dollar Rebound
Rising US Real Rates (TIPS Yields) Will Lead To A US Dollar Rebound
Chart 16Rising US Real Rates (TIPS Yields) Will Lead To A US Dollar Rebound
Rising US Real Rates (TIPS Yields) Will Lead To A US Dollar Rebound
Rising US Real Rates (TIPS Yields) Will Lead To A US Dollar Rebound
US Elections And The US Dollar: Is 2020 The Opposite Of 2016? After the 2016 US elections, the US dollar rallied strongly for several weeks and then it sold off considerably. It seems the broad trade-weighted dollar is following a reverse pattern now. It was selling off before the 2020 US elections and has continued weakening afterwards. If the reverse of the 2016 pattern persists, it means the US dollar is about make a major bottom and stage a playable rebound. Chart 17US Elections And The US Dollar: Is 2020 The Opposite Of 2016?
US Elections And The US Dollar: Is 2020 The Opposite Of 2016?
US Elections And The US Dollar: Is 2020 The Opposite Of 2016?
Chart 18US Elections And The US Dollar: Is 2020 The Opposite Of 2016?
US Elections And The US Dollar: Is 2020 The Opposite Of 2016?
US Elections And The US Dollar: Is 2020 The Opposite Of 2016?
Chart 19US Elections And The US Dollar: Is 2020 The Opposite Of 2016?
US Elections And The US Dollar: Is 2020 The Opposite Of 2016?
US Elections And The US Dollar: Is 2020 The Opposite Of 2016?
More Reasons To Expect A US Dollar Rebound The periods when US share prices outperform their global peers in local currency terms often coincide with strength in the US dollar. Recently, this relationship has broken down. The greenback might soon recouple to the upside, re-establishing this relationship (Chart 21). Besides, the broad trade-weighted dollar is very oversold (Chart 22). Chart 20More Reasons To Expect A US Dollar Rebound
More Reasons To Expect A US Dollar Rebound
More Reasons To Expect A US Dollar Rebound
Chart 21More Reasons To Expect A US Dollar Rebound
More Reasons To Expect A US Dollar Rebound
More Reasons To Expect A US Dollar Rebound
Rising Real US Yields And Growth Stocks Rising US TIPS yields could create headwinds for growth stocks. FAANG and Tencent share prices have risen about 20-fold since January 2010 – as much as the Nasdaq 100 did in the 1990s before topping out. Chart 22Rising Real US Yields And Growth Stocks
Rising Real US Yields And Growth Stocks
Rising Real US Yields And Growth Stocks
Chart 23Rising Real US Yields And Growth Stocks
Rising Real US Yields And Growth Stocks
Rising Real US Yields And Growth Stocks
Drivers Of EM Corporate And Sovereign Credit Spreads EM corporate and sovereign credit spreads are driven by EM exchange rates and commodities prices. A potential US dollar rebound and a correction in commodities prices warrant near-term caution on EM credit markets. Chart 24Drivers Of EM Corporate And Sovereign Credit Spreads
Drivers Of EM Corporate And Sovereign Credit Spreads
Drivers Of EM Corporate And Sovereign Credit Spreads
Chart 25Drivers Of EM Corporate And Sovereign Credit Spreads
Drivers Of EM Corporate And Sovereign Credit Spreads
Drivers Of EM Corporate And Sovereign Credit Spreads
Messages From Indicators And Chart Patterns Various indicators and technical chart configurations send mixed signals. Our bias is to expect a correction in risk assets in the near term. Chart 26Messages From Indicators And Chart Patterns
Messages From Indicators And Chart Patterns
Messages From Indicators And Chart Patterns
Chart 27Messages From Indicators And Chart Patterns
Messages From Indicators And Chart Patterns
Messages From Indicators And Chart Patterns
Chart 28Messages From Indicators And Chart Patterns
Messages From Indicators And Chart Patterns
Messages From Indicators And Chart Patterns
Chart 29Messages From Indicators And Chart Patterns
Messages From Indicators And Chart Patterns
Messages From Indicators And Chart Patterns
Peak Stimulus In China Fiscal stimulus is running out. In addition, the PBoC has been tightening liquidity in the interbank market and interest rates have risen. Banks’ loan approvals have rolled over. All these point to a peak in the credit and fiscal impulse as well as money impulses in Q4 2020. Does it mean China’s economy is about to decelerate? – refer to the next page. Chart 30Peak Stimulus In China
Peak Stimulus In China
Peak Stimulus In China
Chart 31Peak Stimulus In China
Peak Stimulus In China
Peak Stimulus In China
Chart 32Peak Stimulus In China
Peak Stimulus In China
Peak Stimulus In China
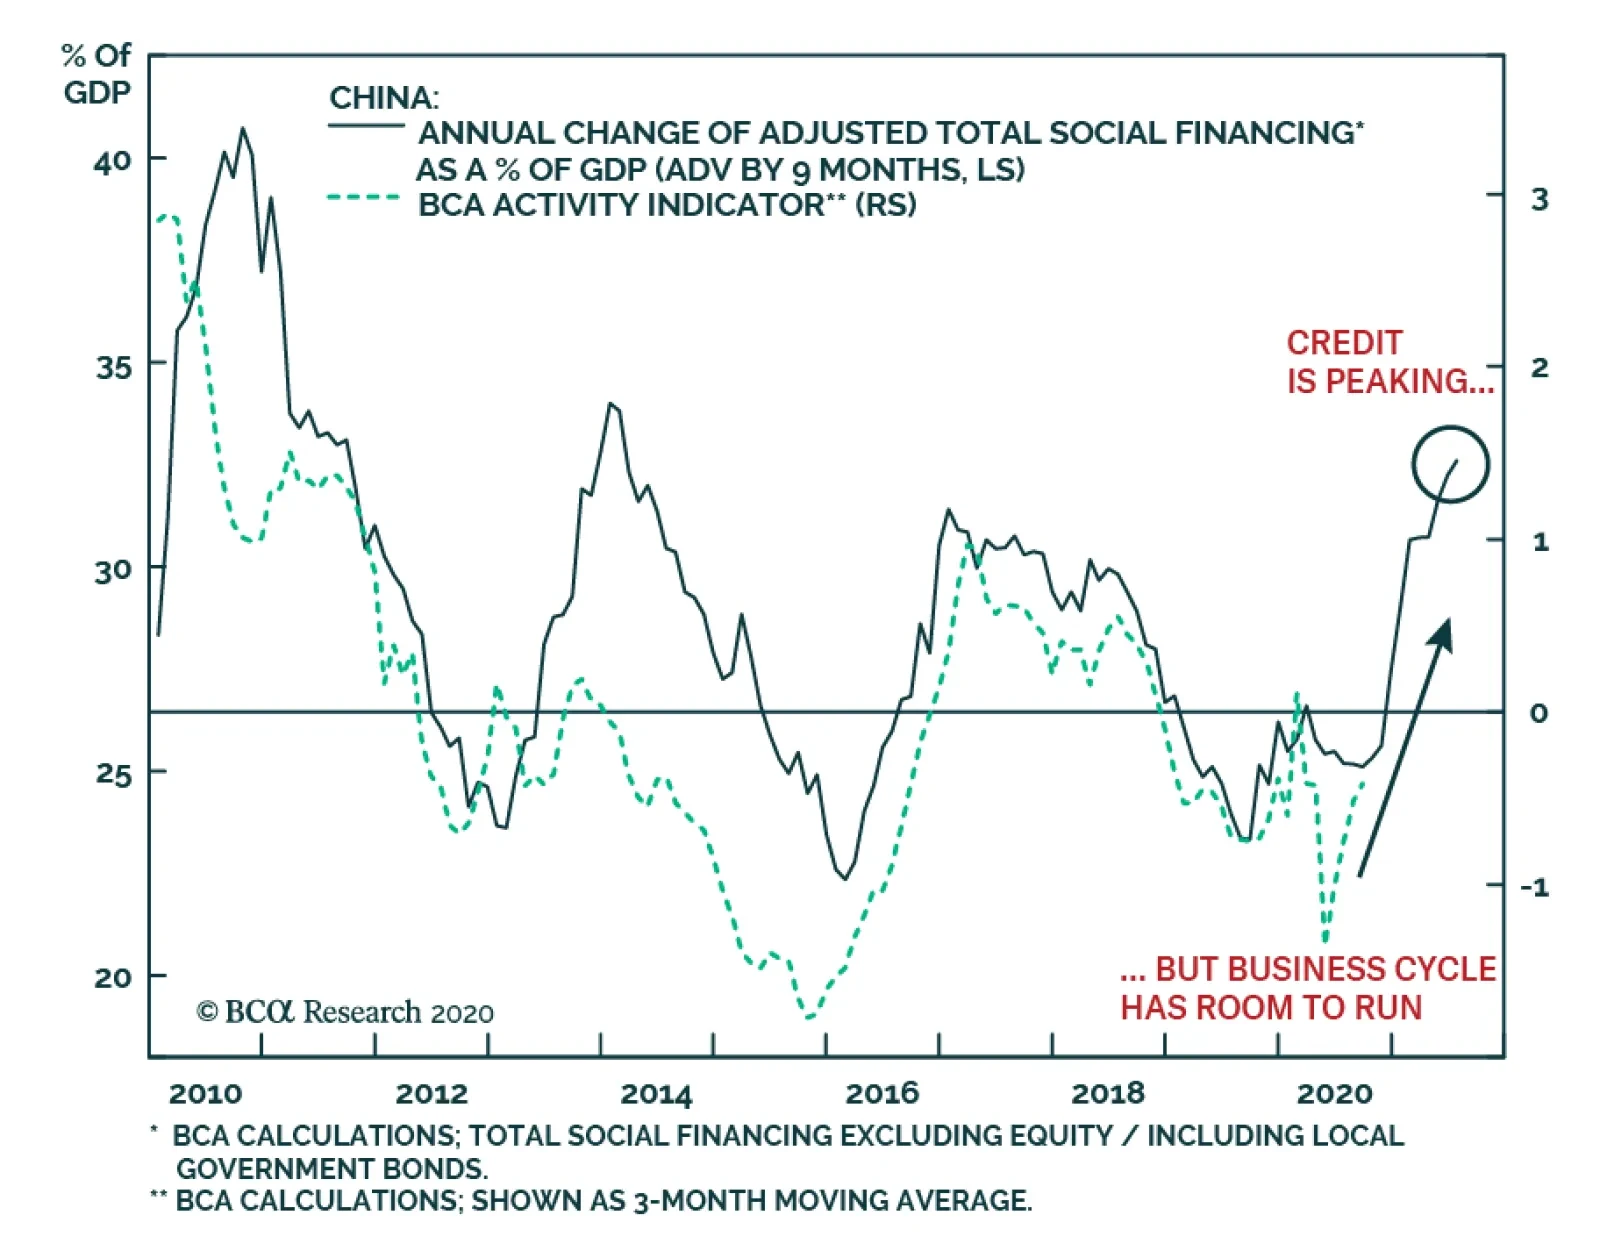
China: Business Cycle Expansion To Continue In H1 2021 Our credit and fiscal spending impulse points to a continuous expansion in the Chinese economy for now. If the credit and fiscal impulse rolls over in Q4 2020, as shown in the previous page, the business cycle in China will peak around middle of 2021 given the nine-month time lag between this impulse and economic data. Chart 33China: Business Cycle Expansion To Continue in H1 2021
China: Business Cycle Expansion To Continue in H1 2021
China: Business Cycle Expansion To Continue in H1 2021
Chart 35China: Business Cycle Expansion To Continue in H1 2021
China: Business Cycle Expansion To Continue in H1 2021
China: Business Cycle Expansion To Continue in H1 2021
Chart 34China: Business Cycle Expansion To Continue in H1 2021
China: Business Cycle Expansion To Continue in H1 2021
China: Business Cycle Expansion To Continue in H1 2021
Stress In The Chinese Onshore Corporate Bond Market The recent defaults by several SOEs on their bond payments have led to a spike in corporate bond yields. However, there is no stable historical relationship between onshore corporate bond yields and the A-share market. Chart 36Stress In The Chinese Onshore Corporate Bond Market
Stress In The Chinese Onshore Corporate Bond Market
Stress In The Chinese Onshore Corporate Bond Market
Chart 37Stress In The Chinese Onshore Corporate Bond Market
Stress In The Chinese Onshore Corporate Bond Market
Stress In The Chinese Onshore Corporate Bond Market
Chart 38Stress In The Chinese Onshore Corporate Bond Market
Stress In The Chinese Onshore Corporate Bond Market
Stress In The Chinese Onshore Corporate Bond Market
China: Can Share Prices Rally Amid Rising Corporate Borrowing Costs? During periods of rising onshore corporate bond yields, the MSCI ex-TMT Investable equity index rallied if Chinese EPS expectations where improving. The latest rollover in EPS growth expectations amid rising corporate bond yields is a warning to share prices. Chart 39China: Can Share Prices Rally Amid Rising Corporate Borrowing Costs?
China: Can Share Prices Rally Amid Rising Corporate Borrowing Costs?
China: Can Share Prices Rally Amid Rising Corporate Borrowing Costs?
Chinese And EM Equity Relative Performance Versus Global Stocks China’s outperformance versus global stocks has been due to its TMT stocks (Alibaba, Tencent and Meituan). In turn, excluding Chinese stocks, EM ex-China has not really outperformed the global equity index. Chart 40Chinese And EM Equity Relative Performance Versus Global Stocks
Chinese And EM Equity Relative Performance Versus Global Stocks
Chinese And EM Equity Relative Performance Versus Global Stocks
Chart 41Chinese And EM Equity Relative Performance Versus Global Stocks
Chinese And EM Equity Relative Performance Versus Global Stocks
Chinese And EM Equity Relative Performance Versus Global Stocks
Various EM Equity Indexes Till very recent (before the announcement of progress in vaccines), EM small caps, the equal-weighted index, EM ex-TMT stocks and the EM index ex-China, Korea and Taiwan had been lackluster. Will the latest spike persist? It depends on the S&P500 and global risk asset performance. Chart 42Various EM Equity Indexes
Various EM Equity Indexes
Various EM Equity Indexes
Chart 43Various EM Equity Indexes
Various EM Equity Indexes
Various EM Equity Indexes
Chart 44Various EM Equity Indexes
Various EM Equity Indexes
Various EM Equity Indexes
Chart 45Various EM Equity Indexes
Various EM Equity Indexes
Various EM Equity Indexes
Emerging Asia And Overall EM Relative Equity Performance Versus Global Stocks Emerging Asia’s and overall EM relative performance versus global stocks is unlikely to break out now. We continue recommending a neutral allocation to EM equities in a global equity portfolio. Chart 46Emerging Asia And Overall EM Relative Equity Performance Versus Global Stocks
Emerging Asia And Overall EM Relative Equity Performance Versus Global Stocks
Emerging Asia And Overall EM Relative Equity Performance Versus Global Stocks
Chart 47Emerging Asia And Overall EM Relative Equity Performance Versus Global Stocks
Emerging Asia And Overall EM Relative Equity Performance Versus Global Stocks
Emerging Asia And Overall EM Relative Equity Performance Versus Global Stocks
Chart 48Emerging Asia And Overall EM Relative Equity Performance Versus Global Stocks
Emerging Asia And Overall EM Relative Equity Performance Versus Global Stocks
Emerging Asia And Overall EM Relative Equity Performance Versus Global Stocks
Chart 49Emerging Asia And Overall EM Relative Equity Performance Versus Global Stocks
Emerging Asia And Overall EM Relative Equity Performance Versus Global Stocks
Emerging Asia And Overall EM Relative Equity Performance Versus Global Stocks
Equities Recommendations Currencies, Credit And Fixed-Income Recommendations
According to BCA Research's China Investment Strategy service, at least a good portion of the recent capital outflows out of China likely occurred due to an effort by Chinese policymakers to slow the pace of the RMB’s appreciation against a basket of its…
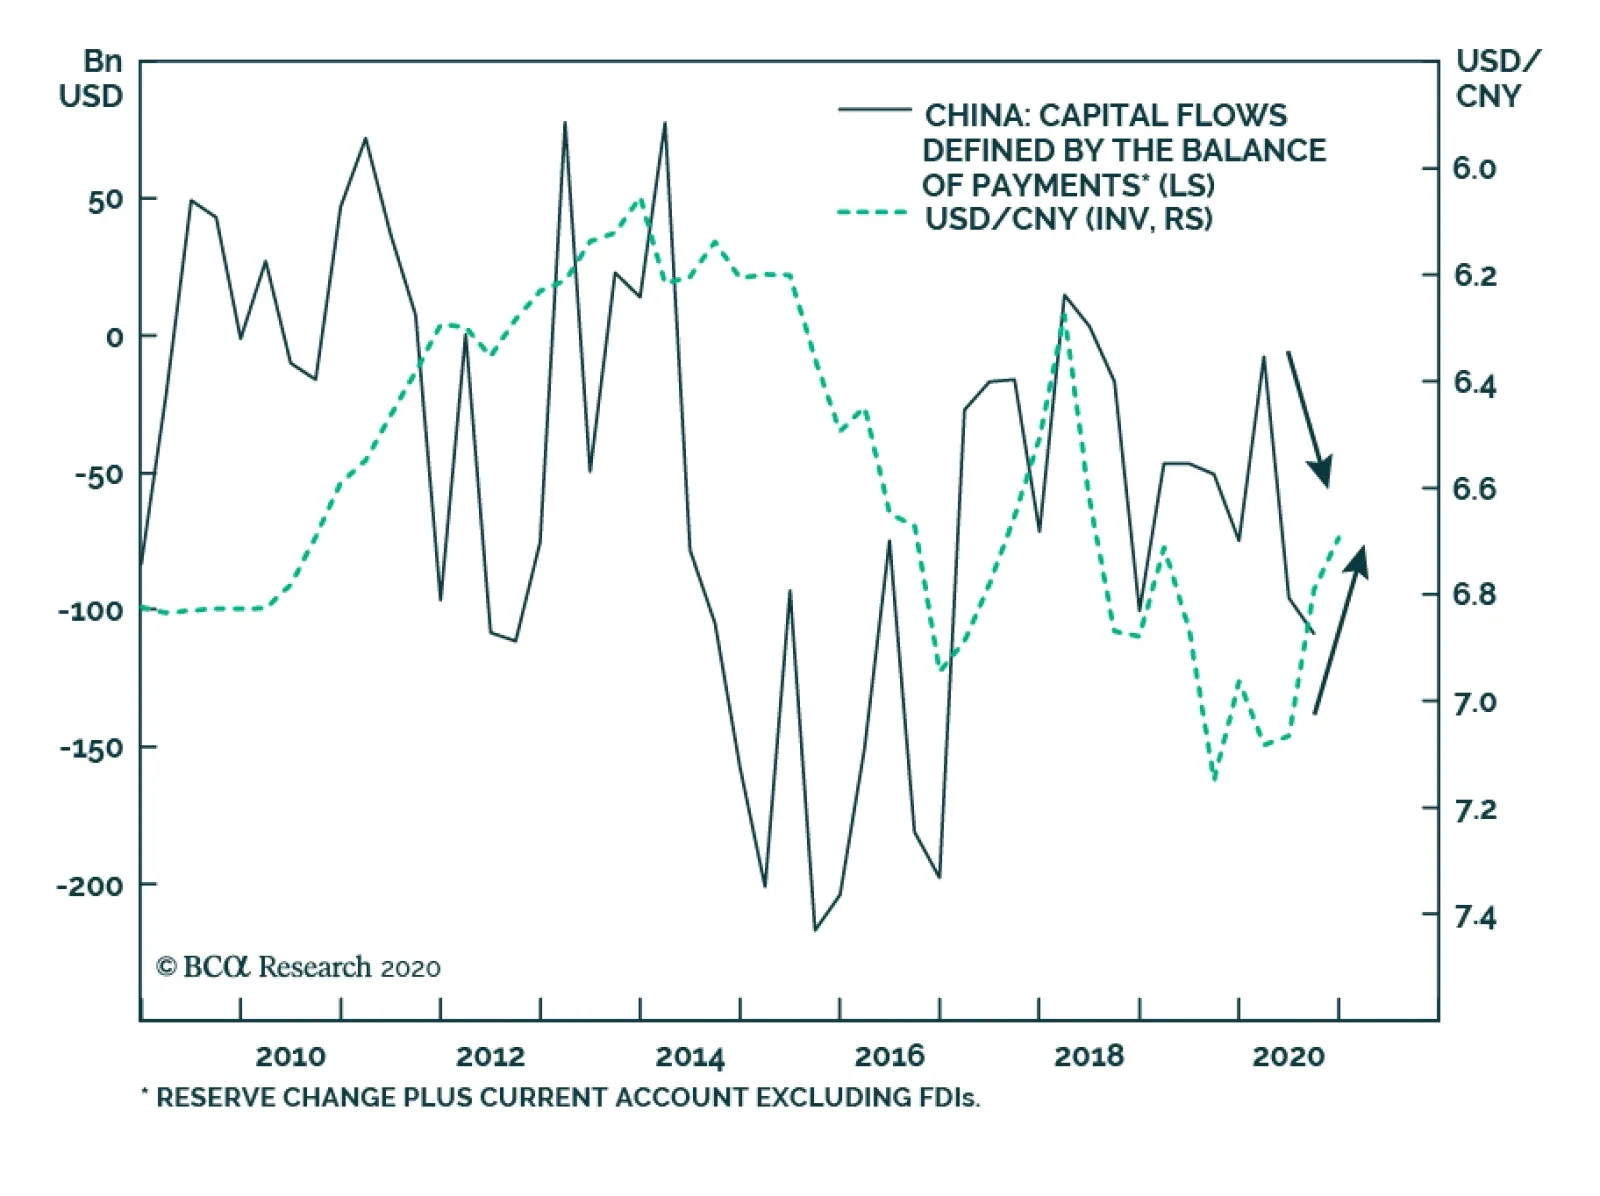
Highlights In the first nine months of 2020, China's capital outflows, measured by the Balance of Payments (BoP) data, have been the largest since 2016. Unlike 2016, the outflows are mainly driven by a strategic accumulation of foreign currency (FX) assets by domestic entities rather than capital flight. Chinese banks may have been using some of their FX holdings and transactions to slow the pace in the RMB appreciation. The RMB can still devalue relative to the USD in the next two months, but in the next 6-12 months, the RMB should continue to revert to its pre-trade war value. Feature Chart 1Large Capital Outflows Despite A Strong RMB
Large Capital Outflows Despite A Strong RMB
Large Capital Outflows Despite A Strong RMB
China’s official BoP data imply that approximately $200 billion capital left the country in the first three quarters of the year, the largest amount since 20161 (Chart 1). The large capital outflows occurred when China’s post COVID-19 economic recovery was strengthening, the current account surplus was surging, and both direct and portfolio investment flows were net positive. Moreover, unlike 2015-16 when capital outflows were driven by, and in turn, reinforced the depreciation in the Chinese currency, the RMB has been strengthening against the USD. In this report, we examine China’s BoP data and related figures, and use the framework from a previous Special Report to assess China’s capital outflows.2 Our research shows that at least a good portion of the capital outflows was likely an effort by Chinese policymakers to slow the pace of the RMB’s appreciation against a basket of its trading partners’ currencies. A Puzzling BoP Picture Official BoP data shows that China’s current account surplus was $170 billion in the first three quarters of this year, and net FDI and portfolio flows totaled at $54 billion. The surplus has been mostly offset by an estimated $155 billion of “Other Investment” outflow in the non-reserve FX account and $53 billion in Net Errors and Omissions (Table 1). Table 1China’s Balance Of Payments
Demystifying China’s Capital Outflows
Demystifying China’s Capital Outflows
During the 2015-16 period, large outflows were driven by reduced foreign inflows, domestic firms paying down US dollar debt, and enterprises and households moving their assets overseas. This time, however, the outflows appear to be largely government driven and strategic FX asset accumulations, and most likely through Chinese state-owned banks and institutional investors. Chart 2FX Settlement Has Been Net Positive
FX Settlement Has Been Net Positive
FX Settlement Has Been Net Positive
Chart 2 shows a positive net FX settlement rate by banks on behalf of clients. This means more non-financial enterprises (such as exporters and investors) sold their foreign exchange holdings to banks than bought foreign exchange from banks. This is drastically different from the deep contraction in the net settlement data following the RMB devaluation in August 2015. Chart 3 also highlights that the level of Chinese firms’ short-term foreign obligations (outstanding foreign currency loans, trade credit and liquid deposits) has remained steady this year. This implies that domestic firms are not rushing to pay off their external debt as was the case in 2015/16. Chart 3Chinese Firms Are Not Rushing To Pay Off External Debt
Demystifying China’s Capital Outflows
Demystifying China’s Capital Outflows
Chart 4Relatively Low Level Of Illicit Capital Outflows
Relatively Low Level Of Illicit Capital Outflows
Relatively Low Level Of Illicit Capital Outflows
Moreover, service trade deficits from outbound tourism have narrowed substantially due to international travel restrictions, which have made it difficult for Chinese residents to move capital out of the country. Additionally, the illicit capital outflows through import over-invoicing are very low (Chart 4). Hence, a large negative reading in the “Other Investment” and “Net Errors and Omission” categories implies an accumulation of FX assets by China’s banks and intuitional investors. The net FX asset accumulation by commercial banks was $117 billion in the first nine months, largely offsetting the $170 billion current account surplus in the same period. A closer examination of BoP data also shows that in June the PBoC recorded a $118 billion fund transfer from a FX asset balance sheet, which has otherwise been flat over the past five years. It is unclear where the funds have gone, but coincidently the amount matches a $118 billion outflow in the BoP’s non-reserve FX assets during the same quarter (Chart 5). China’s non-reserve FX assets3 are mostly in offshore investment and lending, which is intermediated by a small group of state-owned entities. Given that external lending through China’s banks and financial institutions has slowed in the post-COVID-19 environment, direct and portfolio investments must have been the main sources of the FX asset accumulation (Chart 6). Chart 5Unexplained FX Fund Transactions
Unexplained FX Fund Transactions
Unexplained FX Fund Transactions
Chart 6No Sign Of Extended Loans Or Trade Credit
No Sign Of Extended Loans Or Trade Credit
No Sign Of Extended Loans Or Trade Credit
Capital Outflows As An Exchange Rate Stabilizer The sharp rise in the trade surplus and foreign capitals into China’s bond market this year explains the upward pressure on the RMB. Chinese policymakers may have been trying to slow the pace of appreciation in the RMB through a build-up in strategic FX assets by large state-owned banks and other financial institutions. Following the devaluation of the RMB in August 2015, China had to liquidate a quarter of its official FX reserves to defend the currency. The rapid depletion in the official reserves fueled market jitters and reinforced the RMB depreciation. The FX assets held by China’s state-owned banks and institutional investors, on the other hand, can mostly fly under the radar and, in recent years, may have become the policymakers’ preferred channel of regulating fluctuations in the currency market. We tested this theory by assessing the relationship between the net FX purchases by China’s banks and the RMB exchange rate against the USD and a basket of its trading partners’ currencies (measured by the CFETS index). The latter is the exchange rate reference regime that China switched to in 2017.4 The official “net FX settlement by bank itself” data series represents the difference between the banks’ purchases and sales of foreign exchange in the interbank system. We exclude settlements and sales by banks on behalf of clients to filter out the demand for FX from enterprises and households. Chart 7 shows that, prior to 2018, the banks’ net FX purchases ticked up when the RMB appreciated against the USD, and banks sold more FX when the USD rose against the RMB. The interventions intended to slow the market move in either direction to keep the USD/CNY exchange rate swings within the PBoC’s comfort zone. Chart 7Banks' Net FX Transactions Moved Closely With USD/CNY Until 2018
Banks' Net FX Transactions Moved Closely With USD/CNY Until 2018
Banks' Net FX Transactions Moved Closely With USD/CNY Until 2018
Chart 8Since 2018 China Targeted A Basket Of Currencies
Since 2018 China Targeted A Basket Of Currencies
Since 2018 China Targeted A Basket Of Currencies
Interestingly, the tight relationship loosened somewhat after 2018. On several occasions, banks made more FX purchases even when the RMB was weakening against the USD. It appears that since US tariffs on Chinese goods began in 2018, Chinese policymakers have been more willing to allow market forces drive down the RMB in relation to the USD. Meanwhile, China has targeted a relatively stable value of the RMB against a basket of its trading partners’ currencies in the CFETS index. As Chart 8 (top panel) illustrates, since 2018, net FX purchases by Chinese banks have been more tightly correlated with the spread between the CNY/USD exchange rate and the CFETS index (both rebased to December 2014=100). When the RMB falls relative to the USD but not by enough to slow its increase against other trading partners, China’s banks would ramp up their FX purchases to push down the CNY/USD exchange rate or raise the value of other currencies in the CFETS basket (Chart 8, bottom panel). Investment Conclusions Chart 9Mean Reversion In The USD/CNY Will Continue
Mean Reversion In The USD/CNY Will Continue
Mean Reversion In The USD/CNY Will Continue
The market sentiment has been overwhelmingly bullish on RMB. Partially, the CNY/USD market has been pricing in the possibility of a Biden administration in the US, and improved Sino-US relations. In our view, the RMB has not moved into outright expensive territory and will continue to revert to its pre-trade war value against the USD in the next 6-12 months (Chart 9). In the next two months, however, the RMB may still give back some of this year’s gains against the USD. A contested US election may bring negative surprises to the global financial markets. The COVID-19 pandemic also remains a headwind in Europe and North America until a vaccine is widely available. As such, the USD will likely have a near-term countercyclical rebound. In fact, a depreciation in the RMB would be a boon to China’s domestic economy as it currently faces disinflationary pressures. Meanwhile, the net FX settlement among Chinese banks has been trending sideways in the past three months, which signals that Chinese policymakers may be comfortable with the RMB’s current value. We think China will allow the RMB to appreciate against the USD as long as the RMB does not climb too rapidly against the basket of other major currencies. If the upward pressure on the RMB continues to push the CFETS index higher, then China may choose to step up its purchases of FX assets. Assets in Euro, the Japanese Yen, and the Korean Won may be high on the shopping list (Chart 10 and Chart 11). Chart 10China May Step Up Purchases Of Other Major Currencies
China May Step Up Purchases Of Other Major Currencies
China May Step Up Purchases Of Other Major Currencies
Chart 11The CFETS RMB Index Composition
Demystifying China’s Capital Outflows
Demystifying China’s Capital Outflows
Jing Sima China Strategist jings@bcaresearch.com Qingyun Xu, CFA Senior Analyst qingyunx@bcaresearch.com Footnotes 1Based on the Balance Of Payments methodology, short-term capital outflows = current account surplus + changes in reserve assets + direct investment ≈ net flows in portfolio investment + net flows in other investment + net errors & omissions. 2Please see China Investment Strategy Special Report "Monitoring Chinese Capital Outflows," dated March 20, 2019, available at cis.bcaresearch.com 3FX assets held at banks and financial institutions other than the PBoC. 4CFETS RMB Index refers to CFETS (China Foreign Exchange Trade System) currency basket, including CNY versus FX currency pairs listed on CFETS. The sample currency weight is calculated by international trade weight with adjustments of re-export trade factors. The sample currency value refers to the daily CNY Central Parity Rate and CNY reference rate. Cyclical Investment Stance Equity Sector Recommendations
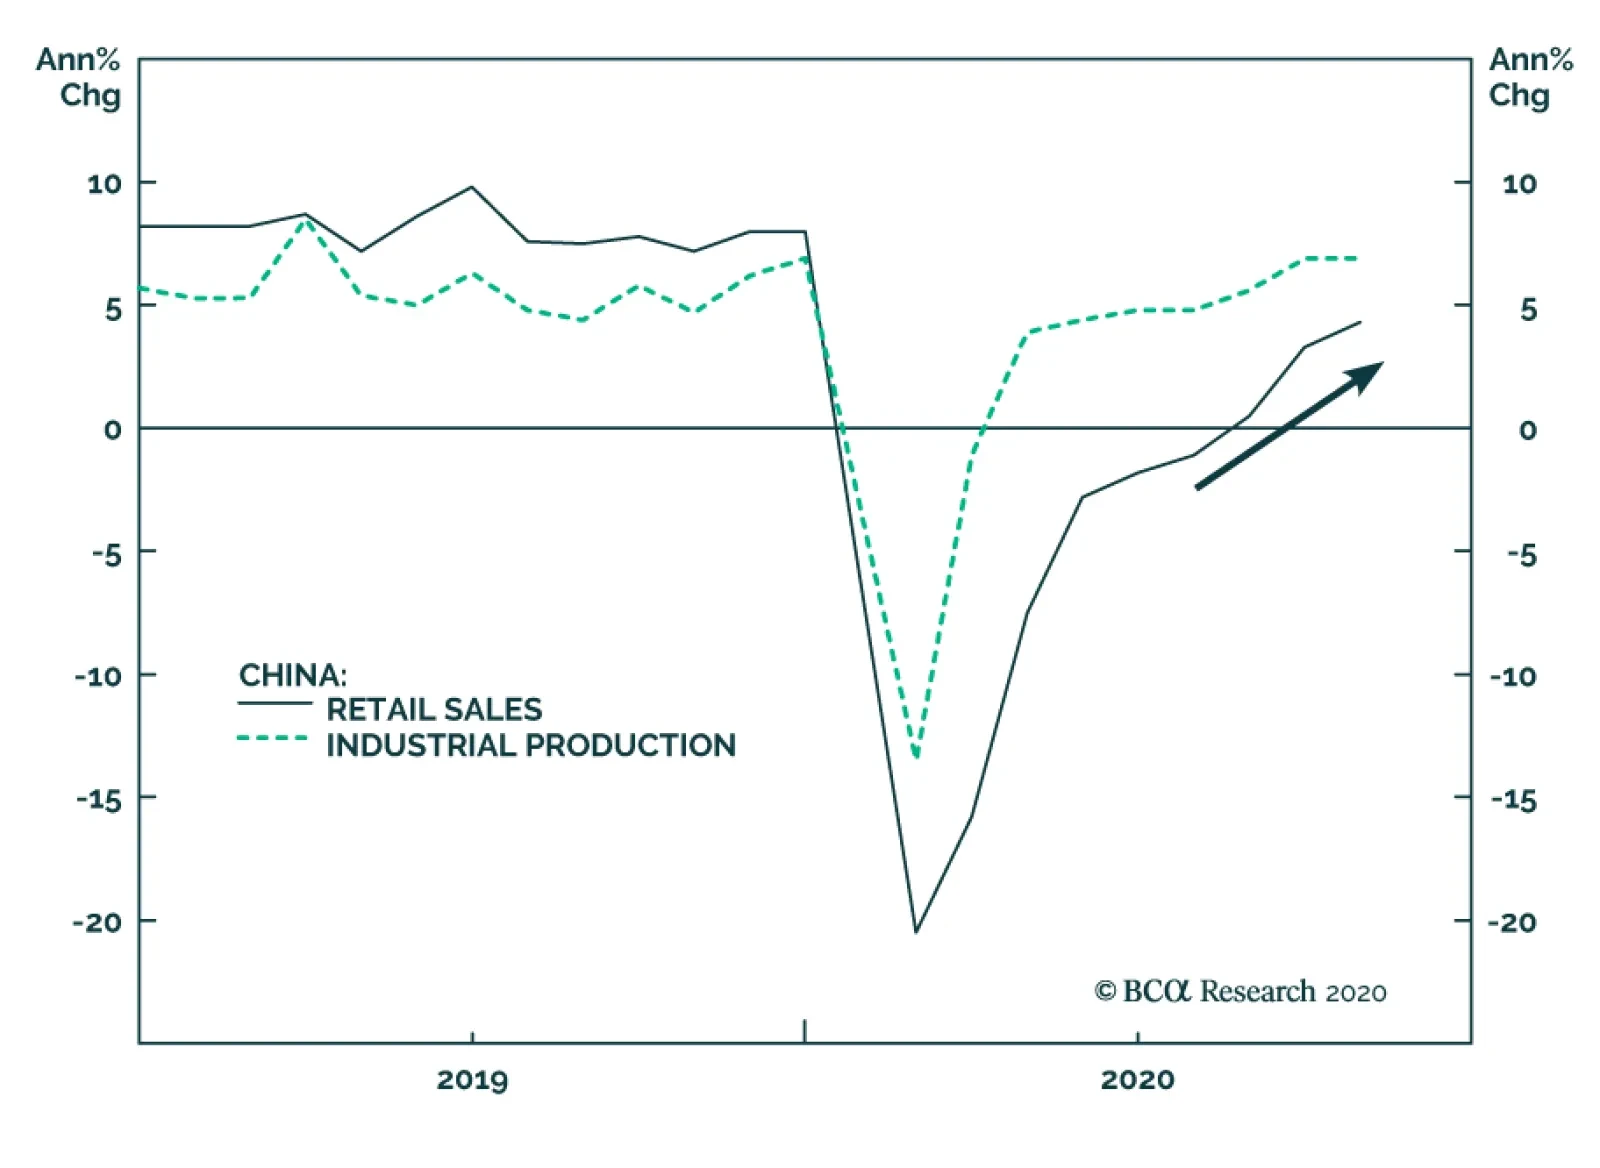
The Chinese economy continued its recovery in October, with both fixed asset investment and industrial production beating expectations. The former accelerated to 1.8% year-on-year from 0.8% year-on-year, while the latter remained unchanged at 6.9%…
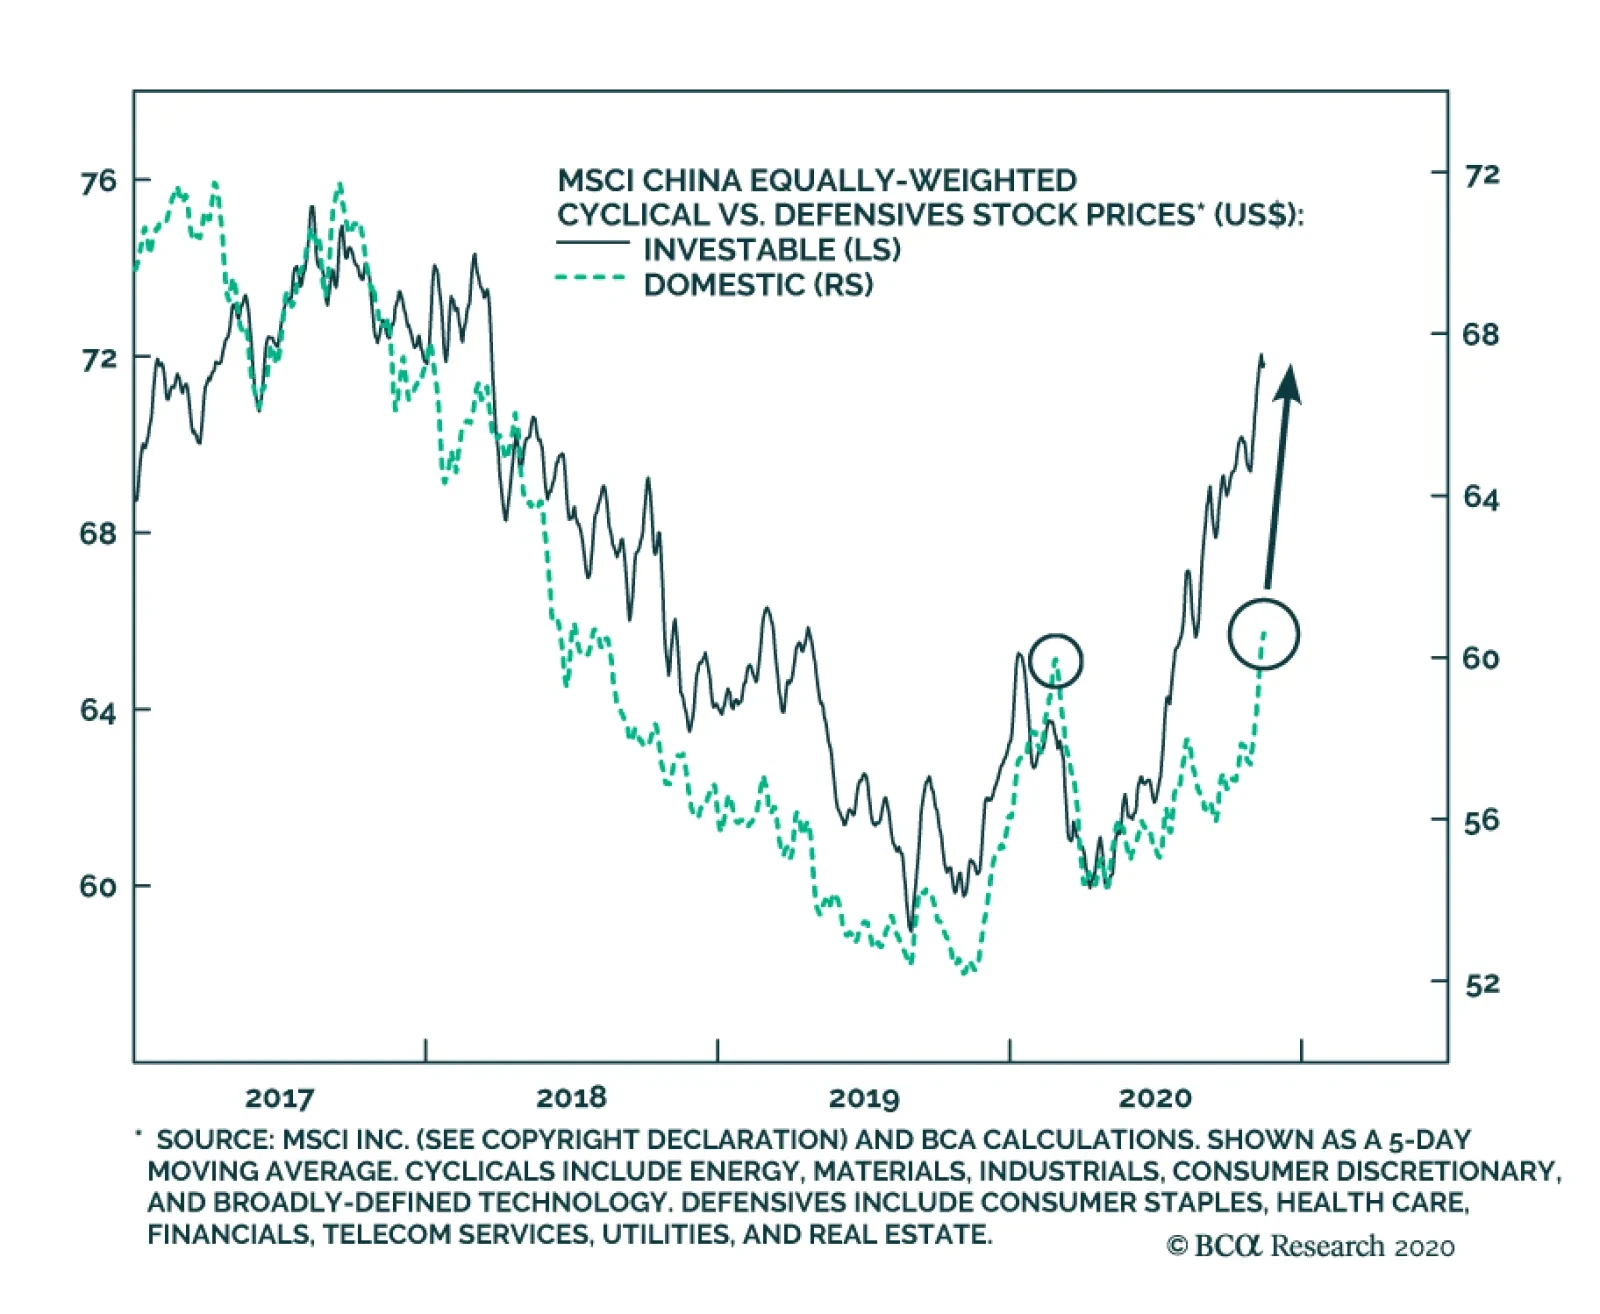
The chart above presents the relative performance of Chinese cyclicals versus defensives for both the investable and domestic markets. Here, cyclical and defensive sectors are equally-weighted within each index, so as to avoid the distorting impact of skewed…
Highlights US inflation expectations will moderate, and US real yields will rise. This will support the US dollar. The potential rebound in the US dollar will cap any upside in EM ex-TMT stocks. Rising US real yields are a risk to high-multiple global growth stocks. Maintain a neutral allocation to EM in global equity and credit portfolios. Feature In this week’s report we identify market-relevant issues and topics and then present the investment implications of these potential developments. Current key investment-relevant topics and issues are as follows: 1. Implications of the US elections Fiscal Stimulus: In the context of Biden’s victory and the Senate remaining Republican, the odds of a meaningful fiscal package in the next several months are quite low. The Republican Senate did not support a fiscal package going into the elections. Odds are low that it will now agree to a fiscal package larger than $750 billion. Chart 1Rising US Real Yields Are Positive For The US Dollar
Rising US Real Yields Are Positive For The US Dollar
Rising US Real Yields Are Positive For The US Dollar
According to the US Congressional Budget Office’s calculations, without a new fiscal package, the fiscal thrust in 2021 will be -7.5% of GDP or $1.5 trillion. Hence, fiscal stimulus should be more than $1 trillion to avoid a slump in growth. Granted that the recovery in US consumer income and spending that has been underway since April has to a large extent been supported by US fiscal transfers, the lack of current government income support to households poses a risk to the economy. Of course, if US economic activity tanks again and the stock market plunges, Republicans will support a much larger package. However, as things stand now, the probability of a substantial (more than $1 trillion) fiscal package is low. The lack of fiscal stimulus implies that US growth and inflation expectations will moderate. Chart 1 shows that US inflation expectations have probably reached an apex and will downshift for now. US nominal bond yields are capped on the upside (by the Fed’s purchases and its commitment not to raise interest rates for several years) and on the downside (by the Fed’s reluctance to reach negative interest rates). Consequently, swings in inflation expectations will drive fluctuations in real yields, as has been occurring in recent months. As inflation expectations decline, real yields will rise. Impact of rising US real yields on financial markets: A stronger US dollar and lower prices for Nasdaq stocks. Rising real rates will support the US dollar (Chart 1, bottom panel). Chart 5 on page 5 reveals that the real rates differential between the US and the euro area has recently been moving in favor of the greenback. Chart 2Rising US Real Yields Are Negative For Growth Stocks
Rising US Real Yields Are Negative For Growth Stocks
Rising US Real Yields Are Negative For Growth Stocks
Budding investor realization that the US might not pursue an aggressively expansionary fiscal policy, as has been expected since spring, could also support the greenback. Less issuance of Treasury securities might be interpreted as less public debt monetization and less money creation by the Federal Reserve. Such a viewpoint will also be marginally positive for the US dollar. As to the equity market, US real (TIPS) yields have been negatively correlated with the Nasdaq index (Chart 2). As US real yields continue to rise, odds are that global growth stocks will come under selling pressure. Geopolitical ramifications: The impact of the forthcoming change in the White House on US foreign policy has been widely anticipated and has already been priced in by financial markets. A Biden administration will have a positive impact on the euro area, Canada, Mexico and Asia Pacific countries with the exception of China – as was not the case under the Trump administration. On the other end, Russia, Turkey and Saudi Arabia will be under heat from Biden’s White House. In our view, the impact on China will be neutral, not better than during Trump’s administration. It might be mildly positive in the near term but negative in the long run. In the short run, the new US administration will be less likely to use global trade as a weapon. In the long run, however, Biden will likely mobilize Europe to join its geopolitical confrontation with China. This will be negative for the Middle Kingdom. One country where the impact of Biden’s administration has not been fully priced in is Brazil. The US executive branch will take a tougher stance in its dealings with Brazil’s right-wing government because their social values are not aligned and policy priorities differ. We remain short the BRL and underweight Brazilian equity and fixed-income markets within their respective EM portfolios. 2. Vaccines We have no better expertise than the market’s judgement on the timing of vaccine availability and its effectiveness in containing the pandemic in EM ex-China countries. It is clear, however, that the process of vaccine acquisition and distribution might be slower in EM ex-China than in advanced countries. On all three fronts – the spread of the pandemic, policy stimulus and vaccine distribution – EM excluding China, Korea and Taiwan will continue lagging DM. Therefore, EM ex-China domestic demand will continue to underperform relative to expectations and versus those in DM. This argues for continuous underweight, or at best a neutral allocation, in EM ex-China, Korea and Taiwan equities versus their DM peers. Chart 3Chinese Onshore Equities Have Been In A Trading Range Since Early July
Chinese Onshore Equities Have Been In A Trading Range Since Early July
Chinese Onshore Equities Have Been In A Trading Range Since Early July
3. China: the business cycle and regulatory clampdown China’s business cycle recovery has further to go. The stimulus injected into the economy has been considerable and will continue to work its way into the economy. Even though we believe that China has reached peak stimulus, the latter works with a time lag of 6-12 months and economic growth will top only around mid-2021. That said, Chinese onshore share prices have been in a consolidation phase since early July and this is likely not over yet (Chart 3). In turn, Chinese investable stocks have been surging in absolute terms and outperforming the global equity index (Chart 4, top panel). However, the entire Chinese equity outperformance has been due to growth stocks (TMT/new economy). Excluding these, the absolute and relative performance of Chinese investable stocks has been lackluster (Chart 4, top and bottom panels). Chart 4Chinese Investable Stocks: Surging TMT And Lackluster Performance By Ex-TMT Stocks
Chinese Investable Stocks: Surging TMT And Lackluster Performance By Ex-TMT Stocks
Chinese Investable Stocks: Surging TMT And Lackluster Performance By Ex-TMT Stocks
In short, the spectacular performance of Chinese investable stocks this year has been attributed to three new economy stocks: Alibaba, Tencent and Meituan. These three stocks presently account for 40.5% of China’s MSCI Investable Index and 17.5% of the aggregate EM MSCI equity index. Concerns about regulatory clampdowns on new economy stocks have been, and remain, a major risk, not only in China but also in advanced economies. It is impossible to time regulatory actions. Nevertheless, investors should take into account the possibility that regulation may curb the profitability of new economy companies, especially if they are de-facto monopolies or oligopolies. Chinese authorities will not back down from imposing new regulation and scrutiny over the activities of giant new economy companies. Hence, risks of further de-rating remain elevated. In short, even though the mainland business cycle recovery is on a track, Chinese share prices remain at risk of correction due to overbought conditions and re-pricing of regulatory risks for new economy stocks. Will The US Dollar Capture Some Of Its Luster? US real yields are rising not only in absolute terms, but also relative to real yields in the euro area (Chart 5). Rising real yields in the US versus the euro area generally lead to a dollar rally against the euro. Apart from rising US real bond yields, there are a number of other factors that will likely support the greenback: Investor sentiment on the US dollar is very low (Chart 6). From a contrarian perspective, this is positive. Chart 5The US Versus Euro Area: Real Yield Differentials And Exchange Rate
The US Versus Euro Area: Real Yield Differentials And Exchange Rate
The US Versus Euro Area: Real Yield Differentials And Exchange Rate
Chart 6Investors Are Downbeat On The US Dollar
Investors Are Downbeat On The US Dollar
Investors Are Downbeat On The US Dollar
Consistently, investors are very short the US dollar, especially versus DM currencies (Charts 7and 8). Positioning is less short in the US dollar versus cyclical DM and high-beta EM currencies (Chart 8). That said, the fundamentals of EM high-beta currencies such as BRL, TRY, ZAR and IDR are poor. Chart 7Investors Are Very Long Safe-Haven Currencies…
Investors Are Very Long Safe-Haven Currencies...
Investors Are Very Long Safe-Haven Currencies...
Chart 8...And Modestly Long Cyclical Currencies
...And Modestly Long Cyclical Currencies
...And Modestly Long Cyclical Currencies
The Republican Senate will block corporate tax increases and limit any regulatory initiatives by Democrats in Congress. Such business-friendly policies are currency bullish. In short, a Republican Senate is broadly positive for the US dollar, and markets have not priced it in. The fact that broad US equity averages – such as small caps and equal-weighted equity indexes – continue outperforming the rest of the world in local currency terms is also dollar bullish (Chart 9). The reasoning is that US equity outperformance versus the rest of the world suggests better profitability and return on capital in the US versus its peers. That favors a firmer US dollar. Finally, the broad-trade weighted US dollar is oversold and is sitting on a long-term technical resistance level (Chart 10). Chart 9US Relative Equity Outperformance Heralds A Stronger US Dollar
US Relative Equity Outperformance Heralds A Stronger US Dollar
US Relative Equity Outperformance Heralds A Stronger US Dollar
Chart 10The US Dollar Is Very Oversold
The US Dollar Is Very Oversold
The US Dollar Is Very Oversold
Bottom Line: We have been highlighting downside risks to the US dollar since July 9. However, the conclusion of the US election raises the odds of a playable US dollar rebound. EM Strategy EM Equities We have been advocating for a neutral allocation toward EM in a global equity portfolio since July 30. If the US dollar rebounds, as we expect, EM stocks will not outperform the global equity index (Chart 11). Notably, excluding Chinese investable stocks, EM share prices have not outperformed the global benchmark (Chart 12). Besides, as shown in the top panel of Chart 4 on page 4, China’s outperformance against the global equity benchmark has been driven exclusively by new economy stocks. Chart 11EM Stocks Do Not Outperform When The Dollar Rallies
EM Stocks Do Not Outperform When The Dollar Rallies
EM Stocks Do Not Outperform When The Dollar Rallies
Chart 12EM Versus Global Equity Performance: With And Without China
EM Versus Global Equity Performance: With and Without China
EM Versus Global Equity Performance: With and Without China
All in all, Charts 4 and 12 reveal that excluding three large Chinese new economy stocks – Alibaba, Tencent and Meituan – EM share prices have underperformed the global equity benchmark. Going forward, the potential rebound in the US dollar will cap any upside in EM ex-TMT stocks. Meanwhile, the correction in the NASDAQ and the increased scrutiny on the part of Chinese authorities over new economy stocks poses a risk to Chinese mega-cap TMT share prices. In absolute terms, we have been waiting for a pullback to buy EM equities, but they have surged following the US elections and the news on Pfizer’s vaccine. Chart 13EM Equity Index: No Breakout Yet
EM Equity Index: No Breakout Yet
EM Equity Index: No Breakout Yet
The EM equity index could still advance and reach its 2011 or 2018 highs before rolling over (Chart 13). However, given our view on the US currency and risks to EM stemming from a rising US dollar, we refrain from playing such limited upside. EM currencies EM currencies will be at a risk if the US dollar stages a rebound. Since July 9, we have been shorting a basket of BRL, CLP, TRY, KRW, ZAR and IDR versus an equally-weighted basket of the euro, CHF and JPY. We are sticking with this strategy. Even if the US dollar rebounds, downsides in the euro, CHF and JPY against the greenback will be relatively limited. However, investors might consider adding the US dollar to the long side of this strategy. EM local bonds and EM credit markets We continue recommending long duration in EM local rates. However, we remain reluctant to take on currency risk. We maintain our recommendations from April 23 about receiving 10-year swap rates in Mexico, Colombia, Russia, India, China and Korea. We are also receiving 2-year rates in Malaysia and South Africa as a bet on rate cuts in these economies. In the EM credit space, we are also neutral. Our sovereign credit overweights are Mexico, Colombia, Peru, Russia, Thailand, Malaysia and the Philippines. Our underweights are South Africa, Turkey, Indonesia, Argentina and Brazil. Arthur Budaghyan Chief Emerging Markets Strategist arthurb@bcaresearch.com Footnotes Equities Recommendations Currencies, Credit And Fixed-Income Recommendations
China’s aggregate financing decelerated significantly in October to CNY1.42 trillion from CNY3.48 trillion. New loan issuance also slowed to CNY689.8 billion from CNY1.9 trillion, slightly below expectations of CNY775 billion. Broad (M2) money supply annual…
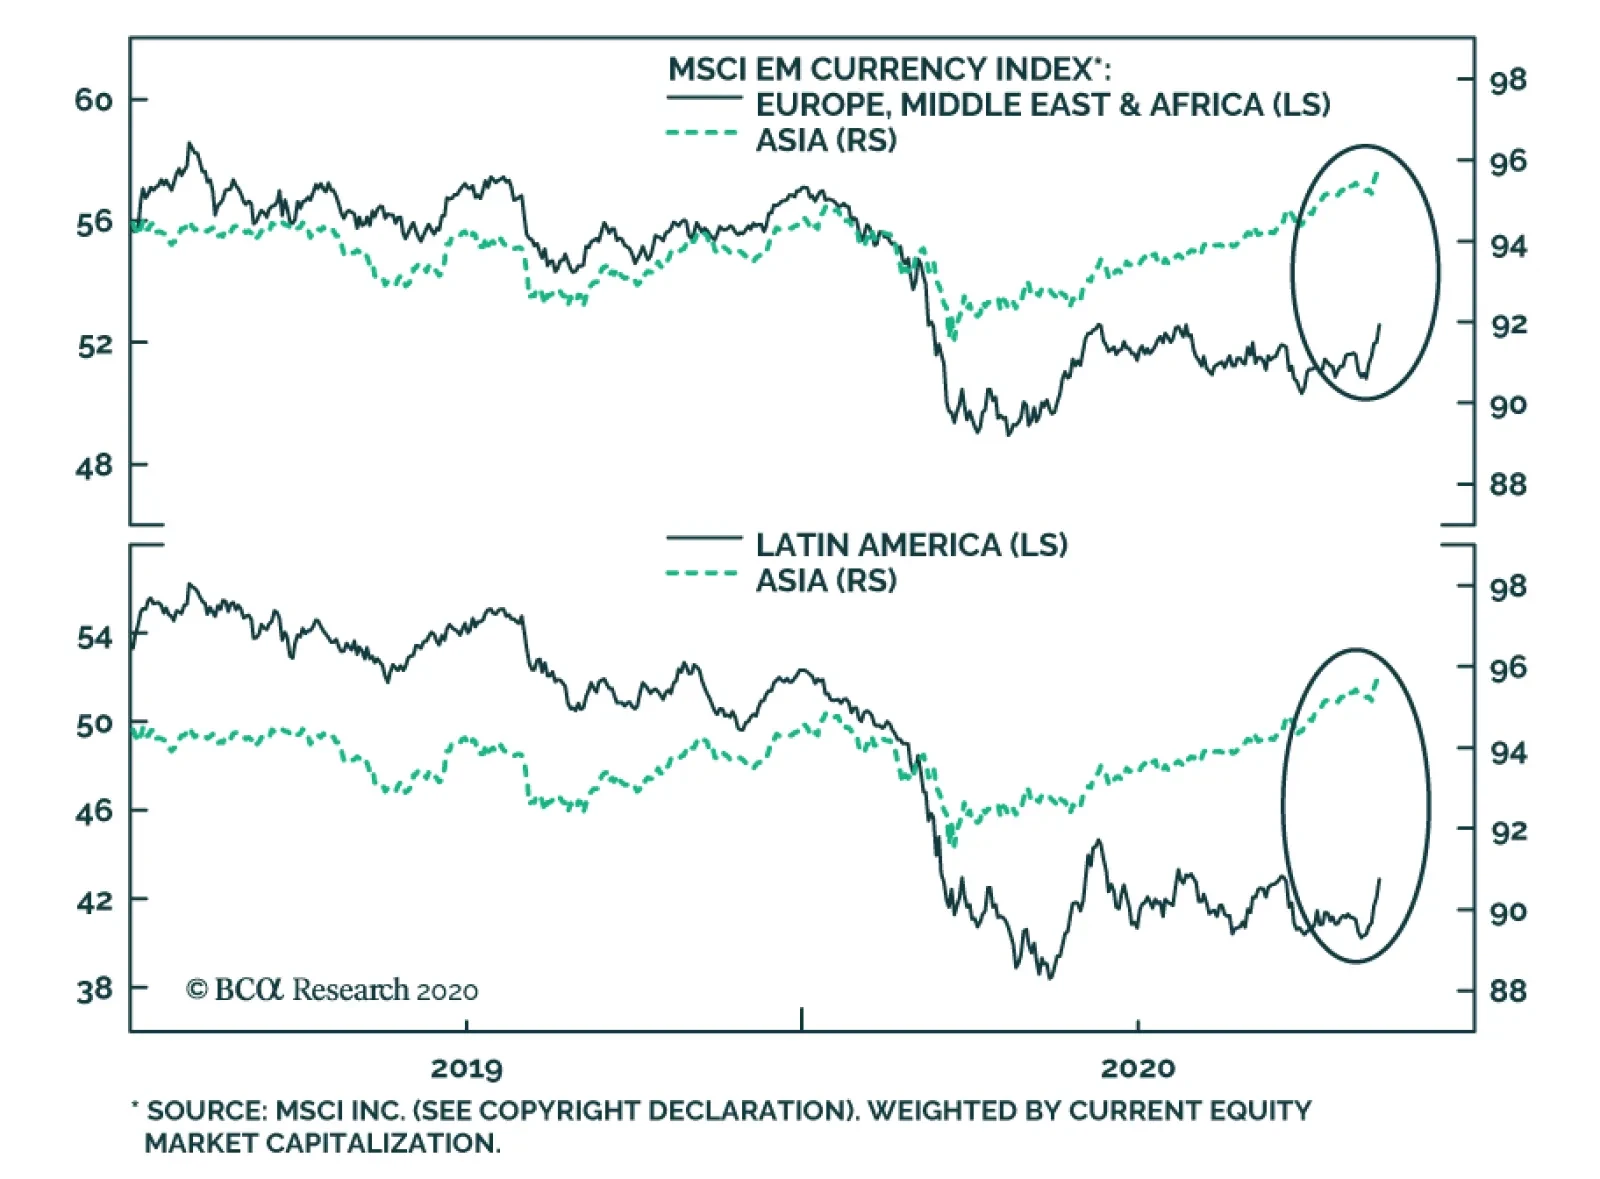
Since late-March, the MSCI Emerging Markets Currency Index has rallied nearly 10%, and has recently risen above its pre-pandemic peak. This has caught the attention of some investors, who often interpret aggregate EM currency strength as a sign of broad-based…