Emerging Markets
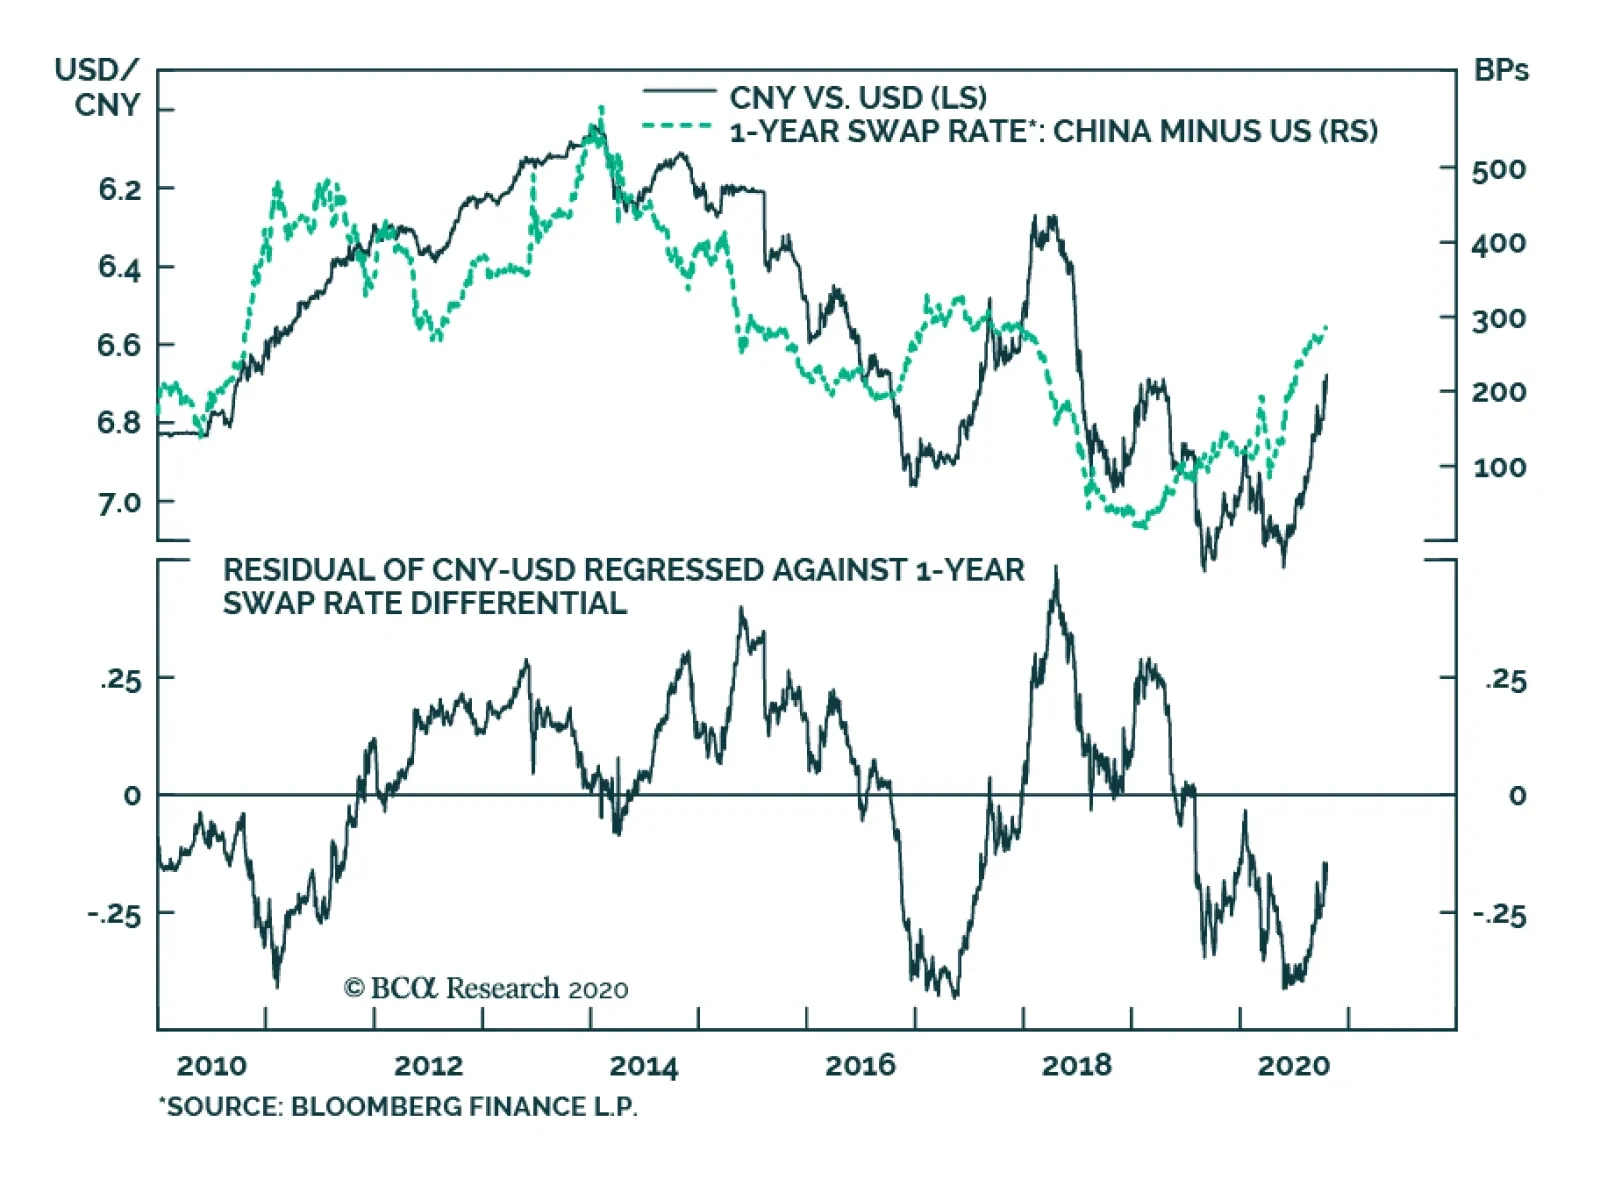
Adjusted for volatility, the rise in CNY-USD over the past month has been among the largest moves in global financial markets. While some of this can be attributed to a decline in the US dollar, the RMB is also up meaningfully against the euro and an…

Highlights Under the newly released deleveraging policies, Chinese real estate developers have no choice but to deleverage. Over the next six months, the most likely scenario will be moderate growth in property sales, starts and completions, but a drop in land purchases. We expect Chinese onshore and offshore property stocks to continue underperforming their respective benchmarks. However, we recommend buying Chinese property developers’ offshore corporate bonds. Feature The country’s real estate sector has exhibited clear signs of improvement. As both commodity buildings’ floor space starts and sales showed four consecutive months of year-on-year growth, Chinese real estate investment has returned to its pre-pandemic annual rate of acceleration (Chart 1). In addition, our broad measures of Chinese real estate construction activity – the “building construction” floor area starts and completions – have also rebounded sharply (Chart 2). Chart 1Chinese Property Market: A Sustainable Recovery Ahead?
Chinese Property Market: A Sustainable Recovery Ahead?
Chinese Property Market: A Sustainable Recovery Ahead?
Chart 2Sharp Rebound In Post-Pandemic Construction Activity
Sharp Rebound In Post-Pandemic Construction Activity
Sharp Rebound In Post-Pandemic Construction Activity
One driving force behind the real estate sector’s recovery was that China loosened up its monetary policy and implemented fiscal stimulus earlier this year. However, since July, the government has implemented a flurry of restrictive policies to clamp down on flows of capital into the real estate sector, and has repeatedly stressed the mantra: “Houses are for living in, not for speculation.” Most importantly, in late August the government released a framework mandating Chinese property developers to deleverage. As Chinese homebuilders have no choice but to reduce their debt load, will the property market recovery continue? Chart 3Constrained Financing May Lead To A Drop In Land Sales Going Forward
Constrained Financing May Lead To A Drop In Land Sales Going Forward
Constrained Financing May Lead To A Drop In Land Sales Going Forward
Over the next six months, we expect a 4-6% year-on-year growth in property sales. The government-set deleveraging mandate will likely result in considerable property sales promotion by real estate developers. In the meantime, faced with constrained financing, homebuilders may prioritize completion of already sold but unfinished buildings over land investment (Chart 3). This may result in a moderate pickup in construction activity, but a drop in profit margins and land sales. Beyond the next six months, property sales in China will likely struggle to grow, as price discounts may not be enough to outweigh demand headwinds. In turn, construction activity may falter, as the government-led deleveraging mandate and weakening sales will curtail the cash flow to homebuilders. Mandated Deleveraging Chart 4Property Developers Will Have No Choice But To Deleverage
Property Developers Will Have No Choice But To Deleverage
Property Developers Will Have No Choice But To Deleverage
The Chinese real estate sector is highly indebted. According to the National Bureau of Statistics of China, the sector’s total liability-to-asset ratio rose to 80%, and its debt-to-equity ratio was at 4.1 by the end of last year (Chart 4). Policymakers in Beijing well recognize that excesses in the property market in general, and leverage among property developers in particular, constitute a major risk to financial stability. As part of the strategy to establish a long-term, sustainable mechanism for the real estate sector, the Chinese central bank and the housing ministry issued a framework – essentially a deleveraging mandate for Chinese property developers. This framework includes Three Red Lines and Four Tiers. Three Red Lines There will be a 70% ceiling on liabilities to assets, excluding advanced payments from presold houses; The net debt-to-equity ratio needs to be less than 100%; Short-term borrowings cannot exceed cash reserves. Four Tiers Companies that exceed all three red lines are placed into the red tier, while those passing any two of the three red lines are in the orange tier and enterprises that cross one of the three lines are in the yellow tier. Firms with financials within the three red lines are classified in the green tier. The government is using these debt tiers to control which firms will have access to new financing and how much new financing they can apply for. Failing to meet all three “red lines” (i.e., the red tier) may result in them being cut off from access to new loans from banks. If a firm passes all three red lines (i.e., the green tier), it can increase its debt up to a maximum of 15% in the next year. If it is in the yellow or orange tier, it can increase its debt up to a maximum of 10% and 5% in the following year, respectively (Table 1). Table 1The Mandated Deleveraging Framework: Three Red Lines And Four Tiers
China: The Implications Of Deleveraging By Property Developers
China: The Implications Of Deleveraging By Property Developers
Enterprises that break all three red lines are required to submit a report on their debt-reduction plan, listing their planned deleveraging measures to reduce the number of red-line breaches within one year, as well as the planned measures to reach the green tier within three years. Based on the 2020 mid-year data released by 100 major public-traded property-developing companies listed as either A-shares or H-shares, 86% of them are breaking at least one of the red lines, 22% of them are breaching all three red lines and only 14% of them are in the green tier. Bottom Line: Chinese home developers are set to embark on the deleveraging path due to the new regulation. This will limit their access to financing and has implications for their activity and, thereby, the overall economy. What Does This Mean? Property development is an asset-heavy and capital-intensive business, and this industry typically relies a lot on debt. Chart 5Chinese Real Estate Investment: A Breakdown Of Funding Source
China: The Implications Of Deleveraging By Property Developers
China: The Implications Of Deleveraging By Property Developers
There are several ways for homebuilders to finance themselves. Chart 5 shows the breakdown of the source of Chinese real estate investment funding, with 15.5% of the total funding from domestic and foreign loans, 32% from a self-raising fund through issuances of bonds or equity, 33.2% from deposits and advanced payments, and 16.2% from homebuyers’ mortgages. With limited financing from the loan and bond markets, the country’s real estate developers will have to seek more financing from deposits and advanced payments, homebuyers’ mortgages and equity issuances. Chart 6Property Developers Need To Boost Their Sales To Raise More Cash
Property Developers Need To Boost Their Sales To Raise More Cash
Property Developers Need To Boost Their Sales To Raise More Cash
As equity issuance dilutes existing shareholders' profits and drives down share prices, developers often opt for presales to raise financing, i.e., they pre-sell more properties to increase their revenue from deposits and advanced payment, as well as mortgages (Chart 6). Hence, in the short term, i.e., over the next six months, many property developers may need to cut home prices to boost their sales and shore up cash for their operations. For example, the country’s biggest real estate developer – Evergrande – falls short on all three metrics and lies in the red tier. The company announced in early September that it would do aggressive sales of properties by lowering the selling prices for all types of properties by 30% across the country during the period of September 7 to October 8. Indeed, the company’s sales reached a record high for this period. The aggressive sales promotion of properties will encourage demand. We expect the year-on-year growth of floor space sales to reach 4-6% over the next six months – an acceleration from 1.3% during the pre-pandemic period of 2H2019, but a moderation from the 6.4% growth in the post-pandemic months (Chart 7). Beyond the next six months, home sales may struggle to grow as the impact from price discounts diminishes and demand will face the following headwinds: The authorities continued to show their determination to crack down on speculative housing demand. Stricter policies, including tighter restrictions on both first and second home purchases and mortgage applications, as well as raising the down payment ratio, have been implemented recently in cities experiencing a rapid rise in property prices, such as Shenzhen, Hangzhou, Tangshan, Zhengzhou and many other cities. The government also set new bank lending regulations to the real estate sector; new bank loans issued to the real estate sector, measured as a share of total new bank loans, should be kept under 30% of total banks’ loans (Chart 8). The ratio has declined to the current 25% from 30-50% in the past four years. We believe the ratio will remain below 30% over the next six to twelve months. Chart 7Chinese Property Sales, Starts And Completions Will Grow Moderately In Coming Months
Chinese Property Sales, Starts And Completions Will Grow Moderately In Coming Months
Chinese Property Sales, Starts And Completions Will Grow Moderately In Coming Months
Chart 8Constrained Lending To Chinese Real Estate Sector From Banks
Constrained Lending To Chinese Real Estate Sector From Banks
Constrained Lending To Chinese Real Estate Sector From Banks
Lending to the real estate sector includes housing mortgages and loans for real estate development. The capped bank loans to the property sector suggests that tighter lending standards will be applied to mortgage loans as well as property development loans. This will likely curb demand for housing. The authorities stopped the Pledged Supplementary Lending (PSL) program in 2020. The PSL was a driving force behind property demand in China during 2015-2018, but this time the government has refrained from PSL injections. The government-subsidized shantytown renovation program (e.g., adding elevators, building parking spots, painting interior and exterior walls, paving roads, etc.) will reduce demand for new properties. With improved living conditions, some households may not need to buy new properties. The government’s renovation project covers 7 million houses this year, of which 76.4% (5.4 million) were completed during the first eight months of this year. Moreover, a renovation project of a similar scale will be implemented next year. The government’s active promotion of rental housing will also reduce the demand for new housing. Rental prices have been falling due to the pandemic, and that may delay home buyers from purchasing residential properties. Chart 9Chinese Property Demand Faces Structural Headwinds
Chinese Property Demand Faces Structural Headwinds
Chinese Property Demand Faces Structural Headwinds
The Chinese property market also faces strong structural headwinds. For example, property demand in China has already entered a saturation phase, and the working-age population (15-64 years of age) is shrinking (Chart 9). What about the outlook of property starts and completions? Constrained net borrowing will weigh on floor space starts and floor space completions. As such, we only expect moderate growth (i.e., smaller than 5%) in both property starts and completions over the next six months (Chart 7 on page 6). With constrained financing, homebuilders may have to allocate an increasing amount of funding to complete their unfinished projects instead of purchasing new land (Chart 3 on page 2). The pace of property completion has to catch up with both sales and starts. Property developers are currently under increased pressure to deliver units that were pre-sold about two years ago (Chart 10). Rising property sales will provide more financing for the developers to complete these projects under construction. The moderate growth in floor space starts and completions will lift construction activity slightly in the commodity buildings market (Chart 11). Chart 10Homebuilders Need To Deliver Their Unfinished Projects
Homebuilders Need To Deliver Their Unfinished Projects
Homebuilders Need To Deliver Their Unfinished Projects
Chart 11Construction Activity In China: Moderate Increase Ahead
Construction Activity In China: Moderate Increase Ahead
Construction Activity In China: Moderate Increase Ahead
That said, construction activity may relapse beyond the next six months. Both the enduring government-led deleveraging mandate and weakening sales will lead to funding shortages for Chinese homebuilders to carry on new construction projects. Bottom Line: Floor space sales, starts and completions will expand moderately despite the mandated deleveraging of developers in the next six months. Investment Implications First, it is reasonable to expect a moderate pickup in real estate construction activity in China over the next six months. This will be marginally positive for construction-related commodities demand. Chart 12Commodity Prices: Hold A Neutral Stance For Now
Commodity Prices: Hold A Neutral Stance For Now
Commodity Prices: Hold A Neutral Stance For Now
However, commodity prices have already rebounded sharply since April, and China's infrastructure-related construction activities usually peak in October. Therefore, a marginal increase in commodity demand from the real estate sector is not a catalyst for further price increases in commodities such as steel, cement, and glass. For now, we prefer to hold a neutral stance on these commodities (Chart 12). Beyond six months, the possibility of negative growth in home sales, starts and construction is rising, raising warning signs for construction-related commodities demand. Second, property developers may cut their land purchases in order to allocate more funds to completing unfinished homes. This heralds that a drop in the local government’s revenue may lie ahead. This will have ramifications for their spending in 2H2021. Third, regarding property stocks, they have been moving sideways in absolute terms this year, having significantly underperformed the benchmark (Charts 13 and 14). This reflects their poor profit growth prospects and weak financial fundamentals. We expect the Chinese property stocks to continue to underperform their benchmark, as the aggressive selling strategy will reduce companies’ profit margins. Chart 13Chinese Property Stocks: A Tapering Wedge In Absolute Terms, And…
Chinese Property Stocks: A Tapering Wedge In Absolute Terms, And...
Chinese Property Stocks: A Tapering Wedge In Absolute Terms, And...
Chart 14…Continuing Underperformances Relative To Their Respective Benchmarks
...Continuing Underperformances Relative To Their Respective Benchmarks
...Continuing Underperformances Relative To Their Respective Benchmarks
Lastly, we recommend buying Chinese offshore real estate bonds, as moderate growth recovery in the country’s real estate sector and deleveraging will lead to a narrowing of the sector’s corporate spread. In addition, the ongoing global search for yields will intensify the demand for high-yield bonds. Ellen JingYuan He Associate Vice President ellenj@bcaresearch.com Cyclical Investment Stance Equity Sector Recommendations
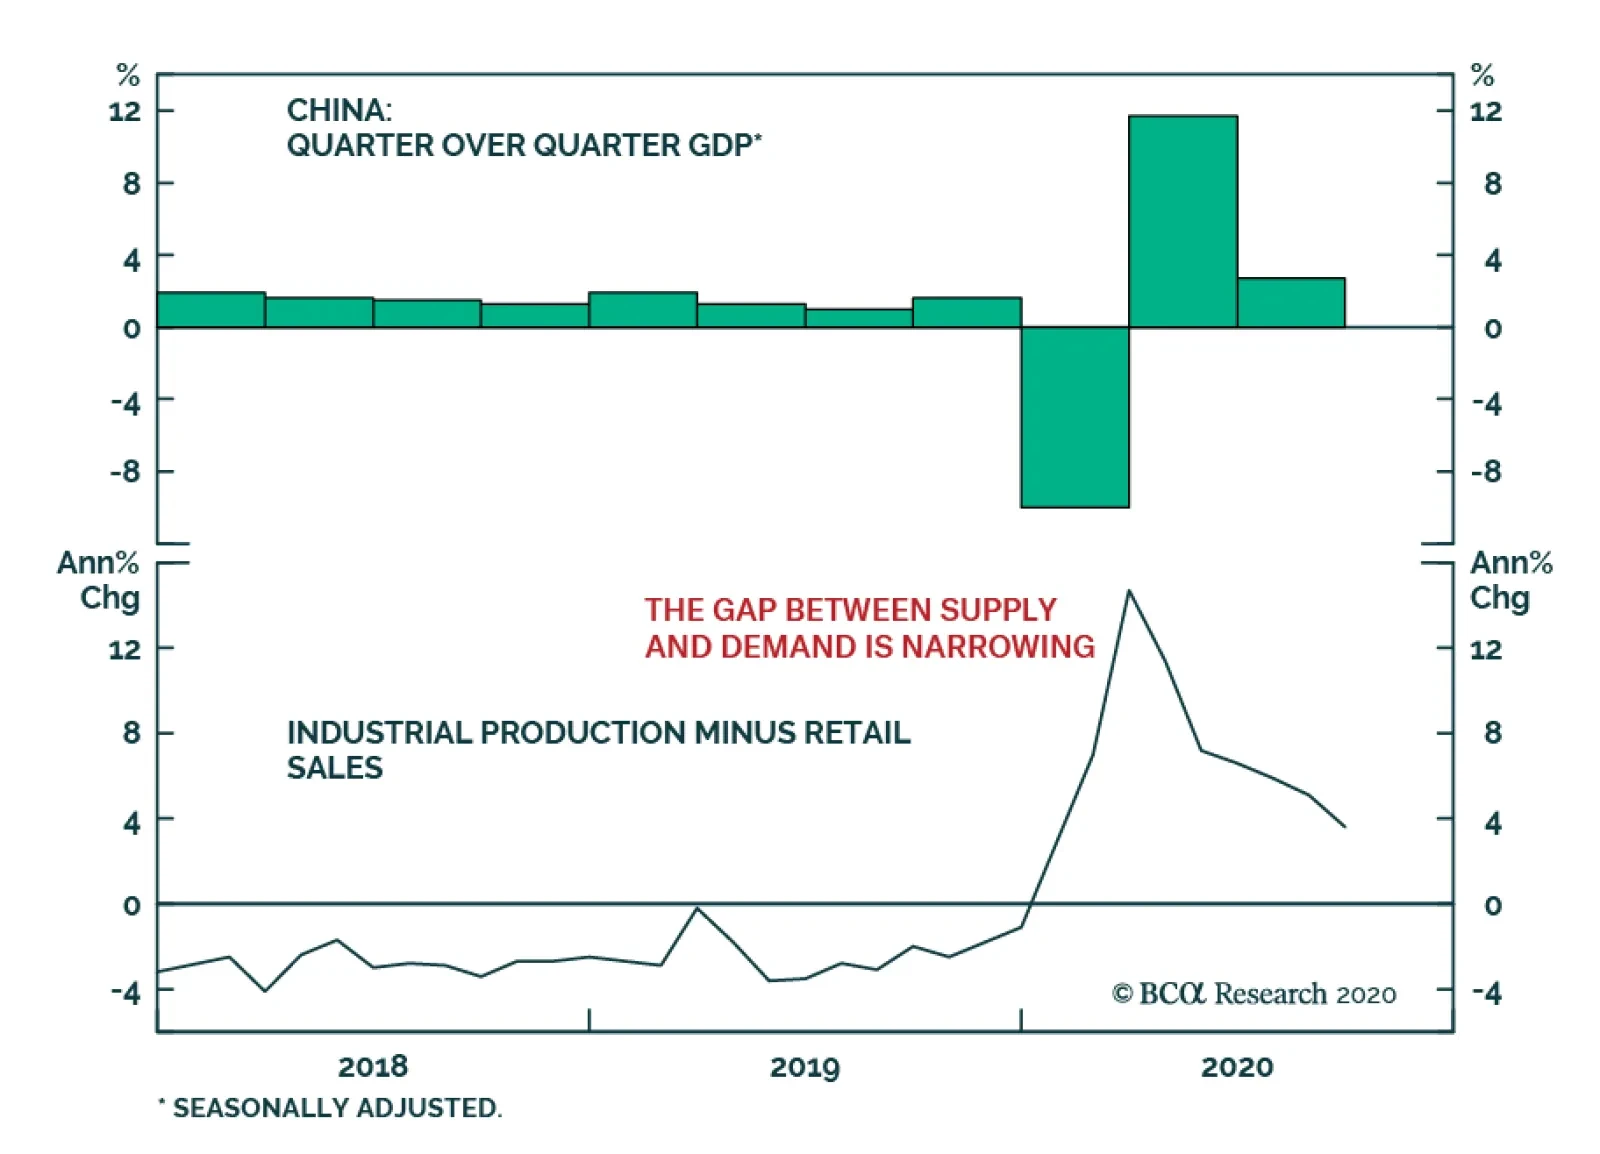
In the third quarter, the Chinese recovery continued, stronger than the headline growth numbers suggested. On a year-on-year basis, real GDP growth improved to 4.9% from 3.2% but missed estimates of 5.5%. Meanwhile, seasonally adjusted quarterly growth slowed…
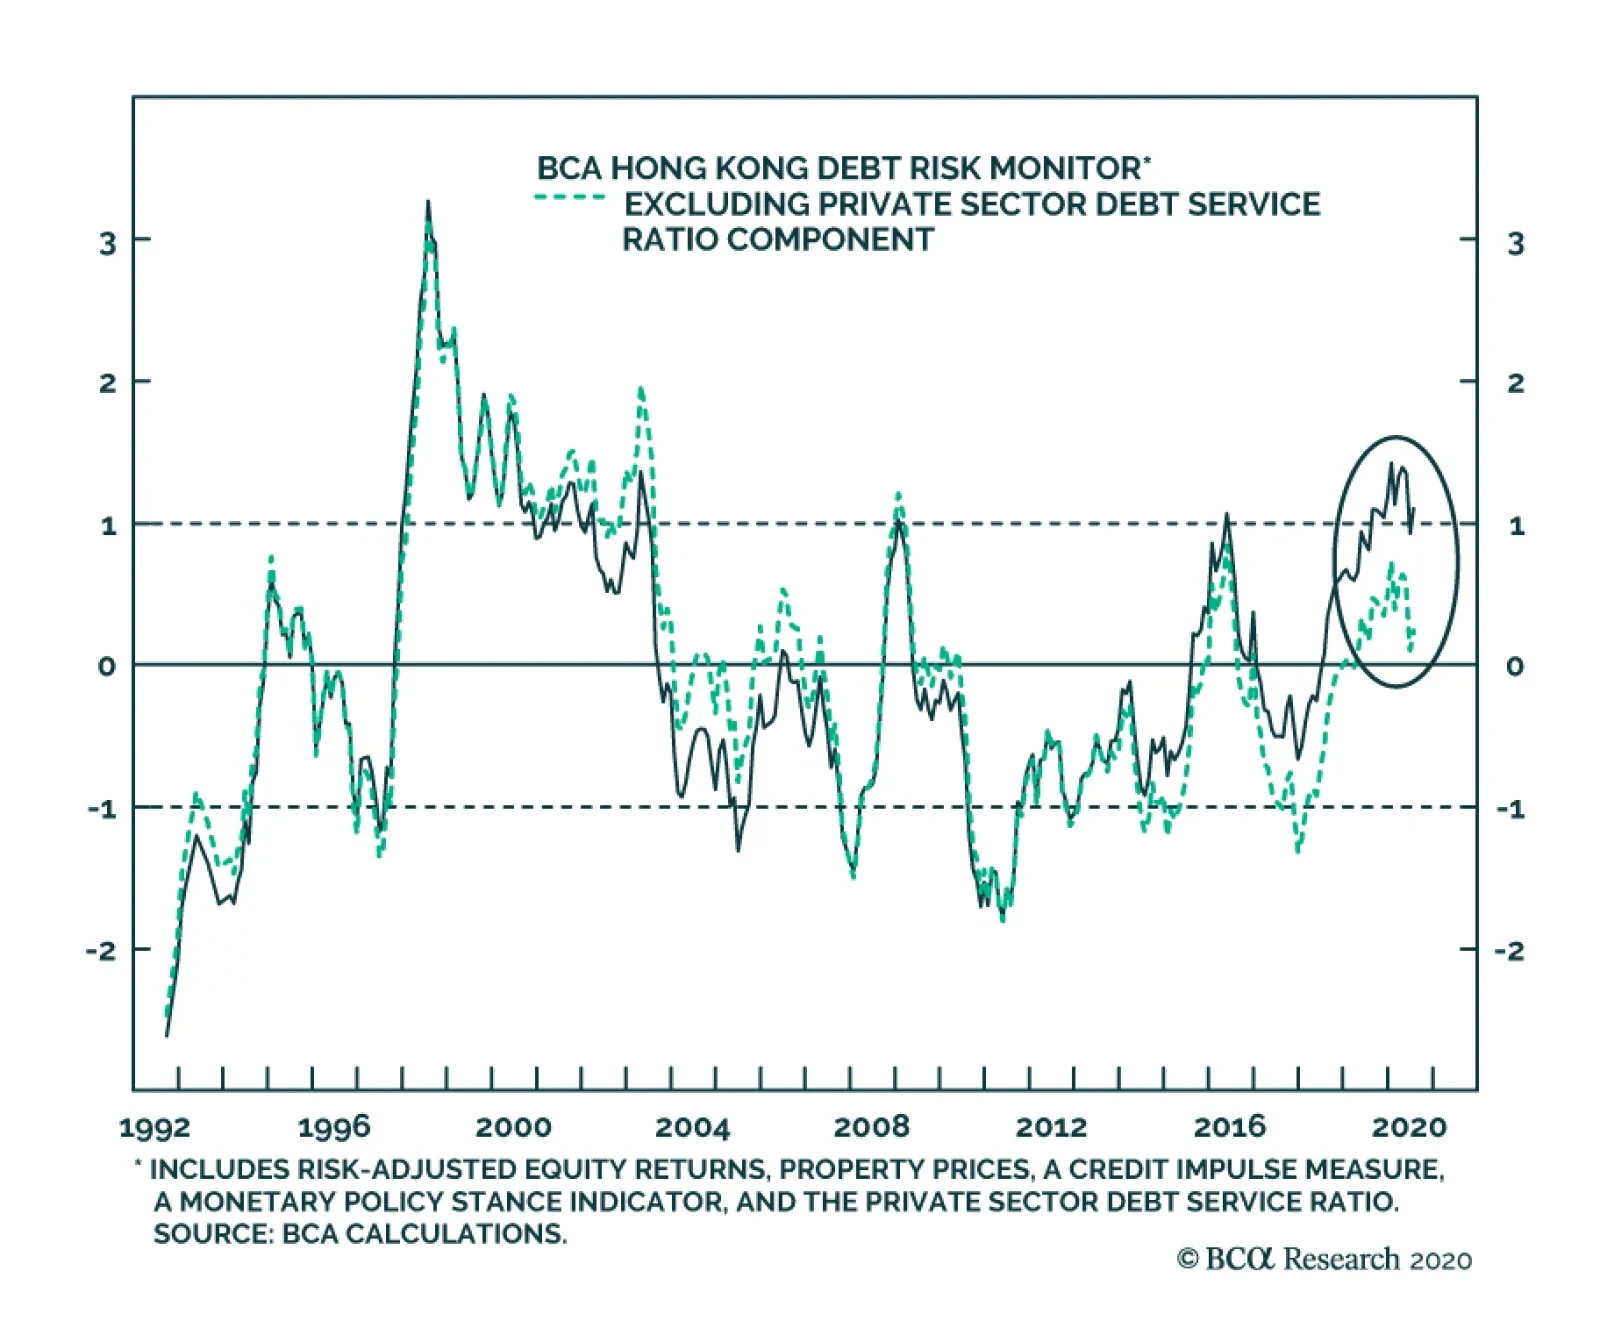
In a previous China Investment Strategy Special Report analyzing Hong Kong’s enormous private sector debt problem, we presented our BCA Hong Kong Debt Risk Monitor (DRM) to help investors gauge the risk of a serious credit-driven downturn in the region. The…
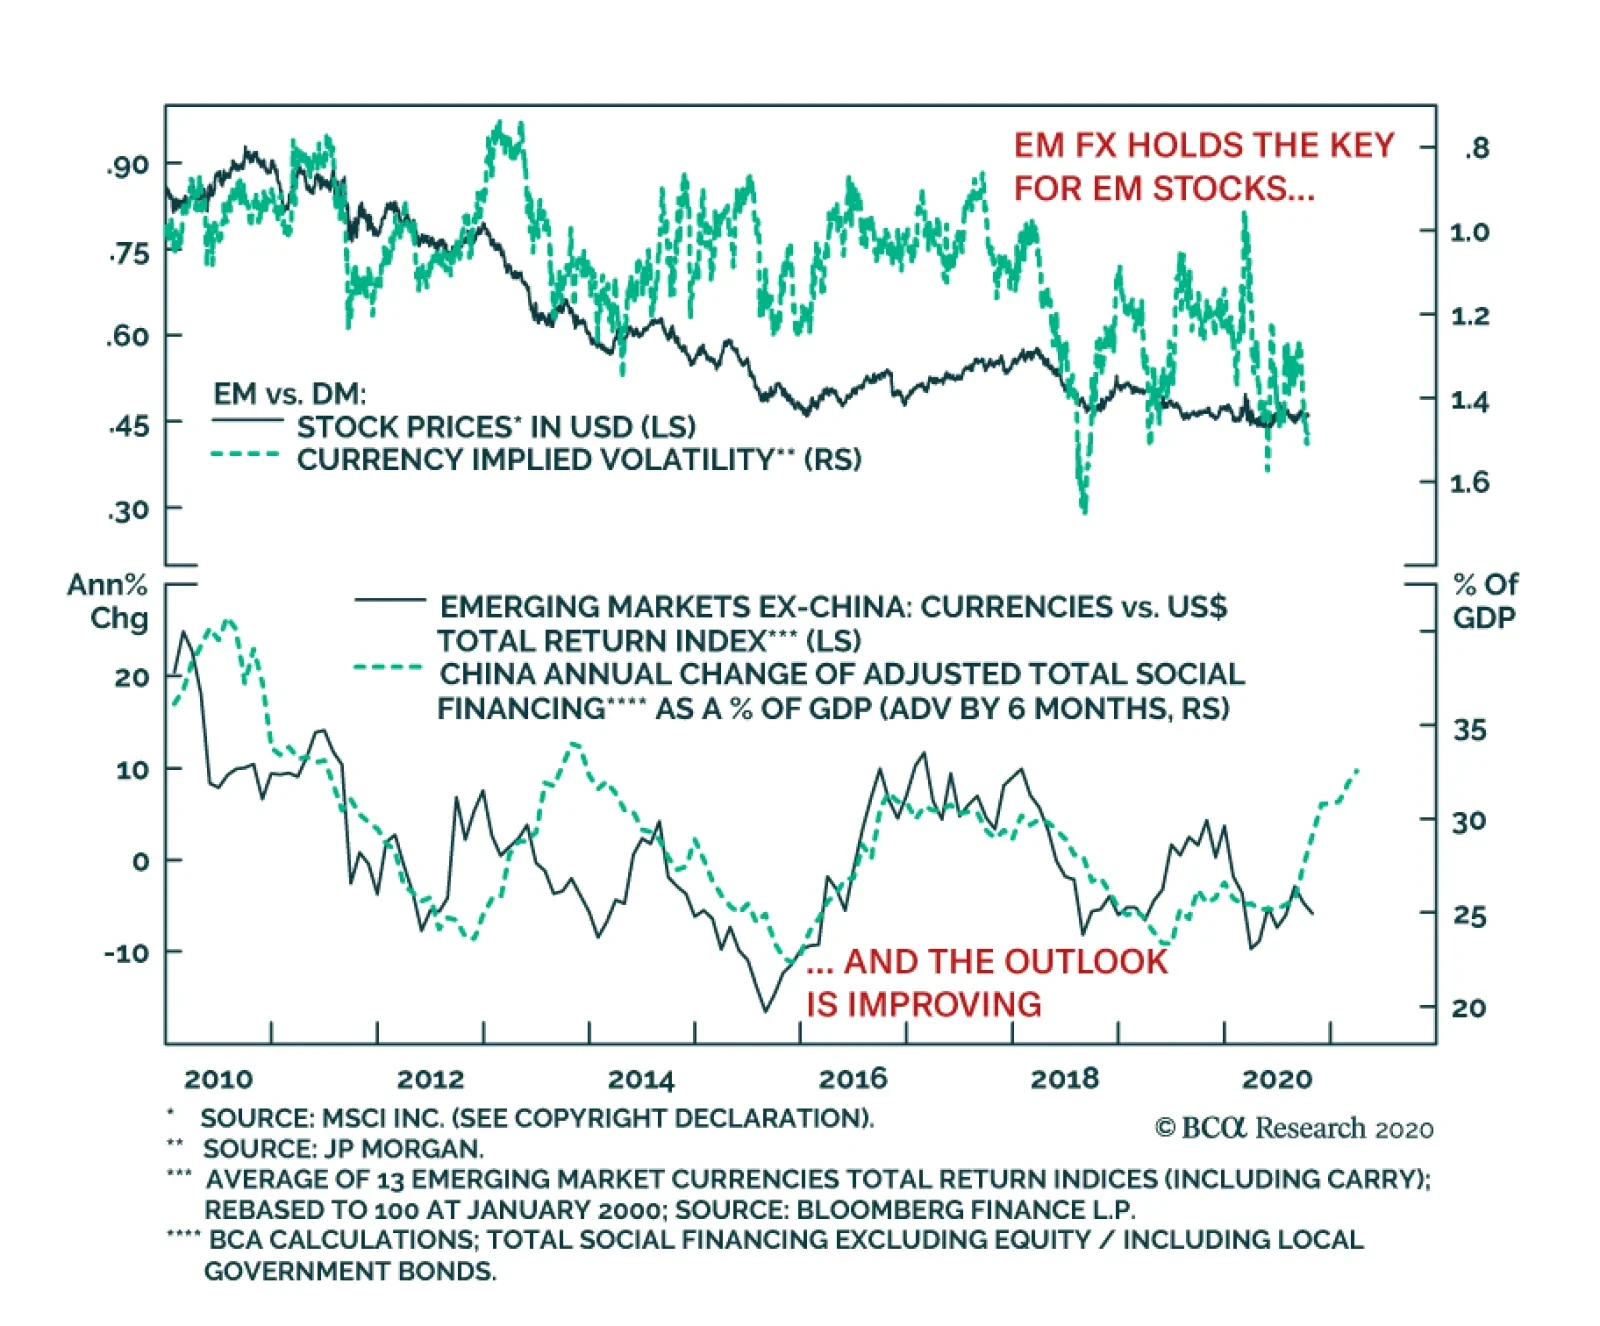
Despite a quick recovery in global industrial activity, EM equities, which normally thrive on rapid global growth, have been incapable of outperforming their DM counterparts. This underperformance reflects two factors. The first has nothing to with EM…
Chart Of The WeekInvestor Consensus Is Bearish On Dollar
Investor Consensus Is Bearish On Dollar
Investor Consensus Is Bearish On Dollar
Today we are releasing another issue from our series Charts That Matter. Going forward, this publication will become a regular monthly deliverable to our clients. This is a charts-only report with minimal wording. It presents the key charts, indicators, and relationships that we monitor at the time of publication. Needless to say, the importance of different indicators and factors varies over time. Thus, each issue of Charts That Matter will present different charts, indicators and relationships. Presently, global assets are experiencing a tug-of-war. On the one hand, equity and credit markets are overbought and have elevated valuations. On the other hand, expectations of a large US fiscal stimulus package are sustaining prospects of continued US and global economic recoveries. We have been expecting a pullback in risk assets before year-end due to a delay in significant US fiscal stimulus, potential volatility around the US elections as well as overbought conditions in risk assets. In addition, since April commodities prices have benefited from China’s growth recovery as well as inventory restocking (see Charts on page 11). Given that the latter is likely to be followed by a destocking phase, we believe resource prices are at a risk of experiencing a setback. This will weigh on commodity-producing emerging markets. The correction in September has been short circuited. It seems the prospects of an eventual large US fiscal stimulus package, even if it is next year, and the ongoing recovery in China (Charts on pages 8-9) are sustaining a bid under risk assets. Besides, cash on the sidelines has not been fully exhausted (Charts on page 6). Consistently, we illustrate on pages 3 that various US equity indexes are presently trying to break out and that the US equity market breadth has recently been strong. In contrast, EM equity breadth has been very weak (Chart on page 4). The latest rebound in the EM equity index has been again narrow, led by mega-cap new economy stocks in China, Korea and Taiwan. Provided such poor EM equity breadth in both absolute terms and relative to the US, we are reluctant to upgrade EM equities from neutral to overweight in a global equity portfolio. As to absolute performance, the Charts on pages 12-18 illustrate that many market-based indicators are flagging yellow or red lights for EM risk assets. Even though we turned structurally bearish on the US dollar in early July, we currently expect a tactical rebound in the greenback. Investor sentiment on the greenback is very depressed, which is positive for the US dollar from a contrarian perspective (Chart of the Week on page 1). In short, global financial markets are due to reset, which will not be long-lasting but will be meaningful and produce a better entry point. For now, we maintain a neutral allocation to EM stocks and credit markets within global equity and credit portfolios, respectively. In the currency space, we are short several EM currencies – BRL, CLP, ZAR, TRY, KRW and IDR – versus a basket of the euro, CHF and JPY. As to local rates, we are long duration – receiving 10-year swap rates in several countries – but are reluctant to take on currency risk at the moment. Arthur Budaghyan Chief Emerging Markets Strategist arthurb@bcaresearch.com US Equities Have Been Trading Well Various US equity indexes have broken out to new cyclical highs. This is a sign of a broad-based rally. Chart I-1US Equities Have Been Trading Well
US Equities Have Been Trading Well
US Equities Have Been Trading Well
Chart I-2US Equities Have Been Trading Well
US Equities Have Been Trading Well
US Equities Have Been Trading Well
Equity Market Breadth Is Strong In The US But Poor In EM The advance-decline line for the US equity market has rebounded from the neutral level of 0.5. On the contrary, the same measure for EM stocks remains below the 0.5 line, signaling poor breadth despite the rebound in the EM equity index. Chart I-3Equity Market Breadth Is Strong In The US But Poor In EM
Equity Market Breadth Is Strong In The US But Poor In EM
Equity Market Breadth Is Strong In The US But Poor In EM
The World Economy And Global Trade Are Reviving Economic data for September continue to register a sequential revival in business activity in most parts of the world. Chart I-4The World Economy And Global Trade Are Reviving
The World Economy And Global Trade Are Reviving
The World Economy And Global Trade Are Reviving
Chart I-5The World Economy And Global Trade Are Reviving
The World Economy And Global Trade Are Reviving
The World Economy And Global Trade Are Reviving
The US: Cash On The Sidelines Has Declined But Is Not Exhausted US institutional and money market funds presently amount to 8.5% of the value of the US equity market cap plus all US-dollar denominated bonds available to investors. The Fed and commercial banks hold $11 trillion of debt securities. This amount of securities has been withdrawn from the market and is not available to non-bank investors. Chart I-6The US: Cash On The Sidelines Has Declined But Is Not Exhausted
The US: Cash On The Sidelines Has Declined But Is Not Exhausted
The US: Cash On The Sidelines Has Declined But Is Not Exhausted
Chart I-7The US: Cash On The Sidelines Has Declined But Is Not Exhausted
The US: Cash On The Sidelines Has Declined But Is Not Exhausted
The US: Cash On The Sidelines Has Declined But Is Not Exhausted
A Delay In The US Fiscal Stimulus Package Is A Risk to The US Economy US fiscal transfers have produced a surge in household disposable income, which through consumer spending have contributed to the global recovery via a widening trade deficit. In the absence of large fiscal transfers to consumers, the opposite dynamics will prevail. Chart I-8A Delay In The US Fiscal Stimulus Package Is A Risk to The US Economy
A Delay In The US Fiscal Stimulus Package Is A Risk to The US Economy
A Delay In The US Fiscal Stimulus Package Is A Risk to The US Economy
Chart I-9A Delay In The US Fiscal Stimulus Package Is A Risk to The US Economy
A Delay In The US Fiscal Stimulus Package Is A Risk to The US Economy
A Delay In The US Fiscal Stimulus Package Is A Risk to The US Economy
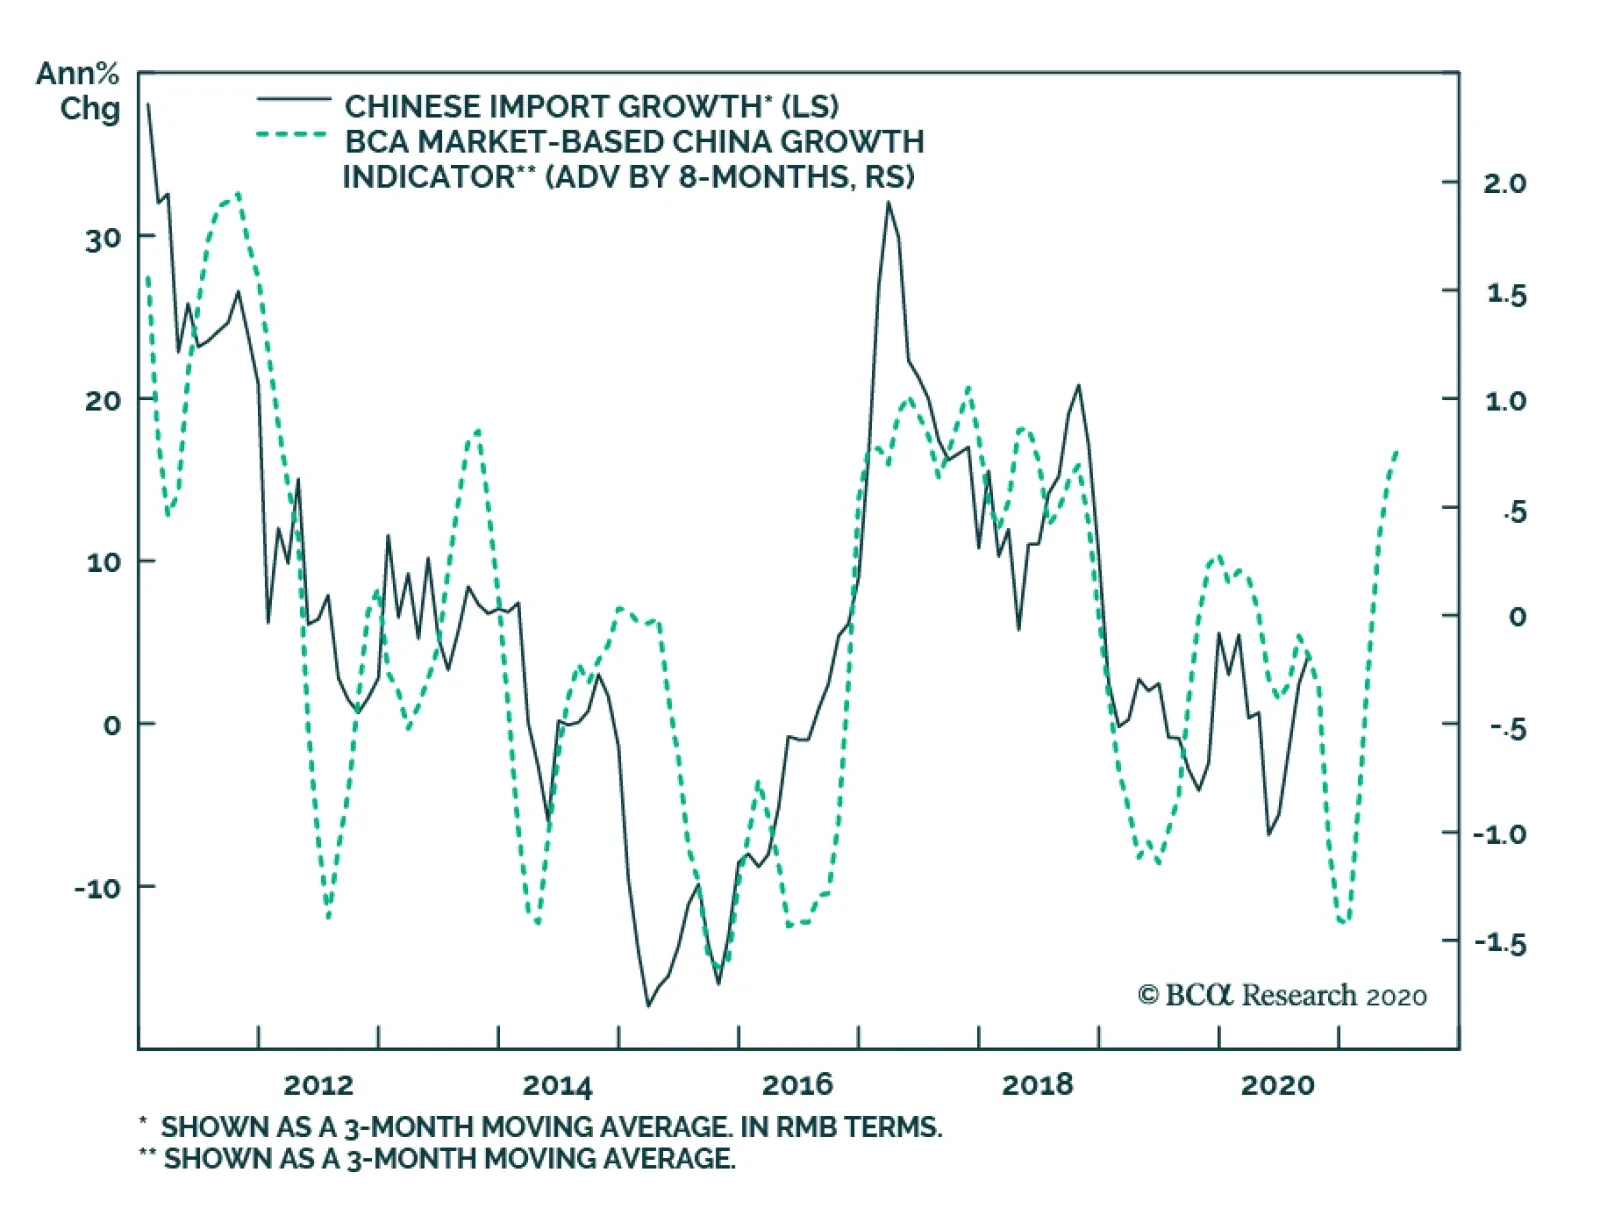
The Business Cycle In China Is Recovering China’s domestic demand and production are recovering but labor market improvements are still timid. Chart I-10The Business Cycle In China Is Recovering
The Business Cycle In China Is Recovering
The Business Cycle In China Is Recovering
Chart I-11The Business Cycle In China Is Recovering
The Business Cycle In China Is Recovering
The Business Cycle In China Is Recovering
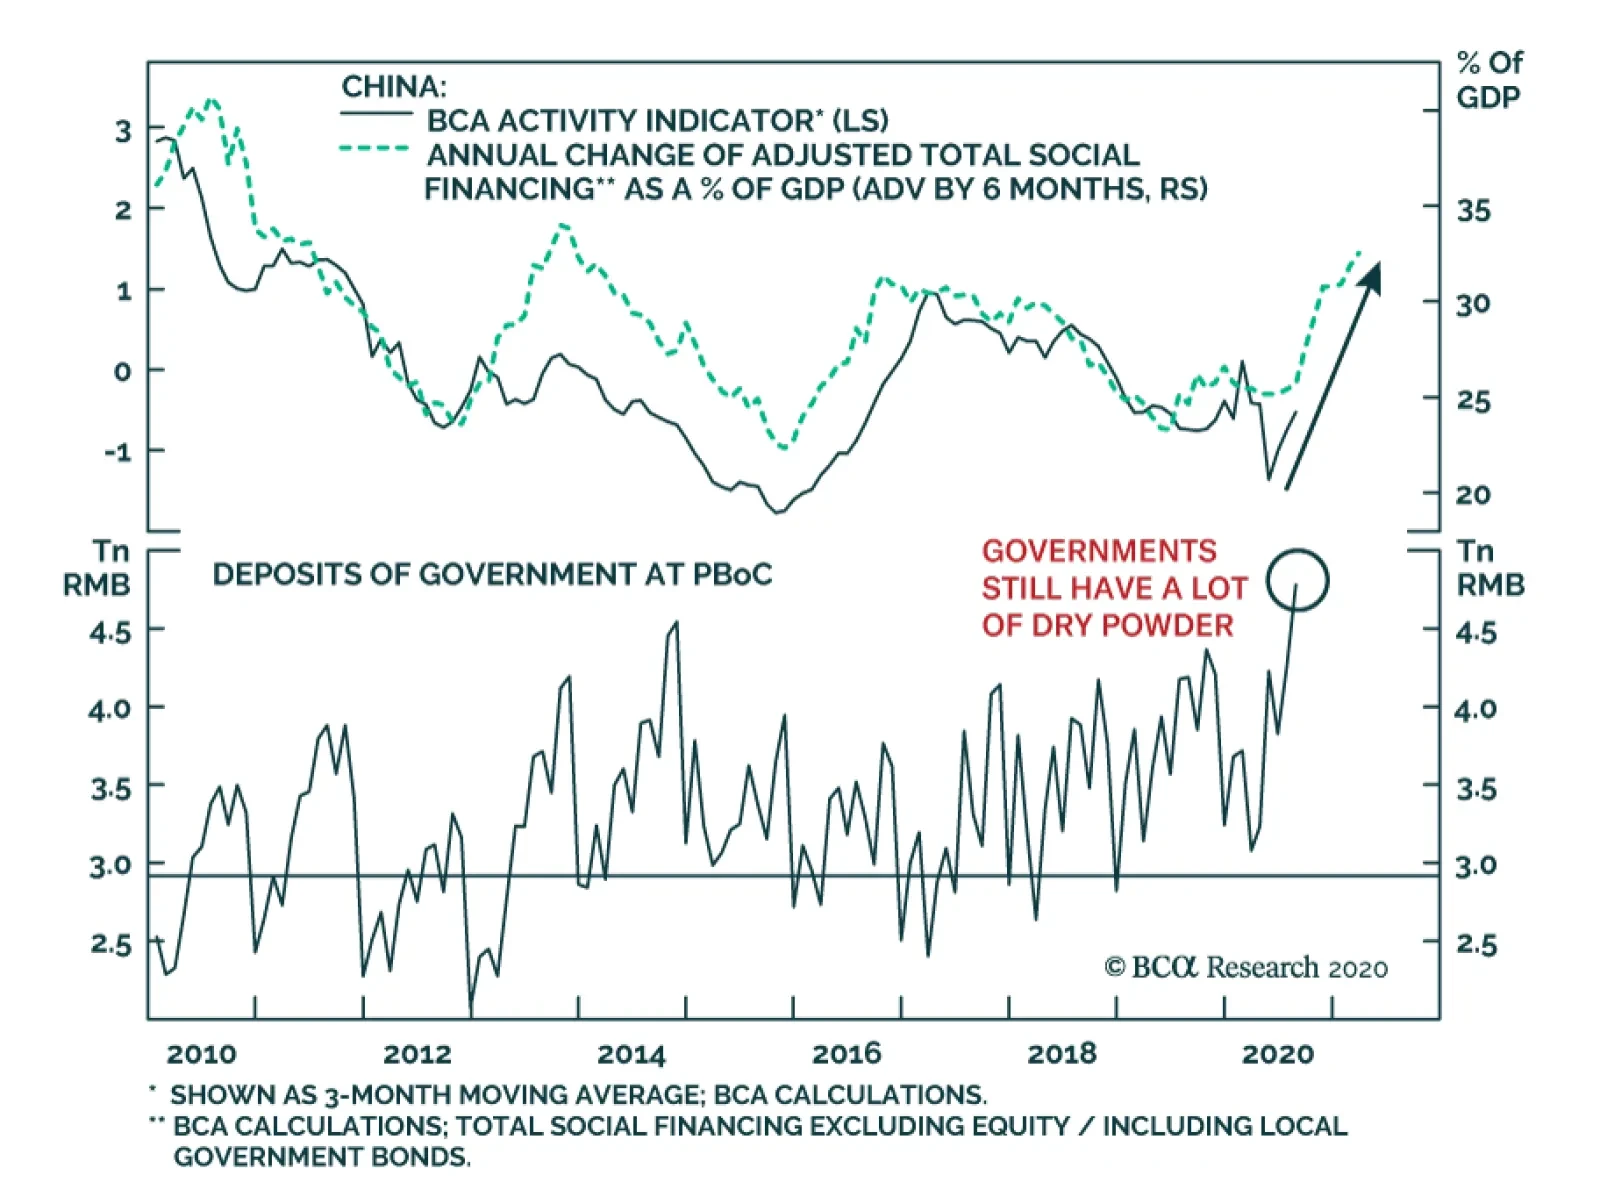
China: The Stimulus Is Working Its Way Into The Economy In China, the credit and fiscal stimulus leads the business cycle by about nine months. Thereby, China’s recovery will continue until the end of Q2 2021. Chart I-12China: The Stimulus Is Working Its Way Into The Economy
China: The Stimulus Is Working Its Way Into The Economy
China: The Stimulus Is Working Its Way Into The Economy
Chart I-13China: The Stimulus Is Working Its Way Into The Economy
China: The Stimulus Is Working Its Way Into The Economy
China: The Stimulus Is Working Its Way Into The Economy
China: Liquidity Tightening Has Not Yet Affected Money And Credit Growth The PBoC has withdrawn liquidity, pushing up the policy rate and bond yields. With a time lag, money and credit growth will eventually roll over. But for now, China is enjoying another period of credit splurge and the credit excesses are getting larger. Chart I-14China: Liquidity Tightening Has Not Yet Affected Money And Credit Growth
China: Liquidity Tightening Has Not Yet Affected Money And Credit Growth
China: Liquidity Tightening Has Not Yet Affected Money And Credit Growth
Chart I-15China: Liquidity Tightening Has Not Yet Affected Money And Credit Growth
China: Liquidity Tightening Has Not Yet Affected Money And Credit Growth
China: Liquidity Tightening Has Not Yet Affected Money And Credit Growth
China: From Commodities Restocking To Destocking? Chinese imports of many commodities have been super strong since April. However, they have substantially outpaced their final demand. This suggests there has been an inventory restocking phase. This will likely soon be followed by a period of destocking when Chinese imports of resources dwindle for several months. Chart I-16China: From Commodities Restocking To Destocking?
China: From Commodities Restocking To Destocking?
China: From Commodities Restocking To Destocking?
Chart I-17China: From Commodities Restocking To Destocking?
China: From Commodities Restocking To Destocking?
China: From Commodities Restocking To Destocking?
Red Flags For EM Currencies The rollover in platinum prices and pick-up in EM currency volatility (shown inverted on the bottom panel) point to a rebound in the US dollar and a relapse in EM exchange rates. Chart I-18Red Flags For EM Currencies
Red Flags For EM Currencies
Red Flags For EM Currencies
Yellow Flags For EM Equities The new cyclical high in EM share prices has not been confirmed by a new low in EM equity volatility (the latter shown inverted in the top panel). Moreover, our Risk-On/Safe-Haven Currency ratio has been trending lower since June, flagging risks to EM assets. Finally, global ex-TMT stocks are struggling to break above their June highs. Chart I-19Yellow Flags For EM Equities
Yellow Flags For EM Equities
Yellow Flags For EM Equities
EM Sovereign And Corporate Spreads, Currencies, Equities And Commodities Commodities prices and EM currencies drive EM sovereign and corporate spreads while EM corporate bond yields (shown inverted in the bottom panel) correlate with EM share prices. Chart I-20EM Sovereign And Corporate Spreads, Currencies, Equities And Commodities
EM Sovereign And Corporate Spreads, Currencies, Equities And Commodities
EM Sovereign And Corporate Spreads, Currencies, Equities And Commodities
Many Currencies Against The US Dollar Are At Critical Resistances If these currencies break out of these technical resistance levels, they will experience a lasting appreciation versus the US dollar. However, in our view, they will initially weaken before breaking out next year. Chart I-21Many Currencies Against The US Dollar Are At Critical Resistances
Many Currencies Against The US Dollar Are At Critical Resistances
Many Currencies Against The US Dollar Are At Critical Resistances
Chart I-22Many Currencies Against The US Dollar Are At Critical Resistances
Many Currencies Against The US Dollar Are At Critical Resistances
Many Currencies Against The US Dollar Are At Critical Resistances
Are Global Defensive Equity Sectors On A Cusp Of Outperformance? Many defensive equity sectors have reached or are close to their technical support lines. Their outperformance will likely occur during a risk-off period. Chart I-23Are Global Defensive Equity Sectors On A Cusp Of Outperformance?
Are Global Defensive Equity Sectors On A Cusp Of Outperformance?
Are Global Defensive Equity Sectors On A Cusp Of Outperformance?
Chart I-24Are Global Defensive Equity Sectors On A Cusp Of Outperformance?
Are Global Defensive Equity Sectors On A Cusp Of Outperformance?
Are Global Defensive Equity Sectors On A Cusp Of Outperformance?
These Markets Have Not Yet Entered A Bull Market These markets have rebounded to their technical resistance lines but have so far failed to break out. This gives us comfort to remain neutral on EM by expecting a pullback. Chart I-25These Markets Have Not Yet Entered A Bull Market
These Markets Have Not Yet Entered A Bull Market
These Markets Have Not Yet Entered A Bull Market
Chart I-26These Markets Have Not Yet Entered A Bull Market
These Markets Have Not Yet Entered A Bull Market
These Markets Have Not Yet Entered A Bull Market
Risk Measures Signal Modest Investor Complacency The SKEW index for the S&P 500 is low, entailing that investors are not hedging tail risks. The put-call ratio is not elevated despite many investors hedging against the US election uncertainty. Critically, the Nasdaq’s volatility is in a bull market. Chart I-27Risk Measures Signal Modest Investor Complacency
Risk Measures Signal Modest Investor Complacency
Risk Measures Signal Modest Investor Complacency
Chart I-28Risk Measures Signal Modest Investor Complacency
Risk Measures Signal Modest Investor Complacency
Risk Measures Signal Modest Investor Complacency
EM (ex-China, Korea And Taiwan): The Recovery Is Sluggish And Subdued Outside China, Korea and Taiwan, EM domestic demand recovery is very slow and tame. In these economies, the fiscal stimulus has been small, the banking system is unhealthy and the monetary transmission mechanism is broken, i.e. banks are failing to properly transmit monetary easing into the real economy. Chart I-29EM (ex-China, Korea And Taiwan): The Recovery Is Sluggish And Subdued
EM (ex-China, Korea And Taiwan): The Recovery Is Sluggish And Subdued
EM (ex-China, Korea And Taiwan): The Recovery Is Sluggish And Subdued
Chart I-30EM (ex-China, Korea And Taiwan): The Recovery Is Sluggish And Subdued
EM (ex-China, Korea And Taiwan): The Recovery Is Sluggish And Subdued
EM (ex-China, Korea And Taiwan): The Recovery Is Sluggish And Subdued
Footnotes Equities Recommendations Currencies, Credit And Fixed-Income Recommendations
One of the most important leading indicators of global industrial activity continues to send a positive signal for the global business cycle. China’s credit flows remain strong, as new loan issuance rose to CNY1.9trillion in September from CNY1.28 trillion in…
Highlights Our model suggests that more rate hikes are ahead in 2021; we project a less than 50bps increase in the PBoC policy rate from the current level. Chinese stock prices positively correlate with interest rates and bond yields. The relationship has strengthened since 2015. In the next six to nine months, Chinese stock prices will likely trend up alongside a rising policy rate and an accelerating economic growth. Feature China’s policy rate and bond yields have been rising sharply since May and are breaching their pre-COVID 19 levels. Meanwhile, Chinese stock prices have moved sideways since mid-July, despite a steady recovery in the domestic economy. While some commentators view higher interest rates as a harbinger of an impending equity market weakness, our research shows that the relationship between China’s stock prices and short-term rates has been positive since 2015. A rally in Chinese stocks and outperformance of cyclical stocks relative to defensives positively correlate with rising interest rates and bond yields (Chart 1A and 1B). Chart 1ARising Bond Yields Coincide With Ascending Chinese Stock Prices...
Rising Bond Yields Coincide With Ascending Chinese Stock Prices...
Rising Bond Yields Coincide With Ascending Chinese Stock Prices...
Chart 1B...And Offshore Cyclicals
...And Offshore Cyclicals
...And Offshore Cyclicals
Chart 2Massive Stimulus In 2020 Will Accelerate Economic Growth Into 1H21
Massive Stimulus In 2020 Will Accelerate Economic Growth Into 1H21
Massive Stimulus In 2020 Will Accelerate Economic Growth Into 1H21
China’s massive stimulus this year generated some self-sustaining momentum that will likely push the nation’s output higher in 1H21(Chart 2). The PBoC may raise the policy rate by as much as 50bps in 2021 from its current level, but strong domestic fundamentals should be able to drive up Chinese stock prices, in both absolute term and relative to global equities in the next six to nine months. PBoC Policy Hikes:Still More Ahead While the PBoC’s policy rate has rebounded sharply, it remains at its lowest level since the Global Financial Crisis. Looking forward, will the central bank bring the policy rate (e.g. 3-month SHIBOR) back to its pre-COVID 19 range of 3 – 3.5% or the pre-trade war level near 5%? The acceleration in China’s economic recovery is expected to continue and would boost China’s annual output growth in 1H21 to two to three percentage points above its trend. Based on these estimates, our interest rate model implies more than 200bps in rate increases in 2021 from the current level1 (Chart 3). Chart 3Rising Odds Of PBoC Rate Hikes In 2021
Rising Odds Of PBoC Rate Hikes In 2021
Rising Odds Of PBoC Rate Hikes In 2021
Historically, our model has successfully captured the major turning points in China's policy rate cycles. This time around, however, the pandemic and the subsequent economic recovery may have complicated the model's predictive power. The model suggests that, in 1H21 the policy rate will return to its pre-trade war range of 4-5%, but we think the rate increases will be capped within 50bps. The model follows a modified version of "Taylor's Rule," in which we assume that the PBoC will target its short-term interest rate based on the deviation between actual and desired inflation rates and the deviation between real GDP growth and China’s trend GDP growth rate. The latest data shows across-the-board strengthening in the economy; most indicators have surprised to the upside, confirming our optimistic assessment.2 However, Taylor's Rule is not able to account for sudden shocks in the economy, such as a pandemic-induced global recession. Thus, the model exaggerates the magnitude of interest rate bumps, based on an economic growth acceleration following a one-off economic shock. In a report earlier this year, we noted that the PBoC has been proactive in normalizing its monetary policy following short-term shocks.3 This is contrary to economic downturns when the PBoC has been a reactive central bank and its decisions often lagged a pickup in economic activity. As such, although interest rates have swiftly rebounded after the pandemic-induced growth contraction in Q1, we expect the pace of rate hikes to be slower in 2021. Chart 4Rapid RMB Appreciation Will Bring Headwinds To Chinese Industrial Profits
Rapid RMB Appreciation Will Bring Headwinds To Chinese Industrial Profits
Rapid RMB Appreciation Will Bring Headwinds To Chinese Industrial Profits
External factors are accounted for in the model, though they may be underestimated. The US Federal Reserve Bank has decisively shifted its monetary policy to broadly accommodative and will stay behind the inflation curve in the next few years. The collapse in interest rate differentials between the US and China has made RMB-denominated assets attractive, boosting strong inflows of foreign capital and rapidly pushing up the value of the RMB (Chart 4, top panel). While we think Chinese policymakers have pivoted to prefer a strong RMB, the recent countermeasures by the PBoC indicate that the central bank will not allow the RMB to climb too rapidly.4 China's drastic tightening in monetary conditions and the sharp rally in the trade-weighted RMB from 2011 to 2014 led to a prolonged economic downturn (Chart 4, bottom panel). Therefore, in the absence of synchronized policy tightening from other central banks, the magnitude of rate hikes by the PBoC will be measured. Bottom Line: The PBoC will continue to push up the policy rate in 2021, but our baseline view is that the magnitude will be capped below 50bps. Interest Rates And Chinese Stocks Chart 5Chinese Stocks/Bond Yields Correlation Became Much More Positive After 2015
Chinese Stocks/Bond Yields Correlation Became Much More Positive After 2015
Chinese Stocks/Bond Yields Correlation Became Much More Positive After 2015
Many investors might think that stock prices tend to react negatively to monetary policy tightening because interest rate upturns and mounting bond yields lead to higher costs of funding for corporations and lower profit growth. However, Chinese stock prices started moving in the same direction with policy rates and bond yields following the burst of the 2014/15 stock market bubble (Chart 5 and Chart 1A and 1B on Page 4 and 2). In general, when China’s economic and profit growth accelerates, share prices can rise with higher interest rates. Share prices can still climb with cuts in interest rates even when economic growth slows but profit growth rate remains in positive territory. However, when profit growth is expected to drop below zero, share prices will drop even if rates are falling (Chart 6A and 6B). In this vein, the most pertinent reason for Chinese stocks to move in tandem with bond yields is that Chinese stocks are increasingly driven by economic fundamentals, which are supported by the volume of total credit creation (measured by total social financing) rather than the price of money in China. Furthermore, the reverse relationship between the volume and price of money in China broke down after 2015; China’s credit creation has become less sensitive to changes in interest rates. Chart 6AWhen Interest Rates Rise...
When Interest Rates Rise...
When Interest Rates Rise...
Chart 6B...Economic Growth Holds The Key For Stock Performance
...Economic Growth Holds The Key For Stock Performance
...Economic Growth Holds The Key For Stock Performance
Since 2015, the PBOC shifted its policy to target interest rates instead of the quantity of money supply (Chart 7). In order to effectively manage the official interbank rates (the 7-day interbank repo rate), the central bank uses tools such as reserve requirement ratio cuts and liquidity injections in the interbank system (Chart 8). In other words, the central bank has forgone its control of the volume of money. Moreover, since late 2016, rather than direct interest rate hikes, the PBoC has been taking monetary policy tightening measures through changes in its macro-prudential assessment (MPA). The changes in the MPA are evident in the 3-month / 1-week repo spread.5 As such, an increase in the 3-month interbank repo rate (and SHIBOR) is often intended to curb shadow-banking activities rather than depress aggregate credit creation and business activities (Chart 9). Chart 7Monetary Policy Regime Shifted In 2015
Monetary Policy Regime Shifted In 2015
Monetary Policy Regime Shifted In 2015
Chart 8More Open Market Operations
Monetary Tightening ≠ Lower Stock Prices
Monetary Tightening ≠ Lower Stock Prices
Chart 9Most Monetary Tightening Has Been Carried Out Through MPA Since 2016
Most Monetary Tightening Has Been Carried Out Through MPA Since 2016
Most Monetary Tightening Has Been Carried Out Through MPA Since 2016
Another idiosyncrasy is China’s fiscal stimulus, which has become a more relevant driver of total social financing since the onset of the 2014/15 economic downcycle (Chart 10). The amount of government bond issuance is specified by the People’s Congress in March each year and is not affected by changes in interest rates or bond yields. Therefore, growth in total social financing can still accelerate despite a higher price of money (Chart 11). Chart 10Fiscal Lever Has Become More Prominent In Driving Business Cycles Since 2015
Fiscal Lever Has Become More Prominent In Driving Business Cycles Since 2015
Fiscal Lever Has Become More Prominent In Driving Business Cycles Since 2015
Chart 11Changes In Interest Rates Have Little Impact On Fiscal And Quasi-Fiscal Borrowing
Changes In Interest Rates Have Little Impact On Fiscal And Quasi-Fiscal Borrowing
Changes In Interest Rates Have Little Impact On Fiscal And Quasi-Fiscal Borrowing
By the same token, a rising 3-month SHIBOR can also be the result of rapid fiscal and quasi-fiscal expansions, as seen in Q3 this year. A flood of central and local government bond issuance drained liquidities from commercial banks, boosting the banks’ needs to borrow money from the interbank system. Nevertheless, the market’s appetite for risk assets increases because fiscal stimulus provides an imminent and powerful reflationary force in China’s business cycles. Chart 12Bank Lending Rates Can Still Trend Downwards Against A Rising Policy Rate
Bank Lending Rates Can Still Trend Downwards Against A Rising Policy Rate
Bank Lending Rates Can Still Trend Downwards Against A Rising Policy Rate
Rising policy rates typically push up corporate bond yields. However, bond yields in China play a relatively small role in driving corporate financing costs on an aggregate level, since commercial banks are still dominant in China’s debt market. Commercial banks' average lending rates closely track the PBoC’s policy rate on a cyclical basis, but Chinese authorities periodically use window guidance to target the Loan Prime Rate (LPR), a reformed bank lending rate. Hence, the direction in both the LPR and the average lending rate can temporarily diverge from the policy rate. These measures can boost bank loan growth even in a rising interest rate environment (Chart 12). Bottom Line: The key driver of Chinese stock performance is the country’s domestic credit, business, and corporate profit growth cycles. Since the 2014/15 cycle, the policy rate has not been the determinant of China’s economic or credit growth. Investment Conclusions We expect that this year’s massive monetary and fiscal stimulus to accelerate the country’s economic recovery into 1H21. Therefore, even if interest rates and bond yields advance, Chinese stock prices can still trend upward. Chinese cyclical stocks should also continue to outperform defensives, in both the onshore and offshore markets (Chart 13A and 13B). Chart 13AStay Invested In Chinese Stocks
Stay Invested In Chinese Stocks
Stay Invested In Chinese Stocks
Chart 13BCyclicals Still Have Upside Potentials
Cyclicals Still Have Upside Potentials
Cyclicals Still Have Upside Potentials
Rates will begin to climb and fiscal policy will also become more restrictive if China’s output moves above trend growth through 1H21. Government bond quotas and fiscal budget will be determined at the National People’s Congress in March. If the economy is strong, odds are that fiscal stimulus will be scaled back. At that point, investors should start to look for a peak in China’s business cycle linked to monetary and fiscal policy tightening. As growth expectations start to downshift in the equity market, yields on long-dated government bonds will start to decline while yields on the short end will not drop. Additionally, the small-cap ChiNext market has been considered as a speculative segment of the domestic financial market with higher multiples and greater volatility than large-cap A shares. The bourse's trailing price-to-earnings ratio and price-to-book ratio are extremely elevated at 79 and 8.6, respectively, much higher than for broader onshore and offshore Chinese stocks. As such, this market will remain the most vulnerable to domestic liquidity tightening. Jing Sima China Strategist jings@bcaresearch.com Footnotes 1 based on our estimates for 1h21: 7.5-8.0% GDP growth, 2.5-2.8% headline CPI, 6.5-6.7 USD/CNY, and the fed holding current fund rate unchanged. 2Please see China Investment Strategy Weekly Report "China Macro And Market Review," dated October 7, 2020, available at cis.bcaresearch.com 3Please see China Investment Strategy Weekly Report "Don’t Chase China’s Bond Yields Lower," dated February 19, 2020, available at cis.bcaresearch.com 4On October 12, the PBoC removed financial institutions’ Forex reserve ratio of 20%, making betting against the RMB cheaper. 5Please see China Investment Strategy Special Report "Seven Questions About Chinese Monetary Policy," dated February 22, 2018, available at cis.bcaresearch.com Cyclical Investment Stance Equity Sector Recommendations
This week’s September import data from China positively surprised investor expectations, having accelerated significantly from August levels. In August, YoY import growth came in at -2.1% in USD terms (-0.5% in RMB terms); September’s readings, by contrast,…
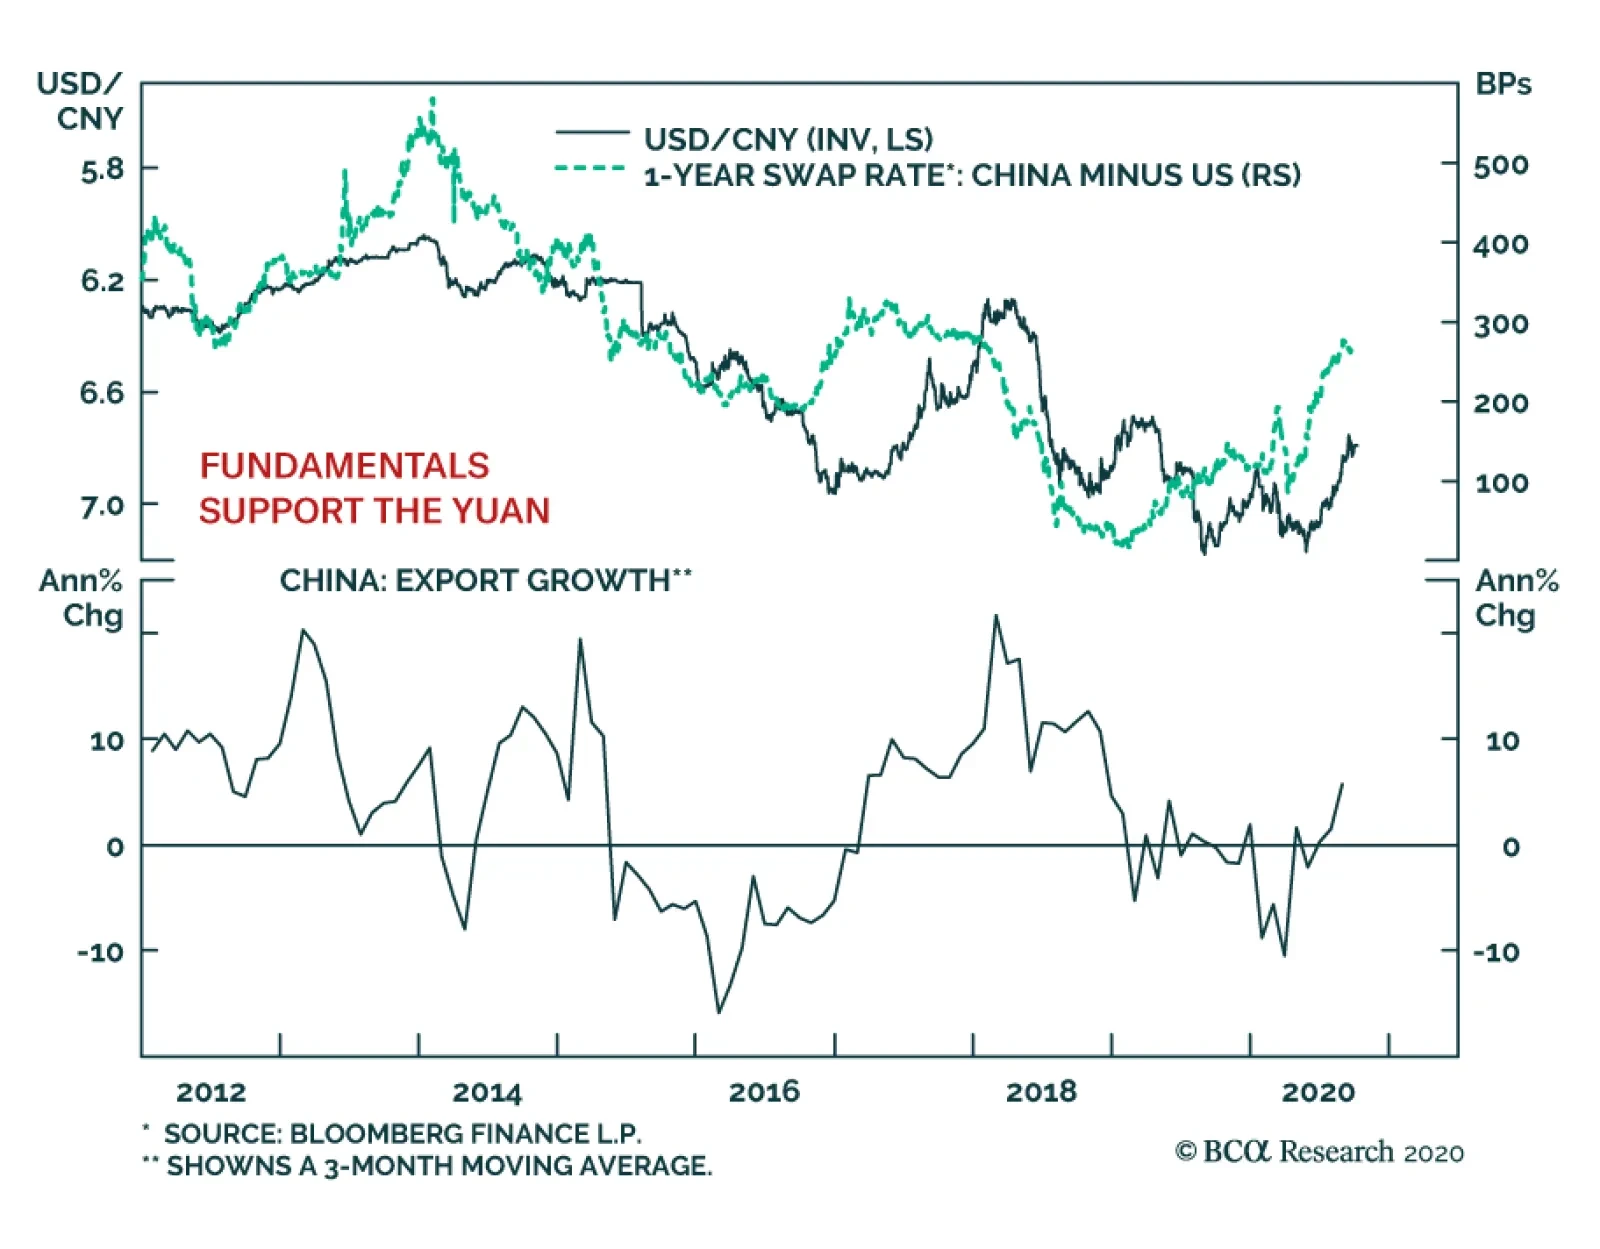
Since May 27, the onshore CNY has appreciated more than 7% against the USD and it trades at levels last seen in April 2019, just prior to the imposition of additional tariffs by the Trump administration on US$250 billion of Chinese exports to the US. A few…