Emerging Markets
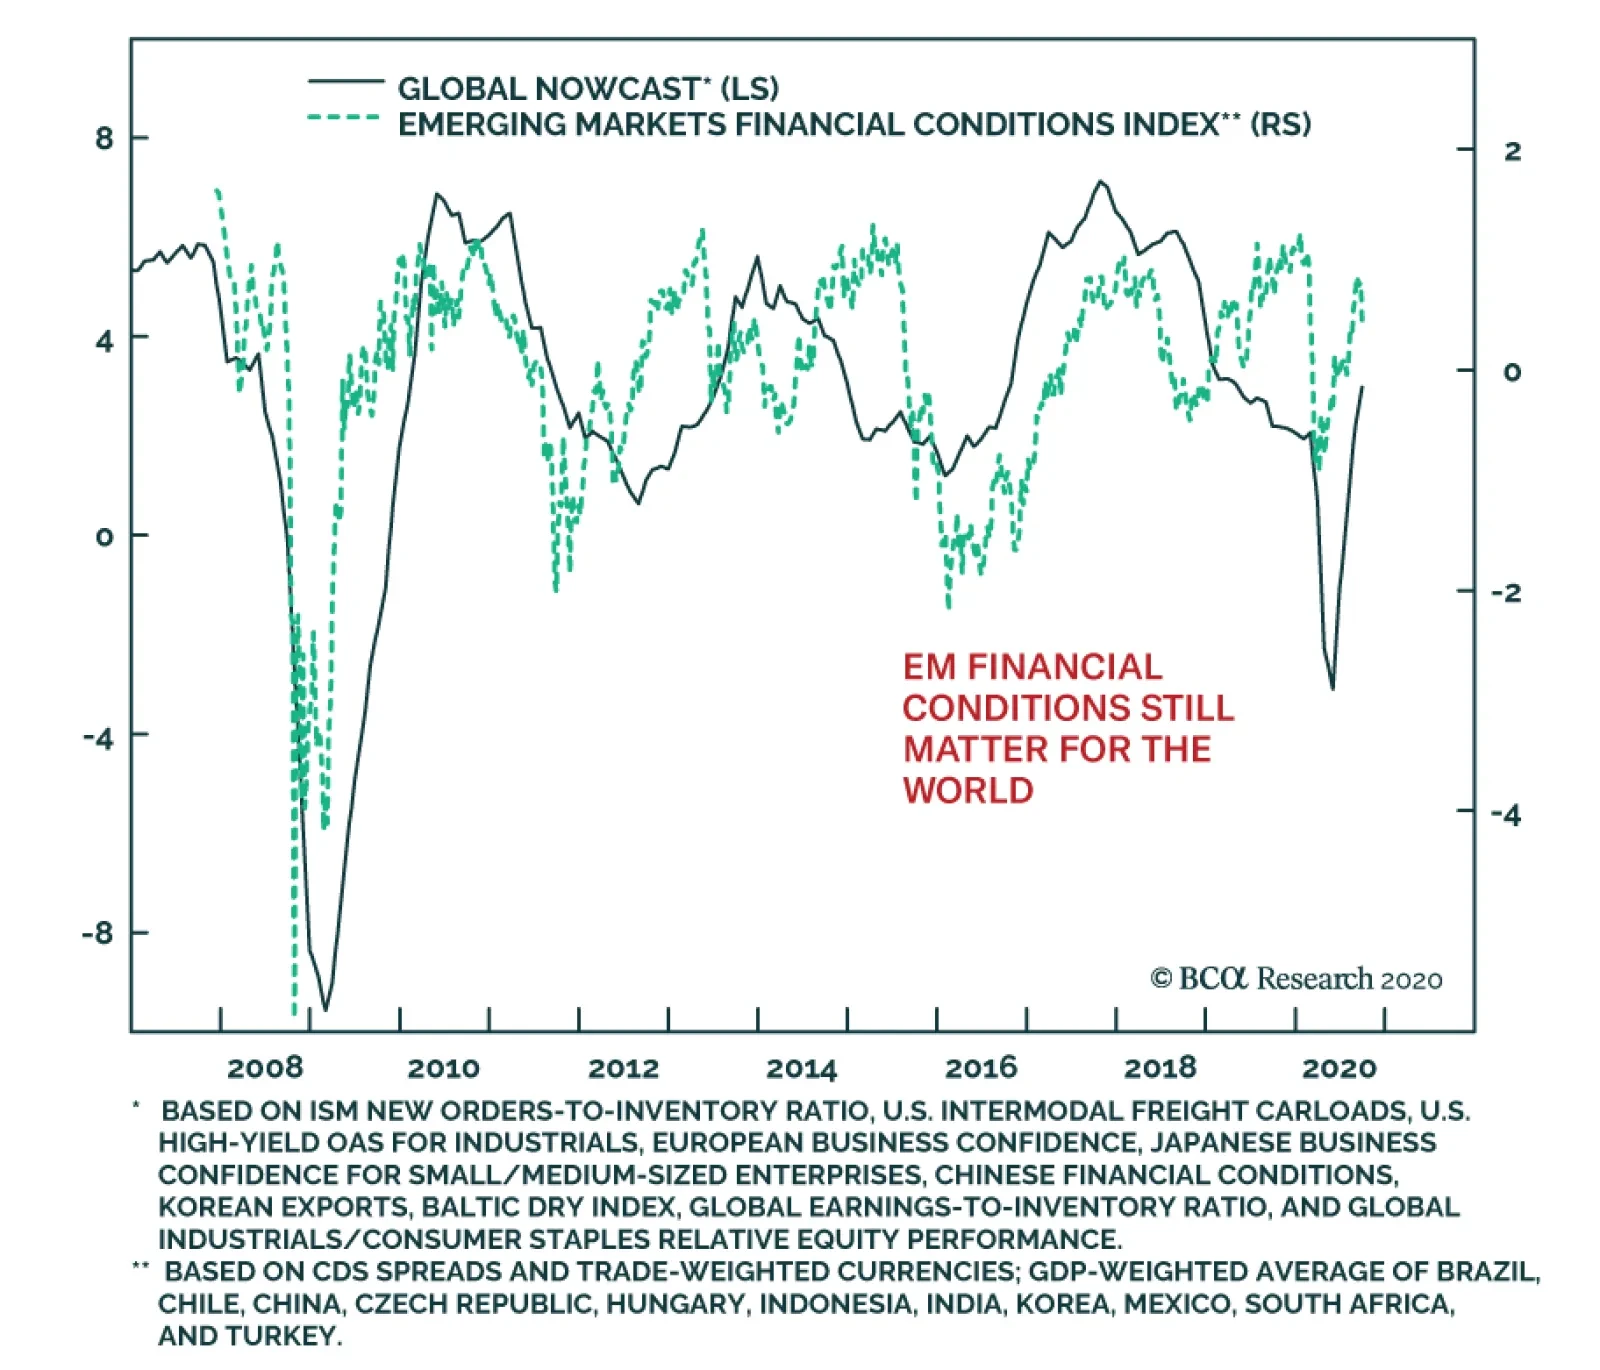
After easing for the last six months, EM financial conditions are deteriorating in response to the widening of spreads and the weakening of currencies highlighted in the Country Focus. While this deterioration in financial conditions is a reflection of the…

Highlights Near-Term Uncertainties: Investors have grown a bit more nervous in recent weeks, amid signs of a second wave of the coronavirus in Europe and with the contentious US presidential election only five weeks away. The pro-growth cyclical investment backdrop, however, remains unchanged. From a strategic perspective (6-12 months), maintain an overall neutral stance on interest rate duration, with a moderate overweight to global spread product versus government bonds while staying up in quality. EM USD-Denominated Debt: The main drivers of the emerging market hard currency debt rally since March – a weakening US dollar, improving global growth momentum, and massively accommodative global monetary policies – remain in place. Valuations, however, appear more attractive for EM USD-denominated corporates relative to USD-denominated sovereigns. Favor the former over the latter, within an overall neutral strategic allocation to EM hard currency debt. Feature Chart of the WeekMarkets Starting To Get Cautious
Markets Starting To Get Cautious
Markets Starting To Get Cautious
As the third quarter of 2020 draws to a close, investors have developed a slight case of the jitters about the near-term outlook for global financial markets. The positives that drove risk assets higher during the spring and summer - rebounding global economic activity, fueled by aggressive policy stimulus and a slowing of the spread of COVID-19, along with a weaker US dollar – have given way to some fresh uncertainties. Economic data releases have started to disappoint versus expectations, the rapid expansion of central bank balance sheets in the major developed economies has temporarily stalled, a second wave of new COVID-19 cases appears to have started in Europe and the US, and the US dollar has strengthened by 2.7% from the 2020 lows (Chart of the Week). Risk assets have pulled back in response, with the MSCI World equity index down -6.1% from the 2020 peak and US high-yield corporate credit spreads 66bps wider from recent lows. So far, these moves appear more a correction of overbought markets, rather than a change in trend. From the perspective of our strategic (6-12 months) investment recommendations, we remain generally positive on risk assets. Within global fixed income, that means maintaining a modest overall overweight stance on spread products versus government bonds, while focusing more on relative opportunities between countries and sectors to generate alpha. A Quick Assessment Of The Cyclical Backdrop The recent in increase in market volatility has started to shake out crowded positioning in popular winning trades. For example, high-flying US tech stocks have seen deeper pullbacks than the overall US equity market, while investors yanked nearly $5 billion from US junk bond funds in the week ending last Wednesday according to the Financial Times – the highest such outflow since the apex of the COVID-19 market rout in mid-March. We prefer to judge the health of a market rally by assessing the state of macroeconomic fundamentals underpinning that particular asset class Mainstream financial pundits often dub such corrections of overheated markets as a “healthy” way to ensure the continuation of medium-term bullish trends. We prefer to judge the health of a market rally by assessing the state of macroeconomic fundamentals underpinning that particular asset class – the most important of which remain positive for risk assets, in general, and global fixed income spread products, in particular. Economic Data Chart 2Economic Data Is Mostly Optimistic
Economic Data Is Mostly Optimistic
Economic Data Is Mostly Optimistic
While data surprise indices like the widely followed Citigroup series are topping out, this is more because of an improvement in beaten-up growth expectations, rather than a sharp decline in the actual data. The global ZEW economic expectations survey continues to point in an optimistic direction, while other reliable measures of business confidence like the German IFO and the US NFIB small business surveys have also continued to improve in recent months. Our own global leading economic indicator (LEI) is firming, with a majority of countries seeing a rising LEI (Chart 2). At the same time, the preliminary release of manufacturing PMI data for September showed continued improvements in the US and Europe. While the news is not 100% upbeat – the services PMI for the overall euro area fell -2.9 points in September, possibly due to the increase in new reported cases of COVID-19 in Europe – the tone of global economic data remains consistent with improving cyclical momentum. The US Dollar Chart 3Growth And Yield Differentials Signalling Dollar Weakness
Growth And Yield Differentials Signalling Dollar Weakness
Growth And Yield Differentials Signalling Dollar Weakness
The most likely medium-term path of least resistance for the US dollar remains downward. Economic growth remains stronger outside the US, based on the differential between the US and non-US manufacturing PMI data – an indicator that our currency strategists follow closely given its strong correlation to US dollar momentum (Chart 3). Relative interest rate differentials also remain less positive for the US dollar, with the decline in real US bond yields seen in 2020 pointing to additional medium-term dollar depreciation (bottom panel). US Politics The US general election is now only 35 days away, with the latest polling data showing President Trump closing the lead on the Democratic Party candidate, Joe Biden. Our colleagues at BCA Research Geopolitical Strategy remain of the view that a Biden victory is the more probable outcome, given the more difficult time Trump will have in winning all the key swing states that gave him his narrow election victory in 2016. Chart 4A "Blue Sweep" Is Bearish For Markets
A "Blue Sweep" Is Bearish For Markets
A "Blue Sweep" Is Bearish For Markets
The recent peak in US equity markets, and trough in the VIX index, coincided with improving odds of a Democratic Party sweep of the White House, House of Representatives and Senate (Chart 4). Such an outcome would give a President Biden the power, and perceived mandate, to implement many of the more progressive elements of the Democratic Party agenda – including a hike in corporate tax rates that could damage equity market sentiment. Our political strategists think that a “Blue Sweep” would only occur if the Republican Party fails to agree with the Democrats on a new fiscal stimulus bill.1 Both sides are playing hardball in the current negotiations, which is keeping investors on edge given how much of the US economy still requires fiscal support because of the pandemic. The Republicans will not want to take the blame for a failure to reach a stimulus deal, which would likely hand the Democrats the keys to the White House and Congress. Thus, a fiscal deal of sufficient size to calm jittery markets – most likely in the $2-2.5 trillion range sought by the Democrats – should be announced within the next couple of weeks before the final run up to the election. Financial/Monetary Conditions It will take more than a corrective pullback in equity and credit markets to threaten the economic recovery from the COVID-19 recession, given how highly stimulative financial conditions have become since the spring (Chart 5). In more normal times, booming equity and credit markets would eventually lead to upward pressure on government bond yields, since all would be reflecting improving economic growth and, eventually, expectations of faster inflation and tighter monetary policy. That move higher in yields would eventually act to restrain growth and depress the value of growth-sensitive risk assets. Chart 5Financial Conditions Remain Supportive For Growth
Financial Conditions Remain Supportive For Growth
Financial Conditions Remain Supportive For Growth
As we discussed in last week’s report, government bond yields are now likely to stay very low for a period measured in years, with major central banks like the US Federal Reserve leaning dovishly to support growth during the pandemic and trigger a temporary overshoot of inflation expectations.2 Thus, loose monetary settings (including more quantitative easing) will remain a critical underpinning for keeping risk assets well supported, by eliminating the typical cyclical threat from rising bond yields. Summing it all up, the fundamental economic and political backdrop remains cyclically bullish for risk assets, despite recent investor nervousness. Of course, a major wild card could be that the latest surge in new COVID-19 cases becomes large enough to trigger renewed economic restrictions in the US or Europe. Yet any such moves would likely not be as severe as those that occurred back in the spring, given the much lower mortality rates seen during the current upturn in COVID-19 cases, which is reducing the public’s willingness to accept more economy-crushing lockdowns. Bottom Line: Investors have grown a bit more nervous in recent weeks, amid signs of a second wave of the coronavirus in Europe and with the contentious US presidential election only five weeks away. The pro-growth cyclical investment backdrop, however, remains unchanged. From a strategic perspective (6-12 months), maintain an overall neutral stance on interest rate duration, with a moderate overweight to global spread product versus government bonds while staying up in quality. EM USD-Denominated Credit: Focus On Corporates Relative To Sovereigns Chart 6An Overview of USD-Denominated EM Debt
An Overview of USD-Denominated EM Debt
An Overview of USD-Denominated EM Debt
Back in July of this year, we turned more positive on emerging market (EM) USD-denominated spread product, upgrading our recommended allocation to both EM USD sovereign and corporate debt to neutral from underweight in our model bond portfolio.3 The change was motivated by signs of rebounding global economic growth after the COVID-19 lockdowns and a loss of upward momentum in the US dollar, coming at a time when EM spreads still looked relatively cheap (wide) compared to developed market corporate debt. An underweight stance was inconsistent with that backdrop. EM credit has done well since our upgrade (Chart 6). Using Bloomberg Barclays index data, the yield on the EM USD-denominated sovereign index has fallen from 5.2% to 4.4%, while the option-adjusted spread (OAS) on that same index tightened from 447bps to 368bps. It has been a similar story for EM USD-denominated corporates, with the index yield falling from 4.1% to 3.9% and the index OAS narrowing from 361bps to 344bps.4 Given the close correlations typically exhibited between EM USD sovereign and corporate yields and spreads, we have tended to change our recommended allocations to both asset classes at the same time and in the same direction. Yet the EM credit universe is quite diverse, incorporating many different issuers of highly varying credit quality and risk (Table 1). Treating the allocations to EM USD sovereign debt and USD corporate debt separately may reveal more profitable relative return opportunities. The fundamental economic and political backdrop remains cyclically bullish for risk assets, despite recent investor nervousness. Table 1Details Of The USD-Denominated EM Sovereign And EM Corporate & Quasi-Sovereign Indices
Stay The Course
Stay The Course
A first step to analyzing the EM USD sovereigns versus corporates investment decision is to develop a list of macro factors that correlate to the relative performance of EM sovereign and corporate credit. From there, we can build a list of directional indicators that can help inform that sovereign versus corporates decision. Treating the allocations to EM USD sovereign debt and USD corporate debt separately may reveal more profitable relative return opportunities. Our colleagues at BCA Research Emerging Markets Strategy have long held the view that overall EM debt performance is mostly driven by just two important macro factors: industrial commodity prices and the US dollar. Specifically, they have shown that the broad cyclical swings in EM sovereign and corporate spreads correlate strongly to the price momentum of a simple blend of industrial metal and oil prices, as well as the price momentum of a basket of EM currencies versus the US dollar (Chart 7). Chart 7EM Credit Spreads: A Commodity And Currency Story
EM Credit Spreads: A Commodity And Currency Story
EM Credit Spreads: A Commodity And Currency Story
On that basis, the recent moderate widening of EM credit spreads is justified by the corrective pullback in industrial commodity prices and a bit of US dollar strength – trends that our EM strategists believe can continue in the near-term. Although they share our view that the medium-term trend in the US dollar is still bearish, thus any near-term EM debt selloff will represent a longer-term buying opportunity.5 The demand for industrial commodities remains largely driven by economic trends in the world’s largest commodity consumer, China. Thus, our China credit impulse (the change in overall Chinese credit relative to GDP), which leads Chinese economic activity, is a good leading indicator of industrial commodity prices. We will use the China credit impulse in our list of directional indicators to forecast EM sovereign versus corporate performance. We also will include the annual rate of change of the index of EM currencies versus the US dollar (shown in Chart 7). We also believe that a global monetary policy variable should be included in our indicator list, particularly in the current environment of super-low developed market interest rates and central bank purchase of government bonds – both of which tend to drive yield-starved investors into higher-yielding EM assets and, potentially, can influence the relative performance of EM sovereigns and corporates. To capture the global monetary policy trend in our indicator list, we use the combined annual growth rate of the balance sheets of the Fed, the ECB, the Bank of Japan and the Bank of England. The message from our indicator list is that EM USD corporates should outperform EM USD sovereign debt over the next 6-12 months. In Charts 8 & 9, we show the relative total return of the Bloomberg Barclays EM USD corporate and USD sovereign indices, expressed in year-over-year percentage terms, versus our list of three potential directional indicators of the relative total return. We have broken up the overall EM universe by broad credit quality, with index data used for investment grade issuers in Chart 8 and below investment grade (high-yield) issuers in Chart 9. For all three of our directional indicators, we have pushed them forward in the charts to look for a potential leading relationship to the relative returns. Chart 8EM Investment Grade Corporates Looking Set to Outperform ...
EM Investment Grade Corporates Looking Set to Outperform ...
EM Investment Grade Corporates Looking Set to Outperform ...
Chart 9... But The High Yield Space Tells A More Mixed Story
... But The High Yield Space Tells A More Mixed Story
... But The High Yield Space Tells A More Mixed Story
The charts show that China credit impulse leads the relative total returns of EM USD corporates versus EM USD sovereigns by between 9-18 months for investment grade and high-yield EM credit. The growth of the major central bank balance sheets also leads the relative performance of EM USD corporates versus EM USD sovereigns by one full year, both for investment grade and high-yield EM credit. Finally, the annual growth of EM currencies leads the relative return of EM USD corporates versus sovereigns by around nine months, although the correlation is the weakest of the three indicators in our list. In terms of current investment strategy, the message from our indicator list is that EM USD corporates should outperform EM USD sovereign debt over the next 6-12 months, both for investment grade and high-yield, largely due to aggressive credit stimulus in China and the rapid expansion of central bank balance sheets. In terms of the attractiveness of EM USD-denominated yields in a global fixed income portfolio, however, there is a difference between higher-rated and lower-rated EM debt. In Chart 10, we present a scatter chart that plots the yields on various global fixed income sectors, all hedged into US dollars and compared to trailing yield volatility, versus the average credit rating of each sector. Investment grade EM USD corporate and sovereign issuers offer relatively more attractive yields compared to other sectors with similar credit ratings, like investment grade corporates in the US and Europe. The same cannot be said for high-yield EM USD corporates and sovereigns, which only offer a more attractive volatility-adjusted yield compared to euro area high-yield corporates among the lower-rated global credit sectors. Chart 10EM USD-Denominated High Yield Debt Not Especially Attractive On A Risk-Adjusted Basis
Stay The Course
Stay The Course
Based on this analysis, we are making the following changes in our model bond portfolio on page 14: Upgrading EM USD corporates to overweight Downgrading EM USD sovereigns to underweight Keeping the combined EM USD credit allocation at neutral. This fits with our current overall investment theme of keeping overall spread product exposure relative close to benchmark, while taking more active risks on relative allocations between fixed income sectors. Bottom Line: The main drivers of the emerging market hard currency debt rally since March – a weakening US dollar, improving global growth momentum, and massively accommodative global monetary policies – remain in place. Valuations, however, appear more attractive for EM USD-denominated corporates relative to USD-denominated sovereigns. Favor the former over the latter, within an overall neutral strategic allocation to EM hard currency debt. Robert Robis, CFA Chief Fixed Income Strategist rrobis@bcaresearch.com Footnotes 1 Please see BCA Research Geopolitical Strategy Weekly Report, "Stimulus Will Come … But May Not Save Trump", dated September 25, 2020, available at gps.bcaresearch.com. 2 Please see BCA Research Global Fixed Income Strategy Weekly Report, "What Would It Take To Get Bond Yields To Rise Again?", dated September 23, 2020, available at gfis.bcaresearch.com. 3 Please see BCA Global Fixed Income Strategy Weekly Report, "GFIS Model Bond Portfolio Q2/2020 Performance Review & Current Allocations: Selective Optimism", dated July 14, 2020, available at gfis.bcaraesearch.com. 4 Note that the index data we are using here includes both EM corporate and so-called “quasi-sovereign” debt, the latter being bonds issued by EM companies that are majority-owned by their local governments. 5 Please see BCA Emerging Markets Strategy Weekly Report, "A Reset In The Making", dated September 24, 2020, available at ems.bcaresearch.com. Recommendations The GFIS Recommended Portfolio Vs. The Custom Benchmark Index
Stay The Course
Stay The Course
Duration Regional Allocation Spread Product Tactical Trades Yields & Returns Global Bond Yields Historical Returns
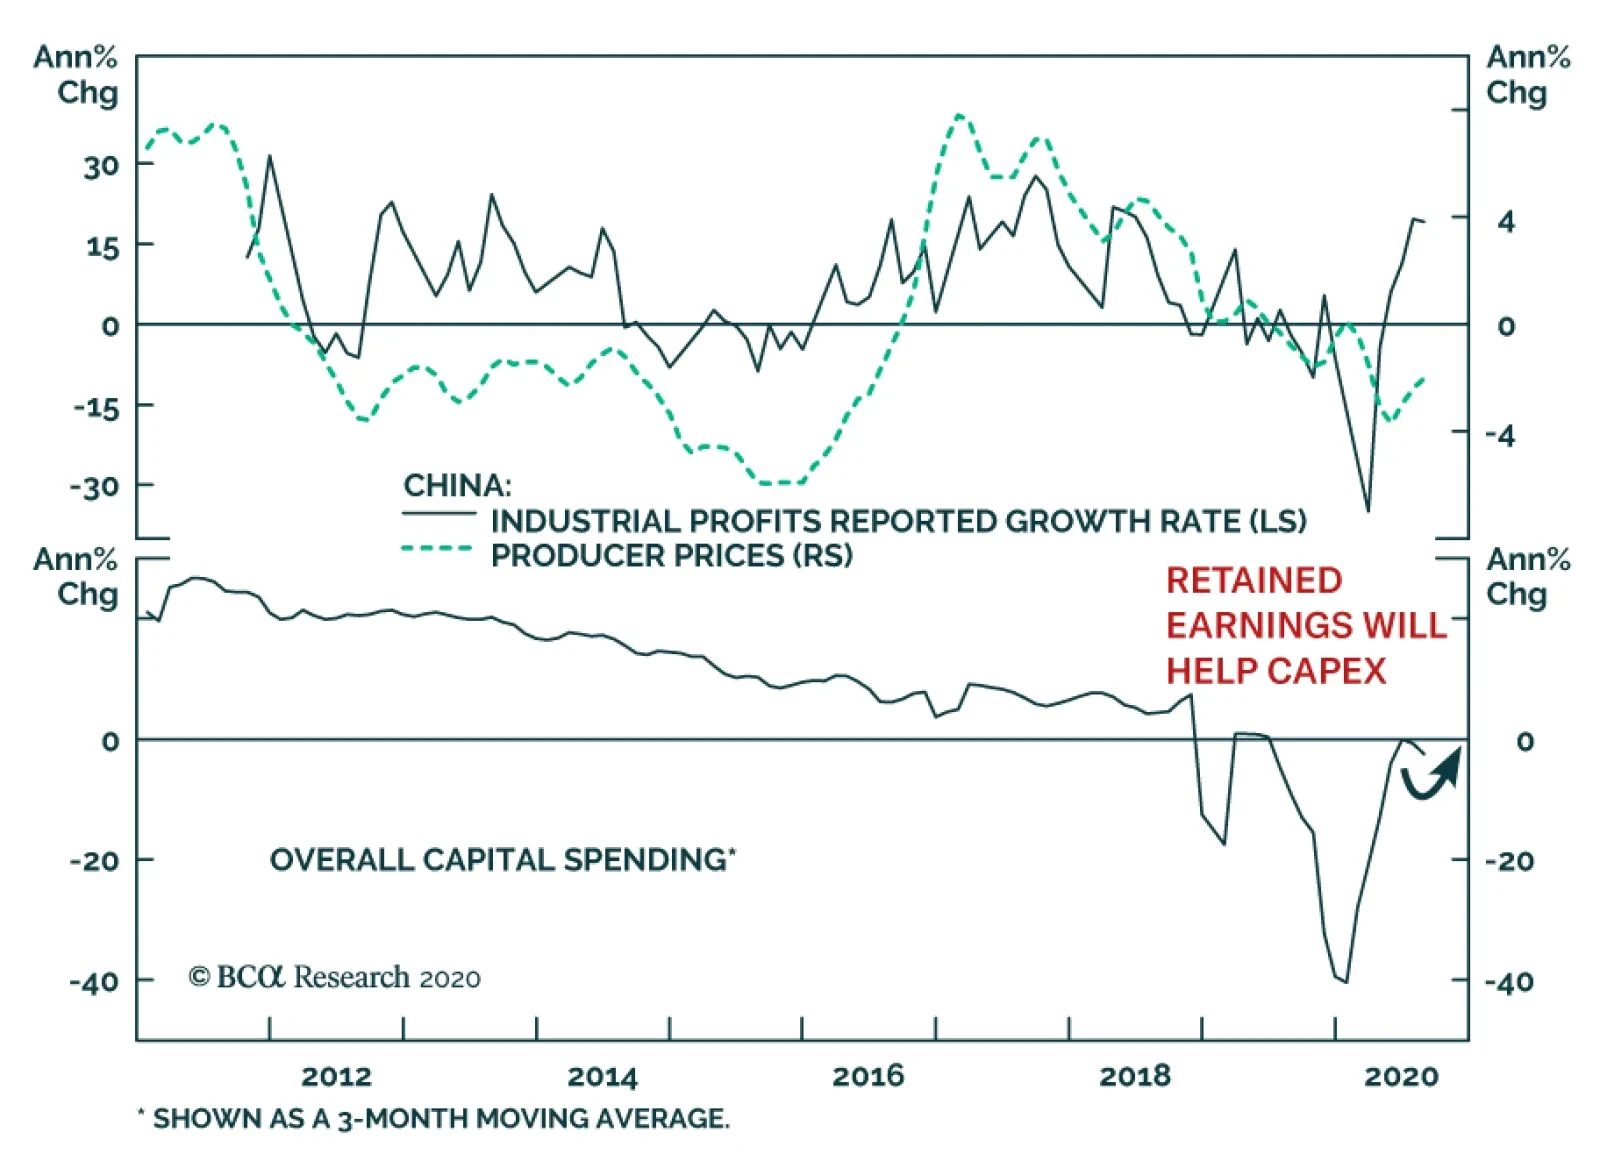
Chinese industrial profits hit the press last weekend. In August, they grew 19.1% annually, which represented the fourth straight month of profit growth. The continued industrial production rebound, the stabilization of PPI inflation, and the strengthening of…
Highlights Portfolio Strategy We recommend investors participate in the equity market rotation during the ongoing correction and position portfolios for next year’s bull market resumption by preferring unloved and undervalued deep cyclical laggards. Ultra-loose Chinese fiscal policy, rising global demand and firming domestic operating conditions, all signal that the S&P machinery recovery has legs. Vibrant emerging markets and a recuperating China, a softening US dollar rekindling the commodity complex, the nascent recovery in domestic conditions and washed out technicals, all suggest that a significant re-rating looms for severely neglected industrials equities. Recent Changes Our trailing stop got triggered and we downgraded the S&P internet retail index to neutral for a gain of 20% since the mid-April inception. This move also pushed our S&P consumer discretionary sector weighting to a benchmark allocation for a gain of 15% since inception. Table 1
Riot Point Looms
Riot Point Looms
Feature The S&P 500 broke below the important 50-day moving average last week, but managed to bounce off the early-June 3233 level – also a level where the SPX started the year – that could serve as temporary support (Chart 1). We first highlighted that investors were turning a blind eye to (geo)political risks on June 8, and failure to pass a new fiscal package before the election will continue to weigh on the economy and on stocks risking a further 10% drawdown near the SPX 3000 level. Chart 1Critical Support Levels
Riot Point Looms
Riot Point Looms
The Fed is now “out of the loop” i.e. a bystander on the sidelines, gently moving the foot off the accelerator as we illustrated last week. The FOMC’s, at the margin, less dovish monetary policy setting exerts enormous pressure on fiscal authorities to act as fiscal policy takes center stage. Our sense is that we have entered a Fiscal Policy Loop (FPL) where stalemate in Congress will cause a classic BCA riot point that in turn will force politicians’ hand to act in order to avoid a meltdown, and set in motion the next stage of the FPL (Figure 1). Keep in mind that the 2020s have ignited a paradigm shift from the Washington Consensus to the Buenos Aires Consensus1 and this is episode one of the FPL, more are sure to follow. Figure 1The Fiscal Policy Loop
Riot Point Looms
Riot Point Looms
It is no surprise that the Citi economic surprise index took off when the IRS started making direct payments to households in mid-April and leveled off toward the end of July when the stimulus money coffers ran dry (Chart 2). Chart 2In Dire Need Of Fiscal Stimulus
In Dire Need Of Fiscal Stimulus
In Dire Need Of Fiscal Stimulus
If Congress fails to pass a new fiscal package by October 16, the latest now that the Ruth Bader Ginsburg SCOTUS replacement seems to have become the number one priority, we doubt a fiscal package can pass during a contested election. Thus, realistically a fresh stimulus bill is likely only after the new president’s inauguration. Under such a backdrop, the economy will suffer a relapse despite households drawing down their replenished savings (middle panel, Chart 3). This is eerily reminiscent of the October 2008 and October 2018 fiscal policy and monetary policy mistakes, respectively, that resulted in a market riot. Similar to today, markets were down 10% and on a precipice and the policy errors pushed them off the cliff leading to another 10% gap down in a heartbeat. With regard to equity market specifics during the current FPL iteration, banks are most at risk as they are levered to the economic recovery, and commercial real estate ails remain a big headache. Absent a fiscal package bank executives will have to further provision for loan losses when they kick off Q3 earnings season in late-October as CEOs will err on the side of caution. Tack on the recent news on laundering money – including by US banks – and the Fed’s new stringent stress tests, and the risk/reward tradeoff remains poor for the banking sector (bottom panel, Chart 3). Odds are high that volatility will remain elevated heading into the election, therefore this phase represents an opportunity for investors to reshuffle portfolios and prepare for an eventual resumption of the bull market in early-2021. We continue to recommend investors avoid our “COVID-19 winners” basket and prefer our “back-to work” equity basket that we initiated on September 8. Similarly, this pullback is serving as a catalyst to shift some capital out of the fully valued tech titans and into other beaten down parts of the deep cyclical universe. Chart 3Show Me The Money
Show Me The Money
Show Me The Money
We doubt this correction is over as positioning in the NASDAQ 100 derivative markets is still lopsided; stale bulls are caught net long as NQ futures are deflating, thus a flush out looms (Chart 4). Chart 4Flush Out
Flush Out
Flush Out
The easy money has likely been made in the tech titans that near the peak on September 2, AAPL, MSFT and AMZN each commanded an almost $2tn market capitalization. Thus, booking some of these tech gains and redeploying capital in other unloved deep cyclical sectors would go a long way, especially if our thesis that the economic recovery will gain steam into 2021 pans out. Using a concrete rebalancing example to illustrate such a rotation is instructive.2 The tech titans’ (top 5 stocks) market cap weight in the SPX is 22%. Were an investor to take 10% of this weight or 220bps and redeploy it to the materials sector, which commands a 2.7% market cap weight in the SPX, would effectively double the exposure on this deep cyclical sector. The same would apply to the energy sector that comprises a mere 2.2% of the SPX, while industrials with an 8.4% market cap weight would get a sizable 26% lift (Chart 5). As a reminder our portfolio has an above benchmark allocation in all three deep cyclical sectors, and this week we reiterate our overweight stance on both the industrials sector and on a key subgroup. Chart 5Rotation Rotation Rotation
Rotation Rotation Rotation
Rotation Rotation Rotation
Buy The Machinery Breakout Were we not already overweight the S&P machinery index, would we upgrade today? The short answer is yes. Aggressive loosening in Chinese financial conditions have underpinned the economic recovery (second & third panels, Chart 6). Infrastructure projects are making a comeback and absorbing the slack in machinery demand caused by COVID-19. As a result, Chinese excavator sales have soared in the past quarter which bodes well for US machinery profit prospects (bottom panel, Chart 6). Beyond China, emerging markets demand for machinery equipment is robust as the commodity complex is recovering smartly (second panel Chart 7). The US dollar bear market is also bolstering global trade growth, despite the greenback’s recent technical bounce, and should continue to underpin machinery net export growth and therefore profit growth for US machinery manufacturers (third & bottom panels, Chart 7). Chart 6Enticing Chinese Backdrop
Enticing Chinese Backdrop
Enticing Chinese Backdrop
Chart 7Dollar The Great Reflator
Dollar The Great Reflator
Dollar The Great Reflator
The domestic machinery demand backdrop is also conducive to a renormalization of top line growth to a higher run-rate. The ISM manufacturing new orders sub-component is shooting the lights out, heralding a jump in machinery orders in the coming months (second panel, Chart 8). Simultaneously, a quick inventory check is revealing: both in the manufacturing and wholesale channels cupboards are bare which means that the risk of a liquidation phase in non-existent (third panel, Chart 8). Encouragingly, an inventory buildup phase is looming in order to satisfy firming demand. The tick up in machinery industrial production growth, the V-shaped recovery in the utilization rate and newly expanding backlog orders, all suggest that domestic demand conditions are on the mend (Chart 9). Tack on still prudent payrolls management that is keeping the machinery industry’s wage bill at bay (bottom panel, Chart 8), and a profit margin expansion phase is a high probability outcome. Chart 8What’s Not…
What’s Not…
What’s Not…
Chart 9…To Like
…To Like
…To Like
Our resurgent S&P machinery revenue growth model and climbing profit growth model do an excellent job in encapsulating all the industry’s moving parts and suggest that the path of least resistance is higher for relative share prices in the New Year (Chart 10). Finally, relative valuations have also recovered from the depth of the recession, but are only back to the neutral zone leaving enough room for a multiple expansion phase (Chart 11). Chart 10Models Say Buy
Models Say Buy
Models Say Buy
Chart 11Compelling Entry Point
Compelling Entry Point
Compelling Entry Point
In sum, ultra-loose Chinese fiscal policy, rising global demand and firming domestic operating conditions, all signal that the S&P machinery recovery has legs. Bottom Line: Stay overweight the S&P machinery index. The ticker symbols for the stocks in this index are: BLBG S5MACH– CAT, DE, PH, ITW, IR, CMI, PCAR, FTV, OTIS, SWK, DOV, XYL, WAB, IEX, SNA, PNR, FLS. Industrials Are Jumpstarting Their Engines We have been offside on the S&P industrials sector, but now is not the time to throw in the towel. In contrast we are doubling down on our overweight stance as the ongoing rotation should see some tech sector outflows find their way to under-owned capital goods producers. Industrials equities have been on the selling block and suffered a wholesale liquidation during the dark days of the COVID-19 pandemic, and have yet to regain their footing (top panel, Chart 12). The GE and Boeing sagas have dealt a big blow to this deep cyclical sector, but now this market cap weighted sector has filtered these stocks out as neither of these “fallen angels” is occupying a spot in the top 5 weight ranks. Relative valuations are washed out, and relative technicals are still deep in oversold territory (second & third panels Chart 12). Sell-side analysts are the most pessimistic they have been on record with regard to the long-term EPS growth rate that is penciled in to trail the broad market by almost 800bps (bottom panel, Chart 12)! All this bearishness is contrarily positive as a little bit of good news can go a long way. Already, relative EPS breadth is stealthily coming back, and net earnings revisions are rocketing higher (Chart 13). Chart 12Liquidation Phase…
Liquidation Phase…
Liquidation Phase…
Chart 13…Is Over
…Is Over
…Is Over
One reason behind this optimism rests with the domestic recovery. Capex intentions are firming and CEO confidence is upbeat for the coming six months. The ISM manufacturing new orders-to-inventories ratio is corroborating the budding recovery in the soft data. Green shoots are also evident in hard data releases. Durable goods orders are on the verge of expanding anew (Chart 14). Emerging markets (EM) and China represent another source of industrials sector buoyancy. The EM manufacturing PMI clocking in at 52.5 hit an all-time high. China’s PMIs are also on a similar trajectory, and the Chinese Citi economic surprise index has swung a whopping 300 points from -240 to above +60 over the past six months. The upshot is that US industrials stocks should outperform when China and the EM are vibrant (Chart 15). Chart 14Domestic And …
Domestic And …
Domestic And …
Chart 15… EM Green Shoots Are Bullish
… EM Green Shoots Are Bullish
… EM Green Shoots Are Bullish
Peering over to the currency market, the debasing of the US dollar should also underpin industrials stocks via the export relief valve (third panel, Chart 16). A depreciating greenback also lifts the commodity complex and hence industrials equities that are levered to the extraction of commodities and other derivative activities (top panel, Chart 16). Historically, an appreciating USD has been synonymous with a multiple contraction phase and vice versa. Looking ahead, the industrials sector relative 12-month forward P/E multiple should continue to expand smartly (bottom panel, Chart 16). The US Equity Strategy’s macro based EPS growth model captures all the different earnings drivers and signals that an earnings-led recovery is in the offing (Chart 17). Chart 16The Greenback Holds The Key
The Greenback Holds The Key
The Greenback Holds The Key
Chart 17Models Flashing Green
Models Flashing Green
Models Flashing Green
Adding it all up, vibrant emerging markets and a recuperating China, a softening US dollar rekindling the commodity complex, the nascent recovery in domestic conditions and washed out technicals, all suggest that a significant re-rating looms for severely neglected industrials equities. Bottom Line: We continue to recommend an above benchmark allocation in the S&P industrials sector. Anastasios Avgeriou US Equity Strategist anastasios@bcaresearch.com Footnotes 1 The Washington Consensus – a catchall term for fiscal prudence, laissez-faire economics, free trade, and unfettered capital flows – is being replaced by economic populism, by a Buenos Aires Consensus. Buenos Aires Consensus is our catchall term for everything that is opposite of the Washington Consensus: less globalization, fiscal stimulus as far as the eyes can see, erosion of central bank independence, and a dirigiste (as opposed to laissez-faire) approach to economics that seeks to protect “state champions,” stifles innovation, and ultimately curbs productivity growth. 2 Our example assumes benchmark allocation in all sectors for illustrative purposes. Current Recommendations Current Trades Strategic (10-Year) Trade Recommendations
Drilling Deeper Into Earnings
Drilling Deeper Into Earnings
Size And Style Views July 27, 2020 Overweight cyclicals over defensives April 28, 2020 Stay neutral large over small caps June 11, 2018 Long the BCA Millennial basket The ticker symbols are: (AAPL, AMZN, UBER, HD, LEN, MSFT, NFLX, SPOT, TSLA, V). January 22, 2018 Favor value over growth
Highlights Senate Republicans would be suicidal not to agree to a fiscal relief bill before the election. Democrats are still offering a $2.2 trillion package. Grassroots Republican voters will forgive Republicans for blowing out the budget deficit but they will never forgive them for throwing away control of the White House and Senate. Nevertheless financial markets face more downside until a deal is reached. We are booking gains on several of our tactical risk-off trades but will hold our strategic risk-on trades, as we are still constructive over a 12-month period. Turkey is stepping back from its foreign adventurism in the face of constraints. Our GeoRisk Indicator for Turkey has rolled over. Feature Financial markets continue to sell off in the face of a range of risks, including new threats of COVID-19 restrictions in Europe, an increase in daily new cases of the disease in the United States (Chart 1), and the US Congress’s problems passing a new round of fiscal relief. Chart 1Increase In COVID-19 Cases Among Factors Weighing On Markets
Stimulus Will Come … But May Not Save Trump (GeoRisk Update)
Stimulus Will Come … But May Not Save Trump (GeoRisk Update)
Chart 2Congress Will Pass Stimulus ~$2-$2.5 Trillion
Stimulus Will Come … But May Not Save Trump (GeoRisk Update)
Stimulus Will Come … But May Not Save Trump (GeoRisk Update)
Since May, when the Democrats passed the $3.4 trillion HEROES Act, we have maintained that “stimulus hiccups” would roil the market. However, we also argued that Congress would eventually pass a new package – probably in the range of $2-$2.5 trillion (Chart 2).1 The latter part of this view remains to be seen and has come under pressure from investors who fear that Congress could fail to produce a bill entirely. We are sticking with our guns. GOP senators will recognize that they face sweeping election losses; House Democrats will not be able to reverse course and deprive households of badly needed assistance. However, stock investors might sell more between now and the final deal, which must be done by around October 9 so that lawmakers can go back to their home states to campaign for the November 3 election. Moreover the fiscal deal might not come in time to save the Republicans’ re-election bid in the White House and Senate, which raises further downside risk due to the Democratic agenda of re-regulation and tax hikes. And the election’s aftershocks could also be market-negative. For example, President Trump could also escalate the conflict with China, whether as the “comeback kid” or as a lame duck. Therefore this week we are booking some gains. We will not recommend a tactical risk-on position until our fiscal view is confirmed and we can reassess. US Fiscal Stimulus Is Coming Chart 3Republicans Highly Unlikely To Win House Of Representatives
Stimulus Will Come … But May Not Save Trump (GeoRisk Update)
Stimulus Will Come … But May Not Save Trump (GeoRisk Update)
Why would Democrats agree to a stimulus bill given that it could help President Trump and the Republicans get re-elected? Democrats are afraid to deprive households of relief amid a crisis merely to spite the president and score election points. Around 28-43 of Democrats in the House of Representatives face re-election in districts that are competitive or could become competitive. Republicans need a net gain of 20 seats to retake the House (Chart 3). If Democrats offer to cooperate yet Republican senators balk, then the latter will take the blame for any failed deal and ensuing financial turmoil. The experience of other fiscal cliffs bears this out. The debt ceiling crises of 2011 and 2013 and the government shutdowns of 2013 and 2018-19 all suggest that net presidential and congressional approval ratings suffer when partisanship prevents compromise on major fiscal issues (Charts 4A and 4B). This is a risk for the ruling GOP. All Democrats have to do is remain open to compromise. Net presidential and congressional approval ratings suffer when partisanship prevents compromise on major fiscal issues – a risk for the ruling GOP. Chart 4AFiscal Failures Pose A Risk To Ruling GOP
Stimulus Will Come … But May Not Save Trump (GeoRisk Update)
Stimulus Will Come … But May Not Save Trump (GeoRisk Update)
Chart 4BFiscal Failures Pose A Risk To Ruling GOP
Stimulus Will Come … But May Not Save Trump (GeoRisk Update)
Stimulus Will Come … But May Not Save Trump (GeoRisk Update)
Confirming this reasoning, Democrats joined with Republicans this week to pass a continuing resolution to maintain government spending levels through December 11, thus avoiding a government shutdown. Clearly the two parties can still cooperate despite record levels of partisanship. House Speaker Nancy Pelosi ruled out using government shutdown as a weapon to hurt the Republicans, fearing it would backfire. And just last week vulnerable House members pressured Pelosi into stating that the House will remain in session in October until a fiscal relief bill is passed. Democrats remain committed to their current plan – solidifying their grip on the House and demonstrating that they can govern, and that government can do more for households, by passing bills. This is still the strategy even if the risk is that these bills give Trump a marginal benefit. The Democratic demand is for a very large fiscal package – House Speaker Nancy Pelosi is today offering $2.2 trillion, a compromise from the initial $3.4 trillion bill (Table 1). A smaller bill is harder to negotiate because it would cut the House Democrats’ spending priorities for their constituents, including around $1 trillion in state and local government aid, while still giving Trump a bounce in opinion polls for boosting pandemic relief. This is unacceptable – and this is how a policy mistake could happen. Table 1What A Fiscal Compromise Will Look Like
Stimulus Will Come … But May Not Save Trump (GeoRisk Update)
Stimulus Will Come … But May Not Save Trump (GeoRisk Update)
Chart 5Senate Republicans Face A Hotly Contested Election
Stimulus Will Come … But May Not Save Trump (GeoRisk Update)
Stimulus Will Come … But May Not Save Trump (GeoRisk Update)
Chart 6Republican Senators' Hung Up On Future Deficit Concerns
Republican Senators' Hung Up On Future Deficit Concerns
Republican Senators' Hung Up On Future Deficit Concerns
Senate Republicans face a hotly contested election – with 23 of them up for re-election versus only 12 Democrats. However, 30 of them are not up for re-election this year (Chart 5). These senators fear the eventual return of deficit concerns among the Republican base so they are bargaining to limit emergency spending (Chart 6). Until they can be cajoled by their fellow senators and the White House, they pose a risk to the passage of new stimulus. But this risk is overrated. Ultimately Senate Majority Leader Mitch McConnell and the Senate Republicans will capitulate. It is political suicide if they do not. The GOP will lose control of the Senate and the White House if premature fiscal tightening sparks a bloody September-October selloff just ahead of the election (Charts 7Aand 7B). Chart 7AStocks Sell, Bonds Rally … When Congress Goes Off Fiscal Cliff
Stocks Sell, Bonds Rally... When Congress Goes Off Fiscal Cliff
Stocks Sell, Bonds Rally... When Congress Goes Off Fiscal Cliff
Chart 7BStocks Sell, Bonds Rally … When Congress Goes Off Fiscal Cliff
Stocks Sell, Bonds Rally... When Congress Goes Off Fiscal Cliff
Stocks Sell, Bonds Rally... When Congress Goes Off Fiscal Cliff
Chart 8Trump Compares Poorly To Other Presidents Re-Elected Amid Recession
Trump Compares Poorly To Other Presidents Re-Elected Amid Recession
Trump Compares Poorly To Other Presidents Re-Elected Amid Recession
Only three out of six presidents in modern times have been re-elected when a recession struck during the election year yet ended prior to the fall campaign. These were William McKinley in 1900, Teddy Roosevelt in 1904, and Calvin Coolidge in 1924.2 Trump faces the same scenario, but financial markets are signaling that Trump is not faring as well as these three predecessors (Chart 8). The Senate races are all on a knife’s edge (Chart 9). American politics are highly nationalized – partisan identification overrides regional concerns. President Trump has also personalized his political party, making the election a referendum on himself (Chart 10). These trends suggest the Senate will fall to the party that wins the White House. Chart 9The Senate Races Are All On A Knife’s Edge
Stimulus Will Come … But May Not Save Trump (GeoRisk Update)
Stimulus Will Come … But May Not Save Trump (GeoRisk Update)
Consumer confidence is weak and bodes ill for the incumbent president and party (Chart 11). Chart 10Trump Has Personalized Partisan Politics
Stimulus Will Come … But May Not Save Trump (GeoRisk Update)
Stimulus Will Come … But May Not Save Trump (GeoRisk Update)
Chart 11Consumer Confidence Bodes Ill For Trump And GOP
Consumer Confidence Bodes Ill For Trump And GOP
Consumer Confidence Bodes Ill For Trump And GOP
A failure to provide stimulus will ensure that sentiment worsens for the rest of the campaign and overshadows some underlying material improvements that are the Republicans’ only saving grace. Wage growth is recovering in line with the V-shape recovery in blue and purple states, including purple states that voted for Trump (Chart 12). The manufacturing rebound – and a surge in loans – is creating the conditions for the “Blue Wall” of Pennsylvania, Michigan, and Wisconsin to re-elect President Trump (Chart 13). A fiscal failure will blot out this positive news. Chart 12Fiscal Failure Would Blot Out Economic Improvements
Fiscal Failure Would Blot Out Economic Improvements
Fiscal Failure Would Blot Out Economic Improvements
Chart 13Blue Wall' Could Re-Elect Trump On Economic Improvement
Blue Wall' Could Re-Elect Trump On Economic Improvement
Blue Wall' Could Re-Elect Trump On Economic Improvement
Republicans’ standing offer is for a $1.3 trillion bill. The bipartisan “Problem Solver’s Caucus” has separately proposed a $1.5 trillion package that could be converted. McConnell has shown he can muster his troops by producing 52 Republican votes on a skinny relief bill on September 10. The Senate will go on recess on Friday, October 9 and the House is committed to staying until a bill is done. Negotiations cannot drag on much longer than that, however, because lawmakers need to go back to their home states and districts to campaign for the election. The equity selloff suggests policymakers will need to respond sooner anyway. Is there a way for Trump to bypass Congress and provide stimulus unilaterally? Chart 14Gridlock In 2020-22 Is Possible Under Trump Or Biden
Stimulus Will Come … But May Not Save Trump (GeoRisk Update)
Stimulus Will Come … But May Not Save Trump (GeoRisk Update)
Trump is only too happy to run against a “do-nothing Congress,” which is how Harry Truman pulled off his surprise victory in 1948. He could use executive orders to redirect federal funds that have already been appropriated. However, he has already provided stimulus by decree – delaying payroll tax collections and calling on states to provide unemployment insurance – and yet the market has sold off anyway. That is because these measures are half-baked – they lack the size and the force of an act of Congress. They require coordination with states and firms, which face uncertainty over the legality of the measures and have little incentive to make sacrifices for an administration that may not last more than a few months. In short, if Trump tries to stimulate by decree, it is an election gimmick that will not satisfy market participants who need to look beyond the next 39 days to the critical question of whether US fiscal authorities understand the needs of the economy and can coordinate effectively. Congressional failure will cast a pall over the outlook given that there is still a fair chance the election could produce gridlock for the 2020-22 period, under Trump or Biden (Chart 14). Bottom Line: Financial markets face more downside until Senate Republicans capitulate to Pelosi’s demand of a bill around $2-$2.5 trillion. We think they will, but that is not an argument for getting long now – Republicans could capitulate too late to save the market from a deeper selloff. Investors should book profits now and buy when the deal is clinched. What About The Supreme Court? The Supreme Court battle over the death of Justice Ruth Bader Ginsburg may increase the risk of miscalculation in the stimulus negotiations, but not by much. Subjectively we would upgrade that risk from 25% to 33%. Republicans will fill the vacant seat before the election. So far they have the votes – even if Senator Mitt Romney changes his mind, there is still a one-seat buffer. However, a win on the high court has a mixed impact on financial markets. It may increase the odds of a Democratic Party sweep, which is initially a net negative for equities. But House Democrats will become less inclined to compromise on the size of the fiscal bill that we expect. They will say “take it or leave it” on the $2.2 trillion offer. The lowest we can see Democrats passing is $1.9 trillion. If the GOP fails to budge, the equity selloff will be aggravated by the implication that Democrats will win a clean sweep and thus gain the power to raise corporate and capital gains taxes next year. We have put 55%-60% odds on a clean sweep, but the market stands at 49%, so there is room for the market to adjust (Chart 15). As for the Supreme Court itself, a Republican nomination is legitimate regardless of the election timing, though the decision to go forward this close to the election reveals extreme levels of polarization. The Republican pick could energize the Democrats in the election, as occurred with the nomination of Justice Brett Kavanaugh just ahead of the 2018 midterms. A Democratic overreaction could mobilize conservatives, but this will be moot if the stock market collapses. If the presidential election is contested or disputed, Trump’s court nominee pick could cast the decisive vote, although, once nominated, a justice may not rule in accordance with his or her nominator’s wishes. The Supreme Court battle raises the risk of stimulus miscalculation to 33%. In a period of “peak polarization,” one should expect the Supreme Court battle to escalate further from here (Chart 16). Democrats are likely to remove the filibuster if they win the Senate. This would theoretically enable them to create four new seats on the court, which they could then fill with liberal judges. Franklin Roosevelt attempted to pack the court in 1937 when it got in the way of the New Deal and his plan only narrowly failed due to the unexpected death of a key ally in the Senate. Chart 15A Democratic Sweep Would Aggravate The Equity Selloff
A Democratic Sweep Would Aggravate The Equity Selloff
A Democratic Sweep Would Aggravate The Equity Selloff
Chart 16Supreme Court Battle Will Escalate Amid Extreme Polarization
Supreme Court Battle Will Escalate Amid Extreme Polarization
Supreme Court Battle Will Escalate Amid Extreme Polarization
Not only might the court decide the election outcome, but future controversial legislation could live or die by the court’s vote, as occurred with Obamacare in 2012 (Chart 17). In the event that Democrats achieve a clean sweep, the conservative court will be their only obstacle and they will possess the means to remove it. Chart 17Supreme Court Battle Will Prove Market Relevant In Event Of Democratic Sweep
Supreme Court Battle Will Prove Market Relevant In Event Of Democratic Sweep
Supreme Court Battle Will Prove Market Relevant In Event Of Democratic Sweep
Bottom Line: Earlier we saw a 25% chance that stimulus would fail – now we give it a 33% chance. However, the size of the stimulus is now even more likely to fall within the $2-$2.5 trillion range we have signaled in previous reports. The Supreme Court will become a major factor in domestic economic policy uncertainty if Democrats win a clean sweep of government. Turkey Hits Constraints In East Med – For Now … Turkish President Recep Tayyip Erdogan’s foreign policy assertiveness has once again put Turkey in conflict with NATO allies. Tensions escalated last month after Greece signed a maritime boundary deal with Egypt that Athens said nullified last November’s Libya-Turkey agreement (Map 1). Map 1Turkey Testing Maritime Borders In the East Med
Stimulus Will Come … But May Not Save Trump (GeoRisk Update)
Stimulus Will Come … But May Not Save Trump (GeoRisk Update)
In response, Turkey issued a navigational warning (which was renewed thrice) and dispatched its seismic research vessel, the Oruc Reis, to explore for hydrocarbons in disputed areas of the Eastern Mediterranean between Greece and Cyprus. In shows of force, Turkey and Greece both deployed their navies to the area last month, raising the risk of an armed confrontation.3 The motivation for Erdogan’s hard power tactics is multi-pronged. Chart 18Erdogan’s Foreign Adventurism Reflects Domestic Weakness
Stimulus Will Come … But May Not Save Trump (GeoRisk Update)
Stimulus Will Come … But May Not Save Trump (GeoRisk Update)
On a domestic level, Erdogan’s East Med excursions are an attempt to rally domestic support, where he and his party have lost ground (Chart 18). Given that popular opinion in Turkey indicates that the majority see the self-declared Turkish Republic of Northern Cyprus as a “kin country” and that they do not expect Turkey to be accepted into the EU, Ankara’s East Med strategy is likely to find support. On an international level, Turkey is flexing its muscles against the West. Erdogan has inserted Turkish forces into conflicts in Syria and Libya, confronting NATO allies there, and authorized the provocative purchase of the Russian S400 missile defense system at the expense of membership in the US F-35 program. The East Med gambit is another challenge to the West by testing EU unity. Specifically Erdogan is demonstrating that Turkey is willing to use military force to reject any unilateral attempts by foreign powers to impose maritime borders on Turkey – for instance through the EU’s Seville map.4 By demonstrating maritime strength, Turkey hopes to twist the EU’s arm into agreeing to a more favorable maritime partition plan in the East Med. As such the conflict is part of Turkey’s “Blue Homeland” strategy to expand its sphere of influence and secure energy supplies.5 Turkey is extremely vulnerable as a geopolitical actor because it depends on imports for three-quarters of its energy needs.6 With energy accounting for 20% of its import bill, these imports are weighing on the current account balance (Chart 19). Turkey’s exclusion from regional gas agreements has thus been a blow to its self-sufficiency goals. Meanwhile Greece, Italy, Egypt, Israel, Cyprus, and Jordan have recently formalized their cooperation through the Cairo-based East Mediterranean Gas Organization. Turkish agitation in the East Mediterranean is an attempt to prevent others from exploiting gas resources there so long as its demands remain unmet. Erdogan’s retreat demonstrates Turkey’s constraints in its challenge to the EU. While the EU has yet to impose sanctions or penalties, Erdogan has now backtracked. Oruc Reis returned to Antalya on September 13, despite official statements that it would continue its mission. Turkish and Greek military officials have been meeting at NATO headquarters. And following talks with French President Emmanuel Macron, German Chancellor Angela Merkel, and EU President Charles Michel, Erdogan’s office announced on September 22 that Turkey and Greece were prepared to resume talks. The postponement of the European Council’s special meeting to discuss Turkish sanctions to October 1-2 plays to Turkey’s favor by giving more time for talks. Chart 19Turkey's Energy Dependence A Geopolitical Vulnerability
Turkey's Energy Dependence A Geopolitical Vulnerability
Turkey's Energy Dependence A Geopolitical Vulnerability
Erdogan’s retreat demonstrates Turkey’s constraints in its challenge to the EU. The possibility of damaging sanctions was too much at a time of economic vulnerability. Given Turkey’s dependence on the EU for export earnings and FDI inflows, the impact of sanctions on Turkey’s economy cannot be overstated (Chart 20). Chart 20EU Sanctions Could Destroy Turkey's Economy
EU Sanctions Could Destroy Turkey's Economy
EU Sanctions Could Destroy Turkey's Economy
Turkey is also facing constraints diplomatically as two of its regional rivals – the United Arab Emirates (UAE) and Israel – have agreed to normalize relations and strengthen ties under the US-mediated Abraham Accords (Table 2). The UAE already dispatched F-16s to Crete to participate in joint training exercises in a show of support to Greece. Table 2The Abraham Accords Unify Turkey’s Regional Rivals
Stimulus Will Come … But May Not Save Trump (GeoRisk Update)
Stimulus Will Come … But May Not Save Trump (GeoRisk Update)
Details about the potential sanctions have not been released. However, EU Minister of Foreign Affairs Josep Borrell has indicated that penalties could be levied not only on individuals, but also on assets, ships, and Turkish access to European ports and supplies. This could include banks financing energy exploration or even entire business sectors, such as the energy industry. Moreover, the EU could play other damaging cards such as halting EU accession talks, or limiting its customs union with Turkey, which Ankara hopes to modernize. Chart 21EU Needs Turkey’s Cooperation To Stem Flow Of Migrants
Stimulus Will Come … But May Not Save Trump (GeoRisk Update)
Stimulus Will Come … But May Not Save Trump (GeoRisk Update)
It is also in Europe’s interest to de-escalate the conflict. Sanctions on Turkey could accelerate Ankara’s re-orientation towards Russia and possibly China, expediting its transition to a hostile regional actor. In addition, Turkey has not shied away from using the 2016 migration deal, whereby Turkey has become the gatekeeper of Middle Eastern migrants fleeing to Europe, as a bargaining chip (Chart 21). Foreign Minister Mevlut Cavusoglu outright stated that Turkey will respond to EU sanctions by reneging on the deal, which could result in an influx of refugees into the EU and new challenges for Europe’s political establishment. Erdogan’s retreat is also likely a response to pressure from Washington. Secretary of State Mike Pompeo lent some support to Greece and Cyprus during his September 12 visit to Cyprus. While the US has distanced itself from recent developments in the East Med, leaving German Chancellor Angela Merkel to play the role of mediator, a deterioration in Ankara’s relations with NATO allies could accelerate Turkey’s de-coupling from the West. Some within Washington are already calling for a relocation of the US strategic Incirlik air base to Greek islands. Erdogan’s retreat from a hawkish stance is in line with similar behavior elsewhere. For instance, despite having taken delivery of all parts and completed all necessary tests, Turkey has yet to activate its Russian S-400 missile defense system. It is wary of US sanctions. Similarly, Ankara has paused its Libyan offensive toward the eastern oil crescent in face of the risk of an outright military confrontation with Egypt. In each case, Erdogan appears to be at least temporarily recognizing the limits to his foreign adventurism. Nevertheless, the recent de-escalation does not mark the end of the conflict. Rather it demonstrates that both sides have hit constraints and are pausing for a breather. Chart 22Erdogan's Tactical Retreat Will Pull Down Turkish Risk
Erdogan's Tactical Retreat Will Pull Down Turkish Risk
Erdogan's Tactical Retreat Will Pull Down Turkish Risk
The tactical retreat will provide some relief for the lira, which hit all-time lows against the dollar and euro, and thus pull down our Turkey GeoRisk indicator (Chart 22). But it does not guarantee that the Turkish risk premium will stay low. Talks between Greece and Turkey are unlikely to result in substantial breakthroughs. Instead the conflict will resurface – perhaps when Turkey is in a stronger economic position at home and the EU is distracted elsewhere, whether with internal political issues or conflicts with Russia, the UK, or any second-term Trump administration. Bottom Line: The recent de-escalation of East Med tensions does not mark the end of a bull market in Turkey-EU tensions. These tensions arise from geopolitical multipolarity – Turkey’s ability to act independently in foreign policy without facing an overwhelming, unified US-EU response. However, Turkey’s vulnerability to European economic sanctions shows that it faces real constraints. A major attempt to flout these constraints is a sell signal for the lira, as European sanctions could then become a reality. We remain negative on the lira, but will book gains on our short trade. Investment Takeaways We are booking gains on some of our tactical risk-off trades, given that we ultimately expect the US Congress to approve a new fiscal package. We are closing our long VIX December 2020 / short VIX January 2021 trade, which captured concerns about a contested election in the United States, for a gain of 4%. Volatility will still rise and a contested election is still possible, but the fiscal risk has gone up, COVID-19 cases have gone up, and Trump’s polling comeback has softened. The 4% gain does not include leverage or contract size. We were paid to put on the trade and now will be paid to exit it, so we are booking gains (Chart 23). Chart 23Book Gains On Bet On Near Term Volatility
Book Gains On Bet On Near Term Volatility
Book Gains On Bet On Near Term Volatility
We are closing our short “EM Strongman Basket” of Turkish, Brazilian, and Philippine currencies for a gain of 4.5%. The trade has performed well but Turkey is not only recognizing its constraints abroad but also recognizing constraints at home by raising interest rates to defend the lira. In Brazil, Jair Bolsonaro’s approval rating has surged and our GeoRisk indicator has topped out. The latest readings on our GeoRisk Indicators provide confirmation of our major themes, views, and trades. The charts of each country’s indicator can be found in the Appendix. Short China, Long China Plays: Geopolitical risk continues on the uptrend that began with Xi Jinping’s consolidation of power and has not abated with the Phase One trade deal. Policymakers will remain entirely accommodative on fiscal and quasi-fiscal (credit) policy in the wake of this year’s recession. New financial regulations do not herald a return of the deleveraging campaign in any way comparable to 2017-18. The October Politburo meeting on the economy could conceivably sound a hawkish note, which could conveniently undermine sentiment ahead of the US election, but if this occurs then we would not expect follow-through. China plays and commodity plays should benefit, such as the Australian dollar, iron ore prices, and Brazilian and Swedish equities. Yet we remain short the renminbi, which has recently flagged after a fierce rally. Trump is negative for the RMB and Biden will ultimately be tough on China, contrary to the market consensus. Short Taiwan: US-China strategic relations have collapsed over the course of the year but financial markets have ignored it due to COVID-19 and stimulus. The only thing keeping US-China relations on an even keel is the Trump-Xi gentleman’s agreement, which expires on November 3 regardless of the election outcome. While outright military conflict over Taiwan cannot be ruled out, Beijing is much more likely to impose economic sanctions prior to any attempt to take the island by force. This has been our base case since 2016. Our GeoRisk indicator is just starting to price this risk so it remains highly underrated from the perspective of the Taiwanese dollar and equities. We are short and there is still time to put on shorts. Long South Korea: The rise in Korean geopolitical risk since the faltering of US-North Korean diplomacy in 2019 has peaked and fallen back, as expected. Pyongyang has not substantively tested President Trump during the election year and we still do not think he will – though a showdown would mark an October surprise that could boost Trump’s approval rating. South Korean political risk should continue falling and we are long Korean equities. Short Russia: Russian geopolitical risk has exploded upward, as we expected. We have been bearish on the Russian ruble and local currency bonds, though we should note that this differs from our Emerging Markets Strategy view based on macro fundamentals. Our reasoning predates the escalation of tensions with the EU over Belarus, but Belarus highlights the negative dynamic: Vladimir Putin in his fourth term is concerned about domestic social and political stability, and this concern is especially heightened after the global pandemic and recession. Therefore he has little ability to tolerate unrest in the former Soviet sphere. Moreover, he has a window of opportunity when the US administration is distracted, and not unfriendly, whereas that will change if the Democrats take over. If Democrats win, they will not try another diplomatic “reset” with Russia; they believe engagement has failed and want revenge for Putin’s undermining the Obama administration and 2016 election interference. The Nordstream 2 pipeline and Russian local currency bonds are at risk of new sanctions. The Democrats will also increase their efforts at cyber warfare and psychological warfare to counter Russia’s use of such measures. If Trump wins, the upside for Russia is limited as Trump’s personal preferences have repeatedly lost to the US political and military establishment when it comes to Russia. The US has remained vigilant against Russian threats and has increased support for countering Russia in eastern Europe and Ukraine. Chart 24Russia Is At Risk of US Sanctions
Russia Is At Risk of US Sanctions
Russia Is At Risk of US Sanctions
In Belarus, President Lukashenko has been sworn in as president again, and he will not step down unless Russia and its allies orchestrate a replacement who is friendly toward Russian interests. Russia will not allow a pro-EU, pro-NATO government by any stretch of the imagination. The likeliest outcome is that Russia demonstrates its security and military superiority in a limited way, while the US and Europe respond with sanctions but not with military force. There is no appetite for the US or EU to engage in hot war with Russia over Belarus, which they have little hope of re-engineering in the Western image. We are short Russian currency and local bonds on the risk of sanctions stemming from either the US election cycle or the Belarus confrontation or both. We note that local currency bonds are not pricing in the risks that our geopolitical risk indicators are pricing (Chart 24). Long Europe: Our European geopolitical risk indicators show that the EU remains a haven of political stability in an unstable time. European integration is accelerating in the context of security threats from Russia, the potential for sustained economic conflict with the US (if Trump is re-elected), and economic competition with an increasingly authoritarian and mercantilist China. Europe’s latent strengths, when acting in unison, are brought out by the report on Turkey above. However, the 35% chance that the UK fails to reach a trade deal at the end of this year will still push our European risk indicators up in the near term. Matt Gertken Vice President Geopolitical Strategy mattg@bcaresearch.com Roukaya Ibrahim Editor/Strategist Geopolitical Strategy RoukayaI@bcaresearch.com We Read (And Liked) … Geopolitical Alpha: An Investment Framework For Predicting The Future What better way to revive the hallowed tradition of BCA Geopolitical Strategy book reviews than to give clients a sneak preview of our founder Marko Papic’s literary debut, Geopolitical Alpha: An Investment Framework for Predicting the Future?7 Long-time readers will know much of this book – it is the distillation of a decade of Marko’s work at BCA Research and, more recently, Clocktower Group. Here is the story of European integration – perhaps Marko’s greatest call, from back in 2011. Here is the story of multipolarity and investing. Here is the apex of globalization. Here is the decline of laissez-faire and the rise of dirigisme. Here is the end of Chimerica. Attendees of the BCA Research Academy will also recognize much in Marko’s formal exposition of his method. The categories of material constraints that bind policymakers. The practical application of the median voter theorem. The psychological lessons from Richards Heuer and Lee Ross. The occasional dash of game theory – and the workingman’s critique of it. The core teaching is the same: “Preferences are optional and subject to constraints, whereas constraints are neither optional nor subject to preferences.” There is also much that is new, notably Marko’s analysis of the COVID-19 pandemic, which is bound to generate controversy for classifying the whole episode as an example of mass hysteria comparable to the Salem witch trials, but which is as well-researched and well-argued as any section in the book. I was fortunate to learn the geopolitical method with Marko under the guidance of George Friedman, Peter Zeihan, Roger Baker, Fred Burton, Scott Stewart, and other colleagues at Stratfor (Strategic Forecasting, Inc.) in Austin, Texas from the era of the Iraq troop surge, the Russian invasion of Georgia, and the Lehman Brothers collapse. We both owe a lot to these teachers: the history of geopolitics, intelligence analysis, open source monitoring, net assessments, and, of course, forecasting. What Marko did was to take this armory of geopolitical analysis – which we both can testify is best taught in practice, not universities – and to put it to use in the financial context, where political analysis was long treated as optional and anecdotal despite the manifest and growing need for a rigorous framework. A hard-nosed analyst will never cease to be amazed by the gaps that emerge between the consensus view on Wall Street and a careful, disciplined net assessment of a nation or political movement. By the same token, the investor, trader, or economist will never cease to be amazed by the political analyst’s inability to grasp the concept of “already priced in” or “the second derivative.” What needed to be done was to master the art of macro investing and geopolitics. Marko took this upon himself. It was audacious and it provoked a lot of skepticism from the dismal scientists and the political scientists alike. But Geopolitical Alpha, the concept and the book, is the consequence – and we are now all the better for it. Marko is fundamentally a post-modern thinker. His methodological hero is Karl Marx for the development of materialist dialectic, the back-and-forth debate between economic forces that humans internalize in the form of competing ideologies. His foil is the humanist and republican, Niccolo Machiavelli – not for his amoral approach, but for prizing the virtue of the prince in the face of outrageous fortune. Human agency is Marko’s favorite punching bag – he excels at identifying the ways in which individuals will be frustrated despite their best efforts by the cold, insensitive walls of reality around them. If there is a critique of Marko’s book, then, it is that he gives short shrift to the classical liberal tradition – or as I like to think of it, the balance-of-power tradition. The idea that hegemony, or unipolarity, leads to a stable social and political environment conducive to peace and prosperity has a lot going for it. But it also partakes of an older tradition of thought that envisions a single, central political order as necessarily the most stable and predictable – a tradition that can be ascribed to Plato as well as Marx. You can see the positive implication for financial markets. But what if this tradition is only occasionally right – what if it too is subject to historical cycles? If that is the case, then the Beijing consensus is a mirage – and the US’s reversion to a blue-water strategy (not only under President Trump, but also under a future President Biden, according to his campaign agenda) does not necessarily herald the “end [of] American dominance on the world stage.” The classical tradition behind the Greco-Roman, British, and American constitutional systems, including their naval strategies, envisioned a multipolar order that was somewhat less stable but more durable, and this tradition has proven immensely beneficial for the creation of technology and wealth. Of course, Marko is very much alive to this tradition and, despite his critique of the ancients, shows himself to be highly sensitive to the interplay of virtue and fortune. Throughout the work, the analytical style can be characterized as restless energy in the service of cool, chess-playing logic. Marko is generous with his knowledge, merciless in drawing conclusions, and outrageously funny in delivery. He attacks the questions that matter most to investors and that experts too often leave shrouded in finely wrought uncertainty. He also shows himself to be a superb writer as well as strategist, interspersing his methodological training sessions with vivid anecdotes of a lifelong intellectual journey from a shattered Yugoslavia to the heights of finance. The bits of memoir are often the best, such as the intro to Chapter Six on geopolitics. To paraphrase a great author, Marko writes because he has a story to tell, not because he has to tell a story. The tale of the mysterious consulting firm Papic and Parsley will do a great public service by teaching readers precisely how skeptical of mainstream news journalism they should be. It isn’t enough to say that we read Geopolitical Alpha and liked it – the sole criterion for a review in this column. Rather, the book and its author are the reason this column exists. And Geopolitical Alpha is now the locus classicus of market-relevant geopolitical analysis. Matt Gertken Vice President Geopolitical Strategy mattg@bcaresearch.com Footnotes 1 We favored the upper side of the range, first $2.5 trillion, and subsequently something closer to House Speaker Nancy Pelosi’s demand of $2.2 trillion. We have speculated that Republicans may get her to settle at $1.9 trillion. 2 Two of these cases were unique in that a vice president took over from a president who died and then won re-election – unlike Trump’s scenario. 3 On August 12 a Greek Navy frigate collided with a Turkish vessel guiding the Oruc Reis. Athens called the incident an accident while Ankara referred to it as a provocation. 4 The so-called Seville Map was prepared at the request of the European Union by researchers at the University of Seville, attempts to clarify the exclusive economic zones of Turkey and Greece in the Aegean Sea. The US announced on September 21 that it does not consider the Seville map to have any legal significance. 5 The Blue Homeland or Mavi Vatan doctrine announced in 2006 intends to secure Turkish control of maritime areas surrounding its coast (Mediterranean Sea, Aegean Sea, and Black Sea) in order to secure energy supplies and support Turkey’s economic growth. 6 Erdogan’s claim that gas from the recently discovered Sakarya gas field would reach consumers by 2023 is likely overly optimistic and unrealistic. The drilling costs and commercial viability of the field are yet to be determined. Thus, the find does not impact dynamics in the East Med. 7 New Jersey: Wiley, 2021. 286 pages. Section II: GeoRisk Indicators China
China: GeoRisk Indicator
China: GeoRisk Indicator
Russia
Russia: GeoRisk Indicator
Russia: GeoRisk Indicator
UK
UK: GeoRisk Indicator
UK: GeoRisk Indicator
Germany
Germany: GeoRisk Indicator
Germany: GeoRisk Indicator
France
France: GeoRisk Indicator
France: GeoRisk Indicator
Italy
Italy: GeoRisk Indicator
Italy: GeoRisk Indicator
Canada
Canada: GeoRisk Indicator
Canada: GeoRisk Indicator
Spain
Spain: GeoRisk Indicator
Spain: GeoRisk Indicator
Taiwan
Taiwan: GeoRisk Indicator
Taiwan: GeoRisk Indicator
Korea
Korea: GeoRisk Indicator
Korea: GeoRisk Indicator
Turkey
Turkey: GeoRisk Indicator
Turkey: GeoRisk Indicator
Brazil
Brazil: GeoRisk Indicator
Brazil: GeoRisk Indicator
Section III: Geopolitical Calendar
Highlights Global GDP growth estimates from the OECD point to a stronger recovery in oil demand than markets are pricing in at present (Chart of the Week). Our forecast for Brent remains at $46/bbl for 2H20 and $65/bbl on average for 2021. Global trade data – particularly EM import volumes, which are highly correlated with income (GDP) – remain supportive, as does monetary policy, particularly out of the US, EU and China. Doubt surrounds the US Congress’s determination to extend the fiscal support that underpins many households’ and firms’ budgets, but we expect a deal. Aggregate demand uncertainty remains high. COVID-19 infections are increasing globally. However, death rates appear to be trending lower, which likely will keep lockdowns localized. On the supply side, the leaders of OPEC 2.0 – Saudi Arabia (KSA) and Russia – continue to insist on full adherence to agreed production levels among member states. This carries an implicit threat the leadership may be willing to flood the market with oil to remind the laggards of the consequences of cheating, which would hit non-Gulf OPEC members particularly hard. Longer term, sharp reductions in capex point to higher prices in the mid-2020s. Feature Stronger-than-expected growth estimates, most recently the OECD’s, suggest the decline in aggregate demand to the end of this year will not be as gruesome as earlier feared. Realized oil demand continues its V-shaped recovery, in line with rising GDP in the wake of the COVID-19 pandemic. Stronger-than-expected growth estimates, most recently the OECD’s, suggest the decline in aggregate demand to the end of this year will not be as gruesome as earlier feared, and that growth could be stronger in 2021 than earlier anticipated, as seen in the Chart of the Week.1 The OECD is expecting global GDP growth to contract 4.5% this year vs. its June estimate of a 6% decline. The World Bank’s forecast of a 5.2% contraction in global GDP this year drives our oil-demand estimate, so the OECD’s estimate is more bullish for oil demand. Incoming data for EM import volumes suggest income is on track to recover by year-end or early 2021 in developing and emerging markets (Chart 2). EM import growth is driven by income growth; EM demand is the most important driver of global oil-demand growth. Chart of the WeekOECD Raises Global Growth Estimates
Fear And Loathing Attend Oil-Price Recovery
Fear And Loathing Attend Oil-Price Recovery
Chart 2EM Import Volumes Remain On Recovery Path
EM Import Volumes Remain On Recovery Path
EM Import Volumes Remain On Recovery Path
Growth estimates continue to be overshadowed by fears of another round of widespread lockdowns arising from a second wave of COVID-19 infections and deaths. For next year, the OECD expects global growth to expand at a 5% rate vs. the World Bank’s 4.2% rate. We are awaiting the Bank’s updated income (GDP) estimates before revising our oil demand estimates. We already show EM oil demand, proxied by non-OECD consumption, recovering to pre-COVID-19 levels by the middle of next year, while DM demand flattens at a lower level (Chart 3). A confirmation of better-than-expected growth – particularly from EM economies – would move our expectation of a full recovery in EM oil-demand into 1H21 and could push DM demand up slightly. Chart 3EM Oil Demand Will Surpass Pre-COVID-19 Levels In Mid-2021
EM Oil Demand Will Surpass Pre-COVID-19 Levels In Mid-2021
EM Oil Demand Will Surpass Pre-COVID-19 Levels In Mid-2021
Chart 4COVID-19 Infections Rising, But Death Rates Are Falling
Fear And Loathing Attend Oil-Price Recovery
Fear And Loathing Attend Oil-Price Recovery
These growth estimates continue to be overshadowed by fears of another round of widespread lockdowns arising from a second wave of COVID-19 infections and deaths. This perforce makes any bullish demand recovery suspect. For the present, while COVID-19 infections are rising, death rates appear to be trending lower recently (Chart 4). If, as appears to be the case, a vaccine for the virus is approved later this year or in early 2021, markets likely would re-orient to discounting the time at which it is available globally to estimate a demand-recovery vector. Our estimate of the global oil-demand loss for this year is slightly larger than last month – -8.15mm b/s vs. -8.1mm b/d in August (Table 1). The US EIA and IEA also increased their estimates of 2020 global demand loss slightly this month as well, to -8.3mm b/d and -8.4mm b/d, respectively. OPEC once again is an outlier – albeit a very important source of information – in expecting a loss of -9.5mm b/d of demand this year. For 2021, we expect demand to grow 7.3mm b/d, vs. 6.5mm b/d from the EIA. OPEC expects oil-demand growth of 6.6mm b/d next year vs. last month’s forecast of 7mm b/d. Table 1BCA Global Oil Supply - Demand Balances (MMb/d, Base Case Balances)
Fear And Loathing Attend Oil-Price Recovery
Fear And Loathing Attend Oil-Price Recovery
OPEC 2.0 Production Discipline Holds Our expectation for OPEC 2.0 production is driven by our belief the group is targeting higher prices next year, and will adjust output to reach that goal. OPEC 2.0 continues to manage member-states’ output effectively. Compliance with the production cuts agreed by OPEC 2.0 remained strong in August – at 102%, based on OPEC’s calculations. The group’s production cut will be reduced to 5.8mm b/d starting in January 2021 from 7.7mm b/d currently (Chart 5). At its September 17 meeting, the coalition’s Joint Ministerial Monitoring Committee (JMMC) reiterated the importance of all countries complying with the agreed cuts, and recommended the so-called “compensation period” for underperforming countries failing to meet their production cuts be extended to the end of December 2020. This is meant to keep production below demand in 4Q20. For 2021, we continue to expect the group will accommodate higher demand growth by gradually increasing production beyond the currently planned January increase in quotas. This will limit the rise in prices, and will keep them below $70/bbl (Chart 6). Chart 5OPEC 2.0 Production Discipline Holds ...
OPEC 2.0 Production Discipline Holds ...
OPEC 2.0 Production Discipline Holds ...
Chart 6... And Continues To Support Prices
... And Continues To Support Prices
... And Continues To Support Prices
Our expectation for OPEC 2.0 production is driven by our belief the group is targeting higher prices next year, and will adjust output to reach that goal. KSA and Russia are making it abundantly clear in their public remarks they intend to keep the pressure up on the rest of OPEC 2.0 to move prices higher – their budgets have been hammered by the COVID-19 pandemic, after just starting to recover from the 2014-16 market-share war launched by OPEC when the pandemic hit earlier this year.2 Even in the current relatively low-price environment, KSA imposed a value-added tax (VAT) and is paring back social spending, while Russia is signaling it will increase in taxes on oil producers and metals companies and others to raise revenues.3 In the US, we believe most of the previously shut-in wells have been brought back on line. In our modeling, we marginally reduced OPEC 2.0’s production increase in this month’s forecast due to the slight downward revisions in demand. We now expect the group to increase its production to ~ 45mm b/d by December 2021, vs our previous expectation of ~ 46mm b/d. In our lower-demand scenario, which is driven by OPEC’s 2020 and 2021 demand estimates, we estimate prices would peak at ~ $50/bbl next year when keeping OPEC 2.0’s production unchanged vs. our base case. However, without the strong upward demand pressure, we believe OPEC 2.0 will keep its 5.8mm b/d production cuts in place for most of 2021 and that KSA, and to a lesser extent Russia, will push for strict production discipline at that level. This is sufficient to move prices close to $60/bbl on average in our lower-demand scenario in 2021 (Chart 7). Securing additional production cuts – to push average prices to $65/bbl as in our base case – from other OPEC 2.0 member states, including Russia, would be a difficult task. Chart 7Lower-Demand Price Scenarios
Lower-Demand Price Scenarios
Lower-Demand Price Scenarios
Chart 8Falling US Rig Counts …
Fear And Loathing Attend Oil-Price Recovery
Fear And Loathing Attend Oil-Price Recovery
In the US, we believe most of the previously shut-in wells have been brought back on line. Going forward, legacy production declines rates will push onshore production down as new production from new completed wells remains below the level required to keep production flat (Chart 8). We expect production will bottom in June 2021 at ~ 8.1mm b/d before slowly moving up in 2H21 (Chart 9). The small uptick in production will come mainly from the completion of drilled-but-uncompleted (DUC) wells in the US shales, which expand and contract with the level of drilling activity, and function as a ready source of incremental lower-cost supply (Chart 10). DUCs will provide a cheap source of new production. We expect producers will begin developing this source of supply during the first half of next year, as the only expense left to bring oil to market from them are completion costs. Chart 9… And Falling US Production
... And Falling US Production
... And Falling US Production
Chart 10Expect DUCs To Be Developed In 2021
Fear And Loathing Attend Oil-Price Recovery
Fear And Loathing Attend Oil-Price Recovery
Oil’s Capex Dilemma The IEA estimated oil and gas investment will fall by close to $244 billion y/y in 2020 which will reduce supply by ~ 2mm b/d by 2025. The combination of OPEC 2.0’s low-cost production and high spare capacity; parsimonious capital markets and the growing appeal of ESG-driven investment decisions; and concerns over peak oil demand will continue to limit funding to all but the most profitable producers, which will continue to limit E+P ex-OPEC 2.0.4 Consequently, new oil production in non-OPEC countries risks falling below the level needed to cover legacy wells’ decline rates, which we estimate at ~ 8% for non-OPEC ex-US shale production. This will be mostly apparent in The Other Guys – our moniker for all producers excluding Gulf OPEC, US shales, Canada, and Russia – which account for ~ 40% of global oil supply. In our view, the decline rates of The Other Guys currently are being overlooked, while the prospect of so-called “peak oil demand” is receiving a disproportionate amount of attention, and could be discouraging needed investment in new E+P. Keeping production flat in The Other Guys and US onshore production will require ~ 7mm b/d of new oil production between 2022 and 2025 (Chart 11). In the US, most of the added upstream capex will be dedicated to replacing legacy production declines. The IEA estimated oil and gas investment will fall by close to $244 billion y/y in 2020 which will reduce supply by ~ 2mm b/d by 2025. The sluggish rebound in capex could remove another 2-4mm b/d. According to IHS Markit, for supply to meet the expected demand over the next 5 years, close to $4.5 trillion in capex and opex is needed. The capital-constrained Other Guys’ supply growth, and a similar paucity of funding in the US and Canada will barely suffice to offset the decline rates in non-OPEC producing countries. This implies OPEC 2.0’s role will increase over the coming years as its spare capacity – which allows the group to move production to market more rapidly than shale producers – and ability to grow its productive capacity at low costs will disincentivize investments in major oil projects outside of these regions. Chart 11"The Other Guys" Production Remains In Decline
Fear And Loathing Attend Oil-Price Recovery
Fear And Loathing Attend Oil-Price Recovery
Investment Implications We expect the combination of OPEC 2.0 production discipline, parsimonious capital markets, and increasing decline rates will tighten the supply side of the market. In the near term, the recent upgrade in global GDP growth estimate from the OECD points to a stronger-than-expected recovery in oil demand, owing largely to massive fiscal and monetary support around the world. We expect the combination of OPEC 2.0 production discipline, parsimonious capital markets, and increasing decline rates will tighten the supply side of the market. As a result, we expect markets to continue to tighten (Chart 12), and for inventories to continue to draw this year and next (Chart 13). Chart 12Markets Will Continue To Tighten ...
Markets Will Continue To Tighten ...
Markets Will Continue To Tighten ...
Chart 13... And Storage Will Continue To Draw
... And Storage Will Continue To Draw
... And Storage Will Continue To Draw
We will continue to monitor growth estimates, but for the present, we are keeping our forecast for Brent at $46/bbl for 2H20 and $65/bbl on average for 2021. WTI will trade $2 - $4/bbl below Brent over this time. Longer term, producers outside the core OPEC 2.0 states are being starved for capital. The combination of continued production discipline and a paucity of capital available for producers outside this coalition are pointing toward a lower rate of supply growth going forward. Robert P. Ryan Chief Commodity & Energy Strategist rryan@bcaresearch.com Hugo Bélanger Associate Editor Commodity & Energy Strategy HugoB@bcaresearch.com Commodities Round-Up Energy: Overweight The recent announcement by Eastern Libyan commander Khalifa Haftar that the LNA would lift its blockade on oil output for a month does not meaningfully impact our previous Libyan oil production forecast. We continue to forecast a gradual recovery in the country’s production to 600k b/d and 900k b/d by December 2020 and 2021 (Chart 14). The news signals production could resume at a slightly higher pace than in our forecasts. However, we still believe risks to an export recovery are elevated, as the underlying conflicts in the country remain unresolved. Thus, we are keeping our projections largely unchanged (see Table 1). Base Metals: Neutral World copper markets ended 1H20 with an apparent refined copper deficit of 278k MT, after adjustments for changes in Chinese bonded stocks. according to the International Copper Study Group. World ex-China refined copper usage declined ~ 9%, led by declines of 12% in Japan, 10% in the EU and ~ 8% in Asia (Ex-China). A 31% increase in net refined copper imports lifted Chinese apparent usage 9% offsetting, which offset declines in the rest of the world (Chart 15). China accounts for ~ 50% of refined copper consumption and ~ 40% of refined copper production. Precious Metals: Neutral The sell-off in silver took prices below our trailing stop of $26/oz, leaving us with a gain of 40.5% since inception July 2, 2020. Our views for silver and gold remain positive, as the Fed continues to signal it will look through any pick-up in inflation, which we believe will keep real rates in the US low for the foreseeable future, and lead to a weaker USD. Ags/Softs: Underweight Soybean and corn futures paired back their gains, falling roughly 3.5% since last week. The USDA crop progress report for the week ending September 21, 2020, indicated that the deterioration in the condition of soybean and corn crops has stalled. The sharp rise in the US dollar Index has been another headwind. Given these factors and the precarious level of current prices, we recommend staying underweight agricultural products at this juncture. Chart 14LIBYA CRUDE PRODUCTION SET TO REBOUND
LIBYA CRUDE PRODUCTION SET TO REBOUND
LIBYA CRUDE PRODUCTION SET TO REBOUND
Chart 15Strong Chinese Copper Imports
Strong Chinese Copper Imports
Strong Chinese Copper Imports
Footnotes 1 Please see OECD Interim Economic Assessment, “Coronavirus: Living with uncertainty,” published September 16, 2020. 2 Following the JMMC meeting, Saudi Energy Minister Prince Abdulaziz bin Salman Al-Saud said OPEC 2.0 could hold an extraordinary meeting to address weaker demand, and warned traders against shorting the market. Please see Saudi energy minister warns oil price gamblers ‘make my day’ published by aljazeera.com September 17, 2020. 3 Please see KSA VAT rate to increase to 15% from 1 July 2020 published by Deloitte Touche Tohmatsu Limited July 1, 2020. See also Russian lawmakers give initial nod to hefty tax hike for mining, oil published by reuters.com September 22, 2020. 4 We opened our examination of the longer-term consequences of the contraction of supply growth last week in Oil's Next Bull Market, Courtesy Of COVID-19. It is available at ces.bcaresearch.com. Investment Views and Themes Recommendations Strategic Recommendations Tactical Trades Trade Recommendation Performance In 2020 Q2
Lower Vol As OPEC 2.0 Gains Control
Lower Vol As OPEC 2.0 Gains Control
Commodity Prices and Plays Reference Table Trades Closed in 2020 Summary of Closed Trades
Lower Vol As OPEC 2.0 Gains Control
Lower Vol As OPEC 2.0 Gains Control
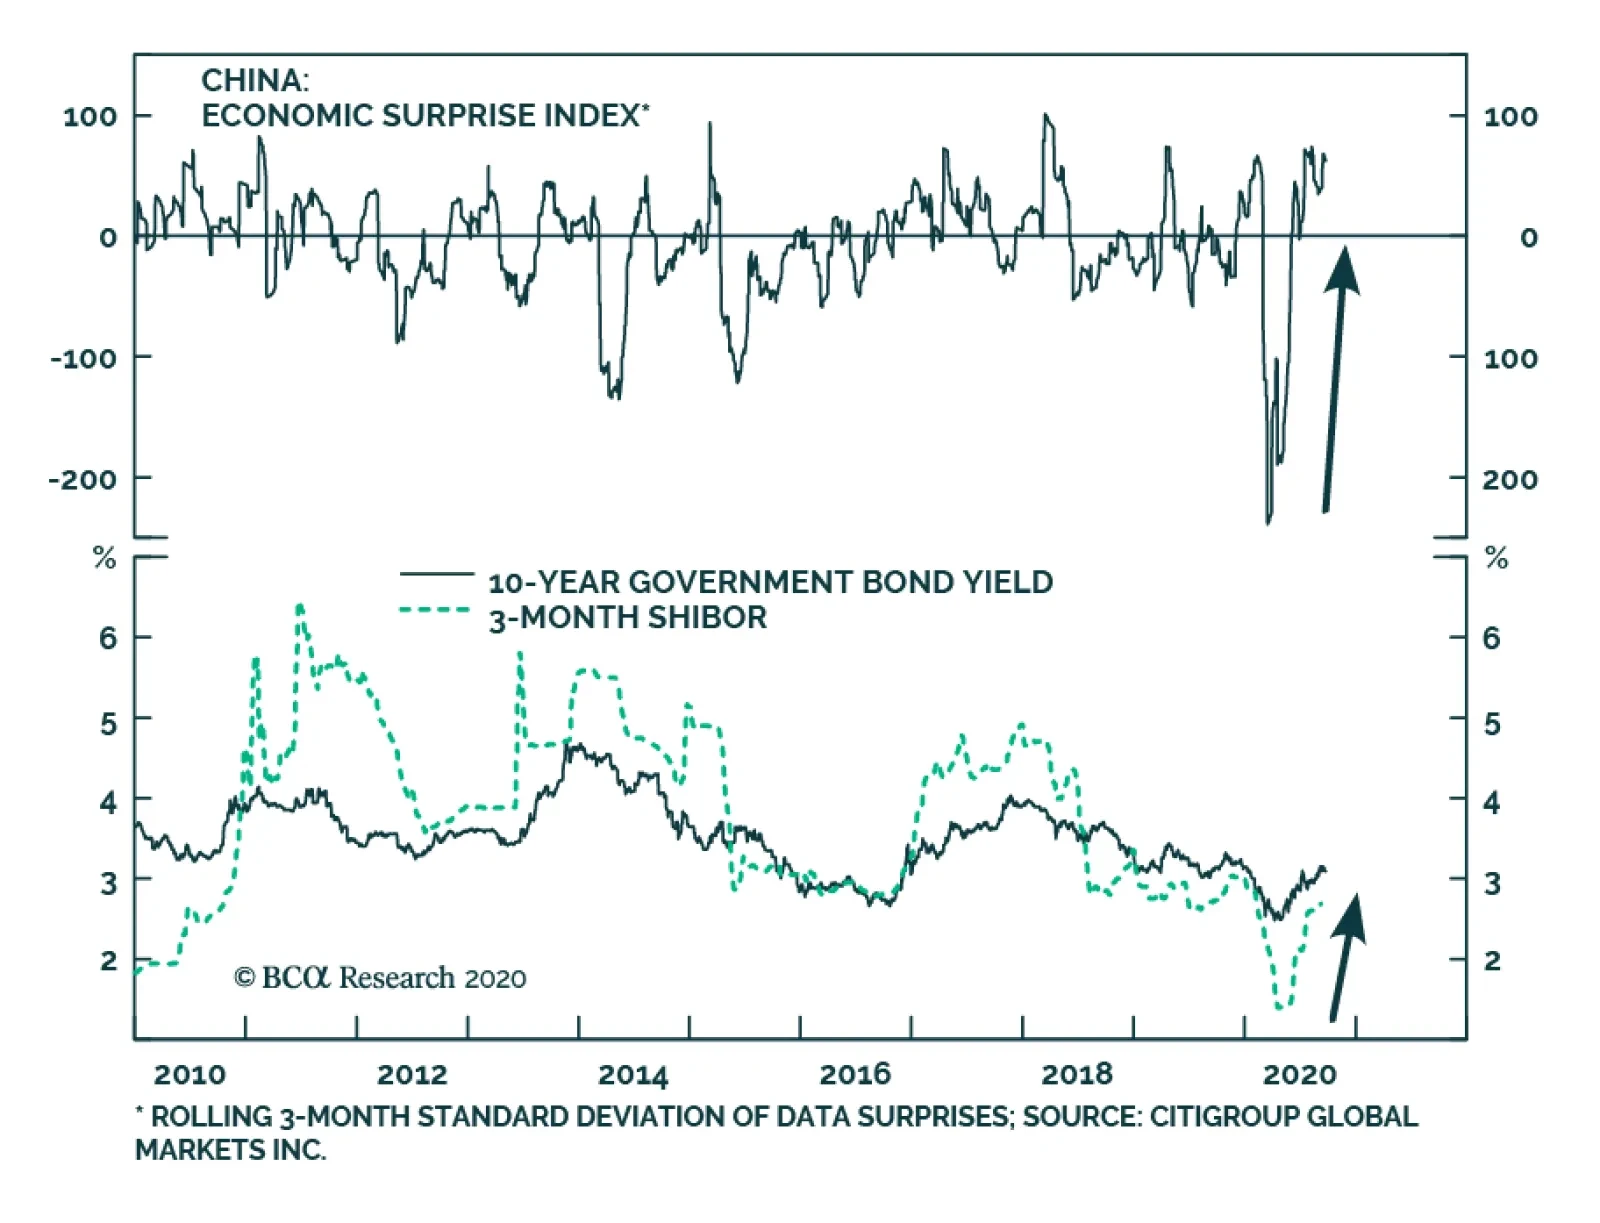
BCA Research's China Investment Strategy service analysis concludes that the extremely accommodative phase of monetary conditions has ended. Authorities will begin tightening policy by the middle of next year. The rising policy rate in the past couple…
Highlights The rising policy rate in the past couple months has been driven by a liquidity crunch, which is expected to ease in Q4. Government bond yields, which have been trending upwards since May, will also take a breather. The extremely accommodative phase of monetary conditions has ended. Monetary policy will be tightened, possibly by the middle of next year. We expect the yield curve to move broadly sideways in Q4 and into early 2021. As early as Q2 next year, a rebound in rate hike expectations will cause the curve to flatten. We remain overweight on Chinese stocks over the next six to nine months. Beyond that, a more restrictive monetary policy and less buoyant economic outlook may warrant a trimming of positions in Chinese stocks. Feature Chinese government bond yields have rebounded sharply since bottoming in late April; 10-year yields have climbed by 62 basis points to 3.1% as we go to press. Given that the 3-month SHIBOR (the PBoC’s de facto policy rate) has gone up by 128 basis points from its nadir in April, the higher bond yields reflect policy-driven liquidity tightening. The economy’s quick turnaround following the reopening of business activities has prompted the authorities to normalize the monetary stance (Chart 1). China recently made more interbank liquidity injections to slow the speed of policy rate normalization. We think it is the right move. China’s economic recovery is still at an early stage and may not withstand a rapid tightening in monetary policy. Furthermore, the chances are low that the 3-month SHIBOR will rise above its pre-COVID-19 level of 3% in this calendar year. Yields on short-duration government bonds will have little room to move higher in 2020. China’s 10-year government bond yield may even drop slightly when geopolitical tensions between the US and China heat up as the US election nears. Chart 1Policy Rate Normalization Started In May
Policy Rate Normalization Started In May
Policy Rate Normalization Started In May
Chart 2Rate Normalization Will Resume In 2021
Rate Normalization Will Resume In 2021
Rate Normalization Will Resume In 2021
As China’s economic recovery is expected to continue accelerating into the first half of 2021, interest rates will also resume their climb (Chart 2). Our base case view is that the first rate hike, which will lift the policy rate above its pre-COVID-19 level, will happen as early as Q2 next year but no later than mid-2021. This means that the cyclical bear market in the bond market will continue. A Temporary Easing In Q4… In our report published on February 19, we argued that the rally in Chinese government bonds in early 2020 would be short lived rather than a cyclical (6-12 month) play.1 Furthermore, a journey back to the pre-outbreak monetary stance would start as early as Q2 this year. Notably, Chinese policymakers have pivoted to normalize monetary policy from an ultra-loose stance linked to COVID-19. In our view, the speed of the rebound in the policy rate has run ahead of the economic recovery. In other words, the policy stance tightened before inflation expectations turned more optimistic (Chart 3). Retail sales growth barely turned positive in August from a year ago, core inflation has dropped to its lowest level since the Global Financial Crisis and producer prices are still contracting on an annual basis (Chart 4). Chart 3Policy Stance Tightened Before Inflation Moved Higher
Policy Stance Tightened Before Inflation Moved Higher
Policy Stance Tightened Before Inflation Moved Higher
In the past two weeks, the PBoC has injected liquidity more frequently through open market operations, an indication that policymakers may be trying to slow the pace of tightening (Chart 5). Maintaining nominal GDP growth above 4% this year is politically imperative for the Communist Party to achieve its employment growth objective.2 This overarching goal will likely hold back the PBoC from easing off the gas too abruptly. Chart 4The Economy Is Still Growing Below The Trend Growth
The Economy Is Still Growing Below The Trend Growth
The Economy Is Still Growing Below The Trend Growth
Liquidity conditions will continue to improve into Q4, moderating the rise in the 3-month SHIBOR. The liquidity crunch in the banking system since May was created by a massive government bond issuance and curbing of high-yield structured deposits. Government bond issuance has reached its peak this year and bond quotas will plummet in Q4, which will help ease liquidity shortages in the banking sector (Chart 6). In turn, demand for interbank liquidity should moderate as banks have fewer bond purchasing obligations, giving the 3-month SHIBOR some breathing room with or without the PBoC’s intervention. Chart 5The PBoC May Be Trying To Slow The Pace Of Its Rate Normalization
The PBoC May Be Trying To Slow The Pace Of Its Rate Normalization
The PBoC May Be Trying To Slow The Pace Of Its Rate Normalization
A pause in the policy rate hike will limit any upside risks for yields on short-duration government bonds. Yields on 10-year bonds may even drop if tensions between the US and China escalate leading up to the November US election, and/or additional significant pandemic waves affect the global economy. Chart 6Liquidity Conditions Should Ease In Q4
Liquidity Conditions Should Ease In Q4
Liquidity Conditions Should Ease In Q4
Bottom Line: It is unlikely that China’s policy rate and the long-duration government bond yield will end the year above their pre-COVID-19 levels. …Followed By Decisive Rate Hikes In 2H21 There are good and rising odds that Chinese authorities will fully switch to a tightening mode in 2021. Barring any domestic resurgence in COVID-19 that could trigger lockdowns, the PBoC may resume policy rate hikes as early as Q2, and no later than mid-2021. Our reasoning is as follows: Chart 7The PBoC Has Been Consistent With Policy Reaction In Previous Recoveries
The PBoC Has Been Consistent With Policy Reaction In Previous Recoveries
The PBoC Has Been Consistent With Policy Reaction In Previous Recoveries
Consistent policy reaction in previous recoveries. Our April 23 report showed how the PBoC has been consistent in normalizing its monetary policy following each of the past three economic and credit cycles.3 The central bank raised interest rates on average nine months following a bottom in the business cycle. The tightening of interest rates occurred even after the prolonged economic downturn and deep deflationary cycle in 2015/16. The structurally slowing rate of China’s economic growth since 2011 has not prevented the PBoC from cyclically raising its policy rate (Chart 7). When the output gap is closed in 1H21, the PBoC will gain enough confidence to push for higher interest rates. Property market is strong. The property market has been heating up on the back of falling bank lending rates, despite policymakers’ efforts to curb both property lending and purchases. New home sales surged by 40% in August, the highest year-over-year growth since the last housing boom in 2016. In particular, demand for the first- and second-tier cities have rebounded sharply (Chart 8). This trend will likely prompt policymakers to enact stronger and earlier policy responses by tightening the medium lending facility (MLF) rate, an anchor for the mortgage lending rate. The labor market is recovering. The employment sub-indexes in the official PMIs of late point to an improvement in both the manufacturing and non-manufacturing sectors (Chart 9). Additionally, by the end of June, the number of returned migrant workers reached 96% of last year’s level. At this rate, the labor market should return to its pre-COVID-19 level by early next year. Chart 8Property Market Is Heating Up
Property Market Is Heating Up
Property Market Is Heating Up
Chart 9The Labor Market Is Recovering
The Labor Market Is Recovering
The Labor Market Is Recovering
Inflation will probably accelerate next year. We expect the recovery in the labor market to drive up both wage income and core CPI next year. Higher oil and industrial metals prices should also lift producer prices (Chart 10). Higher interest rates may not be counterproductive to policymakers’ support for SMEs. This is due to the authorities’ “window guidance”, mandating banks to reduce the spread between the loan prime rate (LPR) and bank lending rates. As seen in the past five months, although the policy rate has been rising, average bank lending rates have fallen (Chart 11). Policymakers will likely continue hiking policy rate to curb financial and property market speculations, but at the same time still able to guide bank lending rates lower and target their support for SMEs. Chart 10Inflation Will Likely Accelerate Along With Economic Growth In 1H21
Inflation Will Likely Accelerate Along With Economic Growth In 1H21
Inflation Will Likely Accelerate Along With Economic Growth In 1H21
Chart 11Bank Lending Rates Have Been Trending Down Despite Rising Policy Rate
Bank Lending Rates Have Been Trending Down Despite Rising Policy Rate
Bank Lending Rates Have Been Trending Down Despite Rising Policy Rate
Bottom Line: Odds are rising that the PBoC will continue to hike interest rates (short and medium-term) by the middle of next year. In turn, the rebound in Chinese government bond yields will resume early next year in the expectation of better economic conditions and policy tightening. Investment Conclusions The upward momentum in both the short and long-end of the yield curve will likely abate from now till year-end (Chart 12, top panel). As early as Q2 next year, however, a rebound in rate hike expectations will cause the curve to flatten. Historically, the yield curve has always moved in lockstep with the 3-month SHIBOR with a perfect reverse correlation (Chart 12, bottom panel). Given the extremely dovish stance among central banks (the Fed in particular), the upside in rate hikes by PBoC will be capped. We expect a less than 30bps rise in long-term bond yields. Tighter monetary policy is bullish for the RMB. Nonetheless, the risk-return profile of taking a direct bet on the RMB is not attractive in either direction. The CNY has appreciated against the USD by 5% since bottoming in May, and we doubt that there will be a meaningful upside in the RMB against the dollar leading up to the US election. Meanwhile, widening interest-rate differentials have further reduced the odds of any significant CNY/USD depreciation (Chart 13). Chart 12A Rebound In Rate Hike Expectations In 1H21 Will Flatten The Yield Curve
A Rebound In Rate Hike Expectations In 1H21 Will Flatten The Yield Curve
A Rebound In Rate Hike Expectations In 1H21 Will Flatten The Yield Curve
Chart 13Limited Upside For The RMB Against USD And On Trade-Weighted Basis
Limited Upside For The RMB Against USD And On Trade-Weighted Basis
Limited Upside For The RMB Against USD And On Trade-Weighted Basis
In this vein, the CNY/USD exchange rate will be dominated by broader dollar performance. Furthermore, it is highly unlikely that the PBoC will tolerate sharp, trade-weighted currency appreciations. A declining USD will also limit the upside in the trade-weighted RMB. The RMB may be less reflationary to businesses in China, but it will not become outright deflationary for the time being (Chart 13, middle and bottom panels). In terms of equities, we maintain our positive cyclical view on China's growth outlook. The PBoC will maintain its tightening bias, but this should not lead to major growth disappointments. We continue to expect Chinese domestic and investable equities to outperform in both absolute and relative terms, at least for the next six to nine months. Beyond the next six months, however, a more restrictive monetary policy should bring China’s economy closer to its trend growth in 2H21. Sectors such as technology and real estate, which benefit the most from easy liquidity conditions and strong economic growth, will be negatively and disproportionally impacted. Given their heavy weight in China’s investable equity market, we will probably trim our positions in investable stocks by the middle of next year. Jing Sima China Strategist jings@bcaresearch.com Footnotes 1 Please see BCA Research China Investment Strategy Weekly Report, "Don’t Chase China’s Bond Yields Lower", dated February 19, 2020, available at cis.bcareseach.com. 2 Please see BCA Research China Investment Strategy Weekly Report, "Taking The Pulse Of The People’s Congress", dated May 28, 2020, available at cis.bcareseach.com. 3 Please see BCA Research China Investment Strategy Weekly Report, "Three Questions Following The Coronacrisis", dated April 23, 2020, available at cis.bcareseach.com. Cyclical Investment Stance Equity Sector Recommendations
Highlights While we are bearish on the US dollar in the long run, the greenback is primed for a rebound in the near term. Consistently, commodities prices will relapse and EM currencies will depreciate versus the US dollar. Global growth stocks will correct further because they are overbought/over-owned and expensive. The rest of the equity market will relapse because its fundamentals are poor, especially given the renewed rise in new infection cases across Europe and the US. Feature Global financial markets are in the process of a reset. Several segments have been through very sharp and considerable movements in recent months, and these movements are starting to partially unwind. The US dollar will rebound, commodities prices will correct and global equities will continue selling off. In brief, EM risk assets and currencies are entering a period of weakness, which will eventually lead to buying opportunities. Inter-Linkages Between Fixed-Income, Currencies And Commodities Chart I-1A Reset In US Inflation Expectations And Real Rates Is Overdue
A Reset In US Inflation Expectations And Real Rates Is Overdue
A Reset In US Inflation Expectations And Real Rates Is Overdue
US inflation expectations have risen meaningfully, and US TIPS (real) yields have plummeted since April (Chart I-1). Consistent with plunging US real rates, the US dollar has sold off sharply (Chart I-1, bottom panel). Although our bias is that US inflation will rise in the coming years, for now, the rise in inflation expectations seems excessive. Given the tight correlation between oil prices and US breakeven inflation, as illustrated in the top panel of Chart I-1, lower crude prices will cause a drop in inflation expectations. Moreover, the absence of another large US fiscal stimulus will also lead to a downgrade in growth and inflation expectations. US nominal bond yields will likely remain largely range bound, and a drop in breakeven inflation will lead to higher real yields. The latter will help the US dollar to rebound from oversold levels, and EM currencies will depreciate against the dollar. In turn, a rebound in the greenback will be associated with lower commodities prices. Notably, investors’ net long positions in copper have become very elevated (Chart I-2). Investor sentiment on commodities in general is quite positive. Hence, from a contrarian perspective, commodities prices are primed for a pullback. In addition, Chinese imports of commodities will slow in the near term, reinforcing the correction in resources prices. China has evidently been stockpiling commodities, as its commodities imports have been considerably stronger than its underlying final demand. In particular, Chart I-3 demonstrates that mainland imports of copper, crude oil, steel and iron ore have been surging. Chinese imports of crude and industrial metals are likely to drop temporarily. Chart I-2Long Copper Is A Crowded Trade
Long Copper Is A Crowded Trade
Long Copper Is A Crowded Trade
Chart I-3China Has Been Stockpiling Commodities
China Has Been Stockpiling Commodities
China Has Been Stockpiling Commodities
China’s booming intake of commodities in recent months was stipulated by the country’s previously depleted commodity inventories, low prices and the availability of cheap bank financing. Granted commodity inventories have been replenished and resource prices are no longer low, Chinese imports of crude and industrial metals are likely to drop temporarily. That said, from a cyclical perspective, China’s economic recovery will continue, and final demand for resources will expand. Thus, we will see a material correction, not a crash, in commodities prices. EM credit spreads inversely correlate with commodities prices and currencies – EM sovereign and corporate credit spreads are shown as inverted on both panels of Chart I-4. As commodities prices retreat and the US dollar rebounds, EM credit markets will sell off. Chart I-4EM Credit Markets Will Weaken As EM Currencies And Commodities Sell Off
EM Credit Markets Will Weaken As EM Currencies And Commodities Sell Off
EM Credit Markets Will Weaken As EM Currencies And Commodities Sell Off
EM local currency bond yields might slightly back up as EM currencies depreciate and US real yields rebound. However, economic conditions in many EM countries outside China remain extremely weak, and inflation is very subdued. Hence, any back up in EM domestic bond yields will be limited. Bottom Line: While we are bearish on the US dollar in the long run, the greenback is primed for a rebound in the near term. Consistently, commodities prices will relapse and EM currencies will sell off versus the US dollar. Notably, oil prices, as well as several EM and DM currencies, have rolled over at technical levels which typically herald a major reversal (Chart I-5A and I-5B). Chart I-5AFacing A Major Resistance
Facing A Major Resistance
Facing A Major Resistance
Chart I-5BFacing A Major Resistance
Facing A Major Resistance
Facing A Major Resistance
Finally, EM fixed-income markets will experience a correction that will provide a buying opportunity. The Equity Correction: More To Go The correction in global share prices has further to run. Market leaders – growth stocks – remain overbought, and it is reasonable to expect that they will at least retest their 200-day moving averages. Meanwhile, the parts of the global equity universe hardest-hit during March have failed to break above their 200-day moving average. This can be interpreted as an indication that they have not yet entered a bull market. These include: EM ex-TMT1 and global value stocks as well as the US Value Line Geometric Composite Index (Chart I-6). In short, growth stocks will correct further because they are overbought/over-owned and expensive; the rest of the equity market will relapse because its fundamentals are poor, especially given the renewed rise in new infection cases across Europe and the US. Chart I-6These Stocks Have Not Entered A Bull Market Yet
These Stocks Have Not Entered A Bull Market Yet
These Stocks Have Not Entered A Bull Market Yet
Chart I-7Downside Risks To EM Equities
Downside Risks To EM Equities
Downside Risks To EM Equities
In addition, the following indicators also point to further selloff in EM and DM share prices. Our Risk-On / Safe-Haven currency ratio2 has been falling since June and continues pointing to lower EM share prices (Chart I-7). The EM and DM advance-decline lines have relapsed below zero indicating a deteriorating equity market breadth (Chart I-8). This heralds lower stock prices. As EM corporate bond yields rise due to either weaker EM currencies or lower commodities prices, as we argued above, EM share prices will tumble (Chart I-9). Chart I-8Deteriorating Breadth Points To Lower Share Prices
Deteriorating Breadth Points To Lower Share Prices
Deteriorating Breadth Points To Lower Share Prices
Chart I-9Rising EM Corporate Bond Yields Will Reinforce EM Equity Selloff
Rising EM Corporate Bond Yields Will Reinforce EM Equity Selloff
Rising EM Corporate Bond Yields Will Reinforce EM Equity Selloff
Bottom Line: Global and EM share prices are in a correction that has not run its course. Investment Strategy A meaningful setback in their EM currencies will lead us to recommend switching from receiving long-term rates to buying their cash local currency bonds (taking currency risks as well). EM Domestic Bonds: We continue recommending receiving 10-year swap rates in Mexico, Colombia, Russia, India, China, Korea and Malaysia. A meaningful setback in their EM currencies will lead us to recommend switching from receiving long-term rates to buying their cash local currency bonds (taking currency risks as well). EM Equities: Absolute-return investors should be cautious at the moment as EM share prices are set to deflate further. Within a global equity portfolio, we continue recommending a neutral allocation to EM. Better equity valuations in EM than in the US will be offset by a rebound in the US dollar, warranting a trading range in EM versus DM relative equity performance. Our country equity allocation within the EM universe is always presented at the end of our report (please refer to page 10). EM Exchange Rates: Even though we expect a meaningful rebound in the nominal broad trade-weighted US dollar, we believe the safe-haven currencies – such as the JPY, CHF and the euro – will outperform EM currencies. As such, we reiterate our strategy of shorting a basket of EM currencies versus an equally-weighted basket of JPY, CHF and the euro. Our short EM currency basket consists of BRL, CLP, ZAR, TRY, PHP, KRW and IDR. Finally, we recommend a neutral allocation to EM credit markets (US dollar bonds) versus US corporate credit. Absolute-return investors should accumulate this asset class on a weakness. Arthur Budaghyan Chief Emerging Markets Strategist arthurb@bcaresearch.com Footnotes 1Technology, media and telecom stocks excluding information technology (IT) sector before December 2018 and excluding IT, media & entertainment and internet & direct marketing retail as of December 2018 2Average of CAD, AUD, NZD, BRL, IDR, MXN, RUB, CLP & ZAR total return indices relative to average of JPY & CHF; rebased to 100 at January 2000 Equities Recommendations Currencies, Credit And Fixed-Income Recommendations
Highlights The global recovery has legs, but it will follow a stop-and-go pattern. Global fiscal policy will ultimately remain loose enough to create an appropriate counterweight to three major risks. Risk assets are still attractive on a 12-month investment horizon despite short-term dangers. The dollar cyclical downtrend will be tested, but it will prevail. 10-year Treasury yields will be range bound between 0.5% and 1%. Industrials, materials, gold and Japanese equities are attractive. Feature Chart I-1Ebbing Surprises
Ebbing Surprises
Ebbing Surprises
The S&P 500 correction remains minimal in the face of Washington’s inability to reach a much-needed fiscal compromise. This resilience reflects that economies in the G-10 and China have pleasantly surprised investors despite rolling second waves of infections across the world, fiscal policy paralysis and generalized unease (Chart I-1). Strong growth has fueled higher earnings expectations. Meanwhile, global central banks are promising to keep accommodative monetary conditions in place indefinitely, which has allowed valuations to balloon. The cyclical outlook for stocks remains attractive. Nonetheless, global equities have entered a period of heightened volatility and downside risk until year-end. The S&P 500 had overshot its fundamentals, but now the momentum of the economic surprise index is deteriorating and central banks have deployed their full arsenal. Investors are concerned by a lack of fiscal support and rising policy uncertainty created by the approaching US election in November. This nervousness will spark powerful fluctuations in stock prices. Avoid Binary Judgments The global economy is at a complex juncture, buffeted between forces that will either propel its recovery or sink it. The positives will predominate in this contest, which suggests that the business cycle remains in an upswing, albeit, a volatile one. The Good… Five main positive forces underpin the nascent economic bounce and thus, the profit outlook. Pent-up demand and the inventory cycle: The economy is making up for the collapse of both cyclical spending and production at the end of Q1 and into Q2. Inventories of finished products have sharply declined in the past six months. In the US, rapidly shrinking inventories are supercharging the uptick in the new-orders-to inventories ratio. Similar dynamics are occurring in China, Europe and Japan (Chart I-2). China’s stimulus-driven recovery will provide a crucial boost to the global business cycle. The Chinese engine is revving: An aggressive stimulus campaign followed Beijing’s swift actions to contain the domestic spread of COVID-19. China’s policies are generating economic dividends that will percolate through the global industrial and commodity sectors. Sales of floor space are already expanding by 40% annually, driven by a 60% jump in Tier-1 cities. In response, construction is forming a trough. Moreover, the large issuance of local government bonds is financing an increase in infrastructure spending. Thanks to an upturn in building activity, the equipment purchases, construction and installation components of China’s real estate investment are all bottoming (Chart I-3). Chart I-2The Inventory Adjustment Is Advanced
The Inventory Adjustment Is Advanced
The Inventory Adjustment Is Advanced
Chart I-3China: A Policy-Driven Recovery
China: A Policy-Driven Recovery
China: A Policy-Driven Recovery
BCA Research’s Emerging Markets team recently showed that the expenditure rebound is not limited to the real estate sector.1 Vehicle sales are healthier and tech infrastructure outlays are reaccelerating (Chart I-4). Retail sales also moved back into positive territory in August. Thus, China’s cyclical spending has regained its footing. China’s stimulus-driven recovery will provide a crucial boost to the global business cycle. Beijing’s unconstrained credit easing is the source for the turnaround in China’s cyclical and capital expenditures outlook. Hence, the sharp increase in China’s credit and fiscal impulse foreshadows a powerful rebound in imports and in global industrial production because Chinese capex demands plentiful commodities, industrial goods and capital goods (Chart I-5). Chart I-4More Chinese Recovery
More Chinese Recovery
More Chinese Recovery
Chart I-5Chinese Stimulus Matters Globally
Chinese Stimulus Matters Globally
Chinese Stimulus Matters Globally
Chart I-6Robust American Households
Robust American Households
Robust American Households
Consumer balance sheets are robust: Unlike the aftermath of the Great Financial Crisis (GFC), US households do not need to rebuild destroyed balance sheets. This time around, the low level of household debt and the limited hit to net worth has allowed consumers to withstand an even greater income shock than during the GFC (Chart I-6). As a result, expenditures are rebounding much quicker than most investors anticipated six months ago. An extremely vigorous policy response: Policymakers in the G-10 did not wait to deploy their economic arsenal when the economic crisis erupted. Governments have racked up their largest budget deficits since World War II (Chart I-7). Monetary authorities also moved quickly to ease financial conditions. Broad money supply growth among advanced economies has skyrocketed, global corporate bond issuance stands at a record $2.6 trillion, and excess liquidity points to continued industrial production strength. In the US, our Financial Liquidity Index is climbing higher alongside the ISM Manufacturing Index. Even the performance of EM carry trades (a financial variable that shows whether funds are flowing into EM economies) is consistent with a stabilization in global IP (Chart I-8). Chart I-7Exceptional Fiscal Stimulus
October 2020
October 2020
Chart I-8Liquidity Helps Growth
Liquidity Helps Growth
Liquidity Helps Growth
Stronger industrial production models: Our industrial production models for the major advanced economies are all moving up after experiencing massive collapses this past spring. These models encapsulate many influences and their uniformly positive message is very encouraging. In all likelihood, a virtuous cycle has been unleashed. As IP recovers, then so will income, which will fuel the demand expansion and thus, more production. We expect the models to rise even more in the coming quarters. … And The Bad Three near-term concerns still hang over the global economy. Hence, while Q3 is set to deliver stunningly strong numbers boosted by advantageous base effects, growth will recede in Q4.2 While fiscal policy was on point in late Q1 and Q2, Washington’s performance in the past three months has been questionable. Fiscal stimulus hiccups in the US: While fiscal policy was on point in late Q1 and Q2, Washington’s performance in the past three months has been questionable. The CARES Act’s expanded $600 per week unemployment benefit lapsed at the end of July. This benefit, along with one-time $1200 stimulus checks, pushed disposable income higher by 7.5% during the past five months. Thankfully, households managed to save a large proportion of the government support. Consequently, consumption remained strong in August, despite limited help from the federal government. The short-term outlook for consumption is fragile because households cannot continue to tap into their savings. In August, US retail sales disappointed. Calculations by our US fixed-income strategist show that in the coming months, Washington must spend almost $800 billion just for consumer expenditures to match its growth rate of -3% recorded at the depth of the last recession.3 Moreover, a potential wave of eviction of renters looms. Thus, the economy could relapse violently as long as Democrats and Republicans remain apart on a compromise for a new stimulus bill. The upcoming Senate confirmation process to fill the Supreme Court seat left vacant by Ruth Bader-Ginsburg’s passing only complicates the passage of these needed spending measures. Chart I-9Permanent Joblessness Is A Threat
Permanent Joblessness Is A Threat
Permanent Joblessness Is A Threat
Rising permanent job losses: The US unemployment rate has fallen from a high of 14.7% in April to 8.4% in August. This bright picture hides a negative development. The number of permanent job losses has quickly escalated, reaching 4.1 million last month (Chart I-9). Moreover, continuing unemployment insurance claims are barely declining. Mounting long-term unemployment is not associated with an economic recovery. Furthermore, permanent joblessness could easily push down consumer confidence, which would lift the household savings rate and hurt consumption. This problem is not unique to the US. In the UK, an unemployment cliff looms on October 31 when there will be an end to government schemes allowing firms to receive funds as long as they do not permanently severe their links with furloughed workers. The UK’s unemployment rate of only 4.1% is bound to surge when these support measures disappear. In continental Europe, similar stimulus programs could also be rescinded this fall. The weak health of small businesses accentuates risks to the labor market. In the US, 21% of very small firms will run out of money by the end of the year if the government does not dispense supplemental help. Closing these businesses will push up permanent joblessness even more and thus, further weaken consumption. Either weaker stock prices or a deterioration in the economy will be the catalyst for Washington to strike a deal. COVID-19 and the service sector: Many major countries are now fighting a second wave of infections, which may surpass the first wave. Many schools have re-opened and winter in the Northern Hemisphere is approaching (which will force people to congregate inside), bringing with it the regular flu season. Chart I-10The Service Sector Is The Weakest Link
The Service Sector Is The Weakest Link
The Service Sector Is The Weakest Link
This epidemiological backdrop still represents an elevated hurdle to overcome for large swaths of the service sector, especially leisure, food, hospitality and travel. While these industries account for only 10% of GDP in the US, they contribute roughly 25% of employment. If governments toughen social distancing rules and implement localized lockdowns, then the service sector will act as a drag on GDP and employment (Chart I-10). Which Side Will Win? Ultimately, we anticipate that the tailwinds supporting the economy will overcome the headwinds. On the policy front, governments will pass more stimulus. Our Geopolitical strategists believe that the following constraints will force greater spending in the US by mid-October: The Democrats face an election and they want to deliver benefits to their voters. The White House needs to prevent financial turmoil in the final month of the campaign. If the Republicans fail to agree on a second stimulus bill, there is a significant risk they will lose the White House and their majority in the Senate. Chart I-11No Constraints There
No Constraints There
No Constraints There
The package should total nearly $2 trillion. The Democrats have reduced their demands to $2.3 trillion, while the GOP has moved up its offer to $1.3 trillion. Moreover, a bi-partisan “Problem Solvers Caucus” has emerged in Congress with a $1.5 trillion bill proposal that the White House is considering. Either weaker stock prices or a deterioration in the economy will be the catalyst for Washington to strike a deal. Fiscal stimulus will also remain generous outside the US. In Europe, France is providing an attractive template. On September 3, the Macron government announced an additional EUR100 billion stimulus package, whereby 40% of the funds would come from the common bond issuance recently announced by the EU. In Japan, Prime Minister Yoshihide Suga will continue the policies of his predecessor. Finally, in emerging economies, the absence of inflation and well-behaved sovereign yields and spreads have provided room for local authorities to alleviate any economic pain created by COVID-19 (Chart I-11). Monetary policy will remain extremely stimulative. Central banks will not meaningfully ease policy further, but our monetary indicators are already at their most accommodative levels on record (see Section III). Plus, the US Federal Reserve’s switch to an average-inflation target last month raised the bar that inflation must reach before the FOMC tightens policy. The European Central Bank is contemplating a similar change. Furthermore, the continued woes of service-sector employment constitute another hurdle to clear before central banks can remove accommodation. Chart I-12US Housing Is The New Locomotive
US Housing Is The New Locomotive
US Housing Is The New Locomotive
Finally, COVID-19 currently has a limited impact on the lion’s share of cyclical spending, which will continue to recover. Cyclical sectors include residential investment, business capex and spending on consumer durable goods. In the US, they account for only 20% GDP, but they generate 70% of the variance in its fluctuations. These sectors are heavily geared toward manufacturing, which is crucial for cyclical spending. Importantly, the robustness of household balance sheets and record low borrowing costs have allowed mortgage applications for purchases to rise sharply, home sales to recover and homebuilder confidence to surge to an all-time high (Chart I-12). Hence, residential activity will remain an important driver of domestic demand, especially because residential investment also often galvanizes other forms of cyclical spending. Bottom Line: The global economy remains buffeted between five positive forces that bolster the recovery and three negatives that hamper it. Ultimately, the authorities will have no choice but to add supplementary fiscal stimulus and monetary conditions will remain extremely accommodative. The recovery will then slow from its heady Q3 pace, but cyclical spending will still power ahead next year. In a nutshell, the economy will not be weaker nor much stronger than the base case presented by the IMF. Investment Implications Our somewhat upbeat position on the global economic outlook remains consistent with a favorable stance toward risk assets in the next 12 to 18 months, because adverse economic outcomes are unlikely to materialize, not because growth will be stronger than expected. Nonetheless, we are conscious that the market place remains fraught with many risks and that growth will stay volatile. As a result, episodic violent corrections will punctuate the upward path in risk asset. We are currently in the midst of such a correction. Chart I-13The Dollar Remains Expensive
The Dollar Remains Expensive
The Dollar Remains Expensive
The Dollar We are still bearish on the dollar on a cyclical investment horizon. The USD remains expensive despite its recent weakness. Against major currencies, the dollar has climbed by 30% since 2008. On a broad, trade-weighted basis, it is up 36% in the same period. Therefore, the US currency trades 15% above its Purchasing Power Parity equilibrium, the most among the major currencies (Chart I-13).4 The US balance of payments picture is becoming increasingly problematic for the dollar. After a surge this spring, US private-sector savings are set to decline. Low interest rates and asset bubbles will increasingly incentivize consumption, while rising capex intentions point to a drop in the corporate sector’s savings. Given that we anticipate the fiscal balance to remain negative in the coming years, the national savings rate will sag, which will worsen the US current account (Chart I-14).5 In other words, the US twin deficits will balloon as the recovery progresses. Despite our bearish view on the dollar, our base case still anticipates a short-term bounce in the USD. The US capital account will not offset the impact on the dollar of a wider current account deficit. US real interest rate differentials have collapsed and foreigners have shunned the Treasury market (Chart I-15, top panel). The Fed conducts the loosest monetary policy among the major economies, which is pushing the US shadow rate lower versus the euro area. Such a trend is euro bullish (dollar bearish) because it draws capital outside of the US economy (Chart I-15, middle panel). Additionally, the USD’s counter cyclicality will be its final undoing during the global economic recovery and will create another hurdle for the US capital account. Chart I-14A Dollar-Bearish Savings Backdrop
A Dollar-Bearish Savings Backdrop
A Dollar-Bearish Savings Backdrop
Chart I-15No Love For The Greenback
No Love For The Greenback
No Love For The Greenback
Chart I-16The Dollar Is Ripe For A Rebound
The Dollar Is Ripe For A Rebound
The Dollar Is Ripe For A Rebound
Despite our bearish view on the dollar, our base case still anticipates a short-term bounce in the USD. Our dollar capitulation index is overextended and if stocks experience heightened volatility (see equities on page 32), then a safe-haven asset such as the greenback will catch a temporary bid (Chart I-16). A correction in the euro to 1.15-1.14 is a reasonable target. Government Bonds Our reluctance to overweight bonds or duration is intact. The BCA US 10-Year Government Bond Valuation index is consistent with higher yields in the next 12 months (Chart I-17). Moreover, bond prices are losing momentum, which creates a technical vulnerability for this asset class. The economy is the potential catalyst to expose the underlying valuation and technical risks of government bonds. Inflation is still a distant danger, but our BCA Pipeline Inflation indicator highlights that deflationary pressures are receding (Chart I-18, top panel). Likewise, our Nominal Cyclical Spending proxy already warns that yields have upside; and an expanding recovery implies that bond-bearish pressures will progress (Chart I-18, bottom panel). Chart I-17The Traitorous Treasury Market
The Traitorous Treasury Market
The Traitorous Treasury Market
Chart I-18Problems For Treasurys
Problems For Treasurys
Problems For Treasurys
The Fed’s switch to an average inflation target is also consistent with higher long bond yields. The Fed’s newfound tolerance for loftier inflation should lift long-term inflation expectations and medium-term inflation uncertainty, especially given current fiscal trends. Higher long-term inflation expectations and inflation uncertainty have the potential to generate a broader range of policy-rate outcomes, therefore they will also normalize the extraordinarily depressed term premium and lead to a steeper yield curve (Chart I-19). Thus, 10- and 30-year yields have room to increase even if current short rates remain anchored near their lower bounds for the next three years. Over the next 12 months, 10- and 30-year Treasury yields will be capped at 1% and 2%, respectively. The expected yield upside will be limited in the next year. While investors should anticipate some curve steepening, the most violent selloffs only take hold of the Treasury market when the Fed generates hawkish surprises, which is very unlikely in 2021 (Chart I-20). Moreover, the stock market creates its own constraints. As our European Investment strategist has reasoned, higher yields will hurt growth stocks that derive a disproportionate share of their intrinsic value from long-term cash flows.6 If bond prices fall too quickly, then these growth stocks would plunge and drag down the equity market. In essence, elevated bond yields can generate a deflationary shock that undoes the primary reason why yields would rise. Therefore, over the next 12 months, 10- and 30-year Treasury yields will be capped at 1% and 2%, respectively. Chart I-19Average-Inflation Targeting Hurts Long-Dated Bonds
Average-Inflation Targeting Hurts Long-Dated Bonds
Average-Inflation Targeting Hurts Long-Dated Bonds
Chart I-20Limited Upside For Yields
Limited Upside For Yields
Limited Upside For Yields
Equities Several factors underpin our positive stance on global equities in the next 12 months. The lack of investment alternatives or TINA (There Is No Alternative) is a crucial support under stock prices. As BCA Research’s Global Investment Strategy service recently discussed, the S&P 500’s dividend yield stands at around 100 basis points above 10-year Treasury yields.7 Conservatively assuming that dividends per share remain constant in the next 10 years and inflation averages 2%, the real value of the US equity benchmark must decline by 25% during that period before it underperforms Treasurys. Given that gaps between dividend yields and bond yields are even larger outside the US, many foreign bourses must experience deeper real depreciation before they underperform their respective bond markets (Chart I-21). Corporate pricing power is returning, which is positive for the earnings outlook. The ability of firms to boost prices will be enhanced by the combination of a weak dollar, declining deflationary forces, rebounding commodity prices and a surge in the sales-to-inventory ratio. The pickup in pricing power is broadly based; 59% of the S&P 500 groups analyzed by our US equity strategist are experiencing mounting prices.8 When higher pricing power meets mending sales volumes, operating leverage allows profit margins to expand, which lifts earnings per share and stock prices (Chart I-22). Chart I-21TINA Flatters Stocks
TINA Flatters Stocks
TINA Flatters Stocks
Chart I-22Corporate Pricing Power Is Coming Back
Corporate Pricing Power Is Coming Back
Corporate Pricing Power Is Coming Back
Chart I-23Liquidity Underpins This Rally
Liquidity Underpins This Rally
Liquidity Underpins This Rally
The global monetary environment also supports stocks. The swell in our US Financial Liquidity index is consistent with additional equity gains because it forecasts stronger economic activity (Chart I-23). Expectations of an upswing in the business cycle let earnings forecasts climb and can also improve the anticipated growth rate of long-term earnings while encouraging risk-taking, which compresses the equity risk premium. Moreover, generous liquidity limits the upside to real yields, which further boosts equity multiples. Another consequence of ample liquidity is a marked increase in corporate actions. Firms engage in greater M&A activity, which can generate gains in accounting earnings while withdrawing equity from the market. Businesses around the world have tapped the corporate bond market at a record pace this year, creating both large war chests and the capacity to deploy funds for capex. Higher capex boosts demand and cyclical spending, which creates a positive environment for earnings. Our positive cyclical view on stocks does not preclude a period of heightened volatility and further downside risk in the coming three months. The US and G-10 economic surprise indices are elevated, but they are losing momentum. This deterioration in the second derivative of activity is problematic when there is a non-trivial chance of a policy error in Washington. Importantly, the upcoming US election will raise questions about the regulatory environment for the two market heavyweights: technology and healthcare stocks. As we wrote last month, a shift of leadership away from these sectors will translate into episodic corrections for stocks at large.9 Additionally, investors must price in the risk of gridlock in Washington. If Senate Republicans are reluctant to write a check while an unpopular President Trump faces an imminent election, then their willingness to expand spending if Biden clinches the White House will be nonexistent. A complete refusal to add fiscal stimulus would nearly guarantee a double-dip recession. Equities must embed a risk premium against this scenario ahead of the election. Therefore, the S&P 500 is likely to test 3000 in the coming weeks before rebounding. Our positive cyclical view on stocks does not preclude a period of heightened volatility and further downside risk in the coming three months. Sector Considerations We are positive on the medium-term outlook for value versus growth stocks. The cheapness of value versus growth makes the former attractive, but is not enough to allocate funds to it aggressively. Instead, our bias takes root in our economic view. The forward earnings of global value stocks are very depressed relative to growth stocks. However, the ratio of value EPS to growth EPS is extremely pro-cyclical. Thus, our positive stance on global growth is consistent with a rebound in relative profits that will help value equities (Chart I-24, top panel). Moreover, higher yields correlate with a re-rating of relative equity multiples in favor of value stocks, which are less sensitive to rising discount rates than their growth counterparts (Chart I-24, bottom panel). In this context, we continue to favor industrials and materials; consumer discretionary stocks are also appealing.10 Investors should underweight the US, especially in common currency terms. Gold mining equities remain attractive long-term investments. In the near term, as long as the dollar counter-trend bounce continues, gold will purge its excess froth (Chart I-25, top panel). Nonetheless, our trend indicator remains positive for gold (Chart I-25, bottom panel). Moreover, if real yields start to stagnate at their current low levels, then gold will lose a tailwind but it will not develop a new handicap. In this context, an increase in inflation expectations will elevate gold prices (Table I-1). Other bullish cyclical forces underpinning gold include the dollar’s long-term bear market, limited supply expansion and the diversification of EM central banks away from Treasurys into gold. This positive backdrop should allow the attractive relative valuation of global gold mining firms and their improving operating metric (courtesy of rigorous cash flow management and limited expansion plans) to blossom into more equity price outperformance over the next year or so. Chart I-24Long Growth vs Value: A Cyclical Trade
Long Growth vs Value: A Cyclical Trade
Long Growth vs Value: A Cyclical Trade
Chart I-25A Shakeout For The Gold Bull Market
A Shakeout For The Gold Bull Market
A Shakeout For The Gold Bull Market
Table I-1Gold's Response To Yields
October 2020
October 2020
Finally, Japan has become our favorite equity market for the next 9 to 12 months. Japanese stocks possess the perfect equity exposure to play the themes we espouse because they greatly overweight industrials and traditional consumer discretionary stocks at the expense of tech and healthcare (Table I-2). Moreover, we like auto stocks, an industry well represented in the Japanese bourse, which will benefit from a weak trade-weighted yen.11 Lastly, Japanese stock prices incorporate a large margin of safety. Most sectors in Japan trade at a significant discount to their European and US counterparts (Chart I-26). Nevertheless, it is too early to make a structural bet on Japan because its productivity problems and persistent deflation generate a long-lasting drag on corporate profitability. Table I-2Japan Possesses An Attractive Sector Composition
October 2020
October 2020
Chart I-26Japan Is A Cheap Recovery Bet
October 2020
October 2020
Section II presents a thought experiment by our Chief US Equity Strategist, Anastasios Avgeriou, which details the feasibility of a doubling of the S&P 500 over the coming 8 years. I trust you will find this report based on historical evidences thought-provoking. Mathieu Savary Vice President The Bank Credit Analyst September 24, 2020 Next Report: October 29, 2020 II. SPX 7000 We present a thought experiment for the next eight years. 7000 constitutes a reasonable long-term target for the S&P 500. A doubling of the S&P 500 over the coming eight years is in line with the historical experience. Monetary policy is unlikely to tighten meaningfully, which will allow multiples to remain elevated Earnings per share can rise to $310 by 2028. Market technicals are also consistent with significant long-term gains for stocks. Chart II-1Prolonged ZIRP Neither Eliminates Corrections...
Prolonged ZIRP Neither Eliminates Corrections...
Prolonged ZIRP Neither Eliminates Corrections...
Our structural target is neither a joke nor a marketing ploy. And yes, it really does read SPX 7000! This is our S&P 500 target for the year 2028. A new business cycle has commenced and with it a fresh bull market. Our secular US equity market view is bullish. Our readers can fault us for our optimistic view on the world. But we live by the Buffett maxim that “there are no short sellers in the Forbes Billionaires list.” What gives us confidence in this prima facie hyperbolic market view? The Fed’s explicit acceptance that it is ready to incur inflation risk, cementing the fed funds rate near the zero-lower bound for as long as the eye see. In the last cycle, it took the Fed seven years to lift the fed funds rate from zero, a move that ended being judged as premature and forced the Yellen-led Fed to pause for another year (bottom panel, Chart II-1). Seven years. As such, there is a good chance the Fed will stay put until the year 2028, another election year. Even if it ultimately raises interest rates faster due to an overheated economy goosed up on the sweet nectar of fiscal largesse, it is highly likely to be behind the curve. Before we move on to justifying our target, some observations on ZIRP are in order. First, the Fed’s unorthodox monetary policy (QE and ZIRP) in the last cycle did not prevent stock market corrections, including a near 20% fall in 2011 (top panel, Chart II-1). In other words, we do not expect smooth sailing or a 45-degree angle line in the SPX heading to 2028. Rather, an era of volatility with a plethora of sizable corrections is upon us, but the path of least resistance will be higher. Make no mistake, we are in a “buy the dip” market now. Similar to 2008-2015, there will be a lot of fits and starts and a number of mini economic cycles will develop. Chart II-2 highlights that the ISM oscillated violently during the ZIRP years and so did equity momentum and the 10-year Treasury yield. Granted, the Fed managed to suppress economic volatility as real GDP averaged ~2%/annum in the aftermath of the GFC, but mini economic cycles and profit growth scares did not disappear (top panel, Chart II-3). Chart II-2...Nor Mini Economic Cycles
...Nor Mini Economic Cycles
...Nor Mini Economic Cycles
Chart II-3"Lowflation"/Disinflation Has Been The Story Of The Past 30 Years
"Lowflation"/Disinflation Has Been The Story Of The Past 30 Years
"Lowflation"/Disinflation Has Been The Story Of The Past 30 Years
Importantly, while the 10-year Treasury yield moved with the ebbs and flows of the ISM manufacturing survey’s readings, it remained in a downtrend and every bond market selloff proved a buying opportunity in the era of ZIRP (third panel, Chart II-2). What the Fed failed to generate was inflation – of either the CPI or PCE deflator variety. In fact, the Fed has not seen core PCE price inflation overshoot 2.5% since the early 1990s (bottom panel, Chart II-3). Another feature of the ZIRP years in the last cycle was that early on easy monetary policy coincided with easy fiscal policy, as was warranted for the first few years post the GFC. Subsequently, fiscal thrust increased starting in 2016 counterbalancing the Fed’s interest rate hikes. Despite all that fiscal easing, real GDP growth peaked at 3% in 2018 before decelerating last year, raising a question mark about the long-term health of the US economy, a question to be answered in a future Special Report. Frequent readers of US Equity Strategy know our long-held view that the two primary equity market drivers have been easy fiscal and monetary policies since the March carnage. Looking ahead, the Fed has cemented the view that easy monetary policy will stay with us for quite some time. While the jury is still out on fiscal policy, it appears at the moment that profligacy has staying power as no party in Washington is campaigning on austerity or worrying about paying down the debt (save for the lone voice of the Kentucky Senator Rand Paul). The Buenos Aires Consensus is a paradigm shift, and the most important long-term consequence will be higher inflation. The US has abandoned the guardrails on populism established by the Washington Consensus – countercyclical fiscal policy, independent central banking, free trade, laissez-faire economic policy – and has adopted something… different. A new Consensus. These are extremely potent macro forces and given that there is a lag between the time both easy monetary and loose fiscal policies hit the economy, their effects will be long lasting. Especially given that they are now synchronized – unlike for large periods of the previous cycle – and undertaken at a much greater order of magnitude than after the GFC. Table II-1
October 2020
October 2020
With that macro backdrop in mind, let us circle back to our 7000 SPX target. A fresh bull market has commenced and we consider the breakout above the previous cycle’s highs as its starting point. In August, the SPX surpassed the February 19, 2020 highs, giving birth to the new bull market. Using empirical evidence since the late-1950s we conclude that, on average, the SPX doubles from its breakout point (Table II-1). This gives us the SPX 7000 reading before the new bull is slayed in the plaza de toros of economic cycles. While this qualitative analysis is enticing, ultimately earnings have to deliver in order to justify the equity market’s appreciation. Put differently, easy fiscal and monetary policies the world over will deliver EPS inflation. On the quantitative EPS front, we first turn to the reconstructed S&P 500 earnings back to the late-1920s. On average, EPS have grown by 7.5%/annum, effectively doubling every decade (Chart II-4). Chart II-4Average Annual EPS Growth Since 1920s = 7.5%
Average Annual EPS Growth Since 1920s = 7.5%
Average Annual EPS Growth Since 1920s = 7.5%
More recently, using I/B/E/S data, there have been four distinct EPS growth periods over the past four decades with different durations. From trough-to-peak, EPS have enjoyed an average CAGR of over 10% (top panel, Chart II-5). Chart II-5EPS Can Double In Next Eight Years
EPS Can Double In Next Eight Years
EPS Can Double In Next Eight Years
The current trough in forward EPS stands just shy of $140. Applying the average CAGR until 2028 results in a $310 EPS figure. This is our starting point of our EPS sensitivity analysis. Assigning the current forward multiple equates to an SPX terminal value of over 7000. Table II-2 showcases different EPS and forward P/E multiple permutations with the grey shaded area representing our tight range of peak cycle multiples and peak EPS estimates. Table II-2SPX EPS & Multiple Sensitivity
October 2020
October 2020
With regard to what is currently priced in by sell side analysts, the 5-year forward EPS growth rate – the longest duration estimate available – is near a trough reading of 10%. The historical mean is 12% since 1985, with a range of 19% near the dotcom bubble peak and a trough of 9% at the depths of the 2016 manufacturing recession (bottom panel, Chart II-5). A few words on presidential cycles are relevant given our structural bullish equity market view. We first noticed Tables II-3 & II-4 in the WSJ in late-2016 and we have corrected some minor mistakes and updated them filling in the gaps. Drawdowns are frequent during term presidencies12 dating back to Hoover. Table II-3Every Presidency Experiences Drawdowns
October 2020
October 2020
Table II-4S&P 500 Returns During Presidential Terms
October 2020
October 2020
What is truly remarkable, however, is that since the late-1920s only three term presidencies ended up in the red. What the WSJ article did not mention was that in all three market declines GOP presidents were at the helm and had taken over at/or near all-time highs in the SPX! This represents a risk to our SPX 7000 view. If President Trump wins the upcoming election, given the recent modest recovery in the polling, he could meet the same fate as his Republican predecessors. Our sister Geopolitical Strategy service still assigns 35% probability for the incumbent to remain in office, a solid figure that suggests the race remains close. Importantly, while we believe a transition to a Democratic president will be tumultuous as we have been cautioning investors recently, a Biden presidency along with the possibility of a “Blue Wave” will bode well for the long-term prospects of the US equity market, if history at least rhymes. BCA’s Geopolitical strategist Matt Gertken assigns 65% odds to a Biden win and 55% to a Blue trifecta. Finally, on a technical note, the recent megaphone formation has stirred a lot of debate among technical analysts in the blogosphere and is eerily reminiscent of a similar formation that lasted from 1965 until 1975. Typically, these megaphone formations get resolved/completed by a diamond formation (Chart II-6). Chart II-6Of Megaphones And Diamonds
Of Megaphones And Diamonds
Of Megaphones And Diamonds
Chart II-7Diamond Base Is Long Term Bullish
Diamond Base Is Long Term Bullish
Diamond Base Is Long Term Bullish
While this points to a selloff in the broad equity market in the near-term, which is in accordance with our tactically cautious view (please see the last section of this Weekly Report), it is very bullish for the long-term, as equities catapult higher from such a diamond base formation (Chart II-7). In other words, odds are much higher that the SPX will hit 7000 first, before it ever revisits 2200. Adding it all up, we are introducing a structurally constructive US equity market view with an SPX 7000 target for year 2028 on the back of peak cycle EPS of $310 and peak cycle P/E multiple of 23. Anastasios Avgeriou US Equity Strategist III. Indicators And Reference Charts The stock market correction has begun in earnest. The S&P 500 is suffering as the economic surprise index deteriorates, the dollar rebounds and uncertainty surrounding fiscal policy takes center stage. The deteriorating performances of silver, investment grade bonds, small-cap stocks, EM currencies and the AUD/CHF cross confirm that the equity market will suffer more downside. Moreover, the number of NYSE stocks trading above their 10-week moving average is in free-fall but remain well above levels consistent with a bottom. Despite these short-term headwinds, the main pillar supporting the rally remains intact: global monetary conditions are highly accommodative. The shift to an average-inflation target by the Fed, which the ECB is also considering, buttresses this dovish stance further as inflation will have to rise even more than normally before the major global central banks tighten policy. Moreover, outside of the US, fiscal policy remains accommodative. Even in the US, we expect more stimulus to come through before the November election. Our cyclical indicators confirm the positive backdrop for stocks. Our Monetary Indicator has softened but it remains at the top of its pre-COVID-19 distribution, which balances the expensiveness of the market flashed by our Valuation Indicator. Putting those forces together, our Intermediate-Term Indicator and our Revealed Preference Indicator strongly argues in favor or staying invested in equities. When weighing the short-term negative forces against the cyclical positives, we expect the S&P 500 to find a floor around 3000. At this level, the froth highlighted by our Speculation Indicator will have dissipated. Despite the equity correction, bonds remain extremely unappealing. Our Bond Valuation Index shows Treasurys as prohibitively expensive and our Composite Technical Indicator continues to lose momentum. Moreover, our Cyclical Bond Indicator has turned higher and is now flashing an outright sell signal. In effect, with rates near their lower bound, the market understands that yields have little room to decline and thus bonds seems to be losing their ability to hedge equity risk. Thus, bonds yields are unlikely to rise as stocks correct, but their lack of downside right now suggests that when equities regain their footing, 10-year Treasury yields could quickly move higher toward 1%. The dollar countertrend rally that we expected last month has begun. So far, the dollar has still not purged its oversold conditions and the deterioration in risk sentiment around the world will likely result in additional upside for the greenback. Ultimately, this rally will be temporary. The global economic recovery has just begun, the US balance of payments picture is deteriorating and the USD trades at a large premium to its purchasing power parity equilibrium. Commodities remain in a bull market, but their current correction has further to run. As investors absorb the deterioration in economic surprises and risk sentiment declines, the overbought commodity complex will remain under downward pressure. The strength in the US dollar is creating an additional powerful headwind against commodities. Gold’s decline has been particularly noteworthy. Gold remains above its short-term fair value, hence its vulnerability to the dollar and to the decline in our Monetary Indicator is particularly pronounced. A stabilization in gold and silver prices is required before the rest of the commodity complex and stocks can find a firmer footing. Stronger precious metals would indicate that the deterioration in liquidity visible at the margin is ending. It is likely to be contemporary with the passage of a new fiscal stimulus bill in the US. EQUITIES: Chart III-1US Equity Indicators
US Equity Indicators
US Equity Indicators
Chart III-2Willingness To Pay For Risk
Willingness To Pay For Risk
Willingness To Pay For Risk
Chart III-3US Equity Sentiment Indicators
US Equity Sentiment Indicators
US Equity Sentiment Indicators
Chart III-4Revealed Preference Indicator
Revealed Preference Indicator
Revealed Preference Indicator
Chart III-5US Stock Market Valuation
US Stock Market Valuation
US Stock Market Valuation
Chart III-6US Earnings
US Earnings
US Earnings
Chart III-7Global Stock Market And Earnings: Relative Performance
Global Stock Market And Earnings: Relative Performance
Global Stock Market And Earnings: Relative Performance
Chart III-8Global Stock Market And Earnings: Relative Performance
Global Stock Market And Earnings: Relative Performance
Global Stock Market And Earnings: Relative Performance
FIXED INCOME: Chart III-9US Treasurys And Valuations
US Treasurys And Valuations
US Treasurys And Valuations
Chart III-10Yield Curve Slopes
Yield Curve Slopes
Yield Curve Slopes
Chart III-11Selected US Bond Yields
Selected US Bond Yields
Selected US Bond Yields
Chart III-1210-Year Treasury Yield Components
10-Year Treasury Yield Components
10-Year Treasury Yield Components
Chart III-13US Corporate Bonds And Health Monitor
US Corporate Bonds And Health Monitor
US Corporate Bonds And Health Monitor
Chart III-14Global Bonds: Developed Markets
Global Bonds: Developed Markets
Global Bonds: Developed Markets
Chart III-15Global Bonds: Emerging Markets
Global Bonds: Emerging Markets
Global Bonds: Emerging Markets
CURRENCIES: Chart III-16US Dollar And PPP
US Dollar And PPP
US Dollar And PPP
Chart III-17US Dollar And Indicator
US Dollar And Indicator
US Dollar And Indicator
Chart III-18US Dollar Fundamentals
US Dollar Fundamentals
US Dollar Fundamentals
Chart III-19Japanese Yen Technicals
Japanese Yen Technicals
Japanese Yen Technicals
Chart III-20Euro Technicals
Euro Technicals
Euro Technicals
Chart III-21Euro/Yen Technicals
Euro/Yen Technicals
Euro/Yen Technicals
Chart III-22Euro/Pound Technicals
Euro/Pound Technicals
Euro/Pound Technicals
COMMODITIES: Chart III-23Broad Commodity Indicators
Broad Commodity Indicators
Broad Commodity Indicators
Chart III-24Commodity Prices
Commodity Prices
Commodity Prices
Chart III-25Commodity Prices
Commodity Prices
Commodity Prices
Chart III-26Commodity Sentiment
Commodity Sentiment
Commodity Sentiment
Chart III-27Speculative Positioning
Speculative Positioning
Speculative Positioning
ECONOMY: Chart III-28US And Global Macro Backdrop
US And Global Macro Backdrop
US And Global Macro Backdrop
Chart III-29US Macro Snapshot
US Macro Snapshot
US Macro Snapshot
Chart III-30US Growth Outlook
US Growth Outlook
US Growth Outlook
Chart III-31US Cyclical Spending
US Cyclical Spending
US Cyclical Spending
Chart III-32US Labor Market
US Labor Market
US Labor Market
Chart III-33US Consumption
US Consumption
US Consumption
Chart III-34US Housing
US Housing
US Housing
Chart III-35US Debt And Deleveraging
US Debt And Deleveraging
US Debt And Deleveraging
Chart III-36US Financial Conditions
US Financial Conditions
US Financial Conditions
Chart III-37Global Economic Snapshot: Europe
Global Economic Snapshot: Europe
Global Economic Snapshot: Europe
Chart III-38Global Economic Snapshot: China
Global Economic Snapshot: China
Global Economic Snapshot: China
Mathieu Savary Vice President The Bank Credit Analyst Footnotes 1 Please see Emerging Markets Strategy "Charts That Matter," dated September 10, 2020, available at ems.bcaresearch.com 2 The Atlanta Fed GDPNow model already points to an annualized growth rate of 32% in Q3 in the US, but the New York Fed’s model pencils in a much more modest 5.3% expansion rate for Q4. 3 Please see US Bond Strategy "More Stimulus Needed," dated September 15, 2020, available at usbs.bcaresearch.com 4 Please see Foreign Exchange Strategy "Revisiting Our High-Conviction Trades," dated September 11, 2020, available at fes.bcaresearch.com 5 Please see The Bank Credit Analyst "August 2020," dated July 30, 2020 and The Bank Credit Analyst "July 2020," dated June 25, 2020, available at bca.bcaresearch.com 6 Please see European Investment Strategy "The Puppet Master Is The 30-Year Bond," dated August 6, 2020, available at eis.bcaresearch.com 7 Please see Global Investment Strategy "Stock Prices And Interest Rates: Can We Trust TINA?," dated September 11, 2020, available at gis.bcaresearch.com 8 Please see US Equity Strategy "Pricing Power Update," dated September 14, 2020, available at uses.bcaresearch.com 9 Please see The Bank Credit Analyst "September 2020," dated August 27, 2020, available at bca.bcaresearch.com 10 However, in the US, investors must be careful as the sector is dominated by one firm: Amazon, which trades as a tech stock, not as a traditional consumer discretionary. 11 Please see Daily Insights "More Cars Please!" dated July 20, 2020, available at di.bcaresearch.com 12 By term presidencies we are referring to the different duration of Presidents staying in office.