Emerging Markets

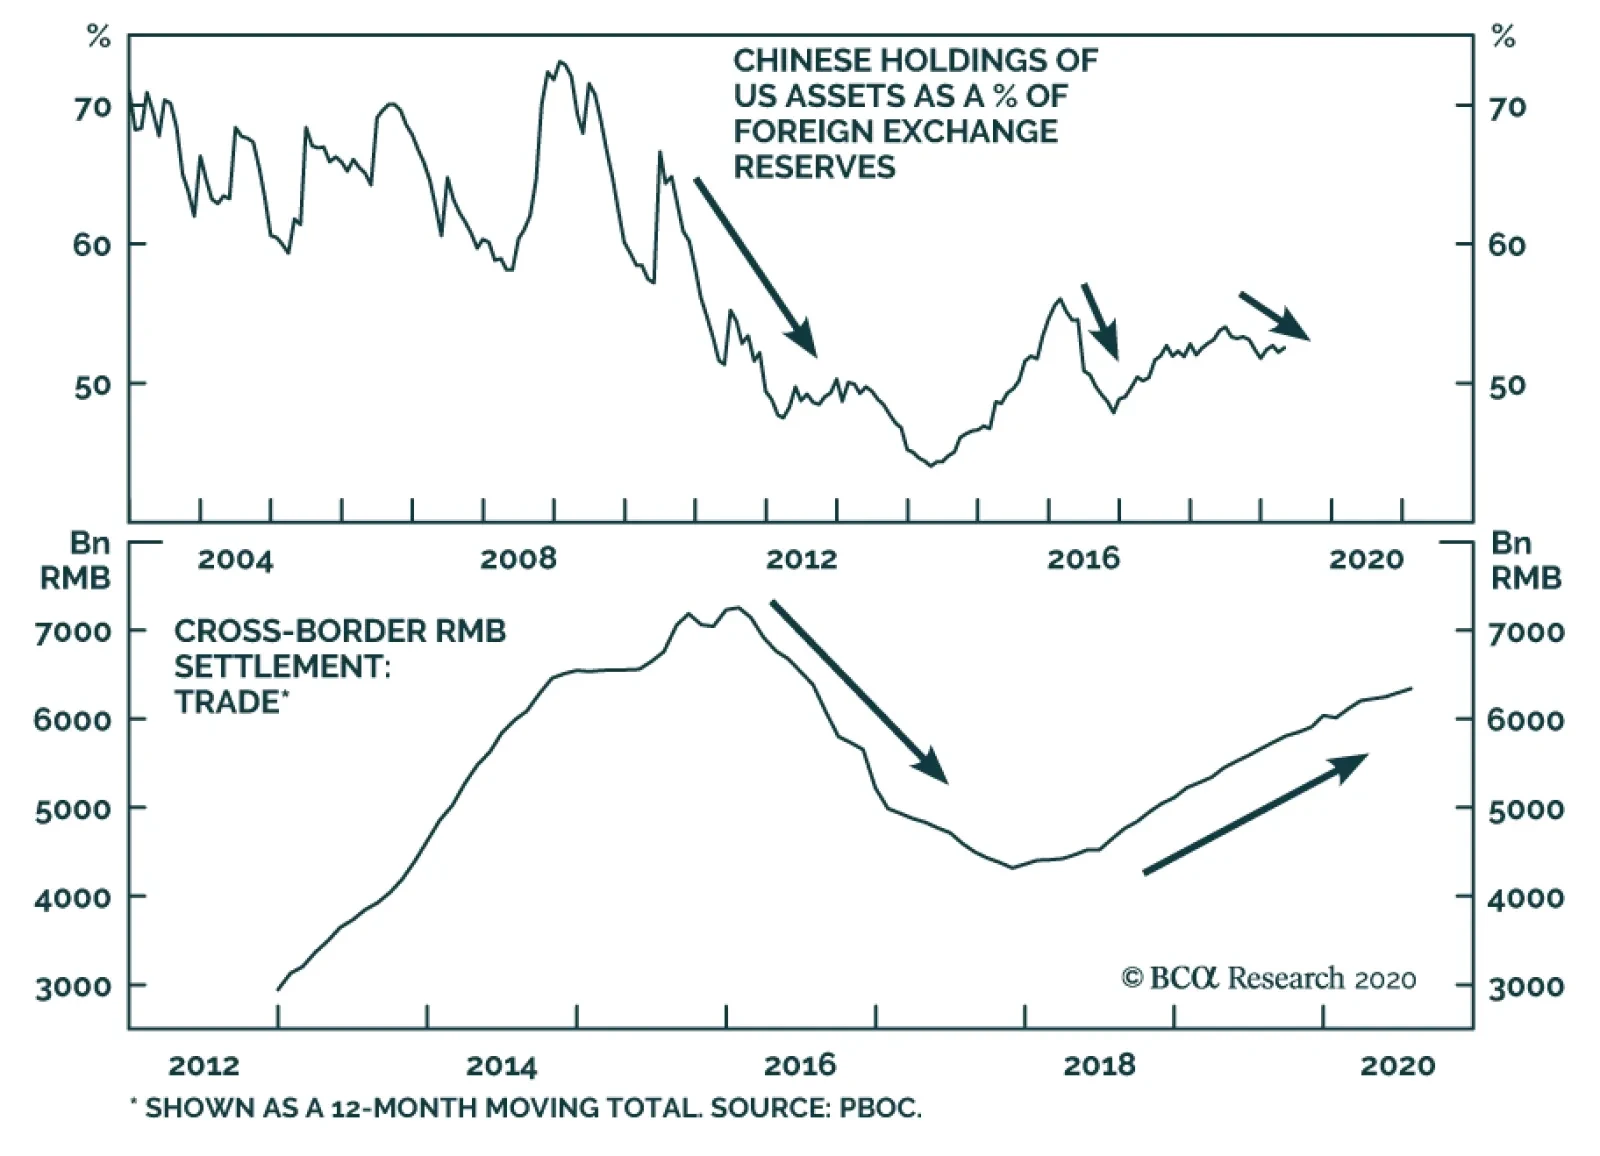
Dear clients, China Investment Strategy will take a summer break next week. We will resume our publication on September 9th. Best regards, Jing Sima, China Strategist Highlights The threat of US sanctions has sparked fears of disconnecting Chinese financial institutions from US dollar access, driving urgency to accelerate the RMB internationalization process. China’s RMB internationalization process suffered from a sizable setback in 2016, but the trend has reversed in 2018. Since then China has shifted the strategy to broaden and enhance the RMB’s market demand and functions, as well as to establish systems to facilitate the strategy. In the foreseeable future, the RMB’s role in the global economy is far from challenging the US dollar as the world's dominant reserve currency; China's near-term goal to promote the use of the RMB beyond its borders is to minimize disruptions to China’s trade and investment activities threatened by US financial sanctions. Feature Since 2018 and in the wake of intensifying confrontations between the US and China, the Chinese government has shifted its strategy in promoting the internationalization of the RMB. Authorities have moved from a symbolic international recognition of the RMB to a more pragmatic approach of creating real market demand for the currency. Chart 1China Has Been Shedding USD Assets
China Has Been Shedding USD Assets
China Has Been Shedding USD Assets
It is not our baseline view that the US will take extreme measures and entirely cut off Chinese banks’ access to the US Clearing House Interbank Payments System (CHIPS) and the Society for Worldwide Interbank Financial Telecommunication (SWIFT). However, Beijing’s decoupling from the US dollar (USD) has been in process, diversifying its forex reserves away from the US dollar (USD) and increasing the use of the RMB in cross-border trade and investment (Chart 1). In the foreseeable future, it is neither possible nor is Chinese policymakers’ intention for the RMB to challenge the USD as the world's dominant reserve currency. Rather, we think that under the threat of US sanctions, the near-term goal is to minimize disruptions to China’s trade and investment activities. At the same time, the approach will make China “too big, too connected to fail” in the medium-to-long run and, therefore, minimize the potential for future threats of financial sanctions. China’s new approach to internationalize the RMB involves enhancing the currency’s three functions in the global market, and establishing and strengthening domestic systems to facilitate the enhancements: The RMB as an international settlement currency; The RMB as a commodity pricing currency; and The RMB as an international reserve currency. Most of these strategies still have a long way to go before having significant global market implications. However, these developments bear structural importance and investors should closely monitor them. RMB - An International Settlement Currency Chart 2Cross-Border RMB Settlement Is Picking Up
Cross-Border RMB Settlement Is Picking Up
Cross-Border RMB Settlement Is Picking Up
The RMB’s role in cross-border trade settlement suffered a major setback in 2016 when investor confidence plummeted following a rapid devaluation in China’s currency and equities. The trend has reversed since 2018, partially due to the vigorous promotion of China’s domestic cross-border interbank settlement system (CIPS) (Chart 2). China established CIPS in 2015 after the US proposed to disconnect Russia from the SWIFT payment system.1 As of July 2020, the CIPS system had a total of 33 direct participants and 951 indirect participants, a 35% increase from 2018 with more than half of the participants outside China.2 According to the recently released PBoC RMB internationalization report, the CIPS system processed a total of 34 trillion yuan worth of cross-border RMB transactions in 2019, a 28% improvement from 2018 (Chart 3). Chart 3CIPS Has Been Steadily Expanding
The RMB Internationalization Scorecard
The RMB Internationalization Scorecard
Nevertheless, the RMB’s share of international payments remains far behind the USD, euro and yen, and the RMB's role in cross-border settlement is well below its 2016 peak (Chart 4A and 4B). The dollar's dominant status is not only supported by the US’ strong and open economy, but also by its deep, liquid and highly efficient financial markets, which are impossible for any currencies or payment systems to replicate in the near future. However, establishing domestic financial payment and information exchange systems will likely be a main countermeasure countries will rush to take, if the US launches sanctions to cut off large economies like Russia and China from the USD and/or global financial system. Chart 4AThe RMB’s Share Of International Payments Has Been Disproportional Compared To Its Share In Global Trade…
The RMB Internationalization Scorecard
The RMB Internationalization Scorecard
Chart 4B...And Well Below Its 2016 Peak
...And Well Below Its 2016 Peak
...And Well Below Its 2016 Peak
Chart 5Russia Has Largely Replaced USD Treasury Holdings With Gold
Russia Has Largely Replaced USD Treasury Holdings With Gold
Russia Has Largely Replaced USD Treasury Holdings With Gold
Russia is by far the largest and most globally integrated country that came close to being cut off from SWIFT, and Beijing has clearly learned from Russia’s experience and countermeasure strategies. The proposal to disconnect Russia from SWIFT following the 2014 Crimea crisis never materialized, but in light of the threats and US financial sanctions, Russia established the SPFS, a domestic financial information exchange system to facilitate bank payments. The SPFS is far from the complete emancipation of SWIFT and payments through the SPFS are mostly intra-Russian settlements. However, this active counter-sanction measure, coupled with the Russian central bank’s aggressive reduction of USD-denominated assets in its forex reserves, seems to have achieved positive results (Chart 5). Three years after the establishment of SPFS, the US and Europe no longer target Russian bank payment functions in their further financial sanctions against Russia.3 In response to a US threat to impose economic sanctions against companies and banks dealing with Iran, Europe created a special financial settlement platform called Instrument in Support of Trade Exchanges (INSTEX) in 2019. Although none of the alternative systems can challenge the role of the US CHIPS or SWIFT systems, the trend of establishing and accelerating alternatives will incrementally diminish the effectiveness of such harsh financial actions by the US. RMB - An International Commodity Pricing Currency Table 1China Dominates Global Demand For Many Commodities
The RMB Internationalization Scorecard
The RMB Internationalization Scorecard
We believe that the most important breakthrough in the RMB internationalization process in the past five years has been the strategic shift to promote the RMB’s pricing function. China is the largest trading partner of a growing number of countries with tightly linked supply chains. This generates a natural demand for RMB settlement in bilateral trade. More importantly, China’s dominance in global demand for bulk commodities gives the country an advantage in pricing power (Table 1). In March 2018, China established a RMB-denominated crude oil futures market in Shanghai, which has grown into the third-largest oil exchange market after WTI and Brent. Its cumulative turnover in two years reached nearly 30 trillion yuan with overseas customers in 19 countries and regions.4 Given the success of the Shanghai crude oil futures market, the Chinese government has been vigorously promoting the expansion of the RMB pricing function from crude oil to natural gas, iron ore, soybeans, corn and other bulk commodities. Going forward, we expect the RMB internationalization process to continue to develop through pricing and trading bulk commodities in Chinese currency. This will lead to a higher correlation between the RMB and the currencies of some of China's Asian neighbors and commodity trade partners, and thus expand and strengthen the "RMB currency bloc" (Chart 6A and 6B). Chart 6AThe RMB Currency Bloc May Expand From Manufacturing Ecosystem...
The RMB Currency Bloc May Expand From Manufacturing Ecosystem...
The RMB Currency Bloc May Expand From Manufacturing Ecosystem...
Chart 6B...To Commodity Supply Chain
...To Commodity Supply Chain
...To Commodity Supply Chain
RMB - An International Reserve Currency The role of the RMB among official reserve managers, although still dismal compared to the USD and Euro, has accelerated since 2018. Its global share has doubled from Q4 2016 when the IMF began to include holdings of RMB in its currency composition of official foreign exchange reserves (COFER) (Chart 7). Shares of the USD- and Euro-denominated reserves have remained unchanged or declined during the same period. Among private investors, foreign investment in RMB-denominated assets has been the main source of China’s financial account surplus (Chart 8). China has hastened the opening of its onshore financial market to foreign institutional investors. In the past two years, major global stock and bond indexers –including MSCI, the S&P Dow Jones Indices, the FTSE Russell, and the Bloomberg Barclays Global Aggregate Index – have added A-shares and onshore bonds to their flagship benchmarks. This means that foreign institutional investors have significantly boosted their allocation of RMB-denominated stocks and bonds (Chart 8, bottom panel). Financial assets, such as domestic RMB stocks, bonds, and loans and deposits held by foreign entities, climbed by 26.7% in 2019 over 2018. At the same time, China's domestic financial markets have gradually liberalized and even removed investment quotas for overseas institutional investors. Foreign investors currently account for 5.5% and 2.6% of the market value in Chinese equities and bonds, up from 3% and 2% in 2018, respectively. Chart 7The RMB Share In Global Reserves Remains Dismal, But Has Nearly Doubled Since 2016
The RMB Internationalization Scorecard
The RMB Internationalization Scorecard
Chart 8China Has Been Rapidly Expanding The Scope Of Foreign Participants In Its Onshore Financial Markets
China Has Been Rapidly Expanding The Scope Of Foreign Participants In Its Onshore Financial Markets
China Has Been Rapidly Expanding The Scope Of Foreign Participants In Its Onshore Financial Markets
Bottom Line: The internationalization of the RMB will likely continue to accelerate in the face of decoupling from the US. It is a long process, but China will take advantage of its dominance in global demand to foster the RMB's role in both pricing and settlement in cross-border commodity trade. At the same time, China is rapidly expanding the scope of foreign participants in the country's onshore financial markets, by allowing more foreign banks and financial institutions to enter the market, and broadening the channels for the RMB’s international circulation. Jing Sima China Strategist jings@bcaresearch.com Footnotes 1SWIFT is a system that provides information on international payments and calculations. The system unites more than 11,000 banking and financial institutions in 210 countries and the bank card payment function supported by the SWIFT system reflects a country's financial security. 2China Cross-Border Interbank Payment System release, July 31st, 2020. 3Xu Wenhong, The SWIFT System: A Focus on the U.S.–Russia Financial Confrontation, Russian International Affairs Council, February 3, 2020. 4Based on data from Shanghai International Energy Exchange. Cyclical Investment Stance Equity Sector Recommendations
Since 2018, China has been promoting its own domestic cross-border interbank settlement system (CIPS). It is not BCA Research's baseline view that the US will cut off Chinese banks entirely from access to the US Clearing House Interbank Payments System…
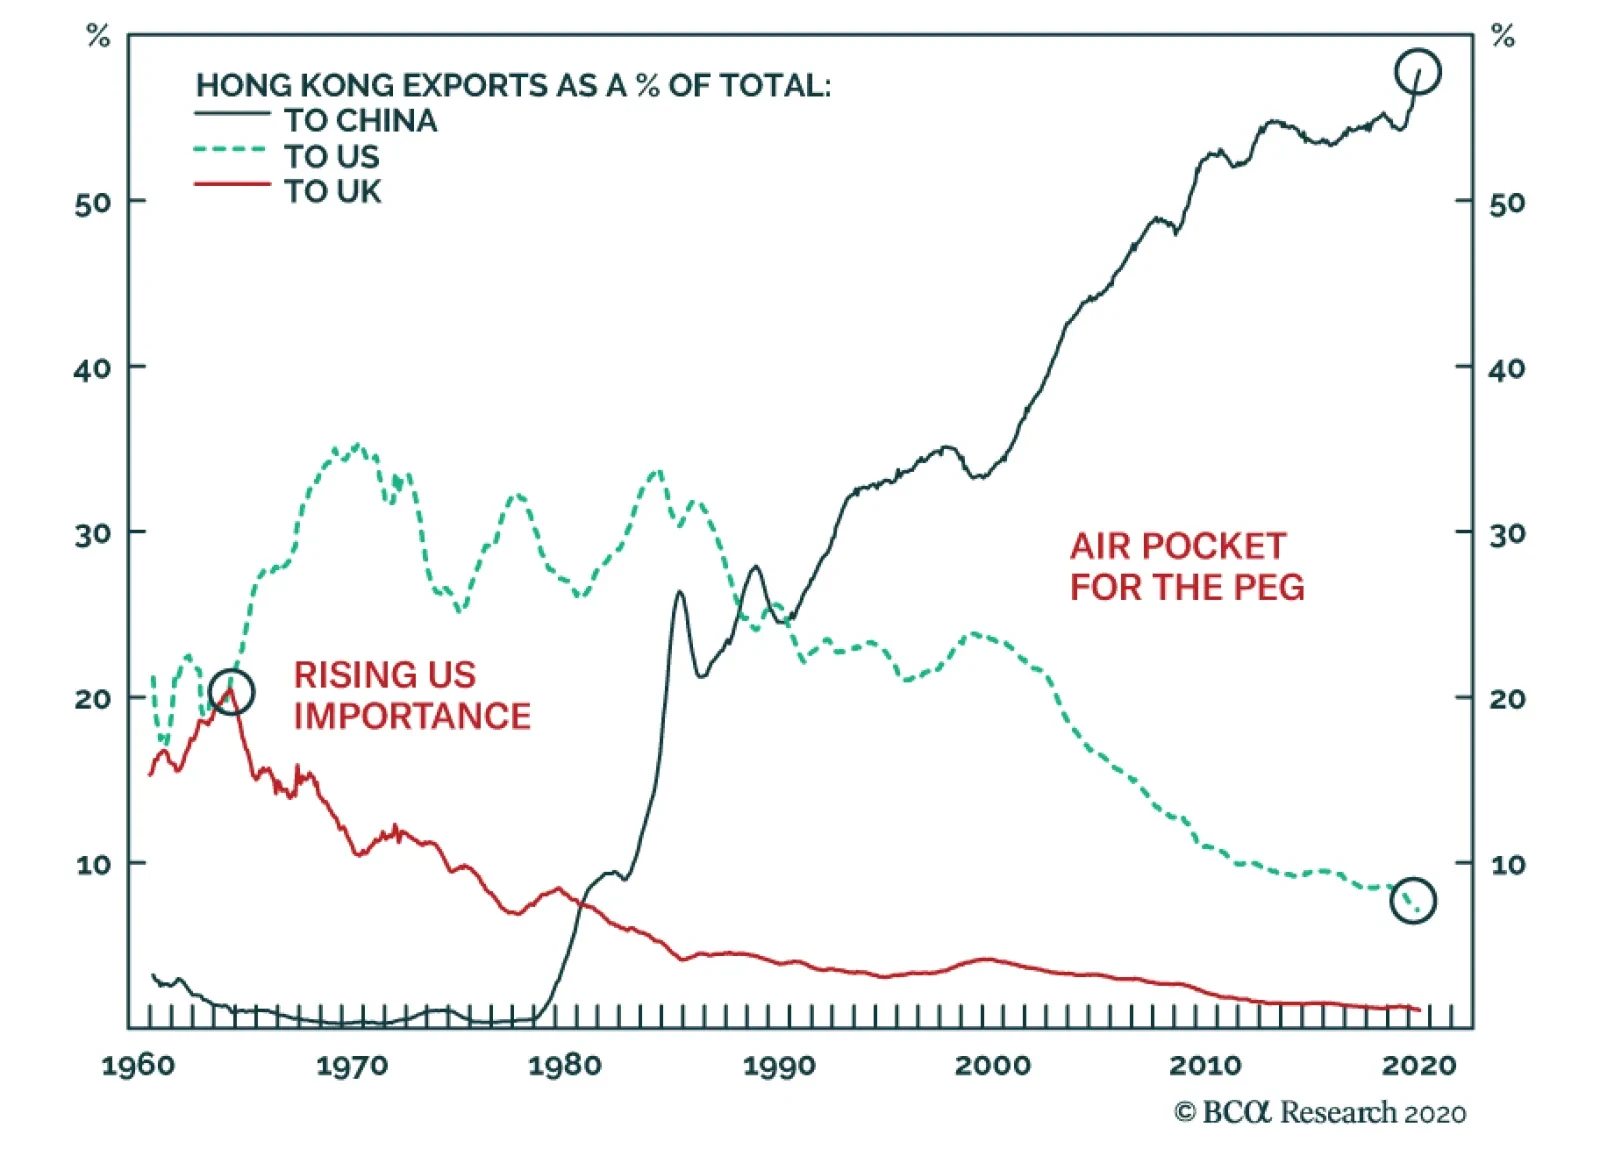
BCA Research's Foreign Exchange Strategy service examines various options available to the HKMA to adjust the HKD peg. On sensible option would be to peg the HKD to the Chinese RMB. The Hong Kong economy is now heavily tied to the Chinese economy, with…
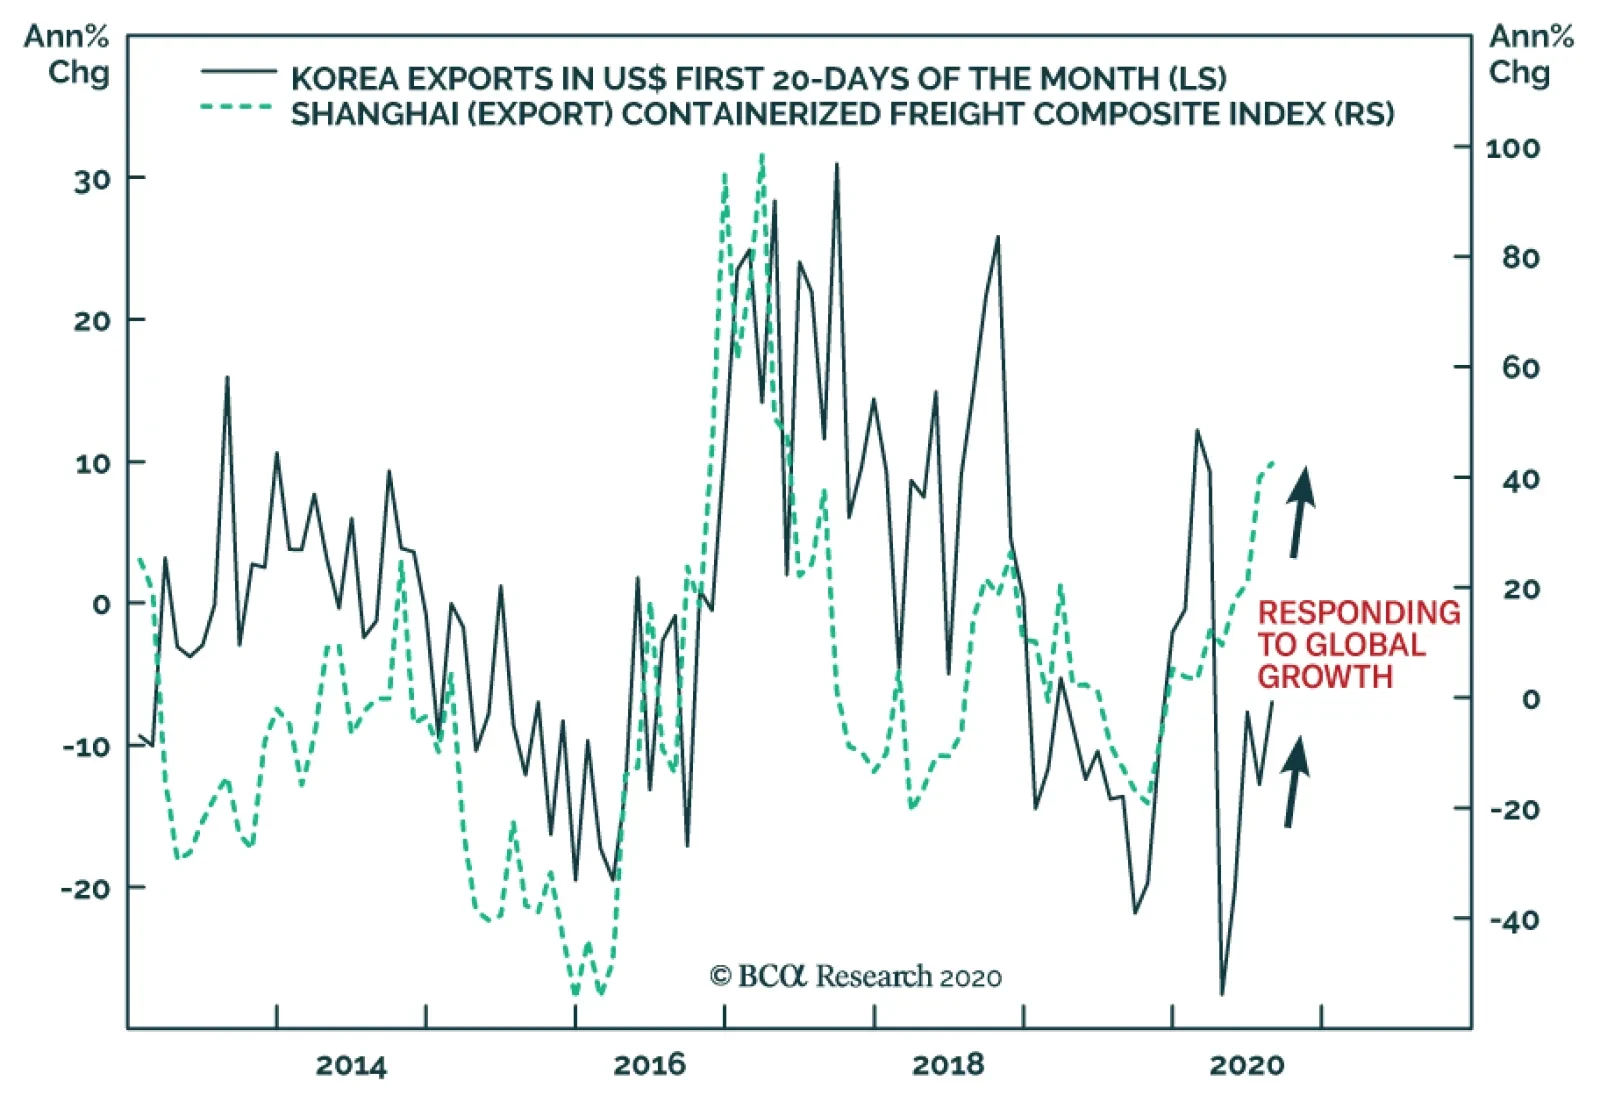
The Shanghai Container Freight Index reached its highest level in 6 years. Some of the strength in China’s container trade can be assigned to idiosyncratic factors. For example, household goods demand in the US and EU is strong, and retailers in those markets…
Highlights The stock market can apparently ignore the intensifying US-China conflict as long as massive monetary and fiscal stimulus continues. Hence the ongoing “stimulus hiccup” is a big problem. Ultimately a stimulus bill will pass, but risks are rising that it will come too late or fall short in size. The longer the negotiations drag on, the more likely that the absence of fiscal support, the spiraling US-China conflict, US political instability, and other risks will take center stage and upset the equity rally. Assuming a new stimulus package will ultimately pass, it will fuel Trump’s tentative comeback in opinion polls, increasing the risk that the revolution in the global trading system gets a new lease on life. Thus volatility is likely to rise from here until the US succession is settled. Stay long JPY-USD and health stocks in the near term and bullion in the long term. Feature Two of the key views we have hammered since May are coming to fruition: Stimulus Hiccup: The White House and Congress are struggling to get a new relief bill passed. We have argued that the next round of fiscal stimulus would face execution risks that would cause equity volatility to rise again, which is now occurring (Chart 1). Ultimately we expect the Republican Senate to capitulate to a major new stimulus bill. But the very near term is murky and the negotiations pose a clear and present danger to an equity market that has now surpassed its pre-COVID-19 highs (Chart 2). Chart 1Volatility Is Bottoming, Will Rise Ahead Of US Election
Volatility Is Bottoming, Will Rise Ahead Of US Election
Volatility Is Bottoming, Will Rise Ahead Of US Election
Chart 2Markets Recovered, Near-Term Risk To Downside
Markets Recovered, Near-Term Risk To Downside
Markets Recovered, Near-Term Risk To Downside
US-China Conflict: The White House has revoked Chinese tech giant Huawei’s general license, leaving the company in thrall to periodic Commerce Department allowances that will impede business. It has also expanded punitive measures to a slew of subsidiaries and Chinese software companies like TikTok (ByteDance) and WeChat (Tencent). We have argued that President Trump’s electoral vulnerability and economic stimulus in both countries lowered the bar to conflict and decoupling. Both countries have an interest in reducing their interdependency and the COVID-19 crisis has given them an opportunity to make structural changes that were previously more difficult. Neither the US tech sector, nor China-exposed US stocks, nor Taiwanese equities are pricing this monumental geopolitical risk at present (Chart 3). Combining these two views results in a dangerous outlook for global risk assets in the near term. The reason we argued that US-China tensions would escalate to the point of disrupting markets this year was that we viewed domestic stimulus as lowering the economic and financial bar that prevented conflict. Hence US and Chinese confrontational steps could go farther than the market expected and eventually something would snap (Chart 4). Chart 3Market Ignores US-China Escalation
Market Ignores US-China Escalation
Market Ignores US-China Escalation
Chart 4US And Global Stimulus Enable US-China Fight
Trade War Sans Stimulus Is Unsustainable
Trade War Sans Stimulus Is Unsustainable
Yet today tensions are escalating despite the failure to arrange a new jolt of domestic stimulus. This is true on both sides, as China is also seeing a deceleration in stimulus provision, mainly on the monetary side, that we also expect to be temporary but nevertheless has negative implications in the near term. The longer fresh stimulus is delayed, the more likely that markets will respond to the historic breakdown in US-China relations, US political instability, and other risks to corporate earnings and the economic recovery. Constraints On Politicians Support Cyclical Recovery To be sure, there is evidence that politicians are aware of their limits and already heading back to the negotiating table. Even with talks ongoing, the risks of delayed stimulus or Chinese retaliation are substantial. First, the White House, House Democrats, and Senate Republicans are continuing to negotiate despite being on recess while hosting national party conventions this week and next. House members are rushing back to Washington to vote on measures to boost the US postal service amid a controversy over how to handle mail-in voting for the election amid the pandemic. This has opened a pathway for stimulus talks to get back on track. It could result in a “skinny” stimulus bill quickly, or otherwise new developments could lead to the roughly $2.5 trillion blowout that we expect based on the two sides splitting the difference on most issues (Table 1). Table 1Stimulus Bill Will Hit $2.5 Trillion If Democrats And Republicans Split The Difference
Trade War Sans Stimulus Is Unsustainable
Trade War Sans Stimulus Is Unsustainable
Chart 5Trump’s Reelection Bid Stands On The Economy
Trade War Sans Stimulus Is Unsustainable
Trade War Sans Stimulus Is Unsustainable
Second, the US and China are arranging to keep talking. Ostensibly they are checking up on the status of the Phase One trade deal. The Trump administration cannot easily walk away from this deal– unless Trump irredeemably becomes a lame duck making a desperate bid to turn the tables on the Democrats. To do so would hurt Trump’s credibility on renegotiating US trade deals and likely trigger a selloff in the stock market that could set back the economic recovery and remove the last leg that his reelection bid stands on (Chart 5). The Chinese, for their part, have stuck with the deal despite US punitive measures because they do not want to provoke Trump, lest he attempt to inflict maximum damage on their economy in his final months or in a second presidential term. The renminbi is not depreciating relative to the dollar, suggesting that the tenuous truce is intact for now (Chart 6). Chart 6Renminbi Signals Phase One Trade Deal Intact ... For Now
Renminbi Signals Phase One Trade Deal Intact ... For Now
Renminbi Signals Phase One Trade Deal Intact ... For Now
Yet The Market May Sell Before Politicians Soften Their Line Nevertheless in the very near term investors have very low visibility on what happens next. Congress could still fumble and cause greater doubts. It could easily fail to reach a new stimulus deal until after September 8 when the Senate returns or September 14 when the House returns. President Trump’s executive orders, and negotiating gestures from Republicans, are a tenuous bridge for markets as they fall far short of even the Republicans’ $1 trillion asking price. The stock market will plunge if the talks collapse, but it will also drop if the stimulus falls short. The market may have to sell off to force politicians to provide stimulus and temper strategic competition. Trump’s complicated attempt to extend relief via executive orders, and/or a skinny deal that does not include direct rebates to households and funding for state and local governments, would be inadequate for the needs of the economy (Chart 7). It is imperative for Senate Republicans to capitulate and come closer to the Democrats $2.4 trillion standing offer (down from $3.4 trillion) – but it is possible they could miscalculate and fail to compromise. Democrats will not cave because they ultimately benefit at the ballot box if stimulus flops and financial turmoil returns. Chart 7US Economy Needs Extended Period Of Fiscal Support
US Economy Needs Extended Period Of Fiscal Support
US Economy Needs Extended Period Of Fiscal Support
On the China front, it is not guaranteed that China will refrain from retaliation against tech companies like Apple that depend on China for their operations. The market is betting that a rally entirely based on the tech sector can be sustained even in the face of an expanding tech war between the world’s biggest economies (Chart 8). Yet China suffers an economic and strategic blow from the US imposition of a technological cordon and Xi Jinping could decide to retaliate immediately. He could come to believe that the risk of not retaliating – which would entail continuing economic recovery and possibly Trump’s reelection on an anti-China platform – is greater than the risk of retaliation and financial turmoil. He has the ability to stimulate the domestic economy and benefits if he sets a precedent that American presidents lose if they attack China. China may not turn to Taiwan immediately, but since 2016 we have highlighted that Taiwan, not Hong Kong, is the major geopolitical risk stemming from the US-China crisis. Saber-rattling, cyber-rattling, and punitive economic measures are picking up in the Taiwan Strait and could lead to a global geopolitical crisis at any time. Here, too, the base case is that China will remain in a holding pattern until after the US election. It also should use economic sanctions long before it resorts to the final military option (Chart 9). But there is a large risk of miscalculation as the US seeks to cut off Taiwan semiconductor trade with China while Taiwan reduces its economic dependency on the mainland and tightens its defense relations with the United States. The Trump administration presents a window of opportunity so the risks are elevated in the lead up to and aftermath of the US election. Chart 8Tech Bubble Amid Tech War An Obvious Danger
Tech Bubble Amid Tech War An Obvious Danger
Tech Bubble Amid Tech War An Obvious Danger
Chart 9China's Economic Card May Be Only Thing Preventing War
China's Economic Card May Be Only Thing Preventing War
China's Economic Card May Be Only Thing Preventing War
We do not view Chinese economic sanctions on Taiwan as a tail risk but rather as our base case. Of course, we eschew conspiracy theories and usually seek to curb enthusiasm over war risks, as with Sino-Indian saber-rattling. But Taiwan is the epicenter of the political, military, and technological struggle between Washington and Beijing. War is a tail-risk, but even minor clashes would have a major impact on global financial markets. Other Risks Come To Forefront Amid Stimulus Hiccup Chart 10Trump’s Comeback Substantial If Stimulus Passes, Pandemic Subsides
Trade War Sans Stimulus Is Unsustainable
Trade War Sans Stimulus Is Unsustainable
The longer stimulus is delayed, the more likely that other risks will rise to the forefront and trouble the equity market. The US election does not offer much upside for markets at this point. Other risks stem from Iran and Russia. In the US election, President Trump is beginning to make a comeback in the opinion polling (Chart 10). Trump’s approval rating benefits from signing off on deals, so a final stimulus bill from Congress is essential. But a stimulus bill, a continued rollover in new cases of COVID-19, and a revival of support among his base would improve his odds of winning. Former Vice President Joe Biden is not polling much better against Trump than former Secretary of State Hillary Clinton did back in 2016 (Chart 11). Biden’s momentum in national opinion polling has been arrested, especially in battleground states, and the lower end of the “band of uncertainty” around the polling also suggests that Trump is within striking distance (Chart 12). Chart 11Biden Polling About Same As Hillary Versus Trump
Trade War Sans Stimulus Is Unsustainable
Trade War Sans Stimulus Is Unsustainable
Chart 12Trump Still Within Striking Distance Of Biden
Trade War Sans Stimulus Is Unsustainable
Trade War Sans Stimulus Is Unsustainable
Our election model suggests that Trump has a 42% chance of winning, which is higher than our subjective 35% (Chart 13). We will upgrade if a stimulus bill is agreed. A Trump comeback may be received well by US equity markets – as it prevents tax hikes, re-regulation, higher minimum wages, and a federal push to revive labor unions, all promoted by Biden and the Democrats. But then again, Biden’s agenda is more reflationary, whereas Trump faces obstacles in a still-Democratic House, leaving global trade as the path of least resistance – which is market-negative. The dollar may bounce on the prospect of a Trump second term (Chart 14). Tech stocks, Chinese currency, and other cyclicals, such as the euro and European stocks, will suffer a setback if Trump is reelected. Chart 13We Give Trump 35% Odds, Quant Model Shows Upside At 42%
Trade War Sans Stimulus Is Unsustainable
Trade War Sans Stimulus Is Unsustainable
Lesser risks, still notable, include Iran and Russia. Chart 14Trump Could Trigger Near-Term Dollar Bounce
Trump Could Trigger Near-Term Dollar Bounce
Trump Could Trigger Near-Term Dollar Bounce
We have maintained that the US and Iran are in a bull market of geopolitical tensions and that this could result in crisis around the election. The US’s decision on August 20 unilaterally to maintain the expiring international conventional arms embargo on Iran is a clear trigger for a military incident. The macro and market implications are different and less dire than with a US-China crisis. But oil price volatility would rise due to regional instability, President Trump’s reelection bid could benefit, and that would carry the implication of expanding trade war with China. Meanwhile our expectation of sharply rising Russian geopolitical risk is materializing both within Russia and in relations with Europe, which is preparing sanctions over the suppression of dissent within both Russia and its satellite state Belarus. Russia is capable of interfering in the US election while a Democratic victory would likely lead to a US policy offensive against Russia. Investors must look beyond the short term. If stimulus is passed, the stock market will go up, but the US and China will be further enabled and ultimately their strategic showdown will cap the gains by harming the tech sector. Meanwhile, if the stimulus fails, then the market will plunge. Investment Takeaways At present the stock market seems prepared for Trump to remain in the White House – or for Republicans to retain the Senate. The market’s YTD profile matches that of past elections that result in gridlock, as opposed to the Democratic “clean sweep” scenario that we have flagged as the likeliest outcome (Chart 15). However, this profile will change, the market will correct, if Trump does not sign a new relief act. Assuming stimulus ultimately passes, markets will cheer and Trump’s comeback in the polls will get a boost. He could still lose the election, given fundamental political and economic weaknesses captured in our state-by-state quantitative model above. But the election itself would be more closely fought – with a contested outcome more likely to occur and roil markets. Finally a Trump victory would give a new mandate to the US-China breakdown and the revolution in the global trading system, which is ultimately negative for risk assets and the cyclical recovery. Hence our confidence that the next few months will be marked by volatility. Ultimately geopolitical and macro fundamentals are negative for the dollar even if Trump provides the occasion for a last gasp in the past decade’s dollar bull market. The US is monetizing its debt and flooding the world with dollar liquidity. Meanwhile China and other powers are diversifying away from the dollar and into gold, the euro, the yen, and other reserve currencies over the long run (Chart 16). Chart 15Dollar Outlook Bearish In Medium Term
Dollar Outlook Bearish In Medium Term
Dollar Outlook Bearish In Medium Term
Chart 16Stock Market Preparing For Trump Win And More Gridlock?
Stock Market Preparing For Trump Win And More Gridlock?
Stock Market Preparing For Trump Win And More Gridlock?
The great US fiscal debate is over, regardless of Trump or Biden, as populism has made austerity impracticable and massive twin deficits will ensue. Thus we remain long gold and the Japanese yen. We have refrained from re-initiating our long EUR-USD trade given our expectation of stimulus hiccups and US-China tensions, but will reconsider if and when these hurdles are cleared. Our strategic portfolio continues to expect a global recovery over the next twelve months and beyond but tactically we are positioned against downside risks. Matt Gertken Vice President Geopolitical Strategy mattg@bcaresearch.com
Dear clients, The Foreign Exchange Strategy will take a summer break next week. We will resume our publication on September 4th. Best regards, Chester Ntonifor, Vice President Foreign Exchange Strategy Feature The economy of Hong Kong SAR1 has been held under siege by two tectonic forces. With the highest share of exports-to-GDP in the world, and at very close proximity to China, the epicenter of the pandemic shock, economic growth has been knocked down hard. The second shock to Hong Kong’s economy has been political instability. The extradition bill that was proposed in February 2019, followed by the enactment of the national security law this past June, has been accompanied by cascading street-wide protests and social unrest. The spirit of the bill is that crimes committed in Hong Kong can be trialed in China. The US has moved to impose sanctions on Hong Kong, as it no longer sees the city-state as autonomous, the latest of which is revoking its extradition treaty with the former colony. Some commentators have defined this as the end of the one country, two systems socio-economic model that has been in place since the handover from British rule in 1997. From a currency perspective, these shocks put in question the sustainability of the Hong Kong dollar (HKD) peg. Historically, currency pegs more often than not fail, especially in the midst of both geopolitical and economic turmoil. This was the story of the Asian Financial crisis in the late 1990s, and the Mexican peso crisis earlier that decade. Is the Hong Kong dollar destined for the same fate? If so, what are the potential adjustments in the exchange rate? Finally, what indicators can investors look to as a guide for any pending adjustment? A Historical Perspective Chart 137 Years Of Stability
37 Years Of Stability
37 Years Of Stability
The HKD is no stranger to shifting exchange-rate regimes. Over the last 170 years, it has been linked to the Chinese yuan, backed by silver, pegged to the British pound, free-floating, and, since 1983, tied to the US dollar. Therefore, a bet on the unsustainability of the peg is historically justified. That said, the stability of the peg to the US dollar has survived 37 years of economic volatility, suggesting the Hong Kong Monetary Authority (HKMA) has been able to successfully navigate a post-Bretton Woods currency era (Chart 1). Beginning as a bi-metallic monetary regime in the early 19th century, the HKD was initially linked to gold and silver prices, akin to the commodity–monetary standard that dominated that era. When Britain colonized Hong Kong in 1841, and as new trade alliances developed, the drawbacks of the bi-metallic monetary standard became apparent. As bilateral trade boomed, adjustments to imbalances (surpluses or deficits) could not occur through the exchange rate since it was fixed. Therefore, they had to occur through the real economy. This led to very volatile and destabilizing domestic prices. The stability of the peg to the US dollar has survived 37 years of economic volatility. Most Anglo-Saxon countries finally converted from bi-metallic exchange rates to the gold standard in the late 1800s, and strong ties to China dictated that Hong Kong naturally adopted the silver dollar in 1863. However, the silver system had the same drawbacks as the bi-metallic standard. Specifically, when your money supply is fixed, any increase in output leads to “few dollars chasing many goods.” This is synonymous with falling prices, just as “many dollars chasing few goods” is synonymous with rising inflation. The petri dish for this phenomenon was the post-World War I construction boom. A fixed money supply under the gold (and silver) standard meant rapidly falling prices globally. By the late 1920s, most countries had overvalued exchange rates relative to gold (and silver), that exerted powerful deflationary forces on their domestic economies. This forced most Western governments to debase fiat money vis-à-vis gold to stop price deflation. Correspondingly, China had to abandon the silver standard in November 1935, with Hong Kong shortly following suit. At the time of debasement, the United Kingdom was the leading economic power. As a colony, it made sense for the Hong Kong government to link the HKD to the British pound. The established rate was GBP/HKD 16, giving birth to the currency board system (Chart 2). Meanwhile, as a trading hub, a peg with an international currency made sense. The problems there were two-fold. First, the pound was still gold-linked. And second, Britain’s subsequent decline in economic power was accompanied by a series of sudden and dramatic devaluations in the pound, which was hugely disruptive to Hong Kong’s financial system. By 1972, the British government decided to float the pound, which effectively ended the GBP/HKD peg. Chart 2A History Of The HKD Peg
A History Of The HKD Peg
A History Of The HKD Peg
In July 1972, the authorities made the decision to peg the Hong Kong dollar to the US dollar at USD/HKD 5.65, which was another policy mistake. The switch made sense given the rising economic power of the US, as well as rising trade links (Chart 3). However, the dollar was also under a crisis of confidence following the Nixon devaluation in 1971. In February 1973, the HKD was freely floated. Chart 3The Peg Is Usually Against The Dominant Economic Power
The Peg Is Usually Against The Dominant Economic Power
The Peg Is Usually Against The Dominant Economic Power
Counter-intuitively, the free-floating era for HKD was arguably the most volatile for its domestic economy. For one, discipline in monetary policy was gone. Money and credit growth exploded, inflation hit double-digits, home prices soared and the trade balance massively deteriorated. Political instability was also rife, given the uncertainty surrounding the end of British claims on the island. As the dialogue included China’s reclaim of political control over Hong Kong, there was uncertainty over the rule of law. This cocktail of political and economic uncertainty led to a 33% depreciation in the HKD between mid-1980 and October 1983. Panicked policymakers returned to the US dollar peg. Paul Volcker, then Federal Reserve chairperson, was establishing himself as the world’s most credible central banker, having dropped US inflation from almost 15% in 1980 to below 3% by 1983. Economic and financial links with the US also justified a peg. In August of 1983, the authorities announced a USD/HKD fixed rate of 7.80, which has remained in place since. The Current Peg: Advantages And Disadvantages Chart 4Fiscal Prudence In Hong Kong
Fiscal Prudence In Hong Kong
Fiscal Prudence In Hong Kong
The advantage of the HKD peg is that the choice of the nominal anchor, the US dollar, renders it credible. First, the US dollar is an international reserve currency dominating international trade, which helps to facilitate settlements while instilling confidence among transacting participants. As a financial hub, this is crucial for Hong Kong. Meanwhile, such an anchor imposes fiscal discipline, since government deficits cannot be monetized by money printing. In the case where the government tries to be profligate, the rise in inflation will lower real rates and lead to capital outflows. This will force the HKMA to sell US dollars and absorb local currency. In the extreme case, the central bank can run out of reserves, causing the peg to collapse. Indeed, over the past several years, government debt in Hong Kong has been close to nil (Chart 4). The drawback of a fixed exchange rate regime is that a country or a region relinquishes control over independent monetary policy. In the case of Hong Kong, this means that interest rates are determined by the actions of the US Fed. Such a marriage was justified when the business cycles between the two economies were in sync, but in times of economic divergences, the fixed exchange rate leads to economic volatility. Chart 5Currency Peg And Internal Devaluation
Currency Peg And Internal Devaluation
Currency Peg And Internal Devaluation
Chart 6Hong Kong Interest Rates In The Late 90's
Hong Kong Interest Rates In The Late 90's
Hong Kong Interest Rates In The Late 90's
This divergence was clearly evident in the 1990s, as falling interest rates in the US supercharged a housing and stock market bubble in Hong Kong. When the Asian crisis finally came around in 1997, the lack of exchange-rate flexibility led to a vicious internal devaluation (Chart 5). A prolonged period of high unemployment and stagnant wages was needed for Hong Kong to finally improve its competitiveness. Most importantly, in 1998, in the depths of the Asian financial crisis, the peg attracted a concerted attack from speculators who believed a devaluation of the Hong Kong dollar alongside other regional currencies was inevitable. Their assault inflicted considerable pain, driving short-term HKD interest rates (Chart 6) and wiping out over a quarter of the local stock market in a matter of weeks. At the time, the Hong Kong government was successful in fending off the speculative attacks by intervening massively in both the foreign exchange and equity markets. Is An Adjustment Pending? If So, When? Chart 7USD/HKD And Interest Rate Spreads
USD/HKD And Interest Rate Spreads
USD/HKD And Interest Rate Spreads
As the above narrative suggests, the HKD is no stranger to socio-economic shocks and speculative attacks, and it has, more recently, weathered them pretty well. The more immediate question is whether the shift in the political landscape could be potent enough to crack the peg this time around. While plausible, it is unlikely for a few reasons. First, the HKD continues to trade on the stronger side of the peg as US interest rates have collapsed, wiping off any positive carry that would have catalyzed outflows. Fluctuations in the USD/HKD within the 7.75-7.85-band track the Libor-Hibor spread pretty closely (Chart 7). A currency board has unlimited ability to defend the strong side of the peg, since it can print currency and absorb foreign reserves (print HKDs and use these to buy USDs in this case). On the weak side, these foreign exchange reserves are drawn down. Therefore, any threat to the peg should be preceded by consistent trading on the weaker side, questioning the HKMA’s ability to keep selling FX reserves to defend the peg. Fluctuations in the USD/HKD within the 7.75-7.85-band track the Libor-Hibor spread pretty closely. Second, the Hong Kong peg remains extremely credible, since the entire monetary base is backed over two times by FX reserves (Chart 8). Even as a percentage of broad money supply, Hong Kong reserves are ample and very high by historical standards (Chart 8, bottom panel). Meanwhile, since 1983, the currency board system has undergone a number of reforms and modifications, allowing it to adapt to the changing macro environment. This represents a powerful insurance policy for the HKMA’s ability to defend the currency peg, significantly enhancing the system’s credibility. Chart 8Ample Foreign Exchange Reserves
Ample Foreign Exchange Reserves
Ample Foreign Exchange Reserves
Chart 9Hong Kong Runs Recurring Surpluses
Hong Kong Runs Recurring Surpluses
Hong Kong Runs Recurring Surpluses
Third, ever since the peg was instituted, Hong Kong has mostly run budget surpluses. As a result, government debt in Hong Kong is almost non-existent, as we illustrate above. This has removed any incentive to monetize spending, which remains an open argument in the US, Japan or even the euro area. One of our favored metrics on the health of a currency is the basic balance, and on this basis, Hong Kong scores much more favorably than the US. While Hong Kong has transitioned from being a goods exporter to that of services, it remains extremely competitive, with a healthy current account surplus of 5% of GDP (Chart 9). These recurring surpluses have propelled Hong Kong to one of the biggest creditors in the world, with a net international investment position that is a whopping 430% of GDP and rising (Chart 10). Chart 10Hong Kong Is A Net Creditor To The World
The Hong Kong Dollar Peg And Socio-Economic Debate
The Hong Kong Dollar Peg And Socio-Economic Debate
Fourth, over the past few years, productivity in Hong Kong has outpaced that of the US and most of its trading partners (Chart 11). This has lifted the fair value of the currency tremendously. This means it is more like that when the peg adjusts, the outcome will be HKD appreciation. On a real effective exchange rate basis, the HKD is not that overvalued compared to the US dollar, after accounting for the massive increase in relative productivity (Chart 12). It is notable that during the Asian financial crisis, currencies like the Thai bhat were massively overvalued, which is why the adjustment was back down toward fair value. Chart 11Hong Kong Is Highly Productive
Hong Kong Is Highly Productive
Hong Kong Is Highly Productive
Chart 12Trade-Weighted HKD Is Slightly Expensive
Trade-Weighted HKD Is Slightly Expensive
Trade-Weighted HKD Is Slightly Expensive
Fifth, there is a strong incentive for both Beijing and Hong Kong to defend the peg, because the relevance of Hong Kong is no longer as a shipping port, but as a financial center. The peg reduces volatility, as transactions are essentially dollarized. The relevance of Hong Kong in Asia can be seen by looking at the market capitalization of the Hang Seng index compared to that of the Topix index in Tokyo or the Shanghai Composite index. Any escalation in the US-China trade war, especially in the technology sphere, will only lead to more listings on the Hong Kong stock exchange. Equity flows through the HK-Shanghai and HK-Shenzhen stock connect program are rising, suggesting the market still considers Hong Kong an important intermediary in doing business with China (Chart 13). On the political front, the most potent risk is that the US Treasury moves to unilaterally limit access to US dollars by Hong Kong banks. While this was discussed by President Trump’s top advisers, it was also dismissed as unwise due to the potential shock to the global financial system. Meanwhile, with massive swap lines with the Fed, Hong Kong’s international banks can always draw on US liquidity. Tariffs on Hong Kong goods are another option, but this again will not really deal a severe blow to the peg, since Hong Kong mainly re-exports, with very little in the way of domestic goods exports (Chart 14). Chart 13Hong Kong Is An Important Financial Center
Hong Kong Is An Important Financial Center
Hong Kong Is An Important Financial Center
Chart 14Hong Kong Is Partially Insulated From Tariffs
Hong Kong Is Partially Insulated From Tariffs
Hong Kong Is Partially Insulated From Tariffs
Property Market Blues The property market is the one area in Hong Kong where a sanguine view is difficult to paint. Hong Kong is one of the most unaffordable cities on the planet, and high income inequality has been a reason behind resident angst. The gini coefficient, a measure of inequality in a society, is more elevated in Hong Kong compared to Singapore, China or even South Africa. After years of loose monetary policy, property prices in Hong Kong have completely decoupled from fundamentals. Housing is even more unaffordable now than it was back in 1997, and domestic leverage is very high. With such a high debt stock, even a gradual uptick in interest rates will have a significant impact on the debt service burden (Chart 15). Stocks and real estate prices are positively correlated, suggesting deleveraging pressures will likely be quite high if both unravel (Chart 16). Chart 15High Debt Service Burden##br## In Hong Kong
High Debt Service Burden In Hong Kong
High Debt Service Burden In Hong Kong
Chart 16Hong Kong Stocks Are Tied To The Property Market
Hong Kong Stocks Are Tied To The Property Market
Hong Kong Stocks Are Tied To The Property Market
However, there are offsetting factors. First, it is unlikely that interest rates in Hong Kong (or anywhere in the developed world for that matter) will rise anytime soon. COVID-19 has provided “carte blanche” in terms of global stimulus. More importantly, the US is at the forefront of this campaign, meaning interest rates in Hong Kong will remain low for a while. Second, in recent history, Hong Kong has proven that it has the resilience to handle volatility in the property markets. During the Asian crisis, property prices fell by 60%, yet no bank went bust. Share prices also collapsed but are much higher today, suggesting the drop was a buying opportunity. And with such a low government debt burden, any systemic threat to banks will nudge the authorities to bail out important companies and sectors. In terms of asset markets, the performance of the Hang Seng index relative to the S&P 500 is purely a function of interest rates. The US stock market is dominated by technology and healthcare that do well when interest rates fall, while banks and real estate dominate the Hong Kong market. So rising rates hurt the US stock market much more than Hong Kong (Chart 17). Meanwhile, the recent turmoil has made Hong Kong assets very cheap relative to its sister-city, Singapore (Chart 18). This suggests that a lot of the potential equity outflows have already occurred, based on today’s situation. Chart 17Interest Rates And The Hong Kong Stock Market
Interest Rates And The Hong Kong Stock Market
Interest Rates And The Hong Kong Stock Market
Chart 18Hong Kong Has Cheapened Relative To Singapore
Hong Kong Has Cheapened Relative To Singapore
Hong Kong Has Cheapened Relative To Singapore
The Future Of The Peg A peg to the Chinese RMB makes sense. The Hong Kong economy is now heavily tied to the Chinese economy, with over 50% of exports going to China (previously mentioned Chart 3). However, that will sound the death knell for Hong Kong’s status as a financial center, since the US dollar remains very much a reserve currency. There is also a risk that if Beijing uses RMB depreciation as a weapon in a blown-out confrontation with the US in the coming years, it will threaten the sustainability of the HKD peg, since it could inflate asset bubbles. What is more likely is that the option of re-pegging to the RMB comes many years down the road, when the yuan has become a fully convertible currency. The recent turmoil has made Hong Kong assets very cheap relative to its sister-city, Singapore. There is the option to assume another currency board akin to Singapore. This option makes sense, since this would give the HKMA scope to link to cheaper currencies, such as the yen and euro. Such an overhaul will require significant technical expertise and political will from both Beijing and Hong Kong. It is not very clear what the cost/benefit outcome would be of this initiative, but it is worth considering since the RMB itself is managed against other currencies. Finally, there is always the option to fully float the peg, but this is likely to increase volatility. As well, for policymakers, it makes sense to continue pegging the exchange rate to the US dollar as it depreciates against major currencies, since it ends up easing financial conditions for Hong Kong concerns. Chester Ntonifor Foreign Exchange Strategist chestern@bcaresearch.com Footnotes 1 Special Administrative Region of the People's Republic of China Trades & Forecasts Forecast Summary Core Portfolio Tactical Trades Limit Orders Closed Trades
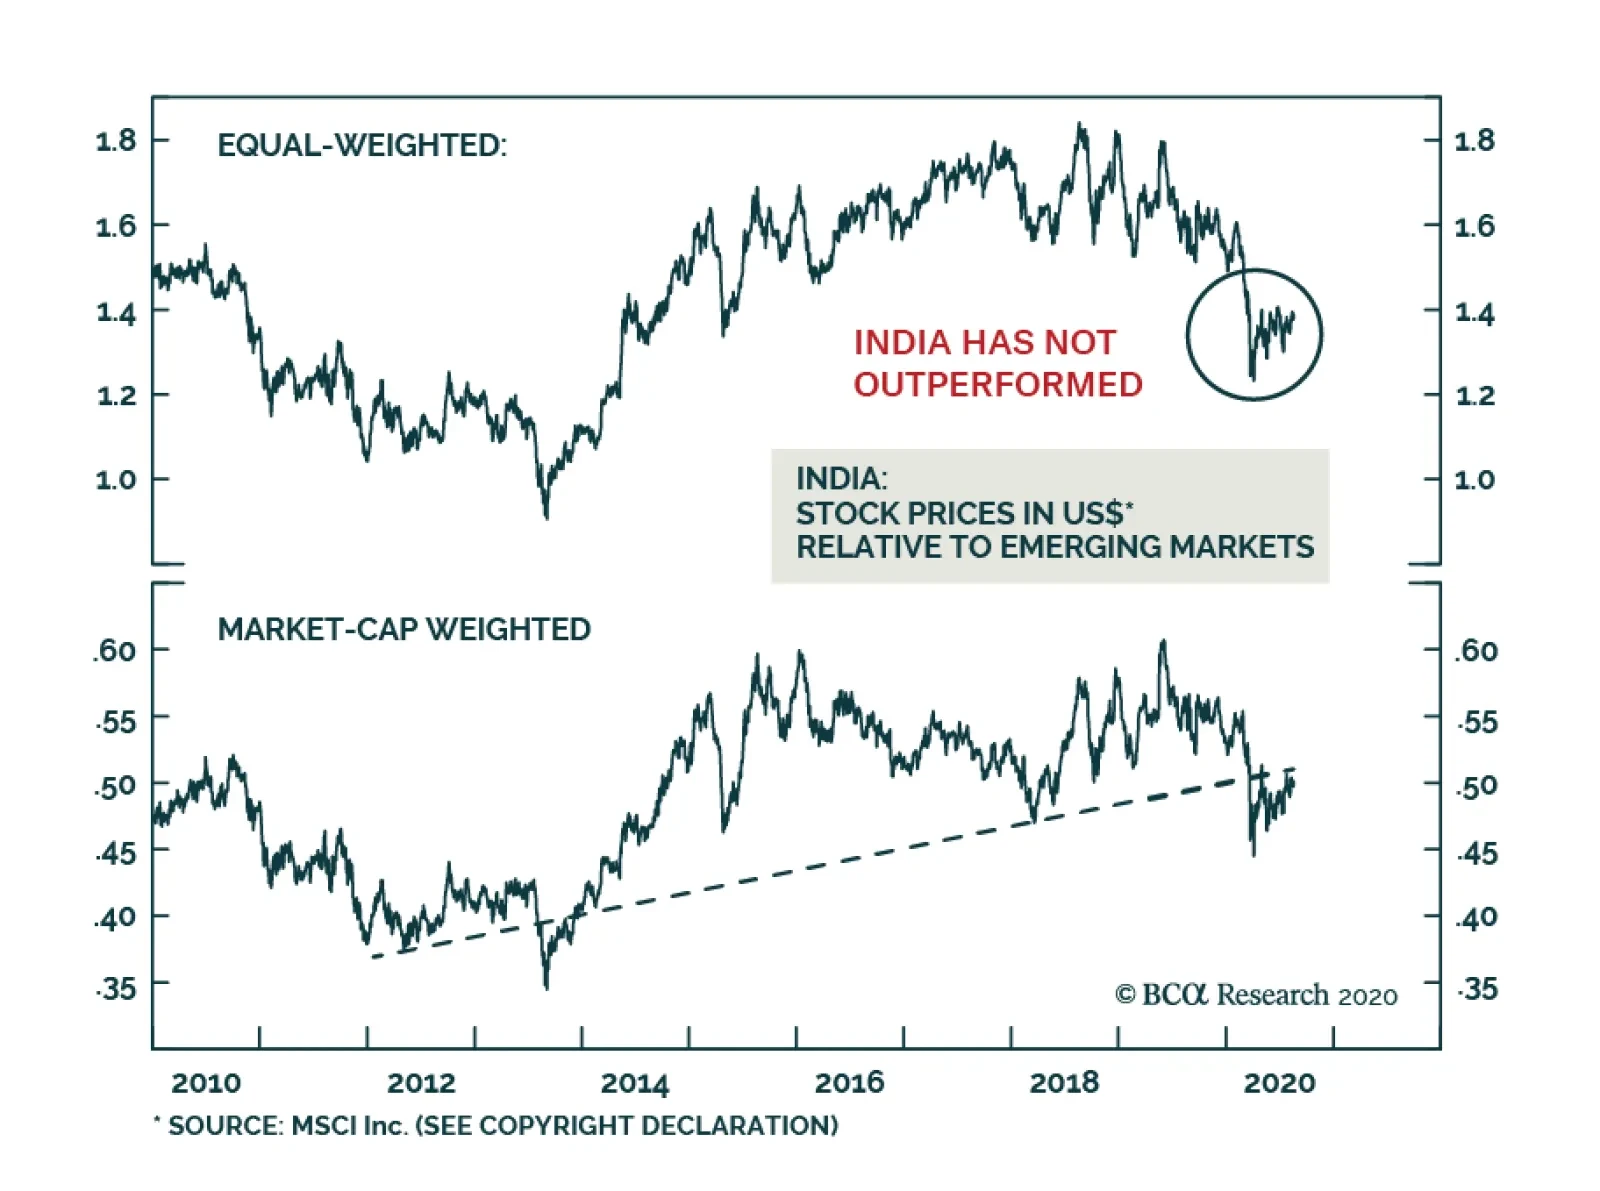
BCA Research's Emerging Markets Strategy service recommends that dedicated EM equity investors maintain an underweight position in India within an EM equity portfolio. The strong rally in certain mega-cap stocks has masked the muted revival in the broad…
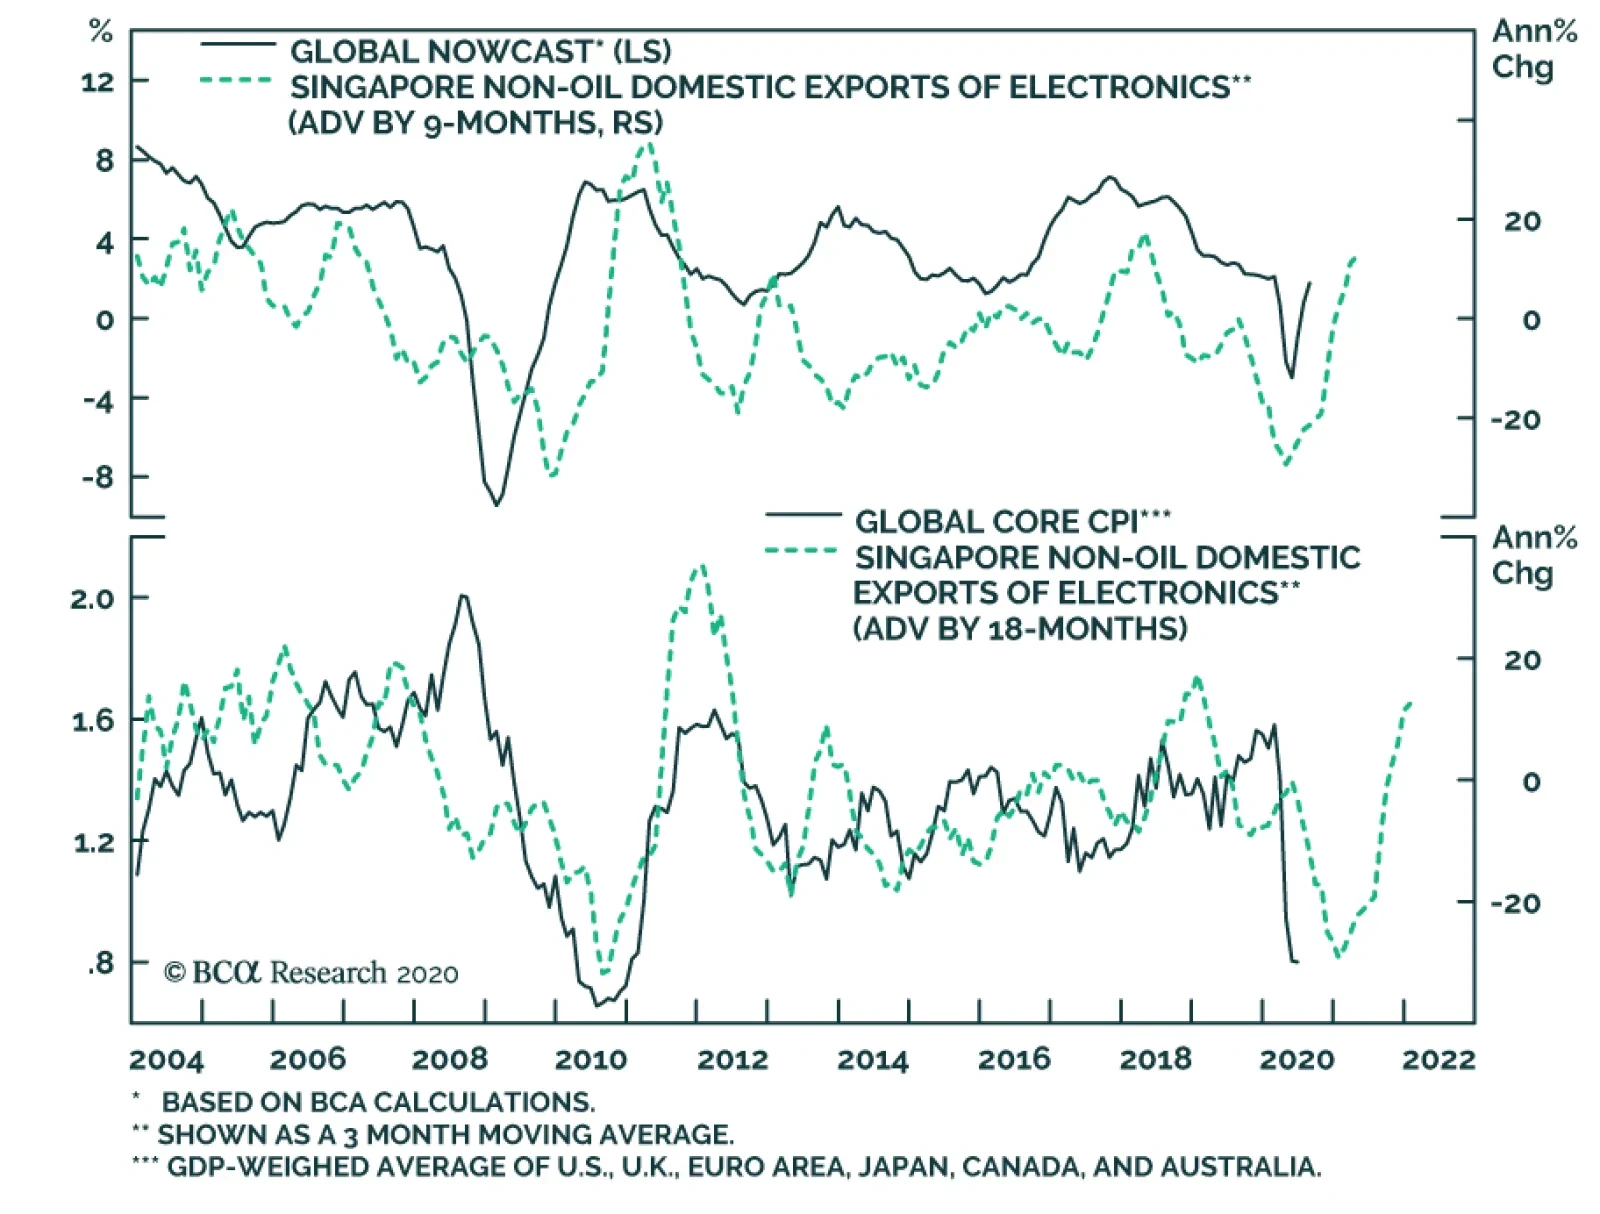
The growth rate of Singapore’s non-oil domestic exports slowed in July to a 6% annual rate. However, this is a noisy series; the trend in the growth rate of exports continues to improve. The trend in Singapore’s exports of electronics good has been…
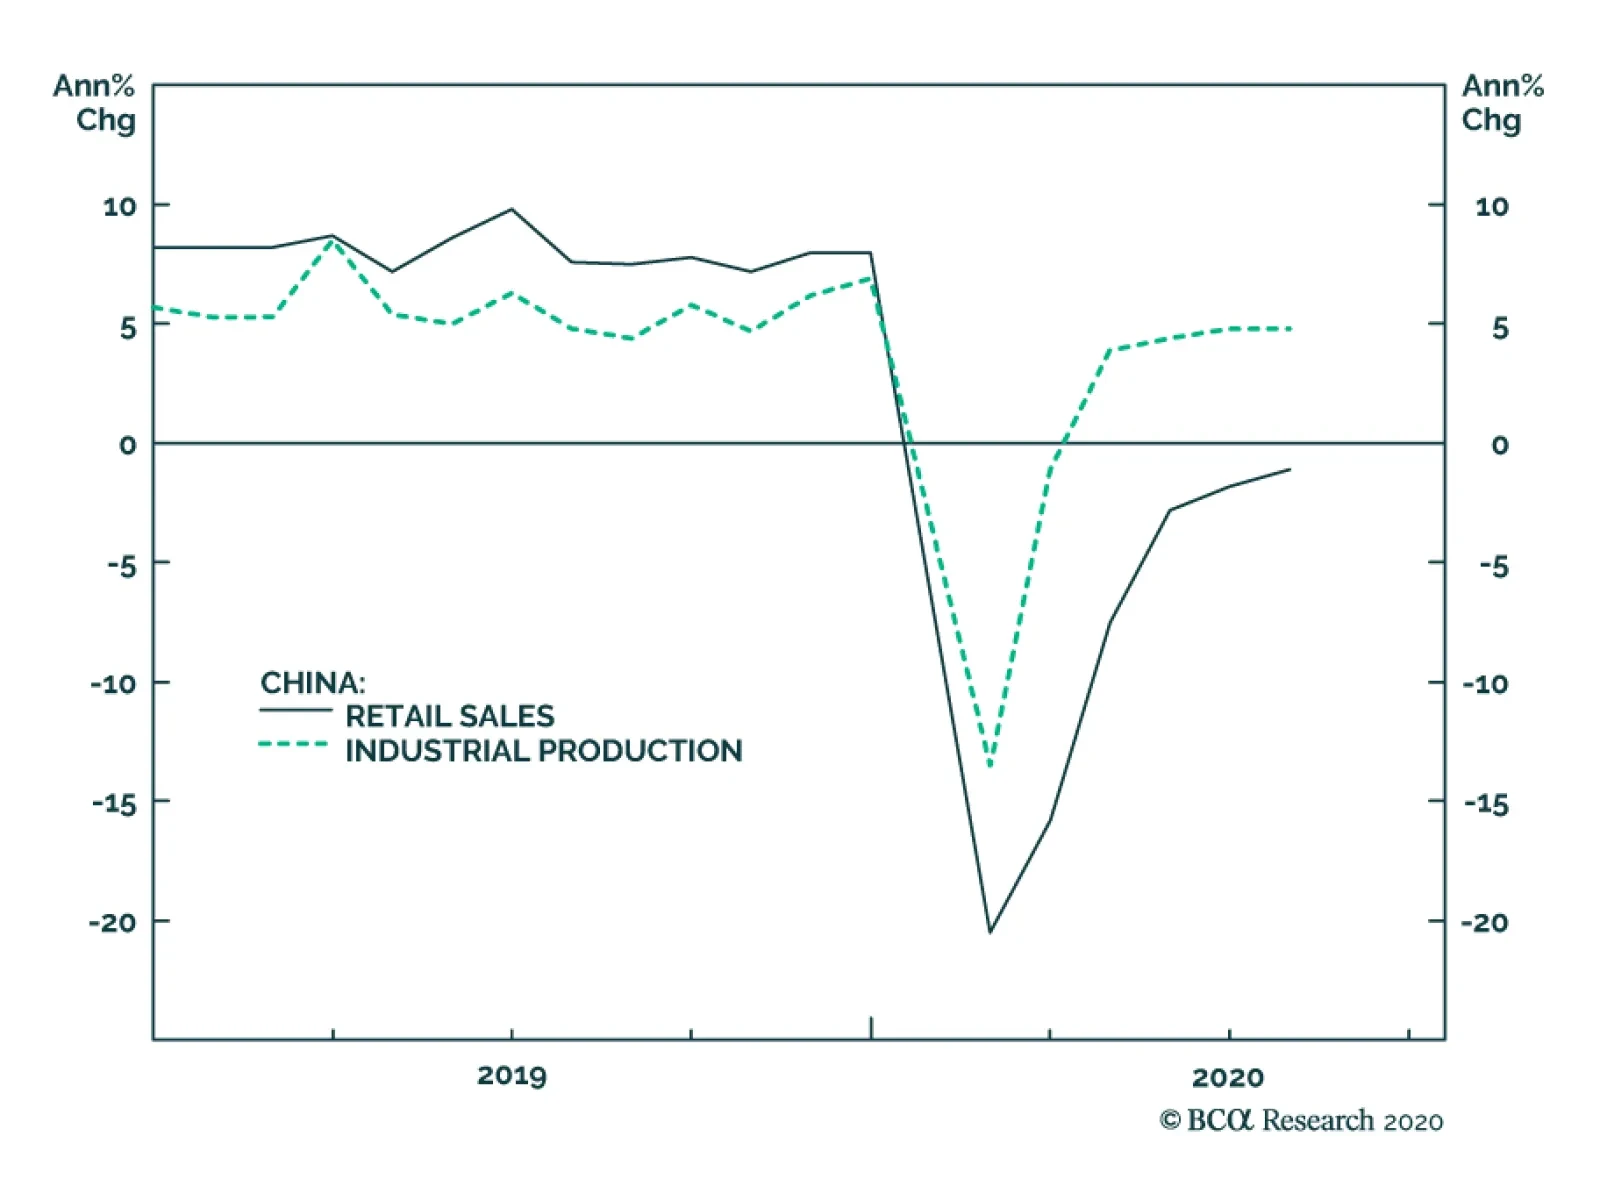
Chinese investment and retail sales data surprised slightly on the downside in July. Retail sales, for example, fell by 1.1% year-on-year, better than the 1.8% decline in June, but below the consensus expectation of +0.1%. The unemployment rate -– which the…
Highlights The strong rally in certain mega-cap stocks has masked the muted revival in the broad equity universe. Limited fiscal stimulus and a broken monetary transmission mechanism herald lackluster economic and profit recoveries. While dedicated EM equity investors should for now maintain an underweight position in India within an EM equity portfolio, they should consider upgrading this bourse on potential near-term underperformance. Absolute-return investors should consider buying this bourse on a setback in the coming months. Fixed-income investors should continue receiving 10-year swap rates but use any rupee selloff to rotate into cash bonds. Feature Indian share prices have staged a remarkable comeback following the financial carnage in March. However, the outlook for the economy and for corporate profits does not justify the current level of share prices. While this thesis is applicable to most markets around the world, the gap between share prices and economic activity is even larger in India. Chart I-1Loans To Companies Are Muted In India
Loans To Companies Are Muted In India
Loans To Companies Are Muted In India
In particular: The credit and liquidity crunch has been more acute in India than in many other EM and DM economies. Bank loan growth has surged in many countries as companies have borrowed to avoid a liquidity crunch due to a plunge in sales. However, in India bank loans to companies been shown little improvement (Chart I-1). This means that enterprises in India have not been able to draw on bank loans – to the same extent as they have done elsewhere – to attenuate a liquidity crunch stemming from revenue contraction. As a result, Indian enterprises have retrenched more in terms of both employment and capital spending, and their rebound has been more muted. As an example, the global manufacturing and non-manufacturing PMIs have risen above the 50 line but the same measures in India remain below the 50 line (Chart I-2). India’s employment index from the Manpower group has fallen to a record low as of early July (Chart I-3). As a result, household nominal income growth – which was slumping before the pandemic – has fallen much further. Chart I-2India Is Lagging In Global Recovery
India Is Lagging In Global Recovery
India Is Lagging In Global Recovery
Chart I-3India: Employment Conditions Are Very Poor
India: Employment Conditions Are Very Poor
India: Employment Conditions Are Very Poor
Passenger car and commercial vehicle sales have plummeted (Chart I-4). Corporate investment expenditure and production have crashed. Manufacturing output, capital goods production and imports all plummeted in March and April and rebounded only mildly in June (Chart I-5). Chart I-4India: Discretionary Spending Is Slow To Recover...
India: Discretionary Spending Is Slow To Recover...
India: Discretionary Spending Is Slow To Recover...
Chart I-5...As Are Production And Investment
...As Are Production And Investment
...As Are Production And Investment
Table I-1India: Share Of Each Equity Sector In Profits & Market Cap
Strategy For Indian Equities And Fixed-Income
Strategy For Indian Equities And Fixed-Income
Economic activity will improve gradually but the level of activity will remain below the pandemic level for some time. As a result, corporate profits will be slow to revive. Odds are that it will take more than one and half years before the EPS of listed companies reach their 2019 level. This is especially true for severely hit sectors – financials, industrials, materials, and consumer discretionary stocks – which together account for 44% of listed companies’ profits. The sectors less affected by the pandemic recession – namely, consumer staples, information technology and health care – together account for 30% of corporate profits (Table I-1). A Breakdown In The Monetary Transmission Mechanism Impediments to rapid economic recovery are the modest fiscal stimulus and a breakdown in the monetary transmission mechanism. While India announced a large fiscal stimulus, much of this is made up of loan guarantees. Some measures like central bank purchases of government bonds also do not represent actual fiscal spending. Chart I-6 illustrates that government spending has risen only moderately and it has been offset by the drop in the credit impulse. Provided that the credit impulse will remain weak due to reasons we discuss below, the aggregate stimulus will not be sufficient to produce a robust and rapid recovery. The outlook for the economy and for corporate profits does not justify the current level of share prices. Critically, the monetary policy transmission mechanism was impaired even before the pandemic broke out in India, and the situation has gotten worse since March. Even though the Reserve Bank of India (RBI) has been reducing its policy rate, the prime lending rate has dropped very modestly (Chart I-7). Indian commercial banks which are saddled with non-performing loans (NPLs) have been reluctant to reduce their lending rates. Chart I-6Drag From Credit Impulse Has Offset Fiscal Stimulus
Drag From Credit Impulse Has Offset Fiscal Stimulus
Drag From Credit Impulse Has Offset Fiscal Stimulus
Chart I-7India: Very Little Decline In Prime Lending Rate
India: Very Little Decline In Prime Lending Rate
India: Very Little Decline In Prime Lending Rate
Even though AAA local currency corporate bond yields have dropped, BBB corporate bond yields remain above 10% (Chart I-8). This compares with 5-year government bond yields of 5%. Critically, in real (inflation-adjusted) terms, borrowing costs remain elevated (Chart I-9). Such elevated real borrowing costs will continue to hinder credit demand. Chart I-8Corporate Bond Yields Remain Elevated
Corporate Bond Yields Remain Elevated
Corporate Bond Yields Remain Elevated
Chart I-9Borrowing Costs In Real Terms Are Restrictive
Borrowing Costs In Real Terms Are Restrictive
Borrowing Costs In Real Terms Are Restrictive
Finally, banks might be reluctant to originate much credit because of the rise in NPLs and the uncertainty over the extension of government guarantees on pandemic-induced NPLs and their own recapitalization programs. Bottom Line: Limited fiscal stimulus and a broken monetary transmission mechanism herald lackluster economic and profit recoveries. Beyond Mega Caps The strong rally in certain mega-cap stocks has masked the muted revival in the broad equity universe. The MSCI equity index has rallied by 50% since its late March lows and stands only 7% below its pre-pandemic highs in local currency terms. Yet, the MSCI equal-weighted index and small caps are, in local currency terms, still 15% and 16% below their pre-pandemic highs, respectively (Chart I-10). The performance of the overall equity index has been exaggerated by the rally in Reliance Industries’ share price as well as information technology stocks, consumer staples and health care. The 150% surge in Reliance Industries stock price since late March lows is due to company-specific rather than macro factors. This company presently accounts for 15% of the MSCI India index. The monetary policy transmission mechanism was impaired even before the pandemic broke out in India. In addition, info technology, consumer staples and health care (including sales of personal care products and medicine) have benefited due to the pandemic. By contrast, equity sectors leveraged to the business cycle in general and discretionary spending in particular have all underperformed. Importantly, bank share prices have been devasted due to poor economic growth and rising NPLs. India’s mega-cap stocks that have led the rally since March lows are expensive, as anywhere else. Finally, India’s equal-weighted equity index has failed to meaningfully outperform the EM equal-weighted index after underperforming severely in late 2019 and Q1 2020 (Chart I-11). Chart I-10Muted Revival In Broader Equity Universe
Muted Revival In Broader Equity Universe
Muted Revival In Broader Equity Universe
Chart I-11India Relative To EM: Little Outperformance
India Relative To EM: Little Outperformance
India Relative To EM: Little Outperformance
Bottom Line: The advance in Indian share prices has been amplified by the rally in large-cap stocks. Meanwhile, the equal-weighted and small-cap indexes have done considerably worse reflecting the downbeat economic conditions. Equity Valuations And Strategy Chart I-12Indian Equity Valuations Are Elevated On A Market-Cap Basis...
Indian Equity Valuations Are Elevated On A Market-Cap Basis...
Indian Equity Valuations Are Elevated On A Market-Cap Basis...
As discussed earlier, India’s equity market leaders like information technology, consumer staples and health care are already expensive, trading at a trailing P/E ratio of 23, 47 and 33, respectively. The rest of the equity market is not expensive, but its profit outlook is mediocre. As to other valuation metrices, the market seems to be moderately expensive both on an absolute basis and versus the EM equity benchmark: The 12-month forward P/E ratio is 22.5, the highest in the decade (Chart I-12, top panel). Relative to the EM benchmark, on the same measure is trading at 50% premium (Chart I-12, bottom panel). Based on the equal-weighted equity index – i.e. stripping out the effect of large-cap stocks on the index, Indian equities are overvalued in absolute terms (Chart I-13, top panel). On this equal-weighted measure, Indian stocks are currently trading at a 35% premium versus their EM peers (Chart I-13, bottom panel). The cyclically-adjusted P/E ratio is close to the historical mean (Chart I-14, top panel). Chart I-13...And On An Equal-Weighted Basis
...And On An Equal-Weighted Basis
...And On An Equal-Weighted Basis
Chart I-14Cyclically-Adjusted P/E Ratio
Cyclically-Adjusted P/E Ratio
Cyclically-Adjusted P/E Ratio
However, the CAPE ratio is agnostic to corporate earnings on a cyclical horizon. It assumes corporate profits will revert to their long-term rising trend (Chart I-14, bottom panel). This is not assured in the next six months in our opinion. Hence, a lackluster profits recovery – profits disappointments – is a risk to the performance of India’s bourse in the coming months. Equity Strategy: Weighing pros and cons, we recommend that dedicated EM equity investors maintain an underweight position in India within an EM equity portfolio. However, they should consider upgrading this bourse on potential near-term underperformance. The strong rally in certain mega-cap stocks has masked the muted revival in the broad equity universe. Absolute-return investors should consider buying this bourse on a setback in the coming months. Odds are that the index could drop up to 15% in US dollar terms triggered by a potential global risk-off phase and domestic profit disappointments. Currency And Fixed-Income Chart I-15Consumer Inflation Is Not A Problem In India
Consumer Inflation Is Not A Problem In India
Consumer Inflation Is Not A Problem In India
We have been recommending receiving 10-year swap rates in India since April 23 and this recommendation remains intact. As argued above, the economic recovery will be gradual, and the output gap will remain negative for some time. Consequently, wages and inflation will likely surprise on the downside. Even though headline and core inflation rates have recently picked up, this has been due to a rise in food prices, transportation and personal care products (Chart I-15). Hence, there are not genuine inflationary pressures in India and the RBI will be making a mistake if it stops easing due to rises in headline or core CPI readings. Food prices have been rising for a while due to supply shocks. Importantly, the rise in food prices should not be interpreted as genuine inflation. Meanwhile, personal care products include gold jewelry and this CPI sub-component has therefore been rising due to the surge in gold prices (Chart I-15, bottom panel). Finally, transport costs have been on the rise due to supply chain bottlenecks in India as a result of COVID-19 and due to the rise in global oil prices. The broken monetary transmission mechanism means that the RBI will have to cut rates by much more. The fixed-income market is not discounting rate cuts. There is value in long-term rates in India. The yield curve is very steep – the spread between 10-year and 1-year swap rates is 92 basis points. In addition, 10-year government bond yields are currently yielding 522 basis points above 10-year US Treasurys. We are not particularly concerned about public debt. Central government debt was at 52% of GDP before the recession and total public debt (including both central and state governments) was 80% of GDP. The same ratios are much higher in many other EM and DM economies. Chart I-16India's Stock-To-Bond Ratio Is At A Critical Resistance
India's Stock-To-Bond Ratio Is At A Critical Resistance
India's Stock-To-Bond Ratio Is At A Critical Resistance
Finally, the rupee could correct as the US dollar rebounds from oversold levels, but foreign investors should use that setback in India’s exchange rate to rotate from receiving rates to buying 10-year government bonds outright, i.e., taking on currency risk. The RBI has been accumulating foreign exchange reserves, meaning it has been preventing the currency from appreciating. The current account is balanced and the financial/capital account has passed its worse phase. India will continue to attract foreign capital due to its long-term appeal and higher-than-elsewhere interest rates. Domestic investors should favor bonds over stocks in the near term (Chart I-16). Bottom Line: Continue betting on lower interest rates in India. Fixed income investors should switch from receiving rates to buying 10-year government bonds on a correction in the rupee in the coming months. Dedicated EM local currency bond portfolios should continue overweighting India. Arthur Budaghyan Chief Emerging Markets Strategist arthurb@bcaresearch.com Ayman Kawtharani Editor/Strategist ayman@bcaresearch.com Footnotes Equities Recommendations Currencies, Credit And Fixed-Income Recommendations