Emerging Markets

Highlights Yesterday we published a Special Report titled EM: Foreign Currency Debt Strains. We are upgrading our stance on EM local currency bonds from negative to neutral. Before upgrading to a bullish stance, we would first need to upgrade our stance on EM currencies. We recommend receiving long-term swap rates in Russia, Mexico, Colombia, China and India. EM central banks’ swap lines with the Fed could be used to fend off short-term speculative attacks on EM currencies. Nevertheless, they cannot prevent EM exchange rates from depreciation when fundamental pressures warrant weaker EM currencies. For the rampant expansion of US money supply to produce a lasting greenback depreciation, US dollars should be recycled abroad. This is not yet occurring. Domestic Bonds: A New Normal Chart I-1Performance Of EM Domestic Bonds In The Last Decade
Performance Of EM Domestic Bonds In The Last Decade
Performance Of EM Domestic Bonds In The Last Decade
In recent years, our strategy has favored the US dollar and, by extension, US Treasurys over EM domestic bonds. Chart I-1 demonstrates that the EM GBI local currency bond total return index in US dollar terms is at the same level as it was in 2011, and has massively underperformed 5-year US Treasurys. We are now upgrading our stance on EM local currency bonds from negative to neutral. Consistently, we recommend investors seek longer duration in EM domestic bonds while remaining cautious on the majority of EM currencies. Before upgrading to a bullish stance on EM local bonds, we would first need to upgrade our stance on EM currencies. Still, long-term investors who can tolerate volatility should begin accumulating EM local bonds on any further currency weakness. Our upgrade is based on the following reasons: First, there has been a fundamental shift in EM central banks’ policies. In past global downturns, many EM central banks hiked interest rates to defend their currencies. Presently, they are cutting rates aggressively despite large currency depreciation. This is the right policy action to fight the epic deflationary shock that EM economies are presently facing. There has been a fundamental shift in EM central banks’ policies. They are cutting rates aggressively despite large currency depreciation. Historically, EM local bond yields were often negatively correlated with exchange rates (Chart I-2, top panel). Similarly, when EM currencies began plunging two months ago, EM local bond yields initially spiked. However, following the brief spike, bond yields have begun dropping, even though EM currencies have not rallied (Chart I-2, bottom panel). This represents a new normal, which we discussed in detail in our October 24 report. Overall, even if EM currencies continue to depreciate, EM domestic bond yields will drop as they price in lower EM policy rates. Second, the monetary policy transmission mechanism in many EMs was broken before the COVID-19 outbreak. Even though central banks in many developing countries were reducing their policy rates before the pandemic, commercial banks’ corresponding lending rates were not dropping much (Chart I-3, top panel). Chart II-2EM Local Bond Yields And EM Currencies
EM Local Bond Yields And EM Currencies
EM Local Bond Yields And EM Currencies
Chart I-3EM ex-China: Monetary Transmission Has Been Impaired
EM ex-China: Monetary Transmission Has Been Impaired
EM ex-China: Monetary Transmission Has Been Impaired
Further, core inflation rates were at all time lows and prime lending rates in real terms were extremely high (Chart I-3, middle panels). Consequently, bank loan growth was slowing preceding the pandemic (Chart I-3, bottom panel). The reason was banks’ poor financial health. Saddled with a lot of NPLs, banks had been seeking wide interest rate margins to generate profit and recapitalize themselves. With the outburst of the pandemic and the sudden stop in domestic and global economic activity, EM banks’ willingness to lend has all but evaporated. Chart I-4 reveals EM ex-China bank stocks have plunged, despite considerable monetary policy easing in EM, which historically was bullish for bank share prices. This upholds the fact that the monetary policy transmission mechanism in EM is broken. Mounting bad loans due to the pandemic will only reinforce these dynamics. Swap lines with the Fed cannot prevent EM exchange rates from depreciation when fundamental pressures – global and domestic recessions – warrant weaker EM currencies. In brief, EM lower policy rates will not be transmitted to lower borrowing costs for companies and households anytime soon. Loan growth and domestic demand will remain in an air pocket for some time. Consequently, EM policy rates will have to drop much lower to have a meaningful impact on growth. Third, there is value in EM local yields. The yield differential between EM GBI local currency bonds and 5-year US Treasurys shot up back to 500 basis points, the upper end of its historical range (Chart I-5). Chart I-4EM ex-China: Bank Stocks Plunged Despite Rate Cuts
EM ex-China: Bank Stocks Plunged Despite Rate Cuts
EM ex-China: Bank Stocks Plunged Despite Rate Cuts
Chart I-5The EM Vs. US Yield Differential Is Attractive
The EM Vs. US Yield Differential Is Attractive
The EM Vs. US Yield Differential Is Attractive
Bottom Line: Odds favor further declines in EM local currency bond yields. Fixed-income investors should augment their duration exposure. We express this view by recommending receiving swap rates in the following markets: Russia, Mexico, Colombia, India and China. This is in addition to our existing receiver positions in Korean and Malaysian swap rates. For more detail, please refer to the Investment Recommendations section on page 8. Nevertheless, absolute-return investors should be cognizant of further EM currency depreciation. EM Currencies: At Mercy Of Global Growth Chart I-6EM Currencies Correlate With Commodities Prices
EM Currencies Correlate With Commodities Prices
EM Currencies Correlate With Commodities Prices
The key driver of EM currencies has been and remains global growth. The latter will remain very depressed for some time, warranting patience before turning bullish on EM exchange rates. We have long argued that EM exchange rates are driven not by US interest rates but by global growth. Industrial metals prices offer a reasonable pulse on global growth. Chart I-6 illustrates their tight correlation with EM currencies. Even though the S&P 500 has rebounded sharply in recent weeks, there are no signs of a meaningful improvement in industrial metals prices. Various raw materials prices in China are also sliding (Chart I-7). In a separate section below we lay out the case as to why there is more downside in iron ore and steel as well as coal prices in China. Finally, the ADXY – the emerging Asia currency index against the US dollar – has broken down below its 2008, 2016 and 2018-19 lows (Chart I-8). This is a very bearish technical profile, suggesting more downside ahead. This fits with our fundamental assessment that a recovery in global economic activity is not yet imminent. Chart I-7China: Commodities Prices Are Sliding
China: Commodities Prices Are Sliding
China: Commodities Prices Are Sliding
Chart I-8A Breakdown In Emerging Asian Currencies
A Breakdown In Emerging Asian Currencies
A Breakdown In Emerging Asian Currencies
What About The Fed’s Swap Lines? A pertinent question is whether EM central banks’ foreign currency reserves and the Federal Reserve’s swap lines with several of its EM counterparts are sufficient to prop up EM currencies prior to a pickup in global growth. The short answer is as follows: These swap lines will likely limit the downside but cannot preclude further depreciation. With the exception of Turkey and South Africa, virtually all mainstream EM banks have large foreign currency reserves. On top of this, several of them – Brazil, Mexico, South Korea and Singapore– have recently obtained access to Fed swap lines. Their own foreign exchange reserves and the swap lines with the Fed give them an option to defend their currencies from depreciation if they choose to do so. However, selling US dollars by EM central banks is not without cost. When central banks sell their FX reserves or dollars obtained from the Fed via swap lines, they withdraw local currency liquidity from the system. As a result, banking system liquidity shrinks, pushing up interbank rates. This is equivalent to hiking interest rates. The Fed’s outright money printing is the sole reason to buy EM risk assets and currencies at the moment. Yet, EM fundamentals – namely, its growth outlook – remain downbeat. Hence, the cost of defending the exchange rate by using FX reserves is both liquidity and credit tightening. In such a case, the currency could stabilize but the economy will take a beating. Since the currency depreciation was itself due to economic weakness, such a policy will in and of itself be self-defeating. The basis is that escalating domestic economic weakness will re-assert its dampening effect on the currency. Of course, EM central banks can offset such tightening by injecting new liquidity. However, this could also backfire and lead to renewed currency depreciation. Bottom Line: EM central banks’ swap lines with the Fed are primarily intended to instill confidence among investors in financial markets. They could be used to fend off short-term speculative attacks on EM currencies. Nevertheless, they cannot prevent EM exchange rates from depreciation when fundamental pressures – global and domestic recessions – warrant weaker EM currencies. What About The Fed’s Money Printing? Chart I-9The Fed Is Aggressively Printing Money
The Fed Is Aggressively Printing Money
The Fed Is Aggressively Printing Money
The Fed is printing money and monetising not only public debt but also substantial amounts of private debt. This will ultimately be very bearish for the US dollar. Chart I-9 illustrates that the Fed is printing money much more aggressively than during its quantitative easing (QE) policies post 2008. The key difference between the Fed’s liquidity provisions now and during its previous QEs is as follows: When the Fed purchases securities from or lends to commercial banks, it creates new reserves (banking system liquidity) but it does not create money supply. Banks’ reserves at the Fed are not a part of broad money supply. This was generally the case during previous QEs when the Fed was buying bonds mostly – but not exclusively – from banks, therefore increasing reserves without raising money supply by much. When the Fed lends to or purchases securities from non-banks, it creates both excess reserves for the banking system and money supply (deposits at banks) out of thin air. The fact that US money supply (M2) growth is now much stronger than during the 2010s QEs suggests the recent surge in US money supply is due to the Fed’s asset purchases from and lending to non-banks, which creates money/deposits outright. The rampant expansion of US money supply will eventually lead to the greenback’s depreciation. However, for the US dollar to depreciate against EM currencies, the following two conditions should be satisfied: 1. US imports should expand, reviving global growth, i.e., the US should send dollars to the rest of the world by buying goods and services. This is not yet happening as domestic demand in America has plunged and any demand recovery in the next three to six months will be tame and muted. 2. US investors should channel US dollars to EM to purchase EM financial assets. In recent weeks, foreign flows have been returning to EM due to the considerable improvement in EM asset valuations. However, the sustainability of these capital flows into EM remains questionable. The main reasons are two-fold: (A) there is huge uncertainty on how efficiently EM countries will be able handle the economic and health repercussions of the pandemic; and (B) global growth remains weak and, as we discussed above, it has historically been the main driver of EM risk assets and currencies. Bottom Line: The Fed’s outright money printing is the sole reason to buy EM risk assets and currencies at the moment. Yet, EM fundamentals – namely, its growth outlook – remain downbeat. Overall, we recommend investors to stay put on EM risk assets and currencies in the near-term. Investment Recommendations Chart I-10China: Bet On Lower Long-Term Yields
China: Bet On Lower Long-Term Yields
China: Bet On Lower Long-Term Yields
We have been recommending receiving rates in a few markets such as Korea and Malaysia. Now, we are widening this universe to include Russia, Mexico, Colombia, China, and India. In China, the long end of the yield curve offers value (Chart I-10, top panel). The People’s Bank of China has brought down short rates dramatically but the long end has so far lagged (Chart I-10, bottom panel). We recommend investors receive 10-year swap rates. Fixed-income investors could also bet on yield curve flattening. The recovery in China will be tame and the PBoC will keep interest rates lower for longer. Consequently, long-dated swap rates will gravitate toward short rates. We are closing three fixed-income trades: In Mexico, we are booking profits on our trade of receiving 2-year / paying 10-year swap rates – a bet on a steeper yield curve. This position has generated a 152 basis-point gain since its initiation on April 12, 2018. In Colombia, our bet on yield curve flattening has produced a loss of 28 basis points since January 17, 2019. We are closing it. In Chile, we are closing our long 3-year bonds / short 3-year inflation-linked bonds position. This trade has returned 2.0% since we recommended it on October 3, 2019. For dedicated EM domestic bond portfolios, our overweights are Russia, Mexico, Peru, Colombia, Korea, Malaysia, Thailand, India, China, Pakistan and Ukraine. Our underweights are South Africa, Turkey, Brazil, Indonesia and the Philippines. The remaining markets warrant a neutral allocation. Regarding EM currencies, we continue to recommend shorting a basket of the following currencies versus the US dollar: BRL, CLP, ZAR, IDR, PHP and KRW. Arthur Budaghyan Chief Emerging Markets Strategist arthurb@bcaresearch.com Chinese Steel, Iron Ore And Coal Markets: Heading South Chart II-1Steel, Iron Ore And Coal Prices: More Downside Ahead?
Steel, Iron Ore And Coal Prices: More Downside Ahead?
Steel, Iron Ore And Coal Prices: More Downside Ahead?
Odds are that iron ore, steel and coal prices will all continue heading south (Chart II-1). Lower prices will harm both Chinese and global producers of these commodities. Steel And Iron Ore The oversupplied conditions in the Chinese steel market will become even more aggravated over the next three to six months. First, Chinese output of steel products has not contracted even though demand plunged in the first three months of the year, creating oversupply. Despite falling steel prices and the demand breakdown resulting from the COVID-19 outbreak, Chinese crude steel output still grew at 1.5% and its steel products output only declined 0.6% between January and March from a year ago (Chart II-2). Chart II-2Steel Products Output In China: Still No Contraction
Steel Products Output In China: Still No Contraction
Steel Products Output In China: Still No Contraction
The profit margin of Chinese steel producers has compressed but not enough to herald a sizable cut in mainland steel production. Despite oversupply, Chinese steel producers are reluctant to curtail output to prevent layoffs. This year, there will be 62 million tons of new steel production capacity while 82 million tons of obsolete capacity will be shut down. As the capacity-utilization rate (CUR) of the new advanced production capacity will be much higher than the CUR on those soon-to-be-removed capacities in previous years, this will help lift steel output. Second, Chinese steel demand has plummeted, and any revival will be mild and gradual over the next three to six months. Construction accounts for about 55% of Chinese steel demand, with about 35% coming from the property market and 20% from infrastructure. Additionally, the automobile industry contributes about 10% of demand. All three sectors are currently in deep contraction (Chart II-3). Looking ahead, we expect that the demand for steel from property construction and automobile production will revive only gradually. Overall, it will continue contracting on a year-on-year basis, albeit at a diminishing rate than now. While we projected a 6-8% rise in Chinese infrastructure investment for this year, most of that will be back-loaded to the second half of the year. In addition, modest and gradual steel demand increases from this source will not be able to offset the loss of demand from the property and automobile sectors. The oversupplied conditions in the Chinese steel market will become even more aggravated over the next three to six months. Reflecting the disparity between weak demand and resilient supply, steel inventories in the hands of producers and traders are surging, which also warrants much lower prices (Chart II-4). Chart II-3Deep Contraction In Steel Demand From Major Users
Deep Contraction In Steel Demand From Major Users
Deep Contraction In Steel Demand From Major Users
Chart II-4Significant Build-Up In Steel Inventories
Significant Build-Up In Steel Inventories
Significant Build-Up In Steel Inventories
Chart II-5Chinese Iron Ore Imports Will Likely Decline In 2020
Chinese Iron Ore Imports Will Likely Decline In 2020
Chinese Iron Ore Imports Will Likely Decline In 2020
Regarding iron ore, mushrooming steel inventories in China and lower steel prices will eventually lead to steel output cutbacks in the country. This will be compounded by shrinking steel production outside of China, dampening global demand for iron ore. Besides, in China, scrap steel prices have fallen more sharply than iron ore prices have. This makes the use of scrap steel more appealing than iron ore in steel production. Chinese iron ore imports will likely drop this year (Chart II-5). Finally, the global output of iron ore is likely to increase in 2020. The top three producers (Vale, Rio Tinto and BHP) have all set their 2020 guidelines above their 2019 production levels. This will further weigh on iron ore prices. Coal Although Chinese coal prices will also face downward pressure, we believe that the downside will be much less than that for steel and iron ore prices. Coal prices have already declined nearly 27% from their 2019 peak. They recently declined below 500 RMB per ton – the lower end of a range that the government generally tries to maintain. Prices had not dropped below this level since September 2016. In the near term, prices could go down by another 5-10%, given that record-high domestic coal production and imports have overwhelmed the market (Chart II-6). Coal prices have already declined nearly 27% from their 2019 peak. They recently declined below 500 RMB per ton – the lower end of a range that the government generally tries to maintain. However, there are emerging supportive forces. China Coal Transport & Distribution Association (CCTD), the nation’s leading industry group, on April 18, called on the industry to slash production (of both thermal and coking coal) in May by 10%. It also proposed that the government should restrict imports. The CCTD stated that about 42% of the producers are losing money at current coal prices. The government had demanded producers make similar cuts for a much longer time duration in 2016, which pushed coal to sky-high prices. The outlook for a revival in the consumption of electricity and, thereby, in the demand for coal is more certain than it is for steel and iron ore. About 60% of Chinese coal is used to generate thermal power. Finally, odds are rising that the government will temporarily impose restrictions on coal imports as it did last December – when coal imports to China fell by 70% as a result. Investment Implications Companies and countries producing these commodities will be hurt by the reduction of Chinese purchases. These include, but are not limited to, producers in Indonesia, Australia, Brazil and South Africa. Iron ore and coal make up 10% of total exports in Brazil, 6% in South Africa, 18% in Indonesia and 32% in Australia. Investors should avoid global steel and mining stocks (Chart II-7). Chart II-6Chinese Coal Output And Imports Are At Record Highs
Chinese Coal Output And Imports Are At Record Highs
Chinese Coal Output And Imports Are At Record Highs
Chart II-7Avoid Global Steel And Mining Stocks For Now
Avoid Global Steel And Mining Stocks For Now
Avoid Global Steel And Mining Stocks For Now
We continue to recommend shorting BRL, ZAR and IDR versus the US dollar. Ellen JingYuan He Associate Vice President ellenj@bcaresearch.com Footnotes Equities Recommendations Currencies, Credit And Fixed-Income Recommendations
Highlights The Chinese economy is recovering at a slower rate than the equity market has priced in. There is a high likelihood of negative revisions to Q2 EPS estimates and an elevated risk of a near-term price correction in Chinese stocks. We expect a meaningful pickup in credit growth in H1 to improve domestic demand gain tractions in H2. This supports our overweight stance on Chinese stocks in the next 6-12 months, in both absolute and relative terms. There is still a strong probability that the yield curve will flatten, and the 10-year government bond yield may even dip below 2% in the wake of disappointing economic data in Q2. But our baseline scenario suggests the 10-year government bond yield should bottom no later than Q3 of this year. Feature This week’s report addresses pressing concerns from clients in China’s post-Covid-19 environment. China’s economy contracted by 6.8% in Q1, the largest GDP growth slump since 1976. Furthermore, the IMF’s baseline scenario projects a 3% contraction in global economic growth in 2020, with the Chinese economy growing at a mere 1.2%.1 This dim annual growth outlook means that the contraction in China’s economy will likely extend to Q2, dragging down corporate profit growth. In our April 1st report2 we recommended that investors maintain a neutral stance on Chinese stocks in the next three months due to uncertainties surrounding the pandemic, the oversized passive outperformance in Chinese stocks, and heightened risks for further risk-asset selloffs. On a 6- to 12-month horizon, however, we have a higher conviction that Chinese stocks will outperform global benchmarks. Our view is based on a decisive shift by policymakers to a “whatever it takes” approach to boost the economy. We believe that the speed of China’s economic recovery in the second half of 2020 will outpace other major economies. Q: China’s economy is recovering ahead of other major economies. Why did you recently downgrade your tactical call on Chinese equities from overweight to neutral relative to global stocks? A: China’s economy is recovering, but it is recovering at a slower rate than the equity market has fully priced in (Chart 1A and 1B). We believe the likelihood of negative revisions to Q2 EPS estimates is high, and the risk of a near-term price correction in Chinese stocks remains elevated. Chart 1AElevated Chinese Equity Outperformance Relative To Global Stocks
Elevated Chinese Equity Outperformance Relative To Global Stocks
Elevated Chinese Equity Outperformance Relative To Global Stocks
Chart 1BChinese Stocks Largely Ignored Weakness In Domestic Economy
Chinese Stocks Largely Ignored Weakness In Domestic Economy
Chinese Stocks Largely Ignored Weakness In Domestic Economy
The lackluster March data suggests that the pace of China’s economic recovery in April and even May will likely disappoint, weighing on the growth prospects for Q2’s corporate earnings (Chart 2). Chart 2EPS Growth Estimates Likely To Capitulate In Q2
EPS Growth Estimates Likely To Capitulate In Q2
EPS Growth Estimates Likely To Capitulate In Q2
The work resumption rate in China’s 36 provinces jumped sharply between mid-February and mid-March. However, since that time, the resumption rate among large enterprises has hovered around 80% of normal capacity (Chart 3). Chart 3Work Resumption Hardly Improved Since Mid-March
Three Questions Following The Coronacrisis
Three Questions Following The Coronacrisis
The flattening of the work resumption rate curve is due to a lack of strong recovery in demand. Chart 4So Far No Strong Recovery In Domestic Demand
So Far No Strong Recovery In Domestic Demand
So Far No Strong Recovery In Domestic Demand
The flattening of the resumption rate curve is due to a lack of strong recovery in demand. Although there was a surge in Chinese imports in crude oil and raw materials, the increase was the result of China taking advantage of low commodity prices. This surge cannot be sustained without a pickup in domestic demand. The March bounce back in domestic demand from the manufacturing, construction, and household sectors has all been lackluster (Chart 4). External demand, which growth remained in contraction through March, will likely worsen in Q2 (Chart 5). Exports shrunk by 6.6% in March, up from a deep contraction of 17.2% in January-February. Export orders can take more than a month to be processed, therefore, March’s data reflects pent-up orders from the first two months of the year. The US and European economies started their lockdowns in March, so Chinese exports will only feel the full impact of the collapse in demand from its trading partners in April and May. The work resumption rate will advance only if the momentum in domestic demand recovery increases to fully offset the collapse in external demand. The current 83% rate of work resumption implies that industrial output growth in April will remain in contraction on a year-over-year basis (Chart 6). Chart 5External Demand Will Worsen In Q2
External Demand Will Worsen In Q2
External Demand Will Worsen In Q2
Chart 6Will Q2 Industrial Output Growth Remain In Contraction?
Will Q2 Industrial Output Growth Remain In Contraction?
Will Q2 Industrial Output Growth Remain In Contraction?
Although we maintain a constructive outlook on Chinese risk assets in the next 6 to 12 months, the short-term picture remains volatile in view of the emerging economic data. As such, we recommend investors to maintain short-term hedges for risk asset positions. Q: China’s policy response to mitigate the economic blow from COVID-19 has been noticeably smaller than programs rolled out in key developed economies, especially the US. Why do you think such measured stimulus from China warrants an overweight stance on Chinese stocks in the next 6-12 months relative to global benchmarks? A: It is true that the size of existing Chinese stimulus, as a percentage of the Chinese economy, is smaller than that has been announced in the US. But this is due to a different approach China is taking in stimulating its economy. In addition, both the recent policy rhetoric and PBoC actions suggest a large credit expansion is in the works. This will likely overcompensate the damage on China’s aggregate economy, and generate an outperformance in both Chinese economic growth and returns on Chinese risk assets in the next 6 to 12 months. China’s policy responses have an overarching focus on stimulating new demand and investment, which is a different approach from the programs offered by its Western counterparts. In the US, the combination of fiscal and monetary stimulus amounts to 11% of GDP as of April 16, with almost all policy support targeted at keeping companies and individuals afloat. In comparison, China’s policy response accounts for a mere 1.2% of its GDP.3 However, this direct comparison understates the enormous firepower in the Chinese stimulus toolkit, specifically a credit boom. As noted in our February 26 report,4 China has largely resorted to its “old economic playbook” by generating a huge credit wave to ride out the economic turmoil. Our prediction of the policy shift towards a significant escalation in stimulus was confirmed at the March 27 Politburo meeting. Moreover, the April 17 Politburo meeting reinforced a “whatever it takes” policy shift with direct calls on more forceful central bank policy actions, a first since the global financial crisis in 2008.5 Since 2008, the overnight repo rate’s breaking into the IORR-IOER corridor has been a reliable indicator leading to impressive credit upcycles. The PBoC’s recent aggressive easing measures have pushed down the interbank repo rate below the central bank’s interest rate on required reserves (IORR). The price for interbank borrowing is now near the lower range of the rate corridor, between the IORR and the interest rate on excess reserves (IOER). Since 2008, the overnight repo rate’s breaking into the IORR-IOER corridor has been a reliable indicator leading to impressive credit upcycles (Chart 7). Such credit super cycles, in turn, have led to both economic booms and an outperformance in Chinese stocks. Chart 7Another Credit Super Cycle Is In The Works
Another Credit Super Cycle Is In The Works
Another Credit Super Cycle Is In The Works
Chart 8Financial Conditions Were Extremely Tight In 2011-2014
Financial Conditions Were Extremely Tight In 2011-2014
Financial Conditions Were Extremely Tight In 2011-2014
The 2012-2015 cycle was an exception to the relationship between the overnight interbank repo rate, credit growth and Chinese stock performance. A steep pickup in credit growth in 2012 coincided with a leap in the overnight interbank repo rate, and the credit boom did not help boost demand in the real economy or improve Chinese stock performance. This is because corporate borrowing was severely curtailed by high lending rates during a four-year monetary tightening cycle from 2011 to 2014 (Chart 8). The credit boom during that cycle was largely driven by explosive growth in short-term shadow-bank lending and wealth management products (WMP), and did not channel into the real economy.6 We do not think such an extreme phenomena will replay under the current circumstances. Monetary stance will likely remain tremendously accommodative through the end of the year to facilitate a continuous rollout of medium- to long-term bank loans and local government bonds. Chinese financial institutions’ “animal spirits” may have been unleashed. But under the scrutiny of the Macro-Prudential Assessment Framework and the New Asset Management Rules,7 the "animal spirits" are unlikely to run up enough risks to prompt the PBoC to prematurely tighten liquidity conditions in the interbank market. Marginal propensity in China is pro-cyclical, which tends to lag credit cycles by 6 months. Chart 9Marginal Propensity In China Is Pro-Cyclical
Marginal Propensity In China Is Pro-Cyclical
Marginal Propensity In China Is Pro-Cyclical
Both corporate and household marginal propensity, a measure of the willingness to spend, will pick up as well. Marginal propensity is pro-cyclical, which tends to lag credit cycles by 6 months (Chart 9). In other words, when interest rates are low and credit growth improves, corporates and households tend to spend more. The meaningful expansion in credit growth, which started in Q1 and will sustain in the coming two to three quarters, will help corporate and household spending gain tractions in H2. This constructive view on Chinese stimulus and economic recovery supports our overweight stance on Chinese stocks in the next 6-12 months, in both absolute and relative terms. Q: The yield curve in Chinese government bonds has steepened following PBoC’s aggressive monetary easing announcements. Has the Chinese 10-year bond yield bottomed? A: No, we do not think the 10-year bond yield has bottomed. There is probability the 10-year government bond yield may briefly dip below 2% in Q2. However, barring a multi-year global economic recession, we think the 10-year government bond yield will bottom no later than Q3 this year. Chart 10A Wide Gap Between The Long and Short
A Wide Gap Between The Long and Short
A Wide Gap Between The Long and Short
The short end of the yield curve dropped disproportionally compared with the long end, following the PBoC’s announcement to place its first IOER cut since 2008 (Chart 10). This led to a rapid steepening in the yield curve. While our view supports a flattening of the yield curve in Q2 and even a 50bps drop in the 10-year government bond yield, we think that the capitulation will be brief. In order for the 10-year government bond yield to remain below 2% for an extended period of time, the market needs to believe one or more of the following will happen: The pandemic will cause a multi-year global economic recession, preventing the PBoC from normalizing its policy stance in the foreseeable future. The duration and depth of the economic impact from the pandemic are still moving targets. Our baseline scenario suggests that the Chinese economic recovery will pick up momentum in H2 this year. The PBoC will not normalize its policy stance even when the economy has stabilized. The PBoC has a track record as a reactive central bank rather than a proactive one. Still, during each of the past three economic and credit cycles, the PBoC has started to normalize its interest rate on average nine months following a bottom in the business cycle (Chart 11). The tightening of interest rate even applied to the prolonged economic downturn and deep deflationary cycle in 2015/16 (Chart 12). Chart 11The 'Old Faithful' PBoC Policy Normalization Pattern
The 'Old Faithful' PBoC Policy Normalization Pattern
The 'Old Faithful' PBoC Policy Normalization Pattern
Chart 12Policy Normalized Even After A Long Economic Downturn
Policy Normalized Even After A Long Economic Downturn
Policy Normalized Even After A Long Economic Downturn
Chart 132008 Or 2015?
2008 Or 2015?
2008 Or 2015?
How the yield curve has historically behaved also depended on the market’s expectations on the speed of the economic recovery, and the timing of the subsequent monetary policy normalization. The yield curved spiked in the wake of substantial monetary easing and pickup in credit growth, in both 2008 and 2015 (Chart 13). While in 2008 the yield curve moved in lockstep with the 3-month SHIBOR with a perfect reverse correlation, in the 2015/16 cycle the yield curve spiked initially but quickly flattened. The long end of the yield curve capitulated as soon as the market realized the economic slowdown was a prolonged one. The 10-year government bond yield, after trending sideways in early 2016, only truly bottomed after the nominal output growth troughed in Q1 2016 (Chart 13, bottom panel). Will the yield curve behave like in 2008, or more like in 2015 in this cycle? We think it will be somewhere in between. The current economic cycle bottomed in Q1, but the economy is only recovering slowly and we expect a U-shaped economic recovery rather than a 2008-style V-shaped one. At the same time, our baseline scenario does not suggest the current environment will evolve into a 4-year deflationary cycle as in the 2012-2016 period. Therefore, we expect the low interest rate environment to endure for another two to three quarters before the PBoC starts to reverse its policy stance back to the pre-COVID-19 range. As such, the yield on 10-year government bonds will fall, possibly by as much as 50bps, when the economic data disappoint in Q2 and more rate cuts are forthcoming. But it will bottom when the economic recovery starts to gain traction in H22020 and the market starts to price in a subsequent monetary policy normalization. When growth slows and debt rises sharply, the PBoC will need to join its western counterparts to permanently maintain an ultra-low interest rate policy to accommodate its high debt level. We acknowledge the fact that China’s potential output growth is trending down (Chart 14). But it has been trending downwards since 2011. A structurally slowing rate of economic growth has not prevented the PBoC from cyclically raising its policy rate. Hence, unless we see evidence that the pandemic is meaningfully lowering China’s potential growth on par with growth rates in the DMs, our baseline scenario does not support a structural ultra-low interest rate environment in China. China’s debt-to-GDP ratio will most likely rise substantially this year, given that the credit impulse will gain momentum and GDP will grow very modestly. However, this rapid rise in the debt-to-GDP ratio will most likely not be sustained beyond this year. Even if we assume that credit impulse will account for 40% of GDP in 2020 (the same magnitude as in 2008/09), a sharp reversal in the output gap in 2021, as predicted by IMF,8 will flatten the debt-to-GDP ratio curve (Chart 15). Moreover, following every credit super cycle in the past, Chinese authorities have put a brake on the debt-to-GDP ratio. Chart 14China's Potential Growth Is Likely To Trend Lower...
China's Potential Growth Is Likely To Trend Lower...
China's Potential Growth Is Likely To Trend Lower...
Chart 15...But Has Not Stopped PBoC From Flattening The Debt Curve
...But Has Not Stopped PBoC From Flattening The Debt Curve
...But Has Not Stopped PBoC From Flattening The Debt Curve
All in all, while we see a high possibility for the 10-year government bond yield to fall in Q2, the decline will be limited in terms of duration. Jing Sima China Strategist jings@bcaresearch.com Footnotes 1IMF World Economic Outlook, April 2020 2Please see China Investment Strategy Weekly Report "Investing During A Global Pandemic," dated April 1, 2020, available at cis.bcaresearch.com 3IMF, Policy Responses To COVID-19 https://www.imf.org/en/Topics/imf-and-covid19/Policy-Responses-to-COVID-19#U 4Please see China Investment Strategy Weekly Report "China: Back To Its Old Economic Playbook?" dated February 26, 2020, available at cis.bcaresearch.com 5“Stable monetary policy must become more flexible” and “use RRR reductions, lower interest rates, re-lending and other measures to preserve adequate liquidity and guide the loan prime rate downwards.” Statements from Xi Jinping, April 17, 2020 Politburo Meeting. http://www.gov.cn/xinwen/2020-04/17/content_5503621.htm 6 Bankers’ acceptances - short-term debt instruments guaranteed by commercial banks - swelled by 887% between end-2008 and 2012. The outstanding amount of WMPs jumped from 1.7 trillion RMB in 2009 to more than 9 trillion RMB by H12013. In contrast, the amount of RMB-denominated bank loans increased by only 67% during the same period. 7The Macro-Prudential Assessment Framework and the New Asset Management Rules were implemented in 2016 and 2018, respectively. They are designed to create additional restrictions to curb shadow-bank lending and broaden the PBoC’s oversight on banks’ WMP holdings. 8The April IMF World Economic Outlook predicts a 1.2% Chinese GDP growth in 2020 and a 9.2% GDP growth in 2021. Cyclical Investment Stance Equity Sector Recommendations
BCA Research's Emerging Markets Strategy service conducted an EM foreign debt vulnerability assessment based on foreign debt obligations (FDOs) and foreign funding requirements (FFRs). The FDO compares annualized US dollar export revenues available to each…
Highlights In mainstream EM, foreign currency debt restructuring is more likely to occur among corporates than governments. Thus, dedicated EM credit investors should overweight mainstream EM sovereign credit and underweight EM corporate debt. Urgency among EM companies and banks to hedge their large foreign currency liabilities will continue exerting downward pressure on EM exchange rates. Ongoing currency depreciation and the lack of buyers of last resort for EM credit underpin the following strategy: short EM sovereign and corporate credit / long US investment-grade corporate credit. Feature Scope And Focus Of Analysis This report re-visits the issue of EM foreign currency debt, assessing EM debt vulnerability. This report focuses on mainstream EM (countries included in Table 1), excluding Gulf countries and frontier markets. Frontier markets like Argentina, Ecuador, Egypt, Ukraine, Lebanon and sub-Saharan African countries occupy somewhat idiosyncratic positions and are therefore not part of this report. Gulf countries on the other hand, are extremely leveraged to oil prices and, unlike mainstream EMs they have currency pegs warranting a separate analysis.1 Chart 1Favor EM Sovereign Against EM Corporate Credit
Favor EM Sovereign Against EM Corporate Credit
Favor EM Sovereign Against EM Corporate Credit
Among mainstream EM countries, public debt restructuring is not imminent and in the majority of cases is unlikely. However, there is a growing risk of foreign currency debt restructuring among EM companies and banks. Hence, we make a new investment recommendation: overweight mainstream EM sovereign credit / underweight EM corporate debt (Chart 1). We also reiterate the short EM sovereign and corporate credit / long US investment-grade corporate credit strategy. In this report, foreign currency debt is defined as the sum of foreign debt securities (i.e., foreign currency bonds) and foreign currency loans. In short, foreign currency debt measures foreign currency borrowing of companies, banks and governments. These statistics do not include foreign holdings of local currency bonds and equities or any other local currency liability of residents to foreigners. Overall, the level of foreign currency debt is pertinent in assessing EM debt vulnerability originating from exchange rate depreciation. Table 12 offers comprehensive foreign currency debt statistics for each individual country and EM as a whole. It details foreign currency debt by type of borrower - the government, corporates and banks – and also reveals the breakdown between foreign debt securities and foreign currency loans for each segment. Table 1EM FX Debt: Who Owes How Much
EM: Foreign Currency Debt Strains
EM: Foreign Currency Debt Strains
Chart 2EM FX Debt Has Doubled Since 2008
EM FX Debt Has Doubled Since 2008
EM FX Debt Has Doubled Since 2008
The foreign currency debt of Chinese companies and banks is quite substantial relative to other EM countries. Hence, including China in the EM aggregates would materially affect these EM aggregates. We thus focus our analysis on EM ex-China and present China’s numbers separately. Since early 2009, EM ex-China aggregate foreign currency debt has doubled to about $3 trillion (Chart 2). Furthermore, this $3 trillion EM ex-China foreign currency debt is split as follows in terms of borrower type: non-financial corporates ($1.25 billion), banks ($846 billion) and governments ($878 billion). Government Foreign Currency Debt Among mainstream EM countries, foreign currency government debt is not vulnerable to restructuring or default. The reason is that the foreign currency debt burden of governments is low, having declined dramatically in the last decade. Table 2 illustrates that the share of local currency government debt is by far greater than the foreign currency debt in each EM country. Table 2EM Public Debt: Local Currency Exceeds FX Debt
EM: Foreign Currency Debt Strains
EM: Foreign Currency Debt Strains
In the past 10 years, EM governments have deliberately replaced their foreign currency debt with local currency debt. Search for yield by international fixed-income investors has facilitated this debt swap: enormous foreign demand for EM domestic bonds has allowed EM governments to issue a considerable amount of local currency bonds. Chart 3EM Foreign Exchange Reserves Are Large
EM Foreign Exchange Reserves Are Large
EM Foreign Exchange Reserves Are Large
In addition, mainstream EM countries, with exception of Turkey and South Africa, hold large foreign currency reserves (Chart 3). Lately, several mainstream EM countries have gained a new defense tool from the Federal Reserves – US dollar swap lines. EM central banks’ swap lines with the Fed are primarily intended to instill confidence among investors in financial markets. They could be used to fend off short-term speculative attacks on EM currencies. Nevertheless, they cannot alleviate insolvency problems. We will elaborate more about these swap lines with the Fed in another report this week. As to local currency public debt, the odds of debt restructuring are also low. First, the majority of EM countries have low aggregate public debt burdens as a share of the GDP (Table 2). Second, the majority of these nations have flexible currency regimes. This means that their central banks control the printing press. In the worst-case scenario - when investors become reluctant to own EM local currency government bonds, EM central banks can buy those bonds in both the secondary or primary markets if needed. In short, EM central banks can resort to a form of quantitative easing, i.e., purchasing local currency government bonds that would amount to public debt monetization. The wild card in this case will be the exchange rate – the currencies could depreciate substantially amid public debt monetization by central banks. Given that government liabilities in foreign currencies have declined substantially, exchange rate depreciation will not be a constraint for policymakers’ ability to monetize local currency debt. Remarkably, in the past two months amid the global indiscriminate selloff, central banks in several EM countries have begun purchasing government bonds or have stated that they will do so if required. This has created a precedent that will be used in future. One country that has large local currency government debt is Brazil. We have previously argued that Brazil requires robust nominal GDP growth to climb out of a public debt trap. With the COVID-19 crisis, the outbreak for its public debt has worsened considerably. Without the central bank monetizing public debt, it will be difficult for Brazil to escape rising government debt strains and, ultimately, local currency debt restructuring. In short, the cost of avoiding local currency public debt restructuring in Brazil could be large currency depreciation. Bottom Line: In mainstream EM, neither foreign currency nor local currency government debt face an imminent risk of restructuring. Public debt restructuring and defaults are occurring in Argentina and among frontier markets like Ecuador, Lebanon and a few sub-Saharan nations that are beyond the scope of this report. If local currency government bond markets become anxious about public debt sustainability, EM central banks could purchase government paper. If done on large scale, this will cause further currency depreciation. Corporate Foreign Currency Debt From a macro perspective, there are presently some pre-conditions that herald rising odds of foreign currency debt restructuring among EM corporates and banks: (1) rapid and massive foreign currency debt built up in the past 10-15 years; (2) substantial plunge in corporate revenues; and (3) massive currency depreciation. Taken together, these create fertile ground for debt restructuring by some corporate debtors. Foreign currency debt of companies and banks in mainstream EM ex-China countries has swelled in the past 10 years reaching $2.1. Bonds account for about $1.4 trillion while foreign currency loans account for the remaining $0.7 trillion. The global recession brought about by the COVID-19 pandemic is producing a collapse in EM companies’ local currency revenues and exports. Notably, EM ex-China exports were contracting even before the COVID-19 outbreak and they are currently crashing (Chart 4). Chart 4EM Exports & Corporate Credit Spreads
EM Exports & Corporate Credit Spreads
EM Exports & Corporate Credit Spreads
Chart 5Commodities Prices And Currencies Drive EM Credit Spreads
Commodities Prices And Currencies Drive EM Credit Spreads
Commodities Prices And Currencies Drive EM Credit Spreads
The top panel of Chart 5 illustrates EM corporate credit spreads (inverted) correlate with commodities prices. Hence, plunging commodities prices entail growing foreign currency debt stress for EM companies and banks. Finally, EM ex-China currencies have depreciated substantially making foreign currency debt more expensive to service (Chart 5, bottom panel). Please refer to Box 1 attesting that for EM debtors with US dollar liabilities, EM exchange rate depreciation is worse than that of higher US bond yields. Box 1 What Is More Imperative For EM FX Debt: Exchange Rates Or Interest Rates? EM debtors with dollar debt are much more vulnerable to an appreciating dollar than rising US interest rates. Table 3 illustrates this point using the following hypothetical simulation: We consider a conjectural Brazilian debtor with $1,000 in debt with five years remaining to maturity, and a starting point exchange rate of 4 BRL per USD. In our example, a 5% depreciation in local currency against the dollar boosts the overall debt burden by 200 BRL (please refer to row 2 of Table 3). This does not include the rise in local currency costs of interest payments. It reflects only the increased burden of principal. Table 3A Hypothetical Simulation: FX Debt Burden Is More Sensitive To Exchange Rate Than Borrowing Costs
EM: Foreign Currency Debt Strains
EM: Foreign Currency Debt Strains
An equivalent rise in debt servicing costs in local currency will require a 100-basis-point increase in US dollar borrowing costs. In brief, US dollar rates should rise by 100 basis points for interest payments to increase by BRL 200 over a five-year period, the time remaining to maturity. This simulation reveals that a 5% dollar appreciation versus local currency is as painful as a 100 basis points rise in US dollar rates and is more burdensome if the cost of coupon payments is accounted for. Provided there are higher odds of 5% currency depreciation in many EMs than a 100-basis-point rise in US dollar borrowing costs, we infer that EM FX debtors’ creditworthiness is more sensitive to exchange rates than to US Treasury yields. As the bottom panel of Chart 5 above clearly demonstrates, EM corporate and sovereign credit spreads correlate strongly with EM exchange rates. Consequently, the trend in EM exchange rates versus the US dollar is much more important for EM credit spreads than fluctuations in US bond yields. As to the currency composition of EM FX debt, about 82% of EM external debt is in US-dollar terms. Bottom Line: So long as EM currencies depreciate against the greenback, EM FX debt stress will mount, and EM corporate and sovereign credit spreads will widen. This will occur irrespective of whether US Treasury yields rise or drop. If the bear market in commodities persists and/or EM currencies depreciate further – which is our baseline scenario, defaults on and restructuring of foreign currency debt among EM companies and banks are probable. One avenue to avoid corporate defaults is for the government to guarantee or assume the banks’ and companies’ foreign currency liabilities. It is probable because many of these borrowers are large entities with close links to their governments. However, governments will step in only after a debtor is on the brink default and its credit spreads are very wide. Briefly put, investors should be careful not to bet too early on government backstops of EM corporates’ and banks’ foreign currency debt. Identifying which corporate issuers could default or restructure debt involves bottom-up analysis that is beyond the scope of the macro research that BCA specializes in. An important question is what portion of corporate foreign currency liabilities have these debtors already hedged? Unfortunately, there are no macro data to answer this question either. Judging by the magnitude and speed of EM currency depreciation we have seen in the past two months, odds are that they have already partially hedged their exchange rate risk. Yet, given the sheer size of foreign currency liabilities, it is hard to imagine that corporates and banks have hedged all of them. Below we analyze each countries’ ability to service its foreign currency debt from a macro perspective. Vulnerability Assessment From a macro standpoint, foreign debt servicing vulnerability can be measured by foreign debt obligations (FDOs) and foreign funding requirements (FFRs). Chart 6EM FDOs And FFRs (Annualized)
EM FDOs And FFRs (Annualized)
EM FDOs And FFRs (Annualized)
FDOs are the sum of debt expiring in the next 12 months, and interest as well as amortization payments over the next 12 months. FDO data are available until Q3 of 2019 (Chart 6, top panel). Hence, using this latest datapoint is pertinent to gauging the ability of individual countries to service their foreign debt over the coming six months. FFRs are the sum of FDOs in the next 12 months and current account balance (Chart 6, bottom panel). It measures the amount of foreign capital inflows required in the next 12 months for a country to cover any shortfalls in its balance of payment dynamics. Exports Coverage Of FDO: This measure compares annualized US dollar export revenues available to each country to its foreign debt service obligations in the next 12 months (Chart 7). The most vulnerable countries according to this measure are Brazil, Colombia, Turkey and Peru. On the other hand, Russia, Mexico, India & Korea have higher exports-to-FDO ratios. Chart 7Exports-To-Foreign Debt Obligations Ratio
EM: Foreign Currency Debt Strains
EM: Foreign Currency Debt Strains
Foreign Exchange Reserves-to-FFRs Ratio: These metrics compare the size of foreign exchange reserves held by each nation’s central bank to its FFRs in the next 12 months (Chart 8). By this measure, Chile, Colombia, Turkey, Indonesia and Mexico have large FFRs relative to their central bank foreign exchange reserves. Meanwhile, Russia, Korea and Thailand fare well on this metric. Chart 8FX Reserves-To-Foreign Funding Requirements
EM: Foreign Currency Debt Strains
EM: Foreign Currency Debt Strains
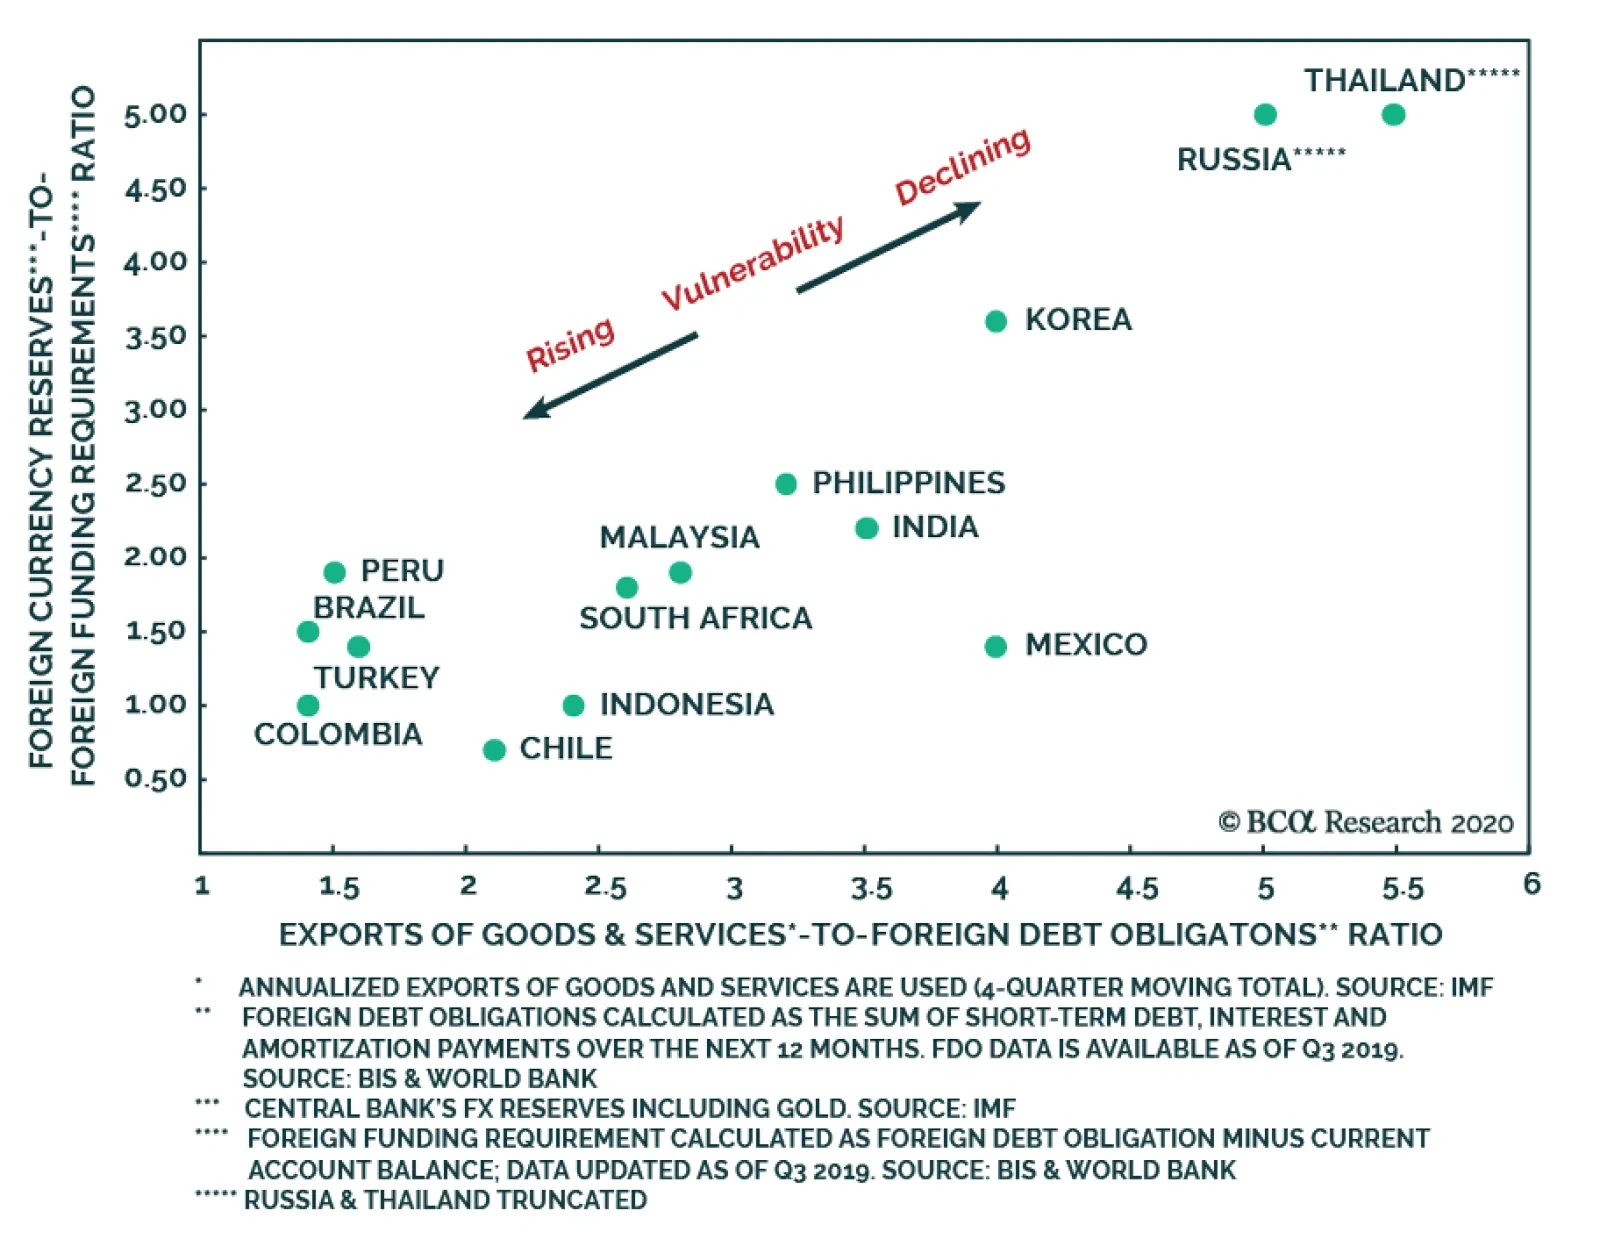
On the whole, Chart 9 is a scatter plot combining both FDO and FFR measures to determine the most and least vulnerable EMs. The most vulnerable EMs are Brazil, Turkey, Colombia and Chile. Meanwhile, Russia, Korea, India and the Philippines are the least vulnerable. Chart 9EM FX Debt And Currency Vulnerability
EM: Foreign Currency Debt Strains
EM: Foreign Currency Debt Strains
Investment Recommendations So long as EM currencies depreciate against the greenback, EM foreign currency debt stress will mount, and EM corporate and sovereign credit spreads will widen. We remain bearish on EM currencies. They usually trade with the global business cycle and the latter remains in free fall. We continue recommending shorting a basket of the following currencies versus the US dollar: BRL, CLP, ZAR, IDR, PHP and KRW. There will likely be no imminent restructuring or default on public debt in mainstream EM countries, outside frontier markets like Argentina, Ecuador, Lebanon and sub-Saharan African countries. However, there could be meaningful credit stress among EM corporate issuers. Consequently, dedicated EM credit investors should overweight mainstream EM sovereign credit and underweight EM corporate debt. We continue to recommend underweighting EM sovereign and corporate credit versus US investment-grade corporate credit (Chart 10). Not only is the Fed buying US investment-grade and some high-yield bonds but US companies will also benefit from the substantial fiscal stimulus. In EM, corporates and banks lack such support. Crucially, in contrast to US corporates, EM issuers also suffer from currency depreciation. Within the EM sovereign credit universe, our overweights are Russia, Mexico, Peru, Thailand and Malaysia. Underweights include South Africa, Brazil, Indonesia, the Philippines and Turkey. The rest warrant a neutral allocation within an EM sovereign credit portfolio. Finally, within corporate credit, we reiterate our long-standing recommendation of long Asian investment-grade corporates / Asian short high-yield corporate (Chart 11). We continue recommending shorting a basket of the following currencies versus the US dollar: BRL, CLP, ZAR, IDR, PHP and KRW. Chart 10Remain Underweight EM Credit Versus US IG Credit
Remain Underweight EM Credit Versus US IG Credit
Remain Underweight EM Credit Versus US IG Credit
Chart 11Long Asian IG Corporate / Short Asian HY Corporate
Long Asian IG Corporate / Short Asian HY Corporate
Long Asian IG Corporate / Short Asian HY Corporate
Andrija Vesic Associate Editor andrijav@bcaresearch.com Arthur Budaghyan Chief Emerging Markets Strategist arthurb@bcaresearch.com Footnotes 1We will publish a report on Saudi Arabia in the coming weeks. 2We have compiled data on foreign currency securities issued by non-financial companies and banks from Bloomberg. Bloomberg data accounts for the nationality of debt issuers. For instance, a US dollar bond issued by a Brazilian corporate subsidiary or a shell company located in the Cayman Islands is counted as Brazilian foreign corporate debt, rather than a Cayman Island debt security. For foreign loans, we use the Bank of International Settlements (BIS) datasets on Banking Statistics.
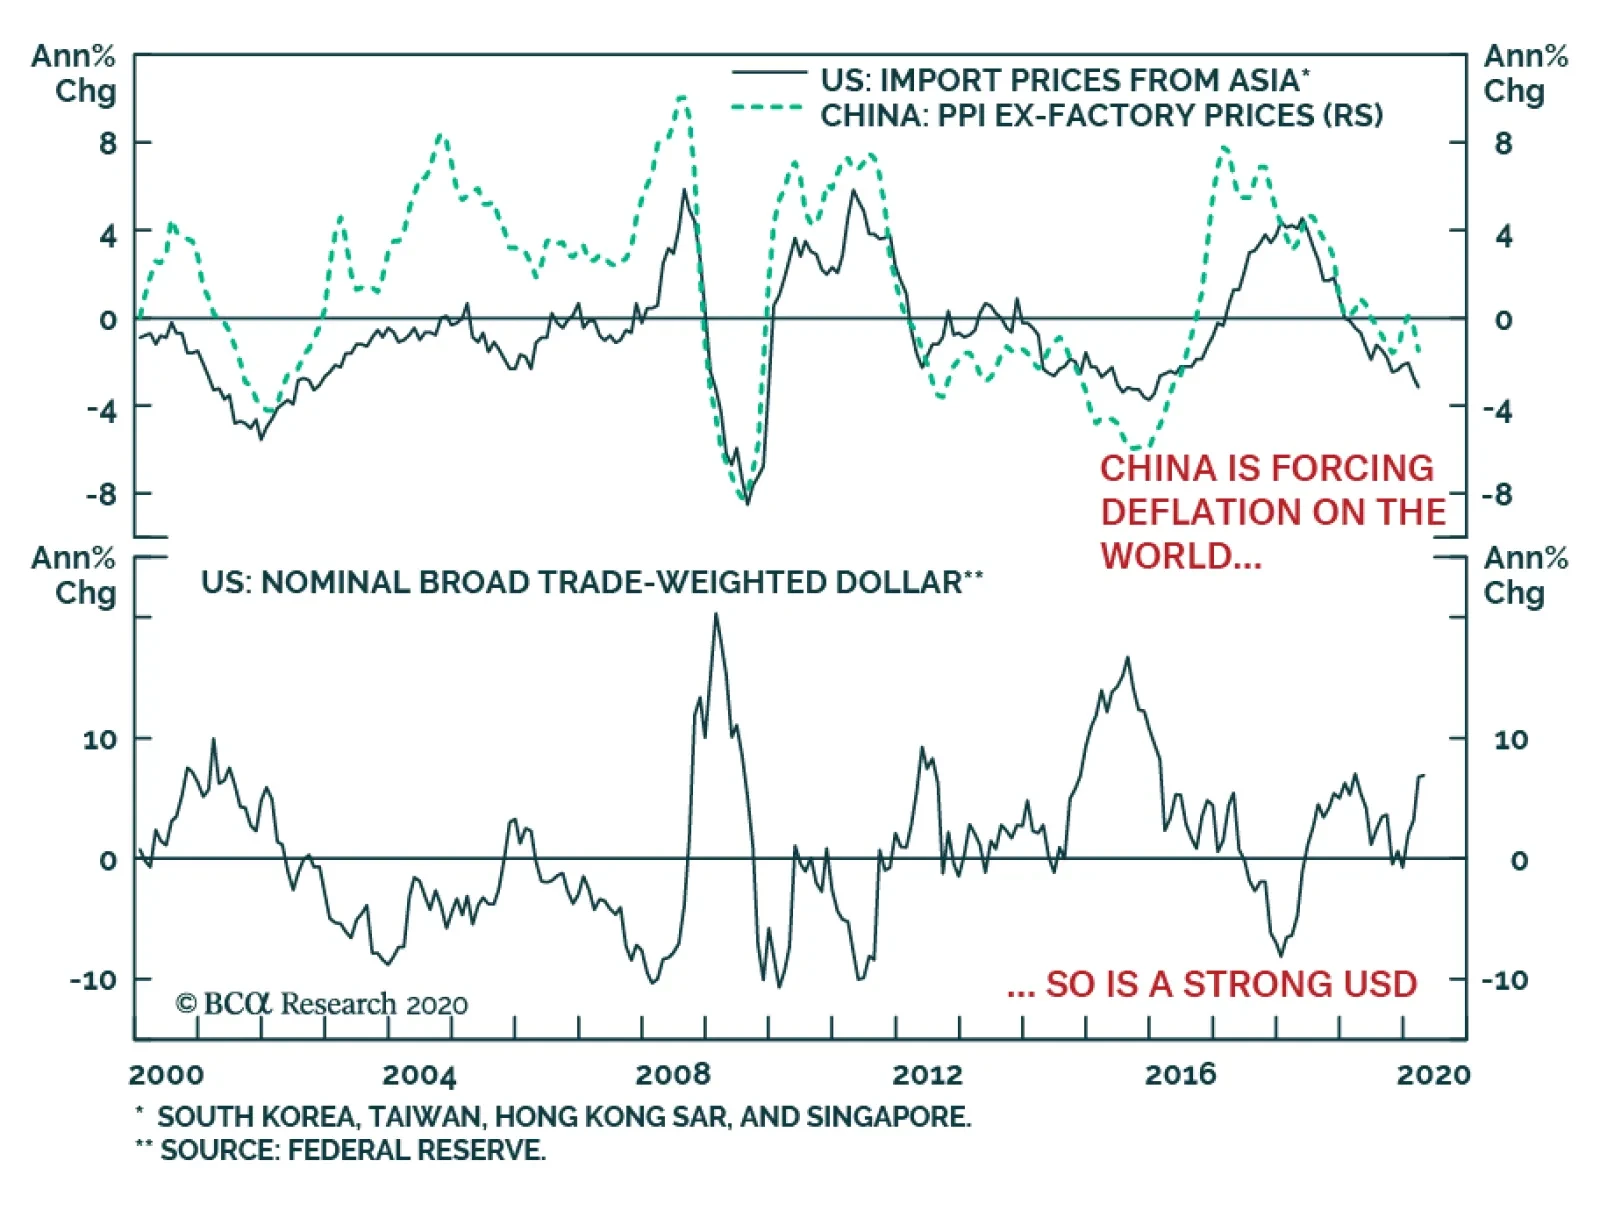
When COVID-19 first emerged and closed the Chinese economy in Late January and February, many commentators worried that it would be an inflationary shock as it would result in an (albeit temporary) inward shift in the global supply curve. This risk did not…
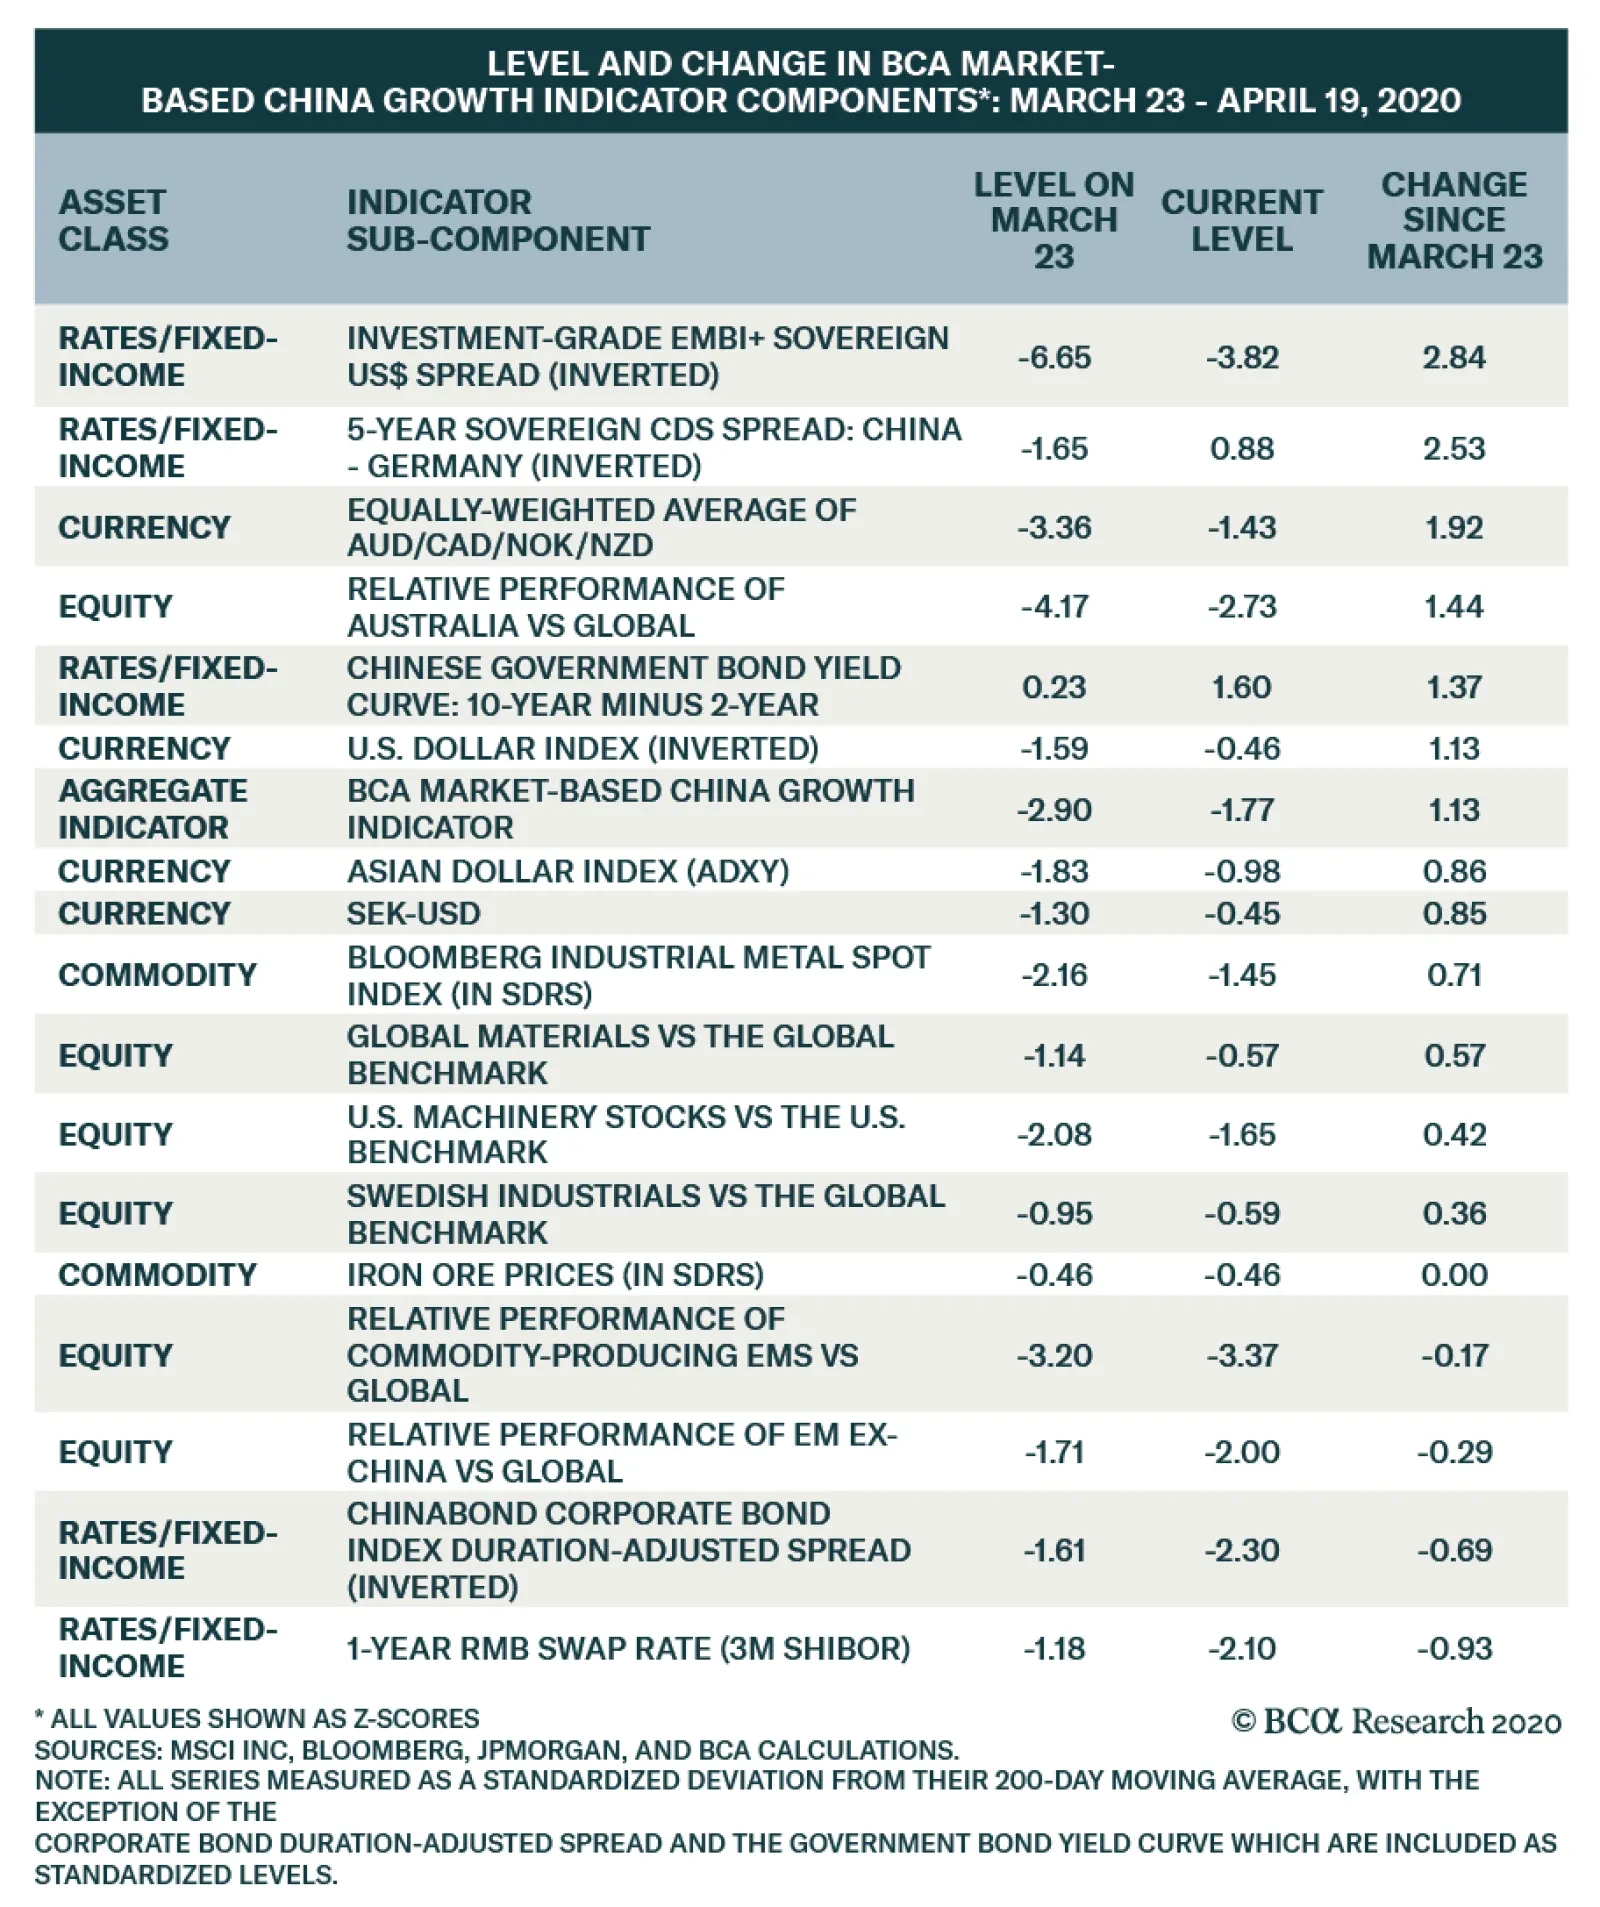
The above table presents a breakdown of the subcomponents of our BCA Market-Based China Growth Indicator. The indicator has rebounded since March 23 alongside the US and global stock prices, and the table highlights the change in each subcomponent during this…
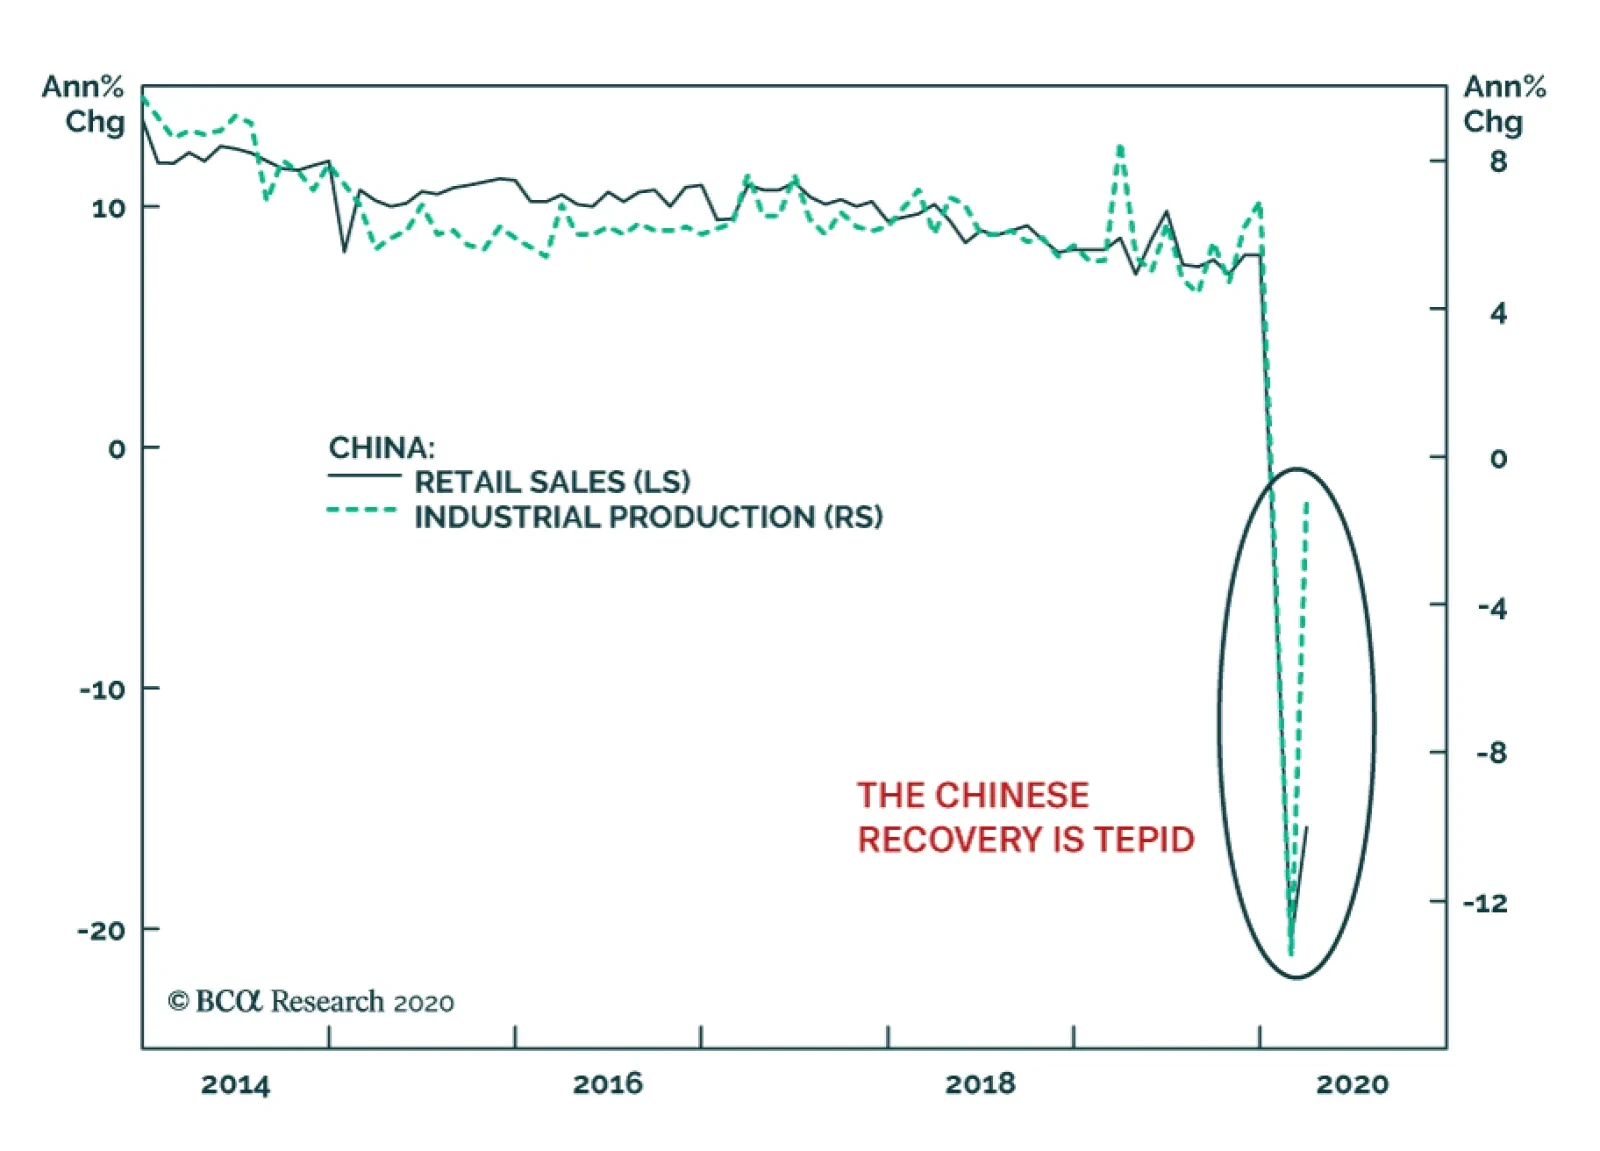
China’s real Q1 GDP growth was, unsurprisingly, weak. Year-on-year growth came in at -6.8%, and seasonally-adjusted quarterly growth was -9.8%. The true surprise was the weakness of the March industrial production and retail sales data. Industrial…
Yesterday, BCA Research's Emerging Markets Strategy service combed through the capabilities of ASEAN and India to determine which country would win the battle against COVID-19.
Assessing ASEAN And Indian…
Feature In this report, we determine which South and Southeast Asian countries are better equipped to endure the COVID-19 pandemic. Answers to this question combined with our macro fundamental analysis lead us to recommend which countries to favor or avoid. We assess several factors in regard to the COVID-19 shock: (1) the healthcare capacity in each country, (2) the COVID-19 containment measures that have been implemented, and (3) the magnitude of fiscal and monetary stimulus packages that have been announced. We conclude that EM equity investors should keep an overweight position in Thai equities and a neutral one in the Malaysian stock market. Indian, Indonesian and Philippine stock markets, on the other hand, warrant an underweight stance. Healthcare System Capacity The COVID-19 virus can cause individuals with underlying medical conditions and already in poor health, as well as those above a certain age, to become seriously ill when infected. These patients will require the kind of special medical attention – such as ventilation – that is only provided in a hospital’s intensive care unit (ICU). A country that currently lacks sufficient ICU capacity relative to the number of patients requiring it, risks overburdening the health care system. This would be a social catastrophe. A country that currently lacks sufficient ICU capacity relative to the number of patients requiring it, risks over¬burdening the health care system. Therefore, a key measure of the current coronavirus crisis is the relation between a population’s risk of developing critical illness from COVID-19 infections and a country’s intensive care unit (ICU) availability. We assess the risk of COVID-19 infections developing into critical illnesses in ASEAN countries and in India by gauging (1) the prevalence of diabetes in the population and (2) the share in population of people above the age of 60. Chart I-1 and Chart I-2 illustrate these factors separately. Chart I-1ASEAN & India: Population With Diabetes
COVID-19 Battle: Assessing ASEAN And Indian Capabilities
COVID-19 Battle: Assessing ASEAN And Indian Capabilities
Chart I-2Population Above 60 Years Old
COVID-19 Battle: Assessing ASEAN And Indian Capabilities
COVID-19 Battle: Assessing ASEAN And Indian Capabilities
In addition, we combine these two risk variables to calculate the risk of critical illness. This measure is shown in Chart I-3. The measure shows that the population of both Malaysia and Thailand carry the highest risk of developing critical illnesses from COVID-19, owing to Malaysia’s high prevalence of diabetes and to Thailand’s rapidly aging population. Meanwhile, that risk is somewhat lower in India and dramatically lower in both the Philippines and Indonesia. The next thing to look at is each country’s ICU capacity. Chart I-4 shows the number of ICU beds available per 100,000 people. Thailand has the highest number and Malaysia the second highest. On the other hand, India, Indonesia and the Philippines all have lower rates of ICU capacity. Chart i-3The Risk Of Critical Illness From COVID-19
COVID-19 Battle: Assessing ASEAN And Indian Capabilities
COVID-19 Battle: Assessing ASEAN And Indian Capabilities
Chart I-4Intensive Care Unit (ICU) Capacity
COVID-19 Battle: Assessing ASEAN And Indian Capabilities
COVID-19 Battle: Assessing ASEAN And Indian Capabilities
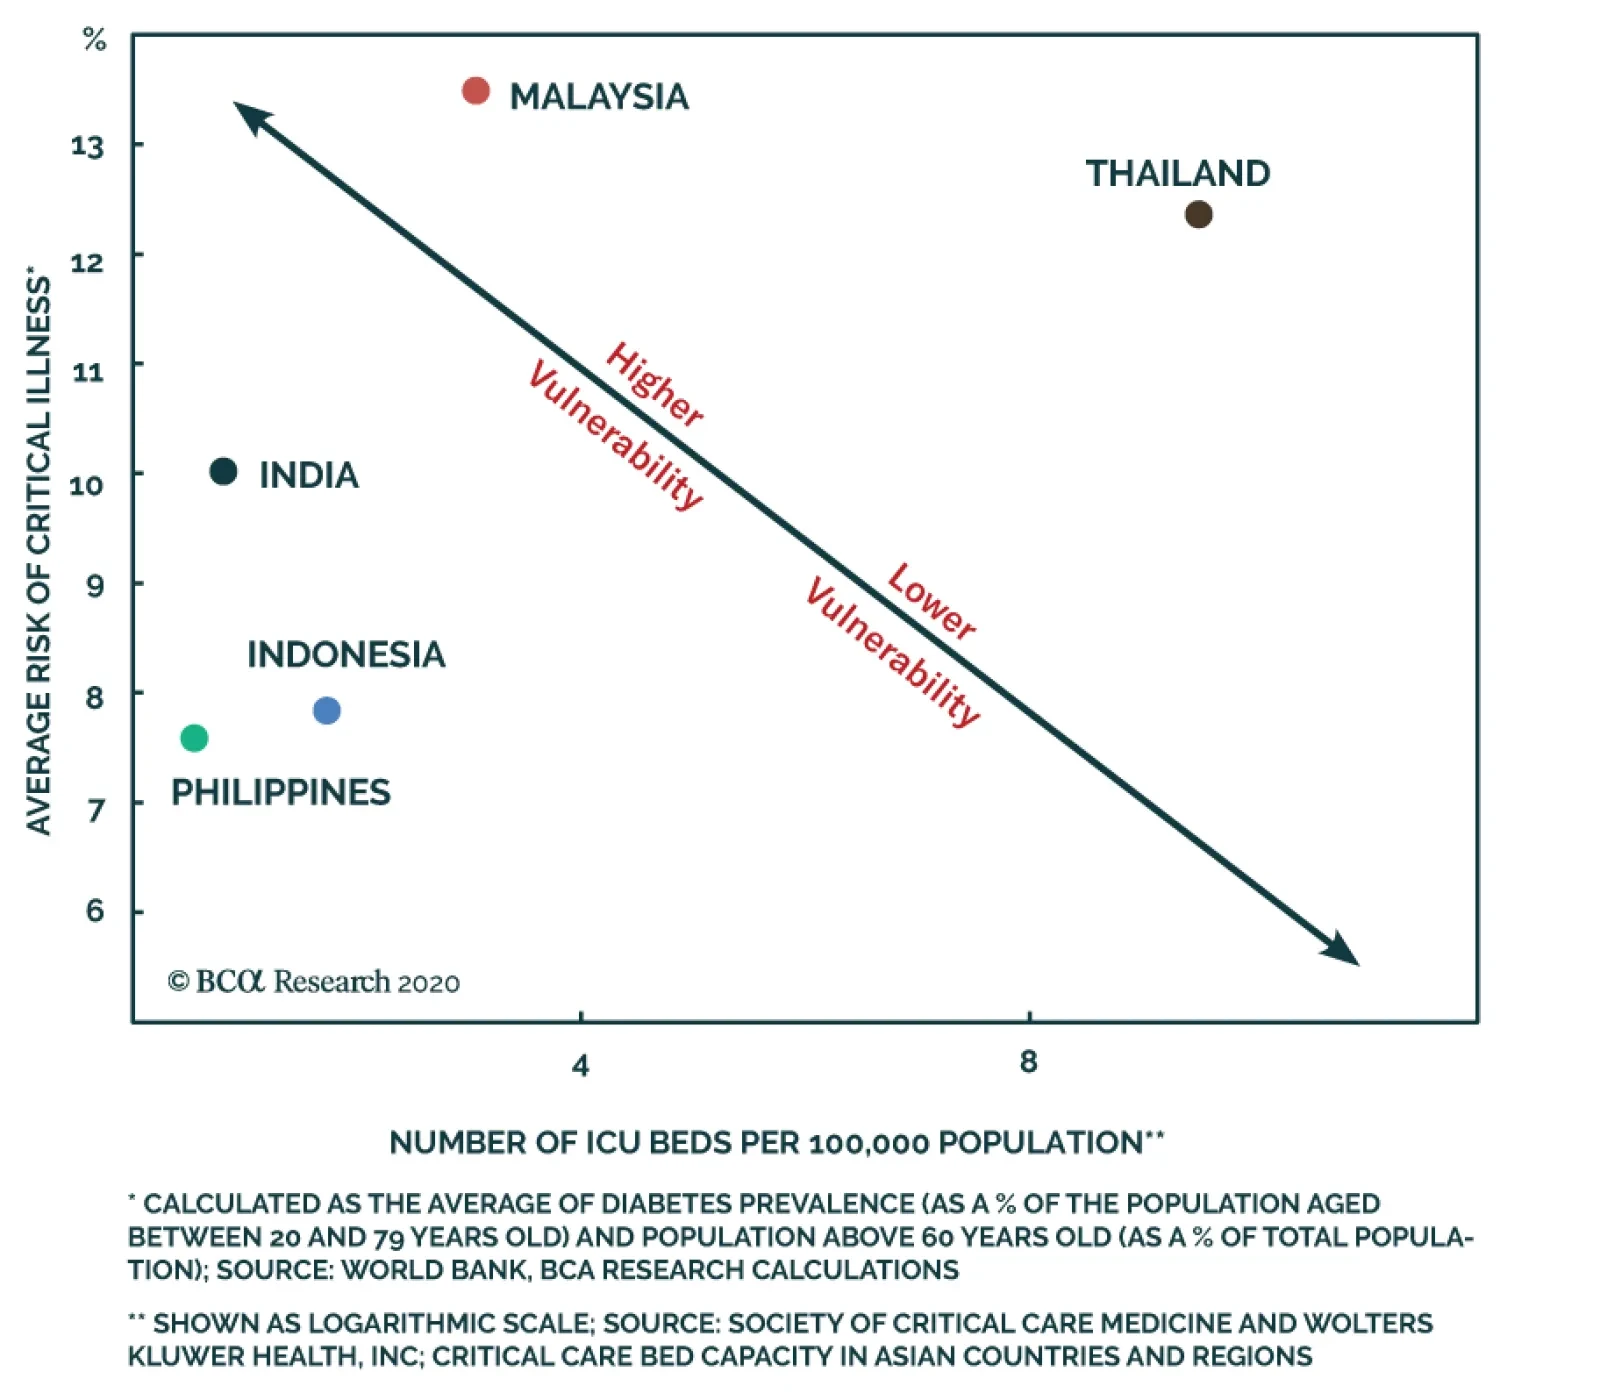
Finally, we compare the risk of critical illness in each country to its available ICU capacity. Chart I-5 shows a scatter plot between these two variables. The risk of critical illness is shown on the Y-axis and the availability of ICU beds per 100,000 people is plotted on the X-axis. Thailand and Malaysia both have the highest risk of critical illness but also a large number of available ICU beds. India, Indonesia and the Philippines have lower average risk of critical illness but also far fewer ICU bed availabilities. Chart I-5The Risk Of Critical Illness Versus ICU Capacity
COVID-19 Battle: Assessing ASEAN And Indian Capabilities
COVID-19 Battle: Assessing ASEAN And Indian Capabilities
It is also important to note that Malaysia has the highest relative number of medical doctors per 10,000 people in the region (15 versus an average of 8). Furthermore, both Malaysia and Thailand appear to be performing many more COVID-19 tests. That in turn should help slow the spread of the virus and avoid overwhelming health care systems of Malaysia and Thailand. Bottom Line: Thailand and Malaysia have decent healthcare care capabilities relative to the threat of critical illness among their populations. India, Indonesia and the Philippines, on the other hand, seem relatively unprepared to weather this outbreak. Containment Response The magnitude and effectiveness of social distancing measures implemented is a critical means of protecting a country’s health care system. Indeed, the sooner such measures are put into place, the earlier the threat of the pandemic is likely to subside. This will then allow a country to normalize its economic activities sooner. It appears that the Philippines and India have enacted the most stringent social distancing measures. Both announced complete lockdowns and called in their respective national armies to intervene. Malaysia has also announced extremely inhibitive measures and their enforcement has been quite successful. In Thailand, while the authorities have not imposed a complete lockdown, they have placed curfews and checkpoints that are subject to extension. Thai authorities have also warned that more restrictive measures could be imposed if residents do not comply. Indonesia, on the other hand, has been much softer on enforcement and is reluctant to introduce additional measures due to its economic concerns. Malaysia and Thailand emerge as the most likely to win the battle against COVID-19 in the region. Remarkably, the effectiveness of the measures can be quantitatively assessed via Google’s COVID-19 mobility tool and TomTom’s traffic congestion data. The average of all Google’s mobility variables, as of April 5, has declined most significantly in the Philippines, Malaysia, and India, relative to baseline values (Chart I-6).1 Likewise, TomTom’s traffic congestion data for the major cities in these same countries’ shows a similar decline during average peak hours over the first two weeks of April 2020, relative to the same period in 2019 (Chart I-7). Chart I-6How Effective Are Social Distancing Measures?
COVID-19 Battle: Assessing ASEAN And Indian Capabilities
COVID-19 Battle: Assessing ASEAN And Indian Capabilities
Chart I-7Decline In Traffic From ##br##A Year Ago
COVID-19 Battle: Assessing ASEAN And Indian Capabilities
COVID-19 Battle: Assessing ASEAN And Indian Capabilities
Bottom Line: The Philippines, India, and Malaysia have imposed the most effective and successful social distancing measures. This is then followed by Thailand. Indonesia on the other hand has not been as effective in this aspect. Fiscal And Monetary Stimulus Table I-1Stimulus Packages So Far Announced
COVID-19 Battle: Assessing ASEAN And Indian Capabilities
COVID-19 Battle: Assessing ASEAN And Indian Capabilities
The magnitude of the stimulus plans announced by each country is also important. Once the pandemic subsides and social distancing measures are relaxed, countries with a larger stimulus package in place should experience a faster economic recovery. Table I-1 shows the size of the overall stimulus packages announced so far. Malaysia and Thailand have the largest overall stimulus packages to the tune of 16% and 14% of GDP, respectively. India, Indonesia and the Philippines fall well short of these levels. Regarding monetary policy, central banks in all these countries have been cutting policy rates and injecting local currency liquidity. However, some of the programs announced by some of the central banks stand out: The Bank Of Thailand will inject 400 billion baht ($13 billion or 2% of GDP) into the corporate bond market. The central bank is also allocating 500 billion baht ($15 billion or 3% of GDP) of soft loans to small-and mid-sized companies.2 The central bank of the Philippines will be purchasing 300 billion pesos worth of government bonds ($6 billion or 1.6% of GDP) under a 3- to 6-month repurchase agreement to aid government efforts in countering the pandemic. Bank Indonesia may also begin buying government bonds (recovery/pandemic bonds) directly from the primary market. Details are not yet clear but the Indonesian government plans to issue $27 billion worth of these bonds and the central bank might emerge as the largest buyer. Similarly, the Reserve Bank of India has been injecting liquidity and purchasing government bonds for some time now. For instance, it announced a 1 trillion rupees injection in February – or $13 billion – via the long-term repo operation channel. It is now infusing an additional 1 trillion rupees through the same channel. It will also continue purchasing government bonds and securities to keep liquidity aflush and suppress market interest rates. Crucially, Governor Shaktikanta Das indicated that the RBI might even be forced to purchase government bonds directly from the primary market and that all options – including non-conventional ones – are on the table. Bottom Line: Both Thailand and Malaysia have so far announced larger overall stimulus packages than Indonesia, the Philippines and India have. This combined with their better health care capacities, suggests that the Thai and Malaysian economies will recover more quickly than they will in India, Indonesia and the Philippines. Conclusions Having considered risk of critical illness, the ICU availability and general medical capacities, the effectiveness of social distancing measures, and the stimulus packages each country has announced, Malaysia and Thailand emerge as the most likely to win the battle against COVID-19 in the region. Despite their elevated risk of critical illness, both countries have decent healthcare system capacities. Additionally, Malaysia has put in place very effective social distancing measures. Meanwhile, Thailand is placing curfews and monitoring developments very closely. Finally, both countries have enacted massive stimulus packages that will aid in the recovery of their economies later this year. Notably, Thailand and Malaysia have been running current account surpluses for a long period of time whereas India, Indonesia and the Philippines generally run current account deficits. This, in turn, will allow the former to implement much larger overall stimulus packages than the latter, without risking major currency depreciation. Despite strong and successful social distancing efforts, India and the Philippines are hampered by a weakness in their health care infrastructures. They also are unlikely to be able to provide a large enough stimulus without subjecting themselves to significant currency depreciation. Additionally, India also has an elevated critical illness risk. Finally, Indonesia is likely to emerge from the crisis in the weakest position. Its healthcare system capacity is weak, the social distancing measures it implemented are insufficient and its enforcement has been lax. Indonesia is likely to emerge from the crisis in the weakest position. The government has also been timid about enacting significant stimulus given that it runs a large current account deficit. Moreover, it is unwilling to tolerate any further large currency depreciation due to the elevated foreign currency debt that Indonesian companies and banks carry. The latter stands at $124 billion in the form of both bonds and loans. Investment Strategy Chart I-8Thai Stock Prices Vs. Emerging Markets
Thai Stock Prices Vs. Emerging Markets
Thai Stock Prices Vs. Emerging Markets
The following is our strategy recommendations for each country: Thailand: Our equity overweight stance on this bourse has been significantly challenged since early this year (Chart I-8). However, Thai stocks seem to be holding up at an important technical support level in relative terms. Furthermore, as of December 2019, the ownership of the country’s local currency bonds was low at 17% (i.e. even before the global sell-off commenced). Further selling by foreigners should therefore be limited, which should reduce renewed depreciation pressures on the Thai currency. We recommend that respective EM portfolios keep an overweight position on Thai equities, sovereign US dollar and local currency bonds. Malaysia: On the one hand, Malaysian stocks have been underperforming EM benchmarks since 2014. Also, foreign ownership of Malaysian local currency bonds has declined from 34% in 2016 to 25% as of December 2019. This limits the possibility of future foreign selling. On the other hand, the economy was facing severe deflationary pressures even before the COVID-19 shock occurred. The latter will only reinforce these deflationary dynamics. Considering the positives and the negatives together, we recommend a neutral allocation to Malaysia within an EM equity portfolio. The Philippines: Philippine stock prices relative to EM seem to have broken below a critical support level that will now act as resistance (Chart I-9). Moreover, local currency government bond yields have risen sharply (Chart I-10 and Chart I-11). This does not bode well for real estate and bank stocks that account for a very large market-cap chunk of the Philippine MSCI Index (46%). Critically, government expenditures were strong even before the COVID-19 pandemic occurred and it was only a matter of time before that contributed to higher imports. Now that exports are crashing - due to collapsing global demand - and imports are likely to remain high because of even higher government spending/fiscal stimulus, the current account deficit will widen substantially. This will cause the peso – which has been holding up so far – to depreciate significantly. Stay underweight on this bourse and local currency government bonds relative to their respective EM benchmarks. We also recommend keeping a short position on the Philippine peso versus the US dollar. Chart I-9Philippine Stock Prices Vs. Emerging Markets
Philippine Stock Prices Vs. Emerging Markets
Philippine Stock Prices Vs. Emerging Markets
Chart I-10Philippine Yields In Absolute Terms...
Philippine Yields In Absolute Terms...
Philippine Yields In Absolute Terms...
Chart I-11...And Relative To Their EM Peers
...And Relative To Their EM Peers
...And Relative To Their EM Peers
India: We discussed India in detail in a recent report. We recommend an underweight position amid the pandemic. In previous years, private banks lent enormous amounts to consumers via mortgages and consumer loans/credit cards. Therefore, the performance of both sectors has been contingent on the health of the Indian consumer sector. However, the outlook for the Indian consumer has worsened dramatically because of the unprecedented income hit households will suffer from the lockdown. Moreover, social safety nets and health care capacities (as mentioned above) are very weak in India. Indonesia: We also discussed Indonesia in detail in a report published on April 2. In recent years, the Indonesian bourse benefited from lower US interest rates and ignored deteriorating domestic fundamentals and lower commodities prices. Global investors’ increased sensitivity to individual EM fundamentals amid this pandemic will only make Indonesia’s weakest spots – like its exposure to commodities and its anemic domestic demand – more apparent. With global growth being very weak, commodities prices will remain low – reinforcing currency depreciation and pushing corporate bond yields higher. Combined with relapsing domestic growth, the Indonesian bourse will likely continue underperforming. Bottom Line: Within an EM equity portfolio, we are keeping an overweight position on the Thai stock market. We also recommend keeping Malaysian equities on neutral. Our equity underweights are India, Indonesia, and the Philippines. In terms of fixed income markets, we recommend overweighting Thai, Malaysian and Indian local currency bonds and US dollar sovereign bonds. We recommend underweighting Indonesian and Philippine local and US dollar sovereign bonds. Ayman Kawtharani Editor/Strategist ayman@bcaresearch.com Footnotes 1 The baseline is the median value between January 3 and February 6. Our average calculation includes retail & recreation, grocery & pharmacy, parks, transit stations, and workplaces. It excludes the residential variable. 2 Note that this is part of the stimulus shown in Table 1.
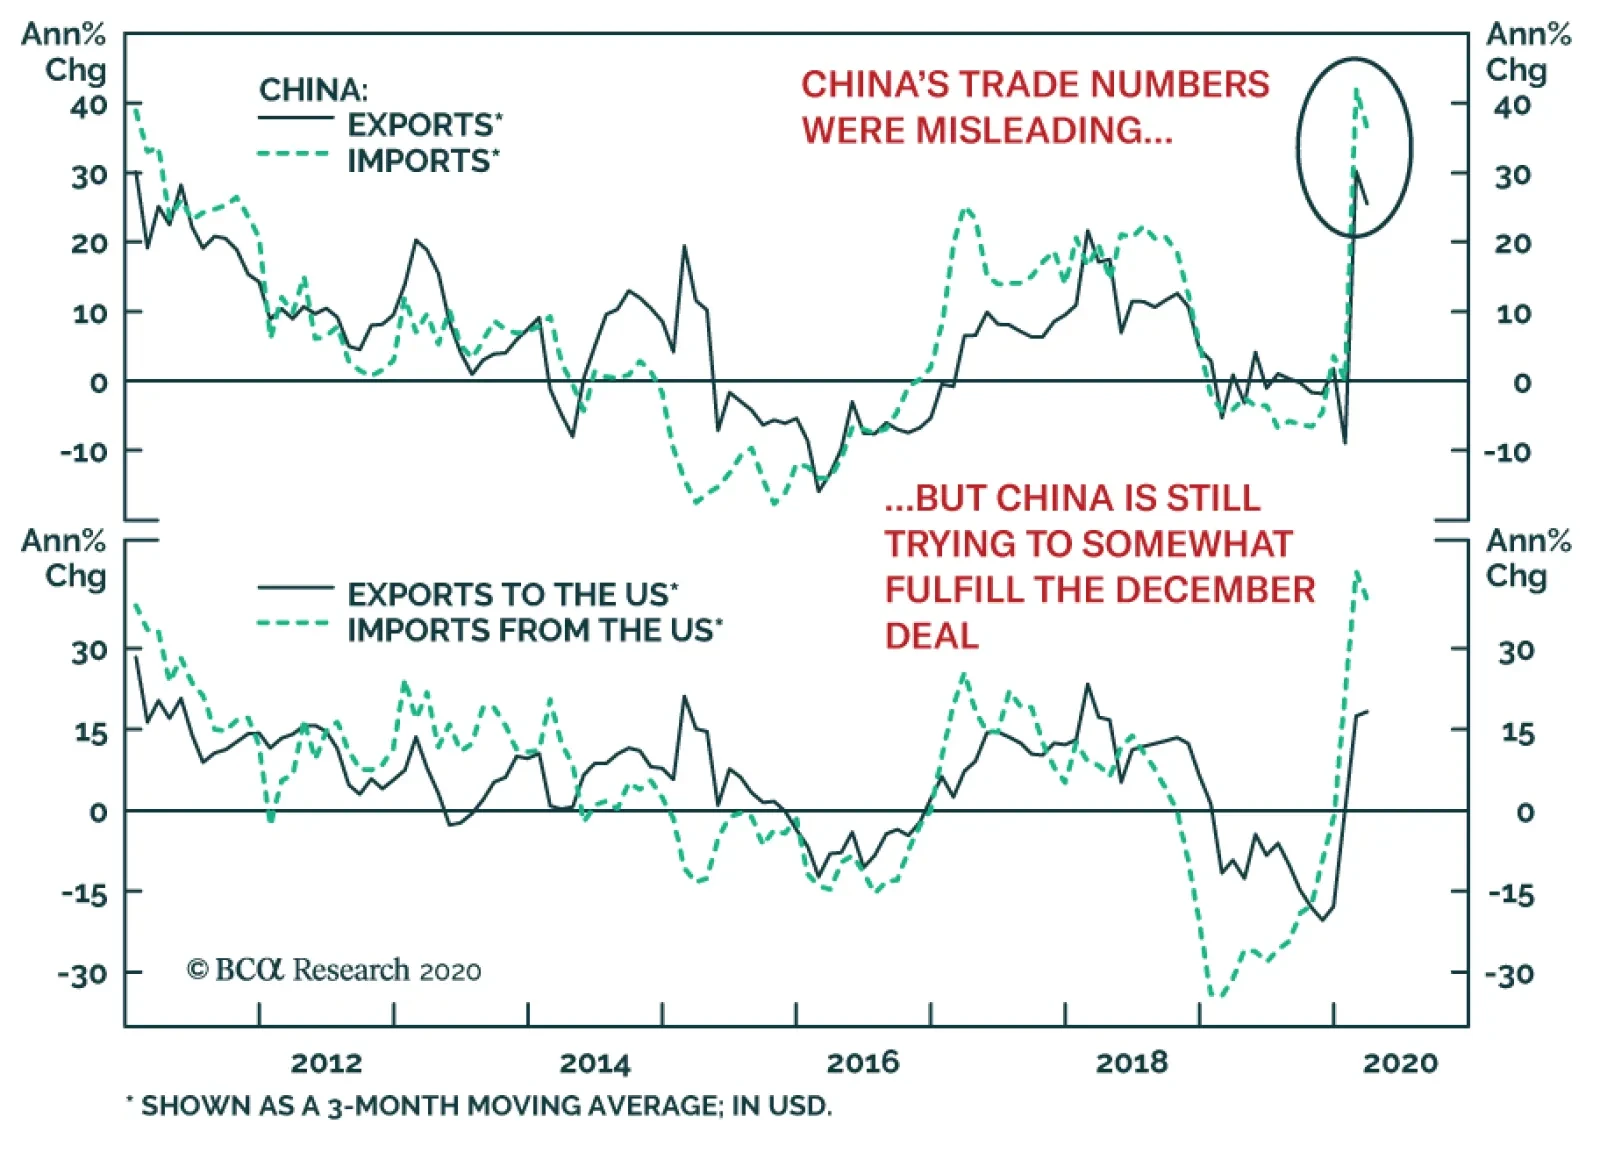
At first, China’s March trade numbers represented a positive surprise for the global economy. In USD terms, Chinese exports only contracted 6.6% on the year (versus expectations of -13.9%) and imports contracted by a mere 0.9% (versus an anticipated -9.8%). …