Sorry, you need to enable JavaScript to visit this website.
Skip to main content

Emerging Markets

While we remain bullish on global equities and other risk assets over 12 months, we went tactically short the S&P 500 last Friday following the market’s complacent reaction to the Trump Administration’s further tariffs increases on Chinese imports. While a moderate trade war would still produce more economic damage than standard economic models imply, this would be greatly mitigated by significant Chinese economic stimulus and a Fed that is in no hurry to raise rates and could even cut rates. Barring any further major developments, we recommend investors start increasing risk exposure if the S&P 500 falls to 2711. A dip in global bourses would also create an opportunity to go overweight EM/European equities. Favor gold over government bonds as a low-cost hedge against trade war risks for now.

Highlights The trade war escalation is just the catalyst and not the cause of the market correction. This year’s absolute double-digit returns have most likely already been made during the early-2019 star alignment of near-perfect conditions for investors. The remainder of the year is likely to be a much tougher going for all the major asset-classes. Short a 30:60:10 portfolio of equities, bonds, and oil, setting the profit target and stop-loss at 3 percent. In the second half of the year, the big story will be sector rotation. Healthcare is likely to flip from underperformer to outperformer versus technology. Given their sector skews, it follows that European equities are likely to outperform Chinese equities. Feature A star alignment of near-perfect conditions lifted the entire financial market complex in the early part of the year. For investors, pretty much everything that could go right did go right! (Chart of the Week). Chart of the WeekIn Near-Perfect Conditions, European Equities Performed Very Well... But Chinese Equities Performed Even Better In Near-Perfect Conditions, European Equities Performed Very Well... But Chinese Equities Performed Even Better In Near-Perfect Conditions, European Equities Performed Very Well... But Chinese Equities Performed Even Better The Federal Reserve stopped hiking interest rates; the ECB and other major central banks also pivoted to dovish; Brexit was delayed; the Italy versus Brussels spat over fiscal policy de-escalated; the drag from new emissions standards on German auto production eased; the trade war threat seemed to recede; and crucially, economic activity accelerated sharply (more about this later). A Rare Star Alignment… Which Cannot Last There was another rare star alignment: equities, bonds, and crude oil generated simultaneous strong rallies (Chart I-2). Such a star alignment is almost unheard of, because there are no set of economic circumstances that should benefit all three asset-classes at the same time. For example, if the oil price surge is inflationary – or at least less deflationary – then it should hurt bonds; if the surge is deflationary on real demand, then it should hurt equities. Equities, bonds, and oil should not surge together. Equities, bonds, and oil should not surge together, and on the extremely rare occasions they do, the simultaneous rally soon breaks down. Consider a €100 investment portfolio consisting of €30 equities, €60 long-dated bonds, and €10 crude oil. At the start of this year, the portfolio returned 10 percent in just three months. This is extremely rare, and has happened on only two other occasions in the past 25 years, in 2009 and 2016 (Chart I-3). Chart I-2A Rare Star Alignment:##br## Equities, Bonds, And Oil Surged ##br##Simultaneously A Rare Star Alignment: Equities, Bonds, And Oil Surged Simultaneously A Rare Star Alignment: Equities, Bonds, And Oil Surged Simultaneously Chart I-3A Rare Star Alignment: A 30:60:10 Portfolio of Equities: Bonds: Oil Gained 10 Percent In 3 Months A Rare Star Alignment: A 30:60:10 Portfolio of Equities: Bonds: Oil Gained 10 Percent In 3 Months A Rare Star Alignment: A 30:60:10 Portfolio of Equities: Bonds: Oil Gained 10 Percent In 3 Months On both previous occasions, the simultaneous rally broke down, and the portfolio went on to lose a large chunk of its 10 percent gain. Hence, at our quarterly webcast last week, we initiated a new investment recommendation: to short a 30:60:10 portfolio of equities, bonds, and oil, setting the profit target and stop-loss at 3 percent.1 When conditions are perfect, they are vulnerable to the tiniest setback. But the vulnerability emanates from the fragility of the perfect conditions, and not the precise setback. As an analogy, visualize a tree bedecked in its beautiful foliage in the autumn, and imagine you gently shake the tree. The gentlest of shakes will make the leaves collapse. At first glance, your shake caused the collapse, but in truth, your shake was just the catalyst; the underlying cause was the fragility of the autumnal foliage. Another catalyst, say a puff of wind, could have equally triggered the same collapse. When conditions are perfect, they are vulnerable to the tiniest setback. The re-escalation of the trade war has dominated the recent column inches and investment analyst missives. But just like the gentle shake of the tree, it is just a catalyst for the market correction. The underlying cause was that the simultaneous and strong rallies in all financial assets, based on a star alignment of near-perfect conditions, was vulnerable to the first blemish to the perfection. And the blemish could have been anything. Economic Activity Has Undoubtedly Accelerated… One of the things that drove up equity markets was the acceleration in economic activity. This acceleration is beyond doubt: euro area GDP prints show that growth picked up to 1.6 percent in the first quarter of 2019 from a low of 0.6 percent in the third quarter of 2018 (Chart I-4). Given the openness of the euro area economy, it is inconceivable that this growth pick-up does not reflect a more generalized acceleration in global activity.2 Chart I-4Euro Area GDP Growth Accelerated To 1.6 Percent Euro Area GDP Growth Accelerated To 1.6 Percent Euro Area GDP Growth Accelerated To 1.6 Percent The trouble is that we do not receive these GDP prints in real-time. From the mid-point of the quarter to which the GDP prints refer to their release date around one month after the quarter end, there is a two and a half month delay. To proxy activity in real-time, we must look at current activity indicators (CAIs) which gauge GDP growth, but are available without much of a delay. While several such indicators exist, we have found that the ZEW economic sentiment indicator (not to be confused with the current situation indicator) does the job extremely well in real-time. Current activity indicators do not help equity investors. Having said that, current activity indicators do not help equity investors. The simple reason is that the equity market is a current activity indicator itself, and it would be absurd to expect one CAI to predict another CAI! In fact, the best current activity indicator is not the equity market taken as a whole. This is because the aggregate equity market can move as a result of drivers other than current economic activity, most notably central bank policy. Therefore, it turns out that the very best current activity indicator is found within the equity market: specifically, the performance of economically sensitive equity sectors – such as industrials and financials – relative to the aggregate market (Chart I-5 and Chart I-6). Both this and the ZEW economic sentiment indicator confirm that economic activity has accelerated sharply since late last year, but has suffered a slight setback in the last month. Chart I-5The Best Current Activity Indicator Is The Relative Performance Of Economically Sensitive Equity Sectors The Best Current Activity Indicator Is The Relative Performance Of Economically Sensitive Equity Sectors The Best Current Activity Indicator Is The Relative Performance Of Economically Sensitive Equity Sectors Chart I-6The Best Current Activity Indicator Is The Relative Performance Of Economically Sensitive Equity Sectors The Best Current Activity Indicator Is The Relative Performance Of Economically Sensitive Equity Sectors The Best Current Activity Indicator Is The Relative Performance Of Economically Sensitive Equity Sectors …But Can The Acceleration In Economic Activity Continue? To be crystal clear, let’s repeat the crucial point. Economically sensitive investments do not move on the level of GDP growth; economically sensitive investments move on the real-time change in GDP growth. The simple reason is that profits growth is highly leveraged to economic growth. Hence when GDP growth picks up, the embedded ‘g’ used to calculate the present value of the investment rises very sharply, which means that today’s price also rises very sharply; and vice versa when GDP growth declines. But once GDP growth stabilizes, even at a high level, there is no further meaningful change in ‘g’, or in the price. For any remaining sceptics, Chart I-7 shows that for many years, the big moves in the Euro Stoxx 50 have resulted from the changes in euro area GDP growth.   Chart I-7The Euro Stoxx 50 Moves On Changes In GDP Growth The Euro Stoxx 50 Moves On Changes In GDP Growth The Euro Stoxx 50 Moves On Changes In GDP Growth   It follows that what investors really need is not a current activity indicator, but a future activity indicator (FAI). If investors could reliably predict the change in economic activity, then they could also reliably allocate between economically sensitive and defensive investments, as well as to the equity market as a whole.   We have found that a future activity indicator for Europe would contain three components: The domestic 6-month credit impulse. The international 6-month credit impulse, and specifically the 6-month credit impulse in China given the large volume of European exports that head to the largest emerging economy. The crude oil price 6-month impulse, where a price decline constitutes a positive impulse given Europe’s dependence on energy imports. Chart I-8The Drivers Of Europe's Future Activity Indicator Are Losing Momentum The Drivers Of Europe's Future Activity Indicator Are Losing Momentum The Drivers Of Europe's Future Activity Indicator Are Losing Momentum Today, we find that the 6-month credit impulse both in the euro area and in China have lost momentum; meanwhile, given the rebound in the oil price, the crude oil price 6-month impulse has clearly faded (Chart I-8). Hence, our future activity indicator suggests that in the second half of this year, euro area GDP growth is unlikely to accelerate much from the current 1.5-2 percent clip.  For investors, this means that this year’s absolute double-digit returns have most likely already been made during the early-2019 star alignment of near-perfect conditions. And the remainder of the year is likely to be much tougher going for all the major asset-classes.  Still, there are always double-digit returns to be found somewhere in the investment landscape. In the second half of the year, the big story will be sector rotation. For example, in recent reports, we highlighted that healthcare is likely to flip from underperformer to outperformer versus technology. Given their sector skews, it follows that European equities are likely to outperform Chinese equities. Fractal Trading System* This week’s recommended trade is based on an oddity. While the majority of stock markets have suffered corrections, New Zealand’s NZX 50 has escaped relatively unscathed so far, making it vulnerable to a corrective underperformance one way or another. Hence, short the NZX 50 versus the FTSE100, and set the profit target and stop-loss at 2 percent. In other trades, short China versus Japan quickly achieved its profit target. Long Nikkei 225 versus Hang Seng was also closed in profit at the end of the 65 day maximum holding period. Against these two profitable trades, long SEK/NOK was closed at its stop-loss. This leaves the Fractal Trading System with four open positions. For any investment, excessive trend following and groupthink can reach a natural point of instability, at which point the established trend is highly likely to break down with or without an external catalyst. An early warning sign is the investment’s fractal dimension approaching its natural lower bound. Encouragingly, this trigger has consistently identified countertrend moves of various magnitudes across all asset classes. Chart I-9 NZX 50 VS. FTSE100 NZX 50 VS. FTSE100 The post-June 9, 2016 fractal trading model rules are: When the fractal dimension approaches the lower limit after an investment has been in an established trend it is a potential trigger for a liquidity-triggered trend reversal. Therefore, open a countertrend position. The profit target is a one-third reversal of the preceding 13-week move. Apply a symmetrical stop-loss. Close the position at the profit target or stop-loss. Otherwise close the position after 13 weeks. Use the position size multiple to control risk. The position size will be smaller for more risky positions. *  For more details please see the European Investment Strategy Special Report “Fractals, Liquidity & A Trading Model,” dated December 11, 2014, available at eis.bcaresearch.com. Dhaval Joshi, Chief European Investment Strategist dhaval@bcaresearch.com Footnotes 1 The precise mix of the portfolio is 29% MSCI World $, 29% German 30-year bund, 29% U.S. 30-year T-bond, 13% WTI. Please see a replay of the webcast ‘From Sweet Spot to Weak Spot’ available at eis.bcaresearch.com. 2  Quarter-on-quarter real GDP growth at annualized rates. Fractal Trading System Recommendations Asset Allocation Equity Regional and Country Allocation Equity Sector Allocation Bond and Interest Rate Allocation Currency and Other Allocation Closed Fractal Trades Trades Closed Trades Asset Performance Currency & Bond Equity Sector Country Equity Indicators Bond Yields Chart II-1Indicators To Watch - Bond Yields Indicators To Watch - Bond Yields Indicators To Watch - Bond Yields Chart II-2Indicators To Watch - Bond Yields Indicators To Watch - Bond Yields Indicators To Watch - Bond Yields Chart II-3Indicators To Watch - Bond Yields Indicators To Watch - Bond Yields Indicators To Watch - Bond Yields Chart II-4Indicators To Watch - Bond Yields Indicators To Watch - Bond Yields Indicators To Watch - Bond Yields   Interest Rate Chart II-5Indicators To Watch - Interest Rate Expectations Indicators To Watch - Interest Rate Expectations Indicators To Watch - Interest Rate Expectations Chart II-6Indicators To Watch - Interest Rate Expectations Indicators To Watch - Interest Rate Expectations Indicators To Watch - Interest Rate Expectations Chart II-7Indicators To Watch - Interest Rate Expectations Indicators To Watch - Interest Rate Expectations Indicators To Watch - Interest Rate Expectations Chart II-8Indicators To Watch - Interest Rate Expectations Indicators To Watch - Interest Rate Expectations Indicators To Watch - Interest Rate Expectations  
Overnight Chinese data was poor. Fixed asset investment, industrial production and retail sales all decelerated significantly. Meanwhile, U.S. April retail sales slowed meaningfully, and the monthly contraction in industrial production pushed capacity…
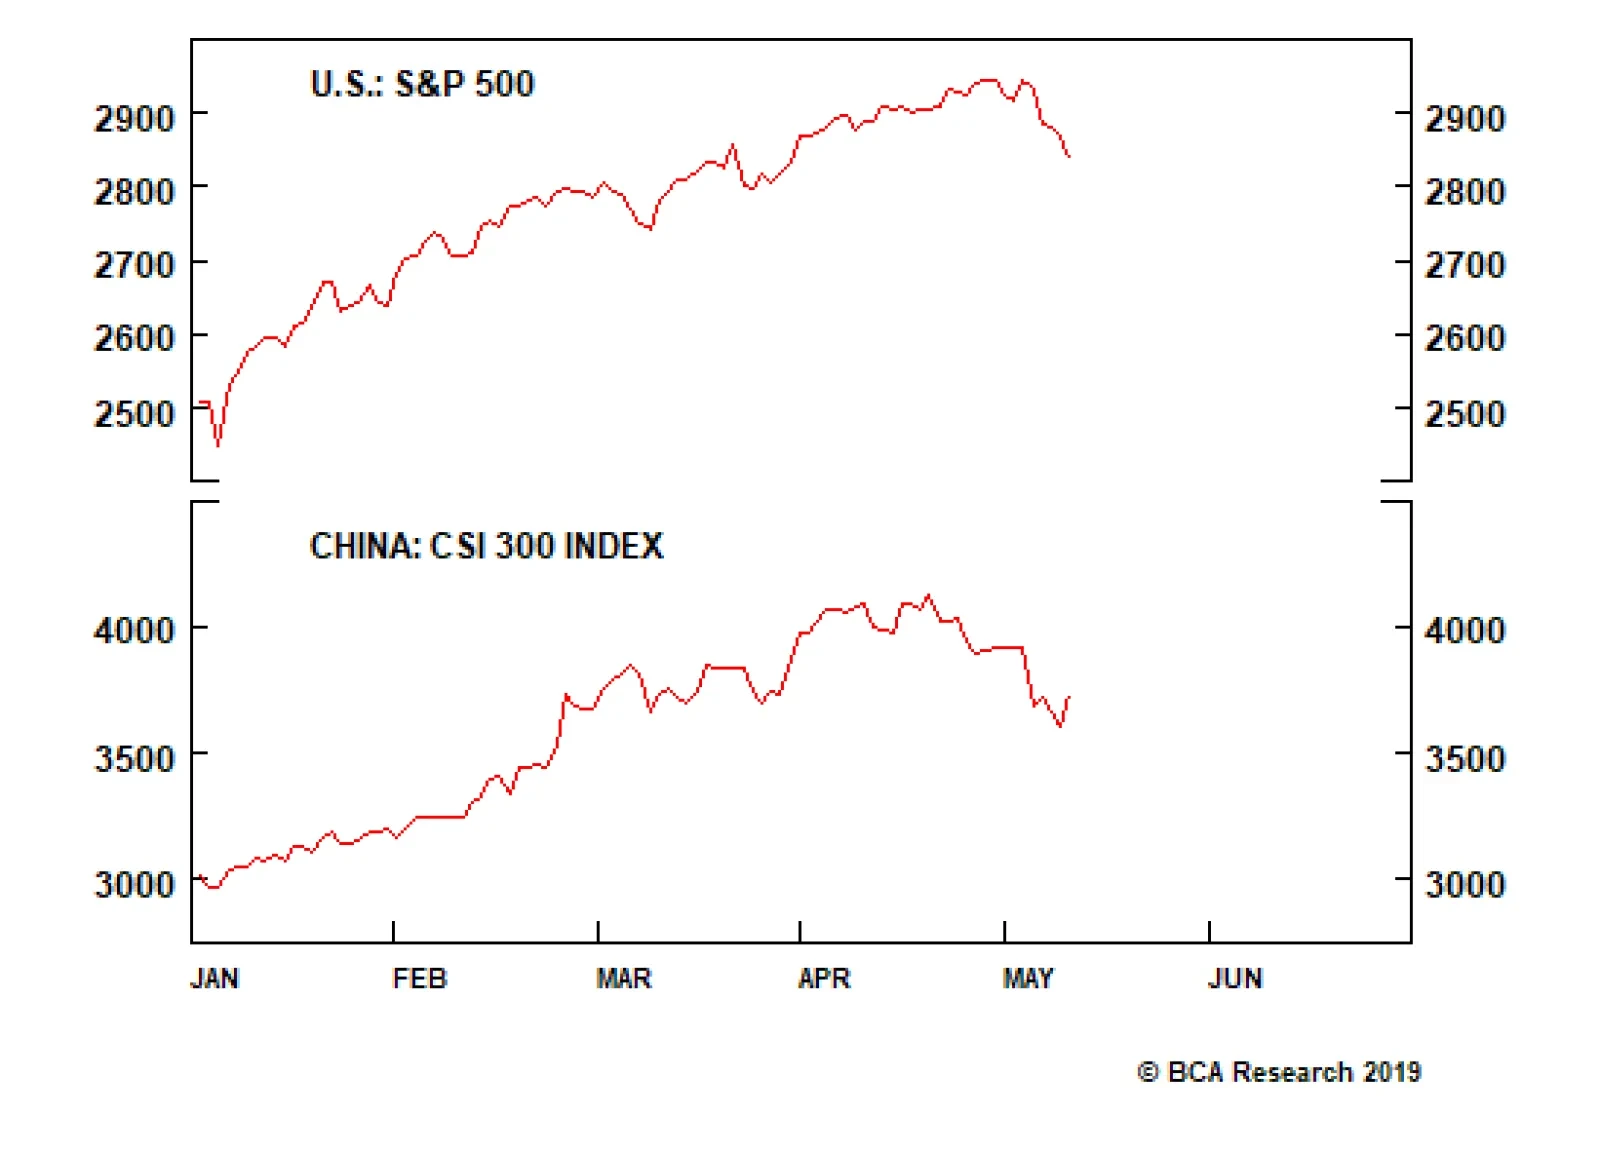
Highlights Looking past the day-to-day noise of trade-related announcements, we view the underlying odds of an actual trade agreement this year to have fallen below 50%. For the purposes of investment strategy, China-exposed investors should now simply assume that the U.S. proceeds with 25% tariffs on all imports from China. Given this, investors should stop focusing strictly on the odds of trade war, and should instead start focusing on the likely net impact of the tariff shock and China’s inevitable policy response. Simulated and empirical estimates of the impact of a 25% increase in tariffs affecting all U.S.-China trade suggest that economic conditions in China are likely to deteriorate to 2015/2016-like levels. This implies that a 2015/2016-style policy response will again be required in order for policymakers to be confident that the shock will be overcome. The preference of policymakers is to prevent another significant episode of releveraging, but the constraints facing policymakers suggest that one is unlikely to be avoided. We see a meaningful chance that this tension will be resolved by a classic market “riot” over the coming 3 months as financial markets force reluctant policymakers to capitulate. We would not recommend a long position in Chinese stocks, either in absolute terms or relative to the global benchmark, for investors with a time horizon of less than 3 months. However, over a strictly cyclical (i.e. 6-12 month) time horizon, we would recommend staying long/overweight on the basis that policymakers will ultimately respond as needed. We recommend investors hedge the inherent RMB exposure from a long US$ cyclical position in Chinese stocks by opening a long USD-CNH trade. Feature U.S. and Chinese negotiators failed last week to secure an agreement deferring the threatened increase in the second round tariff rate.1 The tariffs increased on Thursday at midnight for goods not already in transit to the U.S. (effectively doubling the existing tariffs), which was followed by the inevitable retaliation by China on Monday (scheduled to take effect on June 1). The retaliation, coupled with President Trump’s earlier warning that China should not do so, was taken by investors as a sign that 25% tariffs on all goods imported from China will soon be in place. As we go to press, the S&P 500, Hang Seng China Enterprises Index, and the CSI 300 are down 3.5%, 7%, and 6.9%, respectively, since President Trump’s May 5 tweet (Chart 1). Chart 1Investors Are Starting To Price In 25% Tariffs Affecting All U.S.-China Trade Investors Are Starting To Price In 25% Tariffs Affecting All U.S.-China Trade Investors Are Starting To Price In 25% Tariffs Affecting All U.S.-China Trade Stimulus Minus Shock Holding all else equal, the events of the past two weeks are strictly negative for Chinese economic growth and would thus justify a decisively bearish outlook for Chinese stock prices after the rally that has taken place over the past six months. However, all is not equal, because a substantial deterioration in the export outlook will invariably cause a response from Chinese policymakers. Over the coming few weeks, global investors are likely to remain highly focused on developments and announcements related to the trade conflict. But at this point, our geopolitical team believes that the conclusion of an actual trade agreement this year is now only a 40% probability. This underscores that China-exposed investors should, for the purposes of investment strategy, simply assume that the U.S. proceeds with 25% tariffs on all imports from China, and should broaden their focus to the outcome of a simple formula that describes the potential net outcome of this event. Two simple scenarios concerning this formula are outlined below: Scenario 1 (Bullish): Stimulus – Shock > 0 Scenario 2 (Bearish): Stimulus – Shock ≤ 0 In scenario 1, the impact of China’s reflationary efforts more than offsets the negative shock to aggregate demand from the sharp decline in exports to the U.S. In this scenario, investors should actually have a bullish cyclical outlook for China-related assets, even if the near-term outlook is deeply negative. Scenario 2 denotes a bearish outcome where China’s reflationary response is not larger than the magnitude of the shock, which includes a circumstance where the impacts are exactly offsetting (because of the higher uncertainty, and thus risk premium, that this would entail). “Solving” The Formula In order to “solve” this formula, investors need answers to the following three questions: What is the size and disposition of the likely shock to China’s economy in a full-tariff scenario? What kind of reflationary response is required in order to offset this shock? What are the odds that policymakers will deliver the required response? Simulated and empirical estimates of a 25% increase in tariffs affecting all U.S.-China trade suggest a sizeable economic impact. Charts 2 & 3 provide the IMF’s perspective on the first question. The charts show the simulated impact of a 25% increase in tariffs affecting all U.S.-China trade, and they estimate the near-term impact for China to be -1.25% for real GDP (-0.5% over the long-run) and -3.5% for real exports (-4.5% to -5.5% over the long run). Chart 2 Chart 3   A recent IMF working paper came up with a more benign estimate of the first year impact, but a sizeable second year impact and a similar estimate of the long-term ramifications of tariff increases.2 Using a dataset with wide time and country coverage, the aggregate results of the study imply that Chinese output is only likely to fall about 0.2% in the year following the tariff increase. However, the cumulative shock to output increased sharply to roughly 1.6% in the second year of the tariff increase, with a negative yearly impact to output persisting for 5 years (with an average annual impact of -0.6% over the whole period, somewhat higher than the estimates shown in Charts 2 & 3). At the 90% confidence interval, the author’s estimates show that a tariff increase of this magnitude would imply a -1.7% average impact on output per year in the first two years following the increase. Chart 4The IMF's Shock Estimates Suggest A Serious Hit To China's Economy The IMF's Shock Estimates Suggest A Serious Hit To China's Economy The IMF's Shock Estimates Suggest A Serious Hit To China's Economy In order to answer the second question, investors need to have some sense of the relative magnitude of the estimates noted above. Chart 4 provides some perspective and highlights that the estimates above, were they to materialize, would do two things: Taking Chinese real GDP data at face value, it would cause the largest deceleration in China’s real GDP growth rate since 2012, when the economy slowed significantly and authorities responded forcefully. Based on the most recent data for Chinese real export growth, a 3.5% deceleration in export volume would push its growth rate to its lowest level since the global financial crisis. In practice, we doubt that China’s reported real GDP growth rate accurately reflects what occurred in 2015, and it is very possible that a similar deceleration happened in that year. However, economic similarity to the 2015/2016 episode implies that a similar policy response may also be required, a proposition that is supported by our MSCI China Index earnings recession model. Table 1 shows a set of earnings recession probabilities, based on a model that we presented in two recent reports.3 The scenarios express the odds as a function of new credit to GDP and our calculation of China’s export weighted exchange rate, and assume a substantial decline in the new export orders component of the official manufacturing PMI, and flat momentum in forward earnings. Table 1Our Earnings Recession Model Suggests That A 2015/2016 Style Response Is Needed To Counter This Shock Simple Arithmetic Simple Arithmetic The table clearly highlights that a significant further acceleration in new credit to GDP, coupled with a meaningful decline in the exchange rate, is needed in order to stabilize the earnings outlook. We have previously related stability in the outlook for earnings to stability in the economy itself, given the close correlation between Chinese investment-relevant economic activity and the earnings cycle (Chart 5). Given that new credit to GDP peaked at 31.5% during the 2015/2016 episode, it seems reasonable to conclude that a 2015/2016-style policy response will again be required in order for policymakers to be confident that the shock will be overcome. Policymaker Preferences Vs. Constraints This brings us to our third question: What are the odds that policymakers will deliver the stimulus required to confidently overcome the upcoming shock? It seems reasonable to conclude that a 2015/2016-style policy response will again be required in order for policymakers to be confident that the shock will be overcome. If the answer was only dependent on the preferences of policymakers, the odds would be low. China has relied heavily on credit to stimulate its economy over the past decade, and Chart 6 highlights that this has come at a high cost. The BIS’ estimate of the debt service ratio of China’s private non-financial sector is already extraordinarily high relative to other countries, and another round of meaningful re-leveraging will just make this problem even worse. Chart 5Earnings Stability = Economic ##br##Stability Earnings Stability = Economic Stability Earnings Stability = Economic Stability Chart 6Further Leveraging Will Undoubtedly Make A Big Problem Even Worse Further Leveraging Will Undoubtedly Make A Big Problem Even Worse Further Leveraging Will Undoubtedly Make A Big Problem Even Worse   We documented in detail how this has created the risk of a debt trap for China’s state-owned enterprises in an August Special Report,4 and have presented evidence arguing that China’s policymakers appear to have good economic reasons to try and shift China’s economy away from extremely high rates of investment towards more consumption.5 This implies that restraining credit growth to avoid further leveraging has been a reasonable policy objective during periods of relative economic stability. However, policy decisions cannot be made in a vacuum, and this is true even in the case of China. As such, instead of preferences, investors should be focused on policymaker constraints in judging likely policy actions. Given the potential for second round effects, Chinese policymakers need to calibrate their policy response to ensure a positive net impact of the stimulus minus the shock. In our view, three factors point to the conclusion that Chinese policymakers face serious economic constraints in setting their policy response: Charts 2-4 highlighted that 25% tariffs on all U.S.-China trade would constitute a meaningful shock, but it is also the case that this shock would be coming at a time when Chinese economic momentum is already relatively weak. This suggests that policymakers will have to act quickly and decisively to put a floor under economic activity. Charts 7 & 8 suggest that there are meaningful second round effects on Chinese domestic investment from external sector shocks, which raises the possibility that the impact on Chinese economic activity may be larger than Charts 2-4 suggest. Chart 7 shows that while the contribution to official real GDP growth from net exports is small, Chart 8 shows that past changes in net export contribution are reasonably correlated with subsequent changes in the contribution to growth from gross capital formation. While it is possible that this relationship is not actually causal, taking it at face value implies that the IMF’s estimate of the impact on output could be exceeded if the contribution to growth from net exports declines by 0.4% or more (holding the contribution to growth from final consumption expenditure constant). Since 2018’s change in net export contribution declined by three times this amount (1.2%), the downside risks to domestic investment from effectively quadrupling U.S. import tariffs are clear. China does not have a flexible labor market, and its political system is highly sensitive to significant job losses. Chart 9 shows that the employment situation has already seriously deteriorated in lockstep with actual economic activity, further underscoring the need for policymakers to act urgently. Chart 7 Chart 8 Chart 9The Employment Situation Is Already Deteriorating, And Will Do So Further The Employment Situation Is Already Deteriorating, And Will Do So Further The Employment Situation Is Already Deteriorating, And Will Do So Further We are open to the idea that policymakers may be able to devise a stimulative response of similar reflationary magnitude to the 2015/2016 episode without resorting to a major credit overshoot, but we are currently unable to articulate what it might be. This is an area of ongoing research for BCA’s China Investment Strategy service, but for now we assume that a credit overshoot remains the ultimate line of defense for China’s policymakers that will be deployed if the pursuit of alternative strategies fail to quickly stabilize economic activity. Investment Strategy Conclusions In our view, focusing on policymaker constraints rather than their preferences is much more likely to guide investors towards the right strategy conclusions over a 6-12 month time horizon. However, in the near-term, policy mistakes can occur, and are much more likely to occur if policymakers react to the imposition of constraints rather than anticipate their arrival. Over the coming three months, we see meaningful odds that Chinese policymakers remain reluctant to allow another episode of significant releveraging in the economy. If we are correct in our assessment of the damage that the tariff shock is likely to cause, this would set up a classic market “riot”, where policymakers are forced by financial markets to capitulate and respond forcefully to the seriousness of the economic situation. Further RMB weakness is likely. Investors should hedge their exposure and go long USD-CNH. Chart 10Investors Have A Green Light To Bet On A Lower RMB Investors Have A Green Light To Bet On A Lower RMB Investors Have A Green Light To Bet On A Lower RMB Given this, we would not recommend a long position in Chinese stocks, either in absolute terms or relative to the global benchmark, for investors with a time horizon of less than 3 months. However, over a cyclical (i.e. 6-12 month) time horizon, we would recommend staying long/overweight on the basis that policymakers will ultimately deliver the stimulus required to more than offset the upcoming shock to external demand. This means that our long MSCI China Index, MSCI China A onshore index, and MSCI China Growth index trades relative to the global benchmark are explicitly cyclical in orientation, and may suffer meaningful further losses over the coming few months before ultimately recovering. As a final point, Table 1 highlighted that a meaningful decline in the exchange rate is likely required in order to stabilize the earnings outlook. Chart 10 shows that currency weakness persisted well past the trough in relative Chinese investable equity performance during the 2015/2016 episode, and we would expect a similar result in the current environment given the nature of the shock. As such, we recommend investors hedge the inherent RMB exposure from a long US$ cyclical position in Chinese stocks by opening a long USD-CNH trade today, with high odds of a break above 7 in the coming weeks. Jonathan LaBerge, CFA, Vice President Special Reports jonathanl@bcaresearch.com Footnotes 1 The first, second, third “round” of tariffs reference the $50/$200/$300 billion tranches of imported goods subject to U.S. tariff announcements since last summer. 2 IMF Working Paper WP/19/9, “Macroeconomic Consequences of Tariffs”, by Davide Furceri, Swarnali A. Hannan, Jonathan D. Ostry, and Andrew K. Rose. 3 Please see China Investment Strategy Special Report “Six Questions About Chinese Stocks,” dated January 16, 2019, and Weekly Report “A Gap In The Bridge,” dated January 30, 2019 available at cis.bcaresearch.com. 3 Please see China Investment Strategy Special Report “Chinese Policymakers: Facing A Trade-Off Between Growth And Leveraging,” dated August 29, 2018, available at cis.bcaresearch.com. 4  Please see China Investment Strategy Weekly Report “Is China Making A Policy Mistake?,” dated October 31, 2018, available at cis.bcaresearch.com.   Cyclical Investment Stance Equity Sector Recommendations
Since the onset of 2018, the U.S. has slapped various tariffs on China, the most important of which was 10% on $200 billion worth of Chinese goods. Assume for the sake of argument that only China and the U.S. were trading partners. The U.S. currently imports…
A trade war would hurt China, however, it is no longer as dependent on trade as it once was. Chinese exports to the U.S. account for only 3.6% of GDP, down from 7.3% of GDP in 2006. China also has plenty of tools to support the economy in the event of a…
Despite President Trump’s claim that the tariffs paid to the U.S. Treasury were “mostly borne by China,” the evidence suggests that close to 100% of the tariffs were, in fact, borne by U.S. companies and consumers. The tariffs were absorbed by U.S.…
There are many reasons why markets may have remained stable in the face of what was very bad news overnight. Chinese trade negotiators are still in Washington, keeping a glimmer of hope alive within investors that the tariffs could be resolved fast.…
The breakdown of the sources of funding for Chinese real estate developers are the following: Funding from property sales, including deposits, advance payments and mortgages assumed by property buyers, contributes nearly half of the sources of…
There are two important implications related to this unprecedented divergence among property sales, starts and completions. The first is that raising funds via launching property starts along with shrinking completions has resulted in a significant increase…