Emerging Markets
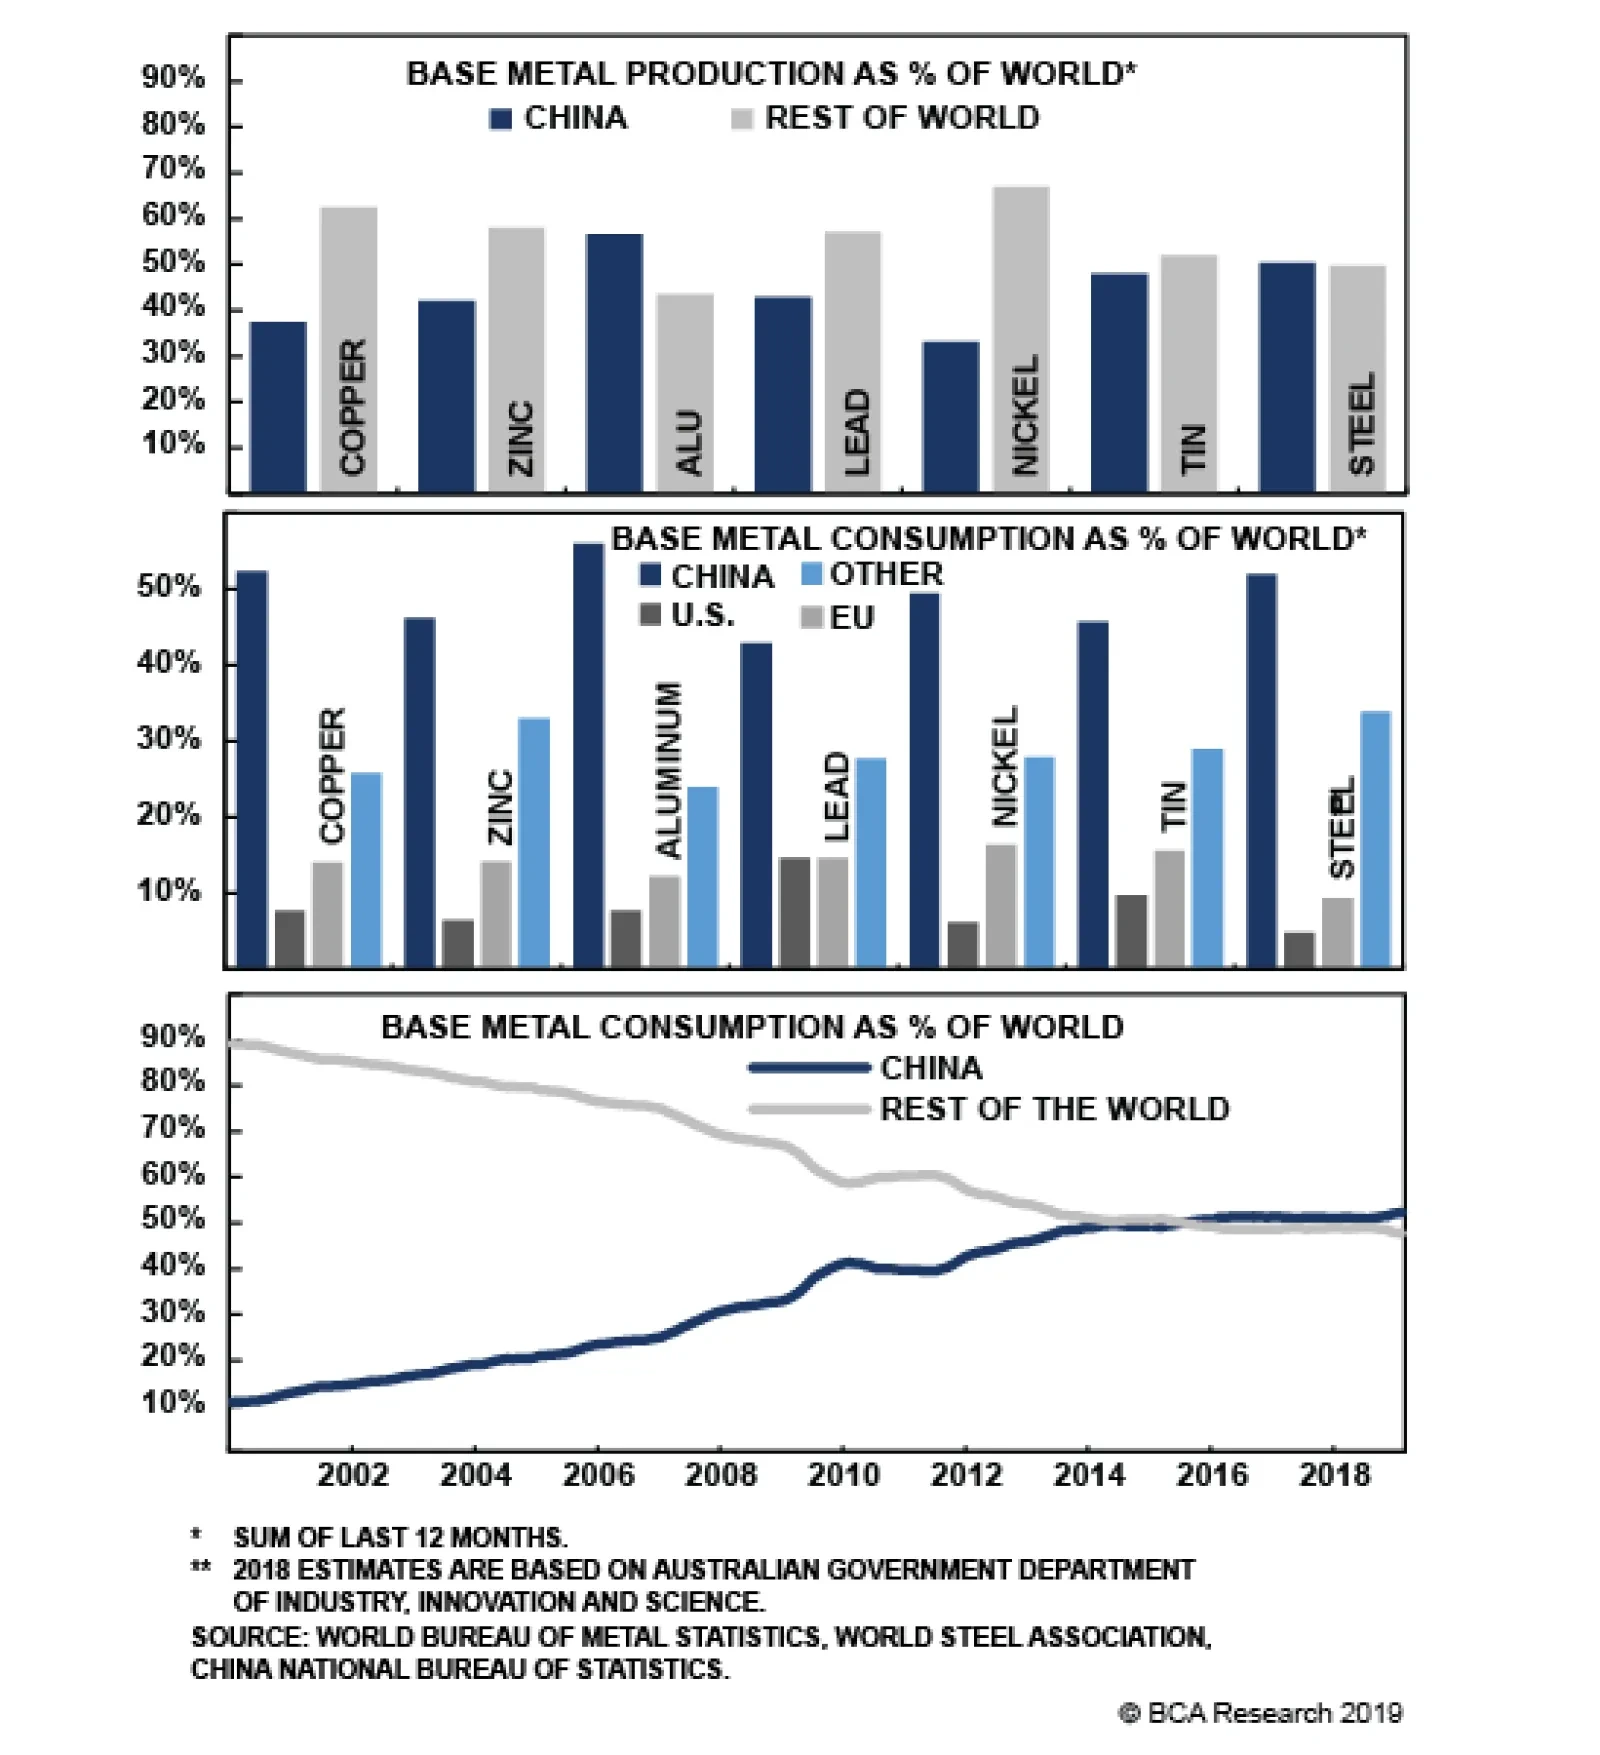
The influence of China’s economy on base metals prices is not unexpected: As China’s relative share of base metals supply and demand versus the rest of the world has grown, the marginal impact of its fiscal, credit, monetary and trade policies increased. The…

Highlights Even if higher tariffs are imposed tonight, there is a good chance that China and the U.S. will reach a temporary trade truce over the coming weeks. Contrary to President Trump’s assertion, U.S. companies and consumers have borne all of the costs of the tariffs. With the next U.S. presidential campaign less than one year away, the self-described “master negotiator” will actually need to prove that he can negotiate a trade deal. If trade talks do collapse, the Chinese will ramp up credit/fiscal stimulus “MMT style,” thus providing a cushion under global growth and risk assets. In fact, there is a very high probability that the Chinese will overreact to the risks to growth, much like they did in 2009 and 2016. Investors should remain overweight global equities for the next 12 months, while positioning for a modestly weaker U.S. dollar and somewhat higher global bond yields. Feature Tariff Man Strikes Again Hopes for a quick end to the trade war were dashed last Sunday. President Trump threatened to hike tariffs on $200 billion of Chinese goods and begin proceedings to tax the remaining $325 billion of imports currently not subject to tariffs. Although details remain sketchy, U.S. Trade Representative Robert Lighthizer apparently informed the president that the Chinese were backtracking on prior commitments to change laws dealing with issues such as market access, forced technology transfers, and IP theft.1 This infuriated Trump. Trump’s announcement came just as Vice Premier Liu He and a 100-person Chinese trade delegation were set to depart for Washington. As BCA’s Chief Geopolitical Strategist Matt Gertken has noted, the relationship between the two sides was deteriorating even before Trump fired his latest salvo.2 The Chinese government was incensed by the U.S. request that Canada detain and extradite a senior official at Huawei, a top Chinese telecom firm. For its part, the Trump Administration was irked by China’s questionable enforcement of Iranian oil imports, the escalation of Chinese military drills around Taiwan, and the perception that China had not done enough to keep North Korea in check following the failed summit with Kim Jong-Un in Hanoi. It would be naïve to expect these ongoing geopolitical issues to fade anytime soon. The world is shifting from a unipolar to a multipolar one (Chart 1). In an environment where there are overlapping spheres of influence, geopolitical tensions will rise. Chart 1The Era Of Unipolarity Is Over
The Era Of Unipolarity Is Over
The Era Of Unipolarity Is Over
That said, stocks still managed to advance during the first four decades of the post-war era even though the U.S. and the Soviet Union were at each other’s throats. What investors need today is some reassurance that the current trade spat will not degenerate into a full-out trade war that undermines global commerce. Ultimately, we think they will get this reassurance for the same reason that the Soviets and Americans never ended up lobbing missiles at each other: It would have been a lose-lose proposition to do so. Yet, the path from here to there will be a bumpy one. Investors should expect heightened volatility over the coming weeks. As It Turns Out, Trade Wars Are Neither Good Nor Easy To Win There was never any doubt that Wall Street would suffer from a trade war. What was less clear at the outset was the impact that higher tariffs would have on Main Street. Despite President Trump’s claim that the tariffs paid to the U.S. Treasury were “mostly borne by China,” the evidence suggests that close to 100% of the tariffs were, in fact, borne by U.S. companies and consumers. What investors need today is some reassurance that the current trade spat will not degenerate into a full-out trade war that undermines global commerce. A recent NBER paper compared the prices of Chinese imports that were subject to tariffs and similar goods that were not.3 Had Chinese producers been forced to bear the cost of the tariffs, one would have expected pre-tariff import prices to decline. In fact, they didn’t. The tariffs were simply absorbed by U.S. importers in the form of lower profit margins and by U.S. consumers in the form of higher selling prices. This does not mean that Chinese producers escaped unscathed. The paper showed that imports of tariffed goods dropped sharply as U.S. demand shifted away from China and towards domestically-produced goods and imports from other countries. Chart 2Support For Protectionism Rises When Unemployment Is High
Support For Protectionism Rises When Unemployment Is High
Support For Protectionism Rises When Unemployment Is High
One might think that the decision to divert spending from Chinese goods to, say, Korean goods would be irrelevant for U.S. welfare. However, a simple thought experiment reveals that this is not the case. Suppose that a 10% tariff raises the price of an imported good from $100 to $110. If the consumer buys this good from China, the consumer will lose $10 while the U.S. government will gain $10, implying no loss in welfare. However, suppose the consumer buys the same good, tariff-free, from Korea for $105. Then the consumer loses $5 while the government gets no additional revenue, implying a net loss in national welfare of $5. Things get trickier when we consider the case where the consumer buys an identical domestically-produced good for say, $107, in order to avoid the tariff. If the economy is suffering from high unemployment, the additional demand will boost GDP by $107. The consumer who bought the domestically-produced good will be worse off by $7, but wages and profits will rise by $107, leaving a net gain of $100 for the economy. When unemployment is high, beggar-thy-neighbor policies make more sense. This is a key reason why support for protectionism tends to rise when unemployment increases (Chart 2). Today, however, the U.S. unemployment rate is at a 49-year low. To the extent that tariffs shift demand towards locally sourced goods, this is likely to require that workers and capital be diverted from other uses. When this occurs, there is no change in overall GDP. Within the context of the example above, all that would happen is that consumers would lose $7, reducing national welfare by the same amount. In fact, it is even worse than that. The example above does not include the impact on welfare from any resources that would need to be squandered from having to shift workers and capital equipment from sectors of the economy that lose from higher tariffs to those that gain from them. Nor does the example include the adverse impact on national welfare from any retaliatory policies. Ironically, while the evidence suggests that U.S. tariffs did not have much effect on Chinese import prices, it does appear that Chinese tariffs had an effect on U.S. export prices. Agricultural prices are highly sensitive to market conditions. Chart 3 shows that grain and soybean prices fell noticeably in 2018 on days when trade tensions intensified. This pattern has continued into the present. It is not surprising that Senators Chuck Grassley and Joni Ernst, along with other senior Iowa politicians, penned a letter to President Trump imploring him to reach a trade deal in order to help the state’s farming communities.4
Chart 3
China’s Secret Weapon: MMT To be fair, the arguments above do not account for the strategic possibility that the threat of punitive tariffs forces the Chinese to open their markets and refrain from corporate espionage and IP theft. If Trump is able to wrangle these concessions from the Chinese, then he could remove the tariffs, creating an environment more favorable to American corporate interests. The problem is that China will resist conceding so much ground. True, a trade war would hurt Chinese exporters much more than it would hurt U.S. firms. However, China is no longer as dependent on trade as it once was. Chinese exports to the U.S. account for only 3.6% of GDP, down from 7.3% of GDP in 2006 (Chart 4). China also has plenty of tools to support the economy in the event of a trade war. Chief among these is credit/fiscal stimulus. As we discussed three weeks ago, investors are underestimating China’s ability to ramp up credit growth in order to support spending throughout the economy.5 High levels of household savings have kept interest rates below the growth rate of the economy (Chart 5). When GDP growth exceeds the interest rate at which the government can borrow, even a persistently large budget deficit will produce a stable debt-to-GDP ratio in the long run. Chart 4China Is No Longer As Dependent On Trade With The U.S. As It Once Was
China Is No Longer As Dependent On Trade With The U.S. As It Once Was
China Is No Longer As Dependent On Trade With The U.S. As It Once Was
Chart 5China: High Levels Of Household Savings Have Kept Interest Rates Below The Growth Rate Of The Economy
China: High Levels Of Household Savings Have Kept Interest Rates Below The Growth Rate Of The Economy
China: High Levels Of Household Savings Have Kept Interest Rates Below The Growth Rate Of The Economy
The standard counterargument is that governments cannot control the interest rate at which they borrow. This means that they run the risk of experiencing a vicious circle where high debt levels cause bond yields to rise, making it more difficult for the government to service its debt. This could lead to even higher bond yields and, eventually, default. However, this argument applies only to countries that do not issue their own currencies. Since a sovereign government can always print cash to pay for the goods and services, it can never run out of money. Chinese exports to the U.S. account for only 3.6% of GDP, down from 7.3% of GDP in 2006. The main reason a sovereign central bank would wish to raise rates is to prevent the economy from overheating. If a rising fiscal deficit is the consequence of a decline in private-sector spending (which is something that would likely happen during a trade war), there is no risk of overheating, and hence, there is no need to raise interest rates. We are not big fans of Modern Monetary Theory, but at least on this point, the MMT crowd is right while most analysts are wrong. Investment Conclusions It is impossible to say with any confidence what the next few days will bring on the trade front. If the Trump Administration’s allegation that the Chinese backtracked on prior commitments turns out to be true, it is possible that some of them will be reinstated, thus allowing the negotiations to resume. This could prompt Trump to offer a “grace period” to the Chinese of one or two weeks later tonight before scheduled tariff hikes are set to occur. If tariffs do go up, what should investors do? The answer depends on how much stocks fall in response to the news. If global equities were to decline by more than five percent, our inclination would be to get more bullish. There are two reasons for this. First, the failure to reach a deal this week does not mean that the talks will irrevocably break down. The point of Trump’s tariffs was never to raise revenue. It was to force the Chinese into a trade agreement that served America’s interests. With less than a year to go before the presidential campaign kicks into high gear, the self-described “master negotiator” needs to prove to the American public that he can actually negotiate a trade deal. This means some sort of an agreement is more likely than not. Second, as noted above, China will respond aggressively with fresh stimulus if the U.S. slaps tariffs on its exports. This will help cushion global growth and risk assets. Infrastructure spending tends to be more commodity intensive than manufacturing production. Thus, even if the Chinese government exactly offsets the loss of manufacturing exports with additional infrastructure spending, the net effect on global growth will probably be positive. China will respond aggressively with fresh stimulus if the U.S. slaps tariffs on its exports. In reality, there is a very high probability that the Chinese will do more than that. As the 2009 and 2016 episodes illustrate, when faced with a clear downside shock to growth, the government calibrates the policy response based on the worst-case scenario. Not only would a bout of hyperstimulus provide downside protection to the Chinese economy against a growth shock, it would also give the government more negotiating leverage with Trump. After all, it is much easier to brush away threats of punitive tariffs if you have an economy that is humming along. Investors should remain overweight global equities for the next 12 months, while positioning for a modestly weaker U.S. dollar and somewhat higher global bond yields. Peter Berezin, Chief Global Strategist Global Investment Strategy peterb@bcaresearch.com Footnotes 1 David Lawder, Jeff Mason, and Michael Martina, “Exclusive: China backtracked on almost all aspects of U.S. trade deal – sources,” Reuters, May 8, 2019. 2 Please see Geopolitical Strategy Special Alert, “U.S. And China Get Cold Feet,” dated May 6, 2019. 3 Mary Amiti, Stephen J. Redding, and David E. Weinstein, “The Impact of the 2018 Trade War on U.S. Prices and Welfare,” NBER Working Paper No. 25672, (March 2019). 4 “Young, Ernst Lead Iowa Delegation in Letter Urging President Not to Impose Tariffs,” Joni Ernst United States Senator For Iowa, March 7, 2018. 5 Please see Global Investment Strategy Weekly Report, “Chinese Debt: A Contrarian View,” dated April 19, 2019. Strategy & Market Trends MacroQuant Model And Current Subjective Scores
Chart 6
Tactical Trades Strategic Recommendations Closed Trades
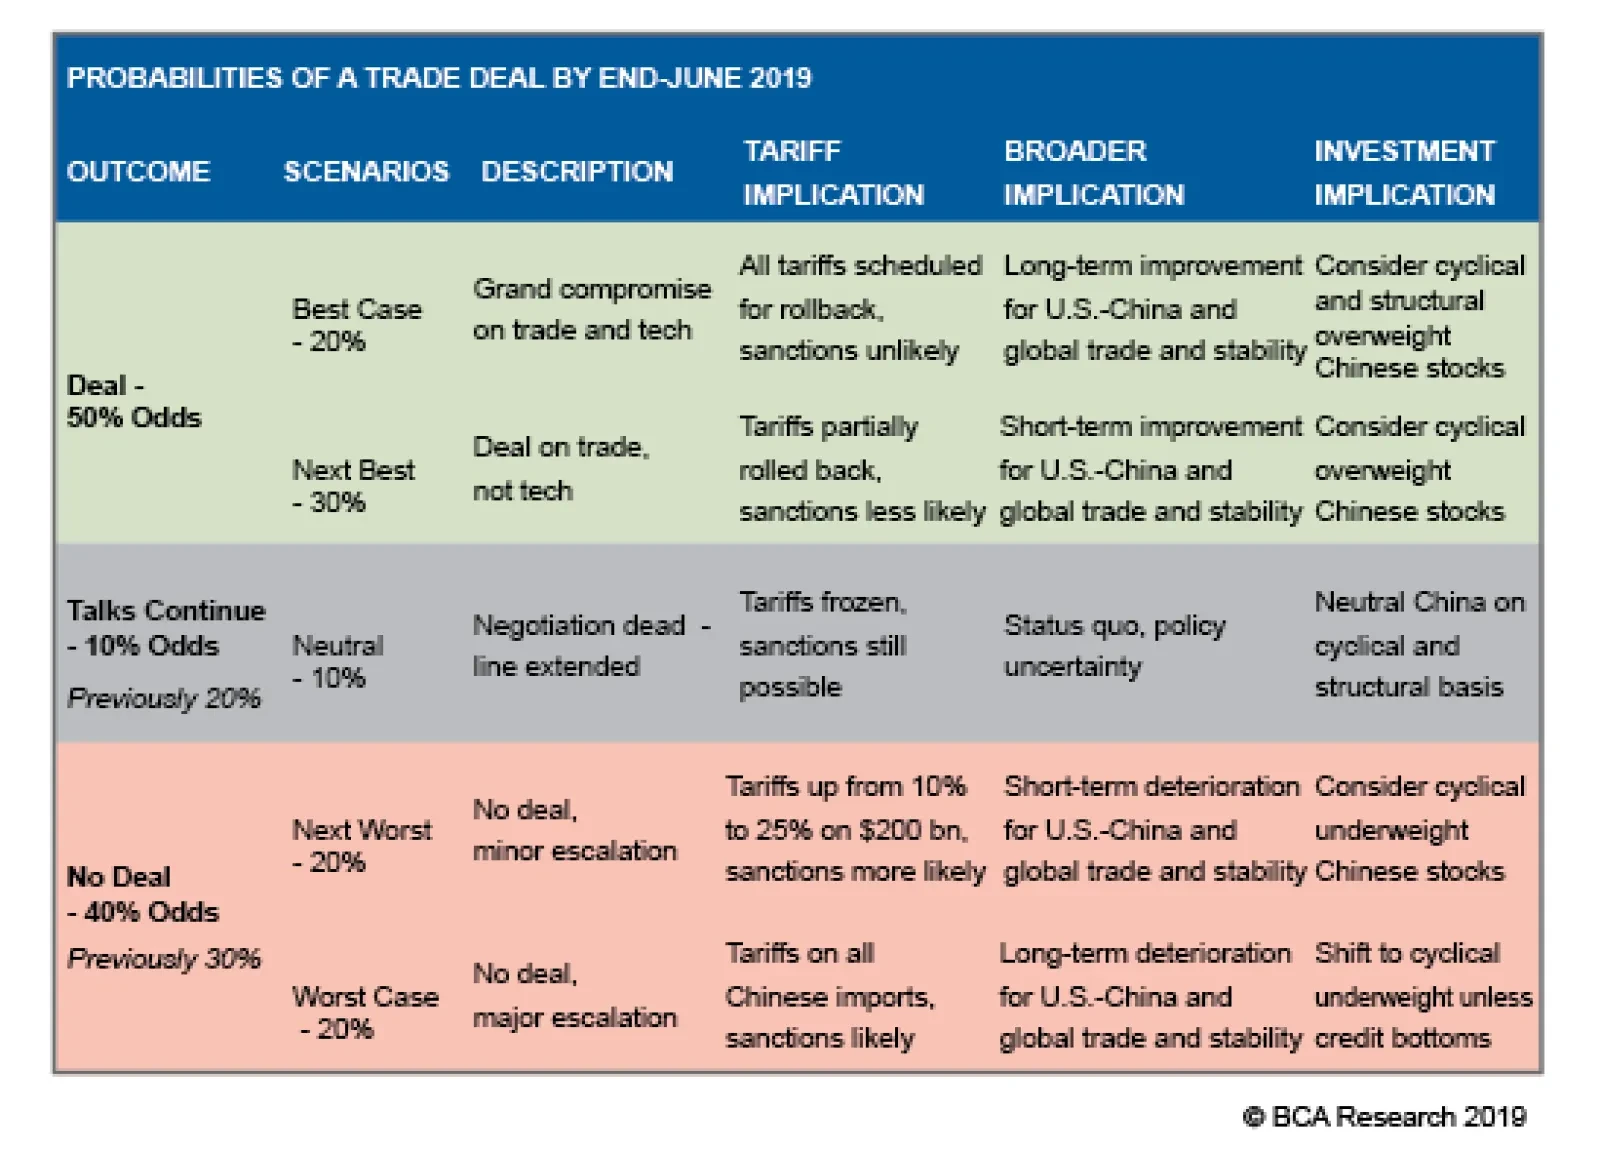
Highlights Coming up on the deadline for President Trump’s China – U.S. tariff ultimatum, tariffs on $200 billion of Chinese imports could go to 25% from 10% on Friday – the outlook for base metals remains complicated, particularly for aluminum and copper.1 Of course, the U.S. and China could have a meeting of the minds and agree to resolve the outstanding issues in the trade negotiations. This would be supportive of continued global supply-chain expansion, EM income growth and base metals prices generally. On the downside, an escalation of the Sino – U.S. trade war could retard investment in global supply chains, as firms hunker down for an extended and contentious contraction in global trade.2 This would be bearish for EM income growth, which would translate directly into lower base metals demand and, all else equal, depress prices. Still, a breakdown in trade talks could be bullish for base metals, as China likely would increase its fiscal, monetary and credit stimulus, in an attempt to offset the income-suppressing effects of reduced global trade and investment. As we said, it’s complicated. Two of the three outcomes above are supportive of base metals prices – i.e., a deal is agreed, and increased Chinese stimulus in the event of a breakdown in negotiations. Against this backdrop, we are closing our long tactical trading recommendations in copper and aluminum at tonight’s close, and replacing them with a call spread on July CME COMEX copper, in which we will get long $3.00/lb calls vs. short $3.30/lb calls. The call spreads are a low-risk way of positioning in a volatile market for a likely price-supportive outcome in these talks – the max loss on this position is the net premium paid to get long the spread. Highlights Energy: Overweight. Supply-side fundamentals continue to dominate oil price formation. An unplanned outage in Russia that took ~ 1mm b/d of oil off the market this week, following the contamination of exports with organic chloride left in shipments via Transneft’s European pipeline system. Russia’s Energy Ministry is guiding markets to expect the contamination will be cleared up toward the end of this month.3 Base Metals: Neutral. We are closing our tactical aluminum and copper trade recommendations at tonight’s close. We do see the potential for higher base metals prices – particularly copper – if China expands fiscal and monetary stimulus in the wake of a breakdown in trade talks with the U.S., or both sides can resolve their differences. We expect copper will benefit most from such outcomes. However, we believe a call spread – long July $3.00/lb CME COMEX calls vs. short $3.30/lb calls expiring in July – is a lower-risk way of expressing this view. Precious Metals: Neutral. Gold could rally in the wake of an expanded trade war, if the Fed and the PBOC – along with other systemically important central banks – adopt more accommodative monetary policies in anticipation of a widening trade conflict. Greater fiscal, credit and monetary stimulus by China in response to a breakdown in trade talks also could boost safe-haven demand for gold. Ags/Softs: Underweight. The risk of a wider Sino – U.S. trade war – particularly the likely retaliation by China if U.S. tariffs are raised to 25% on already-targeted exports of $200 billion – would be especially bearish for soybeans and grain exports from the U.S. We remain underweight. Feature In the wake of President Donald Trump’s ultimatum to China to resolve trade talks by tomorrow, BCA Research’s geopolitical strategists give 50% odds to a successful trade deal being concluded by end-June. The odds of an extension of trade talks are 10%; and the odds of no deal on trade, 40% (Table 1). Table 1Updated Trade War Probabilities (May 2019)
Expanded Sino – U.S. Trade War Could Be Bullish For Base Metals
Expanded Sino – U.S. Trade War Could Be Bullish For Base Metals
Of these possible outcomes, the no-deal scenario – i.e., an escalation in the trade war including raising tariffs on imports from China to 25% on the $200 billion of goods now carrying a 10% duty – would be the most volatile, and likely would push base metals’ prices lower in the short-term. A trade deal would set markets to estimating the extent of supply-chain investment and trade-flow revival, as the drawn-out uncertainty around the outcome of the Sino – U.S. trade war fades. Given the slim wedge our geopolitical strategists see between the deal and no-deal outcomes to these trade talks, we believe the implications of the latter need to be sorted. An agreement to extend trade talks likely would be welcomed with the same aplomb shown by markets prior to this current level of high drama. In this scenario, markets likely would price in an economically rational outcome to the U.S. – China trade negotiations, which resolves the uncertainty around tariffs and other investment-retarding policies. Given the slim wedge our geopolitical strategists see between the deal and no-deal outcomes to these trade talks, we believe the implications of the latter need to be sorted. In the short term – i.e., following a breakdown in the talks – market sentiment likely would become more negative, as traders priced in the implications for reduced global supply-chain investment and trade flows, particularly re China and EM exporters. In addition, base metals markets would discount the income hit to EM these effects would feed into, raising the likelihood commodity demand growth would slow. News flow would then dictate price action for the metals over the short term. As markets discount these expectations, we believe Chinese policymakers would act to increase the levels of fiscal, credit and monetary stimulus domestically, to counter the hit to domestic income. The lagged effects of this stimulus will have a strong influence on base metals’ price formation, and, depending on the level of stimulus, could be bullish for metals prices. China’s Influence on Base Metals Higher Post-GFC In previous research, we found copper, and to lesser extent aluminum and the LMEX index, which is heavily weighted to both, benefit most from monetary, credit and fiscal stimulus in China.4 Other metals also experience a lift when the level of these Chinese policy variables rises; however, their relationship with EM and China’s industrial production cycle is weaker and time varying (Chart of the Week).
Chart 1
In Table 2, we show how different policy and macro factors affect various base metal prices and the LMEX; these models generate the output for the curves in the Chart of the Week. The table show the coefficients of determination for single-variable regressions for each metal on the EM- or China-focused factor shown in the columns for the period 2000 to now, and 2010 to now. Within the base metals complex, copper, the LMEX index and aluminum exhibit the strongest and most reliable relationships with the explanatory variables shown at the top of each column. Table 2Coefficients Of Determination: Base Metals Prices (yoy) Vs. Key Factors
Expanded Sino – U.S. Trade War Could Be Bullish For Base Metals
Expanded Sino – U.S. Trade War Could Be Bullish For Base Metals
The biggest takeaway from this analysis is that, for each individual metal, Chinese economic activity in particular, and EM income dynamics generally dominate price determination. The importance of these factors increased considerably post-Global Financial Crisis (GFC). As was the case with our correlation analysis, this is best captured by our Global Industrial Activity (GIA) Index (Chart 2, panel 1). This is clearly seen in the co-movement of our GIA index and copper prices (Chart 2, panel 2), and EM GDP.5 Chart 3 shows the GIA index disaggregated in its four main components. Chart 2BCA's GIA Index Vs. EM GDP, Copper Prices
BCA's GIA Index Vs. EM GDP, Copper Prices
BCA's GIA Index Vs. EM GDP, Copper Prices
Chart 3BCA GIA Index Components' Performance
BCA GIA Index Components' Performance
BCA GIA Index Components' Performance
Our analytical framework for base metals in China holds the nonferrous “pillar industries” behave as vertically integrated conglomerates. The influence of China’s economy on base metals prices is not unexpected: As China’s relative share of base metals supply and demand versus the rest of the world has grown, the marginal impact of its fiscal, credit, monetary and trade policies increased (Chart 4). The principal effect would be visible in China’s demand-side effects, to which the supply side would respond. That is to say, China’s monetary, credit and fiscal policies post-GFC lifted domestic incomes, which lifted demand domestically. In addition, aggressive export-oriented trade policy contributed to income growth, as well. This prompted increased base metals and bulk (e.g., steel) output on the supply side.
Chart 4
A large part of this dynamic likely is explained by the role of state-owned enterprises (SOEs) in the base-metals markets in China. It is important to note these SOEs are strategic government holdings, responding to and directing government policy, as was recently noted in a University of Alberta study on SOEs: … the government maintains control over a number of economically significant industries, such as the automobile, equipment manufacturing, information technology, construction, iron and steel, and nonferrous metals sectors, which are all considered to be ‘pillar industries’ of the Chinese economy. The government, as a matter of official policy, intends to maintain sole ownership or apply absolute control over only what it considers to be strategic industries, but also maintains relatively strong control over the pillar industries.6 Our analytical framework for base metals in China holds the nonferrous “pillar industries” behave as vertically integrated conglomerates – ranging from firms refining of raw ore to those producing finished products used in infrastructure, construction, etc. In this framework, nonferrous metals in China are not commodity markets per se, but vertically integrated policy-driven industries responding to directives from the Chinese Communist Party’s (CCP) Politburo through to the State Council and the various ministries directing production and consumption.7 At the heart of this is the CCP’s efforts to direct economic growth. Investment Implications The implication of our policy-focused research is investors should focus on metals for which a large share of the variance in y/y prices can be explained by movements in Chinese economic activity. The no-deal outcome could be positive for base metals prices. To get a handle on this, we looked at the variance decomposition of each metal’s price in response to exogenous shocks originating from (1) Chinese economic activity, (2) EM (ex-China) and Complex Economies industrial activity, (3) U.S. industrial activity, and (4) the U.S. trade weighted dollar (Table 3).8 Using this approach, we found that: Copper, aluminum and the LMEX’s variances are mostly explained by China’s economic activity (~ 25%); specifically, shocks to the state’s industrial activity and credit cycle. This corroborates our earlier research, in which we focused on correlations between base metals and these factors. Idiosyncratic factors seem to account for a large part of nickel, lead and zinc’s price formation. This is seen by the large proportion of their variances that is unexplained by our selected explanatory variables. Given the opacity of fundamental data in these markets, we tend to avoid positioning in them. On average, EM ex-China and U.S. industrial activity account for a similar proportion of the variance in metal’s prices (~ 8%). While the U.S. dollar appears to be the second most important variable (~ 14%). Table 3China’s Economic Activity Drives Metals’ Return Variability
Expanded Sino – U.S. Trade War Could Be Bullish For Base Metals
Expanded Sino – U.S. Trade War Could Be Bullish For Base Metals
Our analysis indicates that, as a group, base metals will be supported by the ongoing credit stimulus in China. Each metal is positively correlated with China’s credit cycle and industrial activity. Nonetheless, from our correlation, regression and variance-decomposition analysis, we believe copper and aluminum provide a better and more reliable exposure, as does exposure to the LMEX index, because of its high aluminum and copper weightings. Bottom Line: Approaching the ultimatum set by U.S. President Trump for a resolution to the Sino – U.S. trade war, markets are understandably taut. The odds of a deal vs. no-deal outcome by end-June are close, while the odds trade talks are extended account for the difference. In our estimation, the no-deal outcome could be positive for base metals prices, given our expectation Chinese policymakers will lift the amount of stimulus to the domestic economy to offset the negative effects of an expanded trade war. A deal would remove a lot of the uncertainty currently holding back global supply-chain capex and trade flows, which also would be bullish for base metals. Robert P. Ryan, Chief Commodity & Energy Strategist rryan@bcaresearch.com Hugo Bélanger, Senior Analyst Commodity & Energy Strategy HugoB@bcaresearch.com Footnotes 1 For further discussion, please see “U.S. And China Get Cold Feet,” a Special Alert published by BCA Research’s Geopolitical Strategy May 6, 2019. It is available at gps.bcaresearch.com. Our geopolitical strategists give the odds of a successful trade deal being concluded by end-June 50%; that trade talks continue, 10%; and the odds of no deal on trade, 40%. 2 Please see “Global market structures and the high price of protectionism,” delivered at the Jackson Hole central bank conference August 25, 2018, by Agustín Carstens, General Manager, Bank for International Settlements. 3 Please see “Russia sees oil quality normalizing in late May after contamination, output drops,” published May 7, 2019, by reuters.com. 4 Please see our Weekly Report of April 25, 2019, entitled “Copper Will Benefit Most From Chinese Stimulus.” It is available at ces.bcaresearch.com. 5 BCA’s GIA index is heavily weighted toward EM industrial-commodity demand. Please see “Oil, Copper Demand Worries Are Overdone,” where we introduce and discuss the GIA index, published February 14, 2019, in BCA Research’s Commodity & Energy Strategy. It is available at ces.bcaresearch.com. 6 Please see “State-Owned Enterprises in the Chinese Economy Today: Role, Reform, and Evolution,” China Institute, University of Alberta, May 2018. 7 Something approximating a pure commodity market is crude oil – the supply and demand curves of many globally distributed sellers and buyers meet and clear the market. As such, a reasonable explanatory model for the evolution of prices can be generated using fundamental inputs (i.e., supply, demand and inventories). Fitting such models to base metals has proved difficult. We have better success explaining base metals prices using macro economic policy variables we believe are important to CCP policymakers – trade, credit, domestic GDP, etc. This is a new avenue of research, which we hope to use to hone in on a good explanatory model to account for ~ 50% of global base metal demand, and, in some instances (e.g., copper and steel, respectively) close to 40% - 50% of supply, as seen in Chart 4. Our current base metals research is focused on trying to disprove the hypothesis these are policy-directed markets within China. This aligns with Karl Popper’s falsifiability condition, which states a theory must be subject to independent, disinterested testing capable of refuting it, to be considered scientific. Please see “Popper, The Logic of Scientific Discovery,” (reprinted 2008), Routledge Classics, particularly Chapter 4. 8 Complex economies are countries ranking at the top of MIT’s Economic Complexity Index (ECI), and which export industrial goods to EM and China. The EM (ex-China) and Complex Economies variable is the first principal component extracted from a group of ~60 series related to industrial production in these countries. Investment Views and Themes Recommendations Strategic Recommendations Tactical Trades TRADE RECOMMENDATION PERFORMANCE IN 2019 Q1
Image
Commodity Prices and Plays Reference Table Trades Closed in 2019 Summary of Closed Trades
Image
Highlights Odds are that the recently improved access to financing will allow property developers to boost construction volumes modestly in the coming months. Yet, the outlook for new credit origination and government tolerance of another credit binge is highly uncertain. For now, the completion of previously launched projects will help construction-adjacent industries in the short run. However, these activities will consume real estate developers’ cash augmenting both their liquidity needs and financial vulnerability. That is a basis to underweight the Chinese real estate sectors within both the Chinese MSCI investable universe and the onshore A-share indexes. Feature The emergent divergence among Chinese property sales, starts and completions constitutes an exceptionally bizarre phenomenon. The gaps between these three indicators are currently unprecedented (Chart I-1). Understanding these divergences is critical to correctly gauging the outlook for the Chinese real estate market. This report aims to assess the growth outlook of these three variables. Odds are that these gaps will narrow going forward. Over the next three to six months, the Chinese property market is likely to be characterized by a contraction in floor space sold, a considerable relapse in floor space starts, and a rebound in floor space completions (Chart I-2). Chart I-1An Unprecedented Divergence…
The Unprecedented Divergence
The Unprecedented Divergence
Chart I-2…But A Convergence Looms
Convergence Ahead
Convergence Ahead
In terms of the strength of construction activity in the Chinese property market, the real estate developers’ access to funding has been and remains the key. Over the next three to six months, the Chinese property market is likely to be characterized by a contraction in floor space sold, a considerable relapse in floor space starts, and a rebound in floor space completions. For now, we reckon the improved access to financing in recent months should help property developers to boost construction volumes modestly in the coming months (Chart I-3). Chart I-3Construction Activity Will Modestly Improve In The Coming Few Months
Further Credit Easing Will Likely Lead To Rising Construction Activity
Further Credit Easing Will Likely Lead To Rising Construction Activity
That said, the current round of credit stimulus has probably been front-loaded in the first quarter, and property developers’ access to funding will begin to deteriorate again going forward. This will weigh on their ability to raise construction volumes materially. Understanding The Construction Cycle In China Floor space sold, starts and completions generally move in tandem. Specifically, strong sales lead rising starts, which then with a time lag result in increased completions. However, over the past 15 months, the growth rate of property starts has accelerated to over 20%, while sales have mildly contracted and floor space completions have been shrinking dramatically (Chart I-2). The key reason for these divergences has been the considerable financing difficulties facing property developers. Tighter monetary policy and credit beginning in late 2016 severely impaired developers’ ability to raise funds. This made Chinese real estate developers desperate for any source of possible revenue or financing. Launching new projects aggressively last year – i.e., more property starts – allowed real estate developers to pre-sell and get cash at a time when credit was tight. Property developers were also aiming to conserve cash flow amid tight credit. After investing 25% of the total investment required for a property project (excluding the value of the land), they received a presale permit from the authorities. The permits allowed them to sell housing units in advance. Home-buyers had to pay at least 30% of the total property value at the time they signed the presale contract. This way, developers were able to obtain both deposits and advance payments1 (Chart I-4). This was a welcome addition to scarce financing last year. After this phase, property developers then slowed their investment in construction, installation and equipment purchases – because these would consume precious, limited cash. This depressed construction activity has resulted in a material contraction in floor space completed (Chart I-5). Chart I-4Developers’ Funding Has Improved Due To Deposits & Advanced Payments
Rising Funding From Deposits And Advance Payments
Rising Funding From Deposits And Advance Payments
Chart I-5
Bottom Line: Launching new projects and pre-selling housing units while shrinking construction enabled Chinese real estate developers to stay afloat last year amid tight access to credit. What Does This Mean? There are two important implications related to this unprecedented divergence among property sales, starts and completions. The first is that raising funds via launching property starts along with shrinking completions has resulted in a significant increase in Chinese property developers’ liabilities. This is a form of borrowing money for property developers, and it has been occurring on top of very poor financial health. Specifically, Chinese real estate developers’ debt-to-equity ratio is currently above 4, and continues to surge (Chart I-6). Further, in 2018, 54 out of 131 Chinese property developers had negative free cash flow. This scheme of raising funding via new launches along with postponing building and completions is becoming unsustainable. The divergence between surging property starts and contracting completions suggests that real estate developers have raised funds through selling more uncompleted buildings instead of completed properties (Chart I-7, top panel). Chart I-6Chinese Property Developers Are Very Leveraged
Chinese Property Developers Are Very Leveraged
Chinese Property Developers Are Very Leveraged
Chart I-7A Big Increase In Sales Of Uncompleted Buildings
A Big Increase In Sales Of Uncompleted Buildings
A Big Increase In Sales Of Uncompleted Buildings
Specifically, some 87% of total residential floor space sold in the past 12 months has been sold in advance, much higher than the approximate 77% total recorded in the years prior to 2018 (Chart I-7, bottom panel). The second important implication is that property developers’ ability to raise financing will determine the strength of property construction activities in China going forward. Chinese real estate developers are facing massive funding requirements this year. Developers need considerable amounts of funding this year to speed up their construction activities on delayed projects (launched but not completed ones). It generally takes about two years for real estate developers to complete a construction project and deliver the presold properties. Developers had already slowed their construction progress last year. They must accelerate the pace this year to ensure deliveries are made on time. Developers also need to roll over or repay significant amounts of debt coming due in 2019. On the whole, they have issued nearly RMB3.9 trillion of bonds so far, with most in the three- to five-year duration. Chart I-3 on page 2 shows that further improvements in credit flows in the economy will likely lead to ameliorating construction activity. Credit easing has allowed developers to raise funds through bank loans, bond issuances (both domestic and overseas) and other forms of borrowing (Chart I-8). Property developers’ ability to raise financing will determine the strength of property construction activities in China going forward. As a result, real estate investment in construction, installation and equipment purchases have all ameliorated in recent months (Chart I-9). This reflects a true pickup in real estate construction activities since the beginning of this year. Chart I-8Marginal Credit ##br##Easing
Marginal Credit Easing
Marginal Credit Easing
Chart I-9
However, whether or not this latest improvement develops into full-fledged recovery is contingent on credit flows in the economy in general, and property developers’ access to financing in particular. If the overflow of credit decelerates after the massive binge that took place in the first quarter, it will weigh on construction activity. If the first-quarter credit binge persists, Chinese property developers will likely be able to raise sufficient funds to speed up property completions and roll over their maturing debt this year. In this scenario, construction activity will gather speed, facilitating a recovery in the overall economy. At the current juncture, it is impossible to make a definite conclusion. The outlook for new credit flows and government tolerance of another credit binge is highly uncertain. On the one hand, the Politburo last month reiterated that China will push forward structural deleveraging and prevent speculation in the property market. Preliminary credit flow numbers for April appear to be very weak, not confirming blockbuster credit in the first quarter. Besides, the banking regulator has renewed pressure on banks to recognize non-performing loans and provision for them.2 This will curb banks’ ability to originate new loans and buy corporate bonds. On the other hand, an escalation of tensions between China and the U.S. and the uncertainty it is instilling in the economy and financial markets could lead the authorities to keep the credit taps open for longer, allowing credit to flow into the broader economy. Bottom Line: Real estate developers are extremely leveraged and lack cash to complete launched projects. Hence, property developers’ ability to raise financing holds the key in terms of the strength of property construction activities in China. Further easing in credit will likely lead to rebounding property completions and rising construction activity, and vice versa. What About Chinese Property Demand? Easy credit may alleviate the financing stress facing Chinese real estate developers and lift construction activity temporarily. However, the most important and sustainable source of funding for real estate developers is property sales. Chart I-10 shows that funding from property sales, including deposits, advance payments and mortgages assumed by property buyers, contributes nearly half of the sources of funds raised in that year.
Chart I-10
Self-raised funds are the second-largest component of the source of funds, with a share of 34%. One major component of self-raised funds – retained earnings – are also closely related to property sales. The other major component is equity and bond issuance. Bank loans and foreign investment (including direct equity injections, sales of bonds and equity, and borrowing from foreign banks) together account for only about 15%. Even though there has been some credit easing for Chinese real estate developers, the bad news is that property sales are still in a structural downtrend. Chart I-11Slower PSL Injections Will Negatively Impact Property Demand
Diminishing PSL Scheme Will Be Negative To Property Demand
Diminishing PSL Scheme Will Be Negative To Property Demand
As discussed in our previous reports,3 China’s property market is currently facing structural impediments. Low affordability, slowing rural-to-urban migration, demographic changes, the promotion of the housing rental market and the government’s continuing emphasis on clamping down speculation are together generating strong structural headwinds for property demand in China. Importantly, surging property demand between late 2015 and 2017 was mainly driven by the Chinese central bank’s direct lending to the real estate sector, which is not sustainable. Our calculations indicate that about 20% of floor space sold (in volume terms) in 2017 was due to the Pledged Summary Lending (PSL) facility designed for slum area reconstruction.4 Indeed, the central bank’s PSL injections have already decelerated considerably since last year (Chart I-11). This has resulted in contracting overall property sales. Late last month, the authorities significantly cut their slum-area reconstruction target by more than one-half – from 6.4 million units last year to 2.85 million units this year. This suggests the amount of PSL injections will decline correspondingly (Chart I-12).
Chart I-12
Besides the diminishing PSL scheme, some other factors are also signaling a dismal outlook for Chinese property demand. A deep and long contraction in property demand in rich provinces indicates demand saturation (Chart I-13). Sales outside eastern provinces track PSL injections very closely, as per Chart I-11, and are facing headwinds. Chinese households are more leveraged than U.S. ones, with the former’s debt-to-disposable income ratio having surpassed that of the latter (Chart I-14). Chart I-13Demand Is Saturated In China’s (Richer) Eastern Provinces
Demand Saturation In Rich Eastern Provinces
Demand Saturation In Rich Eastern Provinces
Chart I-14China’s Household Debt Burden Is Very Elevated
Escalated Household Debt In China
Escalated Household Debt In China
Chart I-
In addition, mortgage rates in China have not dropped much, despite monetary policy easing in the past 12 months. Recent data shows the average mortgage rate paid by first-time homebuyers has fallen from 5.71% last November to 5.56% this March, a still-high number. With respect to the ability to service mortgage payments, on a 90-square-meter house with a 30% down payment, our calculations show that annual interest costs account for about 27% of average household disposable income levels (Table I-1). Overall, poor affordability for Chinese homebuyers will constrain property demand in the coming years. Finally, the government is quite determined to implement its property tax in a few years. Local governments’ financing needs will become more acute as revenue from land sales decline substantially. China’s property market is on the way to becoming the market dominated by second-hand properties instead of new buildings – similar to many developed countries. Critically, the progress in establishing property tax laws in China seems to be accelerating. There have been more high-level meetings and discussions about the property tax law, and these meetings/discussions are becoming more detailed and concrete. Bottom Line: Chinese housing demand will be in a structural downtrend, weighing on construction activity beyond any near-term rebound. Investment Implications Based on the above findings, we draw the following investment strategy conclusions: It is reasonable to expect a slight pickup in real estate construction activity in China over the next few months. This will be marginally positive for construction-related commodities demand. Consequently, construction-related commodities markets (steel, cement, and glass) may be supported in the near term (Chart I-15). However, over the longer term, we remain fundamentally negative on construction activity within China’s property markets, as property sales will be in a structural downtrend. BCA’s Emerging Market Strategy service recommends equity investors underweight Chinese property developers within the Chinese equity indexes (Chart I-16). Chart I-15Construction-Related Commodities May Marginally Benefit From A Pickup In Activity
Contraction Commodities Prices May Marginally Benefit
Contraction Commodities Prices May Marginally Benefit
Chart I-16Underweight Real Estate Stocks Relative To The Domestic And Investable Benchmarks
Underweight Real Estate Stocks Within Respective Chinese Investable Universes
Underweight Real Estate Stocks Within Respective Chinese Investable Universes
The completion of previously launched projects will help construction-related industries. Yet, these activities will consume real estate developers’ cash augmenting their liquidity needs and amplifying their financial vulnerability. This is a basis for our recommendation to underweight property stocks, especially following their significant outperformance in the past six months. Further, property stocks respond to marginal changes in financing conditions rather than housing sales or construction activities. The basis is that they are extremely leveraged, and access to funding is key. In the coming months, if credit conditions tighten at a time when real estate developers must commit cash to complete previously launched projects, their cash flow will deteriorate. This will be reflected in their share prices, which will underperform the Chinese broader onshore and offshore indexes. This is likely to occur regardless of the absolute performance of Chinese stocks. Ellen JingYuan He, Associate Vice President ellenj@bcaresearch.com Footnotes 1 Chinese real estate developers could also slow the construction activity after completing 50% of a property project, which allows them to receive at least 60% of the presold property value from house buyers. 2 https://www.bloomberg.com/news/articles/2019-05-06/china-is-said-to-imp… 3 Please see Emerging Markets Strategy Special Report “China Real Estate: A Never-Bursting Bubble?” dated April 6, 2018 and China Investment Strategy Special Report “China’s Property Market: Where Will It Go From Here?” dated September 13, 2018. 4 Please see China Investment Strategy Special Report “China’s Property Market: Where Will It Go From Here?” dated September 13, 2018. Equity Recommendations Fixed-Income, Credit And Currency Recommendations
Feature In lieu of our regular Weekly Report this week, tomorrow we will be publishing a joint Special Report on the Chinese housing market with our Emerging Markets Strategy service, authored by my colleague Ellen JingYuan He. Ellen’s previous housing report was extremely well received,1 and clients should look forward to tomorrow’s update. Chart 1A Full Trade War: Clear Near-Term Risk, But An Uncertain Cyclical Outlook
A Full Trade War: Clear Near-Term Risk, But An Uncertain Cyclical Outlook
A Full Trade War: Clear Near-Term Risk, But An Uncertain Cyclical Outlook
Turning to the financial markets, investors have been squarely focused this week on the sudden escalation in tension between the U.S. and China, caused by President Trump’s renewed threat on May 5 to heighten tariffs on Chinese imports at the end of this week. Specifically, President Trump has claimed that he would increase the current 10% tariff rate on $200 billion worth of Chinese imports to 25%, a move that was originally due on March 1, but was delayed to extend the talks and seek a better agreement. Trump also threatened to raise tariffs on the remaining $325 billion of Chinese imports that are so far untouched. This is the most significant escalation in rhetoric since before the tariff truce agreed on December 1 between Trump and Chinese President Xi Jinping in Buenos Aires. The financial market reaction was swift: Chinese A shares fell nearly 6% on Monday, and USD-CNY surged nearly half a percent (Chart 1). Chinese stocks fared better on Tuesday, but may come under pressure again later in the week as China’s trade delegation returns to the U.S. for talks on Thursday & Friday. Despite this week’s volatility, we would not yet recommend any portfolio strategy changes to investors who are positioned in favor of Chinese stocks or China-related assets more generally. First, we still see the combined odds of a deal or a further extension in talks as being as high as 60%, and investors would view an agreement to extend the negotiations in a positive light after this week’s selloff. At a minimum, investors are likely to get a better chance to sell in such a scenario. Second, over that past year we have steadfastly maintained that China’s economy and its earnings cycle are driven by monetary conditions, money, and credit growth, and two of these three drivers are clearly now pointing to improving economic activity over the coming year. Certainly, the imposition of a 25% import tariff on all Chinese goods would represent a new, negative shock to the Chinese economy, but in this scenario Chinese policymakers would also substantially dial up their reflationary response. As such, while the near-term response in the equity market is likely to be very negative if President Trump follows through with his threat, the cyclical (i.e. 6-12 month outlook) for Chinese relative equity performance is not yet clear. This is only true in local currency (i.e. hedged) terms, however, as we agree that there is meaningful downside potential for the RMB in a full tariff scenario. So while we are likely to advise investors to wait and assess the likely reflationary response if a 25% “second round” tariff rate is imposed this week before changing their equity stance, we would recommend a long USD-CNY/CNH position in the interim as a hedge against a potentially substantial decline in the RMB. Stay tuned. Jonathan LaBerge, CFA, Vice President Special Reports jonathanl@bcaresearch.com Footnotes 1 Please see BCA Research’s China Investment Strategy Special Report, “China’s Property Market: Where Will It Go From Here?,” published September 13, 2018. Available at cis.bcaresearch.com. Cyclical Investment Stance Equity Sector Recommendations
In a March 20 Special Report[1], our China Investment Strategy service presented their framework for estimating Chinese capital outflows, and noted several indicators that we would be monitoring to gauge the risk of another serious episode of capital flight. …
President Donald Trump has threatened to raise tariffs on $250 billion of Chinese imports this Friday. The threat came ahead of a week of meetings in Washington that had been billed as the final round of negotiations. Chinese officials responded to Trump’s…
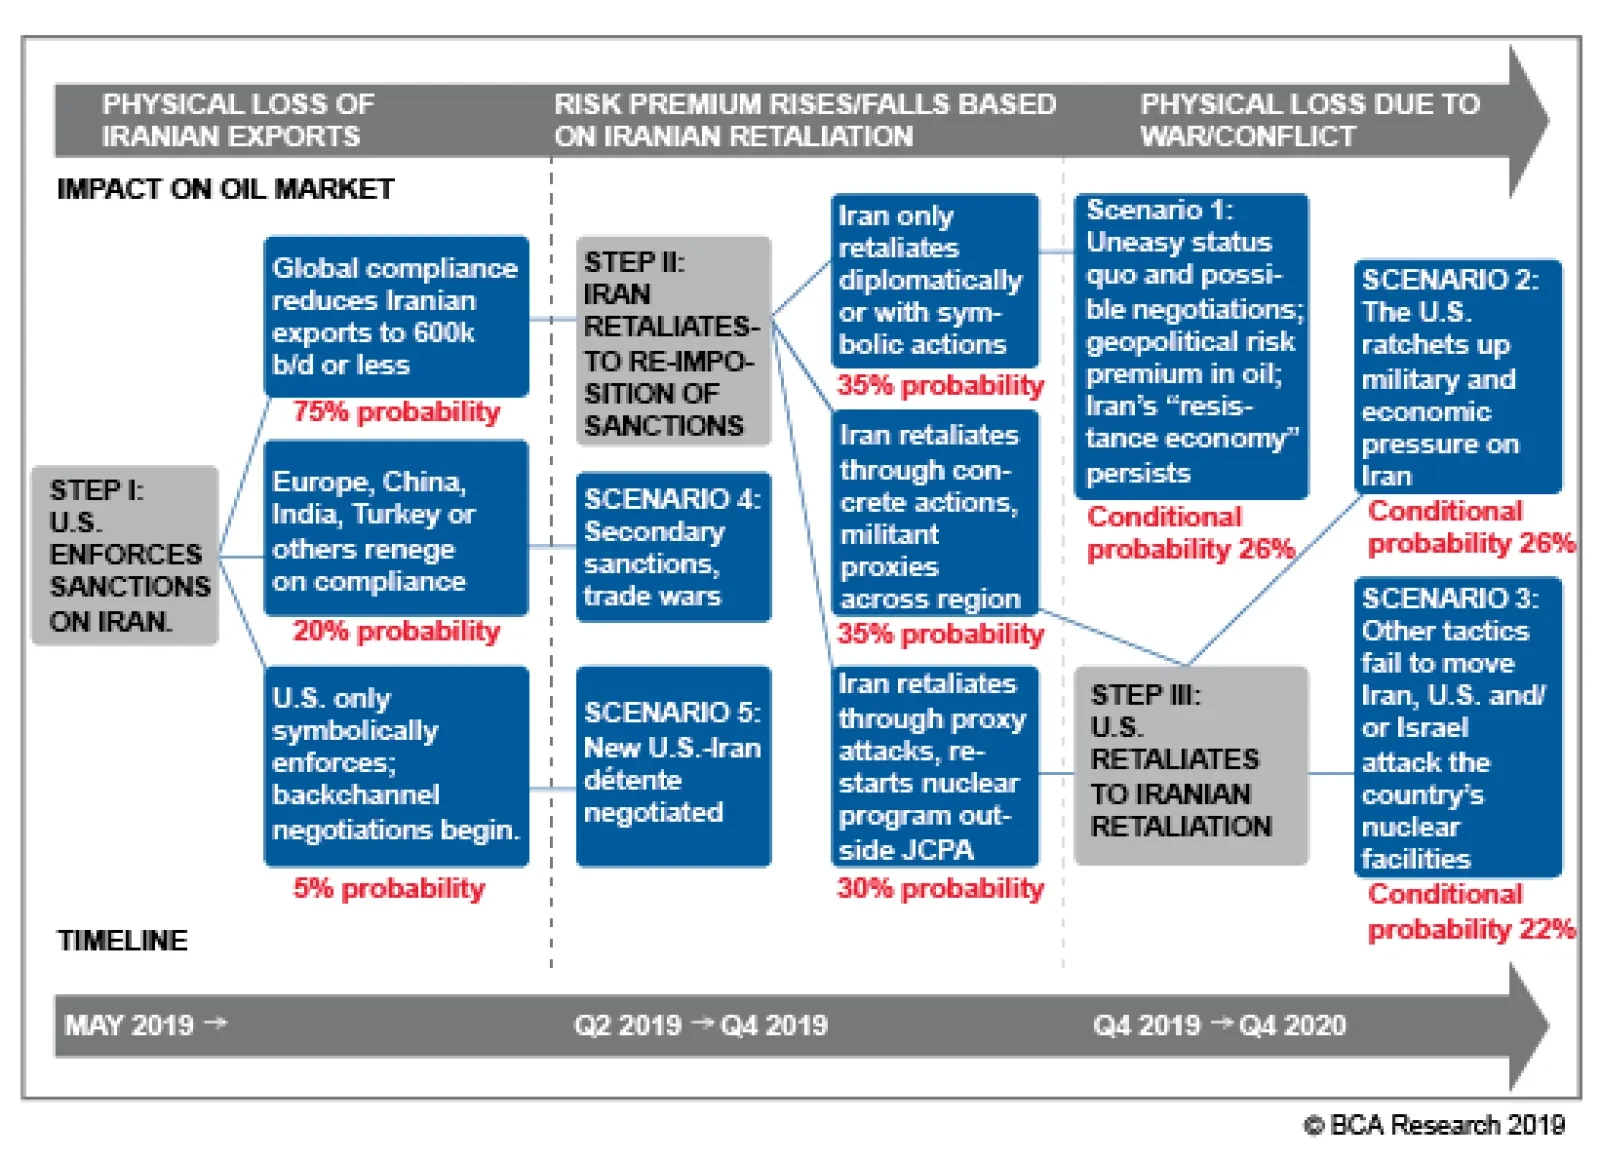
The Iranians, for their part, are unlikely to leap to the most aggressive forms of retaliation immediately – such as fomenting unrest in Iraq – because of their economic vulnerability. Small acts of sabotage or subversion are a way to send the U.S. a warning…

Given its gloomy economic outlook, Iran is looking to expand ties with its neighbors in an attempt to soften the blow from the sanctions. Earlier this year president Hassan Rouhani and Iraqi prime minister Adel Abdul Mahdi signed several preliminary trade…
Feature The U.S.-China trade talks have not yet collapsed but they appear to be reaching a “make it or break it” moment. President Donald Trump renewed his threat of heightening tariffs on Chinese imports on May 5, in the interim between two weeks of shuttle diplomacy in Beijing and next in Washington that have been billed as the final round of negotiations. Chinese officials responded to Trump’s new tariff remarks by threatening to pull out of the talks. The status of the Chinese delegation due in Washington this week is unclear as we go to press. Specifically, President Trump has claimed that he would increase the current 10% tariff rate on $200 billion worth of Chinese imports to 25%, a move that was originally due on March 1, but was delayed to extend the talks and seek a better agreement. Trump also threatened to raise tariffs on the remaining $325 billion of Chinese imports that are so far untouched. This is the most significant escalation in rhetoric since before the tariff truce agreed on December 1 between Trump and Chinese President Xi Jinping in Buenos Aires. True, the threat to increase the tariffs is a last-minute pressure tactic tied to the administration’s attempt to make this week “the final week” of the talks. American advisers have said that at the end of these two weeks they would make a recommendation to the president either to sign a deal or walk away. For this reason, it is not certain that Trump will follow through with the increase. However, we consider the threat credible. The costs of trade war are not prohibitive to the U.S. or China considering the strategic interests at stake in their great power competition (Chart 1). And since December 1, we have argued that a relapse into trade war and rising tariffs was a substantial risk at 30% odds; this threat increases those odds. Chart 1The Era Of U.S.-China Detente Is Over
The Era Of U.S.-China Detente Is Over
The Era Of U.S.-China Detente Is Over
Talks have been deteriorating for the past month at least. First, the trade grievances at the root of the trade war with China – namely corporate espionage, hacking, forced technology transfer, intellectual property theft, and the American-allied restrictions on Chinese telecoms firm Huawei – were always going to be extremely difficult to settle. These are apparently weighing on the ability of Washington and Beijing to close an agreement. Second, tensions have recently flared across the entire range of U.S.-China strategic disagreements, including most importantly North Korea and Iran. In late April, the U.S. demanded that China halt all imports of Iranian oil by the end of May in order to avoid secondary sanctions that, in theory, could affect China’s central bank and other banks. Meanwhile North Korea has conducted two minor but provocative weapon tests (including short-range missiles on May 4) since the failed summit between Trump and Kim Jong Un in Hanoi. Washington expects Beijing to keep North Korea in check and involved in diplomacy as part of the broader strategic negotiation. Taiwan and the South China Sea are also simmering due to U.S.-Taiwan diplomacy and arms sales, Chinese military drills, and the U.S. decision to treat China’s “maritime militia” like its navy. Trump’s latest threat reduces the chances of an extension of the talks beyond June to 10%, while raising the odds of a collapse in talks and escalation of trade war to 40%. As a result of these developments, and the dragging on of talks, we put the odds of a trade deal by the end of June at 50% in our April 10 report. Trump’s latest threat reduces the chances of an extension of the talks beyond June to 10%, while raising the odds of a collapse in talks and escalation of trade war to 40% (Table 1). Table 1Updated Trade War Probabilities (May 2019)
U.S. And China Get Cold Feet
U.S. And China Get Cold Feet
From the Chinese point of view, Trump’s threat makes it harder to clinch a deal. Trump’s use of sweeping, unilateral tariffs on national security grounds has forced China into an awkward position. It is politically and ideologically toxic for Beijing to appear to capitulate to coercion, i.e. nineteenth-century-style tactics of gunboat diplomacy and western imperialism. The tariff truce in Buenos Aires minimized the appearance that China is negotiating under duress, giving Xi Jinping the ability to negotiate and make concessions without losing face. While China is in the weaker position economically, and therefore would prefer a deal, it will batten down the hatches and fight a trade war if forced to do so. The risk of other executive decisions disruptive to markets is going up. The implication for investors is threefold. First, the USD and U.S. equities will continue to outperform global counterparts as trade policy uncertainty shoots back up (Chart 2). The American economy is more insulated from global trade and the dollar is counter-cyclical. But as U.S. equities have rallied and volatility will go up, U.S. equities may simply fall less rapidly than Chinese and others. Chart 2U.S. Will Outperform On Rising Trade Uncertainty
U.S. Will Outperform On Rising Trade Uncertainty
U.S. Will Outperform On Rising Trade Uncertainty
Second, our view that China’s economic stimulus will surprise to the upside is reinforced by this development, as Beijing cannot afford to withdraw or pause stimulus when it still faces such a severe external risk to its manufacturing sector and employment (Chart 3). This will counteract the negative impact to global sentiment and manufacturing expected from any additional tariffs, creating more volatility in commodity and emerging market assets. Third, as we recognized in the case of Trump’s renewed “maximum pressure” tactic on Iran, the president is apparently not concerned with minimizing risks to the economy ahead of the 2020 election. His risk appetite remains voracious. Therefore the risk of other executive decisions disruptive to markets is going up. For instance, our 35% chance that Trump will impose Section 232 tariffs on auto and auto part imports, particularly from Europe, is rising toward 50% (Chart 4). Chart 3China Cannot Afford to Withhold Stimulus
China Cannot Afford to Withhold Stimulus
China Cannot Afford to Withhold Stimulus
Chart 4
Bottom Line: The odds of a re-escalation of the trade war have risen to 40%. American equities should outperform global, while safe-haven assets, such as a portfolio hedge of Swiss bonds and gold, should catch a bid. We are closing out our long copper trade for a loss of 3.58% as well as our long Chinese equities ex-tech trade for a gain of 6.59%. Matt Gertken, Geopolitical Strategist mattg@bcaresearch.com