Emerging Markets

Feature The U.S.-China trade talks have not yet collapsed but they appear to be reaching a “make it or break it” moment. President Donald Trump renewed his threat of heightening tariffs on Chinese imports on May 5, in the interim between two weeks of shuttle diplomacy in Beijing and next in Washington that have been billed as the final round of negotiations. Chinese officials responded to Trump’s new tariff remarks by threatening to pull out of the talks. The status of the Chinese delegation due in Washington this week is unclear as we go to press. Specifically, President Trump has claimed that he would increase the current 10% tariff rate on $200 billion worth of Chinese imports to 25%, a move that was originally due on March 1, but was delayed to extend the talks and seek a better agreement. Trump also threatened to raise tariffs on the remaining $325 billion of Chinese imports that are so far untouched. This is the most significant escalation in rhetoric since before the tariff truce agreed on December 1 between Trump and Chinese President Xi Jinping in Buenos Aires. True, the threat to increase the tariffs is a last-minute pressure tactic tied to the administration’s attempt to make this week “the final week” of the talks. American advisers have said that at the end of these two weeks they would make a recommendation to the president either to sign a deal or walk away. For this reason, it is not certain that Trump will follow through with the increase. However, we consider the threat credible. The costs of trade war are not prohibitive to the U.S. or China considering the strategic interests at stake in their great power competition (Chart 1). And since December 1, we have argued that a relapse into trade war and rising tariffs was a substantial risk at 30% odds; this threat increases those odds. Chart 1The Era Of U.S.-China Detente Is Over
The Era Of U.S.-China Detente Is Over
The Era Of U.S.-China Detente Is Over
Talks have been deteriorating for the past month at least. First, the trade grievances at the root of the trade war with China – namely corporate espionage, hacking, forced technology transfer, intellectual property theft, and the American-allied restrictions on Chinese telecoms firm Huawei – were always going to be extremely difficult to settle. These are apparently weighing on the ability of Washington and Beijing to close an agreement. Second, tensions have recently flared across the entire range of U.S.-China strategic disagreements, including most importantly North Korea and Iran. In late April, the U.S. demanded that China halt all imports of Iranian oil by the end of May in order to avoid secondary sanctions that, in theory, could affect China’s central bank and other banks. Meanwhile North Korea has conducted two minor but provocative weapon tests (including short-range missiles on May 4) since the failed summit between Trump and Kim Jong Un in Hanoi. Washington expects Beijing to keep North Korea in check and involved in diplomacy as part of the broader strategic negotiation. Taiwan and the South China Sea are also simmering due to U.S.-Taiwan diplomacy and arms sales, Chinese military drills, and the U.S. decision to treat China’s “maritime militia” like its navy. Trump’s latest threat reduces the chances of an extension of the talks beyond June to 10%, while raising the odds of a collapse in talks and escalation of trade war to 40%. As a result of these developments, and the dragging on of talks, we put the odds of a trade deal by the end of June at 50% in our April 10 report. Trump’s latest threat reduces the chances of an extension of the talks beyond June to 10%, while raising the odds of a collapse in talks and escalation of trade war to 40% (Table 1). Table 1Updated Trade War Probabilities (May 2019)
U.S. And China Get Cold Feet
U.S. And China Get Cold Feet
From the Chinese point of view, Trump’s threat makes it harder to clinch a deal. Trump’s use of sweeping, unilateral tariffs on national security grounds has forced China into an awkward position. It is politically and ideologically toxic for Beijing to appear to capitulate to coercion, i.e. nineteenth-century-style tactics of gunboat diplomacy and western imperialism. The tariff truce in Buenos Aires minimized the appearance that China is negotiating under duress, giving Xi Jinping the ability to negotiate and make concessions without losing face. While China is in the weaker position economically, and therefore would prefer a deal, it will batten down the hatches and fight a trade war if forced to do so. The risk of other executive decisions disruptive to markets is going up. The implication for investors is threefold. First, the USD and U.S. equities will continue to outperform global counterparts as trade policy uncertainty shoots back up (Chart 2). The American economy is more insulated from global trade and the dollar is counter-cyclical. But as U.S. equities have rallied and volatility will go up, U.S. equities may simply fall less rapidly than Chinese and others. Chart 2U.S. Will Outperform On Rising Trade Uncertainty
U.S. Will Outperform On Rising Trade Uncertainty
U.S. Will Outperform On Rising Trade Uncertainty
Second, our view that China’s economic stimulus will surprise to the upside is reinforced by this development, as Beijing cannot afford to withdraw or pause stimulus when it still faces such a severe external risk to its manufacturing sector and employment (Chart 3). This will counteract the negative impact to global sentiment and manufacturing expected from any additional tariffs, creating more volatility in commodity and emerging market assets. Third, as we recognized in the case of Trump’s renewed “maximum pressure” tactic on Iran, the president is apparently not concerned with minimizing risks to the economy ahead of the 2020 election. His risk appetite remains voracious. Therefore the risk of other executive decisions disruptive to markets is going up. For instance, our 35% chance that Trump will impose Section 232 tariffs on auto and auto part imports, particularly from Europe, is rising toward 50% (Chart 4). Chart 3China Cannot Afford to Withhold Stimulus
China Cannot Afford to Withhold Stimulus
China Cannot Afford to Withhold Stimulus
Chart 4
Bottom Line: The odds of a re-escalation of the trade war have risen to 40%. American equities should outperform global, while safe-haven assets, such as a portfolio hedge of Swiss bonds and gold, should catch a bid. We are closing out our long copper trade for a loss of 3.58% as well as our long Chinese equities ex-tech trade for a gain of 6.59%. Matt Gertken, Geopolitical Strategist mattg@bcaresearch.com
Highlights So What? The Trump administration’s decision to apply maximum pressure to Iran fundamentally changes the investment landscape in 2019-20. Why? The impact of the Iran sanctions on a stand-alone basis can easily be handled given OPEC 2.0’s current spare capacity. However, not only Iranian and Venezuelan oil but also Iraqi oil could be pulled off the market in a full-fledged conflict. Policy-induced volatility and the oil risk premium will rise. Geopolitical tail risks have gotten fatter and the odds of a recession have also increased. Feature What are the Trump administration’s foreign policy objectives? First, to confront the U.S.’s greatest long-term competitor, China, by demanding economic reforms and greater market access. Second, to force a decision-point upon rogue regimes with significant ballistic missile programs and nuclear-weapon aspirations: North Korea and Iran. Third, to maintain credible deterrence in Russia’s periphery. Fourth, to reassert the Monroe Doctrine through regime change in Venezuela. The common thread, even with Russia, is confrontation. It is not necessary for President Trump to pursue all of these objectives at once. So his decision last November to issue waivers for eight importers of Iranian oil suggested to us that he was prioritizing – and becoming more risk averse ahead of the 2020 election. Full enforcement of the oil sanctions at that time threatened to push oil prices up at the same time as the Fed was raising rates, a pernicious combination late in the cycle (Chart 1). Thus, after walking away from the 2015 nuclear accord with Iran, it made sense for Trump to delay any confrontation with Iran until his hoped-for second term in office. He could focus on building the border wall, resolving trade tensions with China, and making peace with North Korea instead. Chart 1Full Sanctions Enforcement Was Too Risky Last November
Full Sanctions Enforcement Was Too Risky Last November
Full Sanctions Enforcement Was Too Risky Last November
Chart 2Sanctions Will Raise Risk
Sanctions Will Raise Risk
Sanctions Will Raise Risk
This view has now been proved wrong. The oil waivers apparently represented only a temporary delay in the administration’s hawkish Iran policy. Now that financial conditions have eased and growth has stabilized, Trump has declared the Iranian Revolutionary Guard Corps a foreign terrorist organization and announced that he will discontinue the waivers, demanding full compliance on energy sanctions from all states by the end of May. Volatility will move higher (Chart 2). Trump is emboldened by America’s newfound energy independence (Chart 3). While the shale boom can be used to reduce U.S. strategic commitments in the Middle East, it can also encourage Washington to believe it is invulnerable to traditional Middle Eastern risks. Trump’s advisers, Secretary of State Mike Pompeo and National Security Adviser John Bolton, apparently have won the Iran policy debate on this basis. Since Trump’s reelection is far from guaranteed, it would appear his advisers view re-imposing sanctions against Iran as a rare opportunity to achieve long-term strategic objectives. They may not have the chance in 2021. Chart 3The U.S. Is Energy Independent
The U.S. Is Energy Independent
The U.S. Is Energy Independent
Chart 4Trump's Reelection At Risk If Oil Spikes
Trump's Reelection At Risk If Oil Spikes
Trump's Reelection At Risk If Oil Spikes
All the same, the problem for Trump is that, while the U.S. will survive any chaos ensuing from an Iran confrontation, his presidency may not. Full enforcement of the sanctions could spiral out of control and, through the oil price channel, come back to hurt Trump’s economy – and hence his re-election odds (Chart 4). The implication is that Trump has either been misled about the risks of his Iran policy, or he does not care as much about his re-election odds as we believed. Either way, the result is aggressive policy, which increases the geopolitical risk premium in oil prices. We can see this in our simulations (below), which are based entirely on spare capacity and compliance by consumers to the sanctions. We did not include an Iran-retaliation scenario in this modeling. Therefore, any threat to Iraqi supplies, or talks of disrupting the Strait of Hormuz will add to our prices forecasts. U.S. Administration Sailing Close To The Wind From their public comments, it would appear the U.S. administration has convinced itself the global oil market can absorb a disruption from the loss of production in Iran and Venezuela. For the Trump administration, this view is supported by growing U.S. shale-oil supplies, and the administration’s belief the Kingdom of Saudi Arabia (KSA) and its Gulf allies stand ready to increase production to cover any losses arising from the re-imposition of Iranian oil-export sanctions by the U.S. This belief supports the administration’s end-game, which appears to be regime change in Iran, a position long favored by Trump’s national security advisor John Bolton. Frank Fannon, U.S. Assistant Secretary of State for Energy Resources, succinctly captured the administration’s view when he declared, “We are doing this ... in a favorable market condition with full commitment from producing countries.” He further stated, “We think this is the right time.”1 We believe the Trump administration is sailing close to the wind here. The U.S. administration has convinced itself the global oil market can absorb a disruption from the loss of oil production in Iran and Venezuela. While increasing U.S. shale output does provide something of a cushion to global oil markets, it is not a substitute for the heavy-sour crude produced by Iran and Venezuela (and others), which is favored by refiners with complex units. The loss of Iranian exports hits these refiners harder than those able to process lighter, sweeter crude of the sort exported by the U.S. (Chart 5).2 As Iranian and Venezuelan barrels are lost to the market, these heavier crudes are getting more scarce relative to the crude produced in U.S. shales – typically classified as West Texas Intermediate (WTI) crude oil. This can be seen in tighter light-versus-heavy crude oil spreads, and the wider Brent-WTI spreads, which indicate WTI is relatively more plentiful (Charts 6A & 6B).
Chart 5
Chart 6AWTI Relatively More Plentiful…
WTI Relatively More Plentiful...
WTI Relatively More Plentiful...
Chart 6B…As Heavier Crudes Become More Scarce
...As Heavier Crudes Become More Scarce
...As Heavier Crudes Become More Scarce
It is true U.S. production continues to grow, which is causing crude oil inventories to increase as sanctions on Iran are being re-imposed. We expect U.S. shale-oil output to grow 1.2mm b/d this year – taking it to a record 8.4mm b/d on average – and 800k b/d next year. Caution is required regarding inventories, however: U.S. refiners are in the thick of their plant maintenance – known as turn-around season – and have loaded a lot of the maintenance they would normally have done in the Fall into Spring. As a result, U.S. refiners are running at reduced rates preparing for the Northern Hemisphere’s summer driving season and the January 1, 2020, implementation of the U.N. IMO 2020 regulations, which will require shippers to use lower-sulfur fuel to power their vessels worldwide.3 OPEC 2.0 Gains Control Of Brent Forward Curve Growing U.S. production and inventories might give the Trump administration comfort the market can absorb the loss of Iran’s exports – some 1.3mm b/d at present. However, our base case holds that Iran’s exports will stabilize at ~ 600k b/d after sanctions fully kick in. In most of the scenarios we run (Table 1), the impact of Iran sanctions on a stand-alone basis can easily be handled given OPEC 2.0’s current spare capacity (Chart 7).4 Indeed, many of the low-probability scenarios we run – including the “maximum pressure” scenario, in which the Trump administration succeeds in removing all of Iran’s exports – can be accommodated by current supply and spare capacity without sending Brent prices through $100/bbl (Chart 8). OPEC 2.0 holds ~ 1.5mm b/d of what we would describe as readily available spare capacity – mostly in KSA – that can be brought to market fairly quickly, as the ramp-up last year ahead of the first round of sanctions in November amply demonstrated. Another 1.5mm b/d or so is held by the Kingdom and its GCC allies, but it would take longer to bring on line. Table 1BCA Oil Market Scenarios
U.S.-Iran: This Means War?
U.S.-Iran: This Means War?
Chart 7OPEC 2.0 Can Handle Iranian Losses
OPEC 2.0 Can Handle Iranian Losses
OPEC 2.0 Can Handle Iranian Losses
Chart 8Brent Unlikely To Surpass $100
Brent Unlikely To Surpass $100
Brent Unlikely To Surpass $100
In reality, once refiners are up and running at max capacity in the U.S. in a few weeks, U.S. inventories will begin to draw hard. This will support what we believe to be OPEC 2.0’s goal of backwardating the Brent curve – perhaps sharply. This will allow it some breathing space to gradually add barrels to the market in 2H19 as needed, as our balances and forecasts assume. It is important to remember OPEC 2.0 was formed to drain the massive storage overhang that resulted from the 2014-16 market-share war launched by KSA. The Kingdom’s energy minister, Khalid al-Falih, is in no hurry to reverse OPEC 2.0’s strategy now. Throughout the ramp to renewed sanctions, he has steadfastly maintained the Kingdom will provide oil as Aramco’s customers need it, following the blind-side hit KSA took from the Trump administration in November when it granted Iran’s largest customers waivers on its export sanctions. U.S. Pressure On OPEC To Raise Output Will Grow We expect the Trump administration to continue to pressure OPEC – the old cartel, not OPEC 2.0 – to boost production post-sanctions. However, it is not entirely clear that this time OPEC’s – particularly KSA’s – interests are 100% aligned with President Trump’s. KSA and other producers were shocked by the administration’s decision to grant waivers after lifting supply sharply in response to Trump’s demands. This time around, we believe OPEC – KSA in particular – will be more cautious lifting output, even as the U.S. Navy very publicly displays its ability to project and sustain force in the Mediterranean and Persian Gulf regions (Map 1). With good reason: The U.S. holds ~ 650mm barrels of oil in its Strategic Petroleum Reserve (SPR), which can be released at a rate of 1mm to 1.3mm b/d for a year or so. Realistically, it is probably more like six to nine months, since, by the time much of the oil has been released to the market the reserves that are left likely will have higher concentrations of contaminants (e.g., metals and solids that migrated to the bottom of the storage while it was sitting idle), making buyers way more leery of using it.
Chart
After the shock of the waivers, KSA likely will minimize its exposure to another surprise from the U.S. as sanctions take hold. The risk to OPEC – KSA in particular – is that Trump again will pull a fast one as the U.S. general election approaches. Given Trump’s demonstrated sensitivity to U.S. gasoline prices approaching elections, it is not unlikely that he would hold on to the SPR barrels until mid to late summer 2020, then release them in time to reduce prices further. If, in the run-up to U.S. elections, OPEC has steadily increased production to build precautionary inventories then it runs a non-trivial risk the crude oil price would once again crash as SPR barrels are released. The Kingdom of Saudi Arabia’s energy minister, Khalid al-Falih, is in no hurry to reverse OPEC 2.0’s strategy now. In this iteration of Iranian export sanctions, we expect KSA to adopt a just-in-time inventory management strategy, so that it is not caught out once again over-supplying the market ahead of a U.S. surprise. U.S. Shales Will Figure Into OPEC 2.0’s Calculus Chart 9U.S. Export Capacity Is Constrained
U.S. Export Capacity Is Constrained
U.S. Export Capacity Is Constrained
The other big fundamental OPEC 2.0 will be considering is the rate at which U.S. shale oil can be exported. Export capacity still is constrained by the shortage of deep-water harbor facilities in the U.S. Gulf. This is being addressed, but it has been slowed by additional requests for environmental impact statements from the federal and state governments. If prices start moving higher because KSA and OPEC 2.0 are responding to tightening markets with caution (and slowly), we’d likely see WTI production increase – it’ll have 2mm b/d of new pipe in the Permian to fill by end-2019 – but that crude could start backing up as storage in the U.S. Gulf fills. This would again widen the Brent vs. WTI - Houston spread, which will benefit refiners in the U.S. Gulf, but will lower prices received by U.S. shale producers (again) (Chart 9). Bottom Line: Trump’s decision not to extend the Iranian oil waivers suggests that he has plenty of risk appetite ahead of the 2020 election. His Iran policy is now the biggest geopolitical risk to the late-cycle bull market. It also risks tightening the oil market considerably as the election approaches. Can Iran’s Regime Withstand The Sanctions? Iran’s economic weakness was an added inducement for the Trump administration to take an aggressive turn. The sanctions against Iran’s crude oil exports have not yet been implemented in full force, but the economy is already showing signs of distress. For one, inflation is back near 40% – levels only reached during the previous round of sanctions (Chart 10). Given that food, beverages, and transportation are among the sectors experiencing the fastest growing prices, lower income groups – which the World Bank estimates spend almost half their income on food alone – will suffer disproportionately. Economic dissatisfaction has catalyzed protests in Iran in the past, and the squeeze from the U.S. sanctions could propel further unrest. Chart 10Iran's Economy Already Showing Signs Of Distress
Iran's Economy Already Showing Signs Of Distress
Iran's Economy Already Showing Signs Of Distress
Chart 11
Moreover, soaring prices are coinciding with a slowdown in activity and consumption. On the surface Iran appears relatively well protected given that its economy is not as directly correlated with oil exports as some of its peers (Chart 11). However, Iran’s oil and non-oil sectors are actually closely intertwined. This is evident from weakness in the non-oil sector during the previous round of sanctions (Chart 12). The IMF expects the economy to contract by 6% this year – faster than its 3.9% estimate for last year – leaving Iranians to face a period of deepening stagflation.
Chart 12
The jump in consumer prices is a reflection of the ongoing collapse of the currency. Despite the government’s best efforts to stabilize the foreign exchange market, heightened demand for foreign currencies caused a nearly 30% depreciation in the unofficial exchange rate vis-à-vis the U.S. dollar since the beginning of the year (Chart 13). Chart 13Unofficial Exchange Rate Continues To Weaken
Unofficial Exchange Rate Continues To Weaken
Unofficial Exchange Rate Continues To Weaken
Chart 14Debt Burden Is Manageable
Debt Burden Is Manageable
Debt Burden Is Manageable
To soften the impact of the weaker currency and the potential shortage of essential goods, authorities have introduced a three-tier exchange rate system, and banned the export of several products including grains and seeds, powdered milk, butter, and tea. Since the level of external debt remains manageable (Chart 14) the weak currency will pressure the economy through its impact on prices (highlighted above), with imported inflation eroding purchasing power. Furthermore, Iran will not benefit from any additional export competitiveness due to currency depreciation. The current account surplus is expected to deteriorate and eventually flip to a deficit amidst weak exports, and despite declining imports (Chart 15). The fact that Iran runs a non-energy trade deficit does not help. Chart 15Trade Surplus At Risk
Trade Surplus At Risk
Trade Surplus At Risk
Chart 16Rising Budget Deficit Is A Constraint
Rising Budget Deficit Is A Constraint
Rising Budget Deficit Is A Constraint
In terms of the fiscal purse, under normal circumstances, a weaker rial would raise government revenue from oil exports. However, given the restrictions on oil exports, the fiscal budget will not benefit from this relationship. Instead, the dominant impact will be greater government spending. Historically, expenditures tend to be countercyclical, aiming to mitigate the impact of the deteriorating economic environment on Iranian households (Chart 16). In the past, the Iranian government’s healthy fiscal balance allowed policymakers to implement social protection schemes to combat poverty and revitalize the economy. Now, however, the fiscal coffers are no longer so well-cushioned and the deficit will constrain this option. Stimulative fiscal policy in this environment would only raise inflation further. Furthermore, given that the lion’s share of Iran’s imports are capital and intermediate goods, the currency depreciation will spill over into the domestic industry and weaken demand, even for domestically produced goods. Investments have been lacking in many of the most essential services. The electricity sector is a prime example: while demand is rising, spare capacity is dwindling and causing recurring outages. Similarly, foreign direct investment will likely fall in this uncertain political environment. With the economy on the brink, Iran is not in a position to confront the United States directly. It must take total sanctions enforcement as a very grave risk and seek delaying actions and negotiations. However, this vulnerability will turn into desperation if the Trump administration proceeds with a full embargo without any “off ramp” for negotiations. Bottom Line: Full enforcement of sanctions threatens to destabilize Iran’s already vulnerable economy. Inflation is soaring, the currency is plunging, and the economy will likely be plagued by a twin deficit going forward. The implication is that Iran will eschew direct confrontation unless forced. Will Iran Retaliate In Iraq? Iran is also at risk of losing one of its great sources of leverage: Iraqi stability. Given its gloomy economic outlook, Iran is looking to expand ties with its neighbors in an attempt to soften the blow from the sanctions. Earlier this year president Hassan Rouhani and Iraqi prime minister Adel Abdul Mahdi signed several preliminary trade deals, with the ultimate aim to boost bilateral trade to $20 billion from its current ~$12 billion. However, natural gas exports to Iraq – a major traded good – are covered by the sanctions, so this target is probably unattainable. Although Iran is currently the only foreign supplier of natural gas and electricity to Iraq, the temporary halt in electricity supplies last summer coincided with violent protests in Southern Iraq.5 Growing anger over Iran’s inability to satisfy its commitments to Iraq highlights the tensions in the Iraq-Iran relationship. What’s more, the U.S. is pressuring Iraq to turn to other neighbors such as Saudi Arabia, Jordan, and Kuwait for its electricity needs.6 In March, it renewed a three-month waiver allowing Iraq to import Iranian gas. Then Saudi Arabia promised to connect Iraq to the Saudi electricity grid during a visit by its economic delegation to Baghdad on April 4.7 At that meeting, the Saudi delegation also agreed to provide Iraq with $1 billion in loans, $500 million to boost exports, and a sporting complex as a gift. Additionally, the Saudi consulate in Baghdad – which had been closed for almost 3 decades – reopened last month. Saudi Arabia and Iraq are starting to cooperate. Iraq’s new government is clearly taking a pragmatic approach to its regional relationships. This is also largely in line with growing domestic opposition to Iranian interference within Iraq. Influential Shia leaders such as Muqtada al-Sadr and Ayatollah Ali al-Sistani have been voicing concerns about Iran’s influence in Iraqi politics. As such, the new Iraqi government is attempting to walk a tight rope between placating Iran and taking advantage of new opportunities with its Arab neighbors to rebuild its economy. This trend raises the risk that Iran will strike rapidly in Iraq if it believes Trump’s maximum pressure strategy is succeeding in bringing oil exports to zero. Iraq is the logical target as Iran has great political and sectarian influence there, it is the geographic buffer with Saudi Arabia, and it is the necessary launchpad for Iran’s strategic opponents to undermine or attack the Iranian regime (Map 2).
Chart
Thus, not only Iranian and Venezuelan oil but also Iraqi oil could be pulled off the market in a fullfledged conflict.
Chart 17
Thus, not only Iranian and Venezuelan oil but also Iraqi oil could be pulled off the market in a full-fledged conflict. About 85% of Iraq’s crude exports flow through the southern port city of Basra (Chart 17). It is already home to recurrent protests and any disruptions there threaten around 3.5mm bbl shipping to international markets daily. Bottom Line: Iraq is caught in the strategic tug-of-war between Iran and Saudi Arabia, with the latter gaining influence at present. Sanctions could compel Iran to retaliate in Iraq, jeopardizing up to 3.5mm b/d of supply. What Comes Next? The latest data suggest that Japan is in full compliance with the U.S. sanctions against Iran as of April and that China has been front-running the sanctions and is now reducing imports, as it was at the time the waivers were first introduced. China may not go to zero, but it is apparently complying. This is important given that the Trump administration has essentially introduced a bold new demand – cut off all energy imports from Iran – at the eleventh hour of the U.S.-China trade negotiations. Our projections of spare capacity suggest that the Trump administration will believe it has room to enforce the sanctions fully (Chart 18). This is a risky approach, as a fairly standard unplanned outage anywhere else in the world could bring spare capacity much lower, but the data suggest that Trump’s team will not see it as a hard constraint. If necessary, the administration can later choose to soft-pedal enforcement on black market activity so as to calibrate the global impact.
Chart 18
The Iranians, for their part, are unlikely to leap to the most aggressive forms of retaliation immediately – such as fomenting unrest in Iraq – because of their economic vulnerability. Small acts of sabotage or subversion are a way to send the U.S. a warning signal, but generally Iran will want to signal defiance while shifting the emphasis to negotiations. Hence it will primarily retaliate through diplomatic actions and calculated displays of force. A limited response enables Iran to appear innocent, divide the U.S. and EU, and thus isolate the U.S. over its belligerent policies. Previously, Trump has sought to negotiate with Iranian President Hassan Rouhani. The Iranians have so far rebuffed him, but Foreign Minister Mohammad Zarif’s initial response to the waiver announcement was to blame Trump’s advisers, instead of Trump himself, and offer an exchange of prisoners (And release of detained Americans happen to be one of the Trump administration’s key demands – see Table 2.) Negotiations could begin through back channels and an uneasy period of tensions could thus ensue without a full-blown war. Table 2Trump Administration’s 12 Demands On Iran
U.S.-Iran: This Means War?
U.S.-Iran: This Means War?
The problem is that negotiations cannot work if Trump fully and immediately enforces the sanctions without offering Iran an “off ramp.” If the administration backs Iran into a corner it will have no option but to strike out forcefully. Negotiations also cannot work if Iran joins the U.S. in withdrawing from the 2015 deal and reactivating its nuclear program, specifically the suspected military dimensions of that program. This would force Trump to respond (Diagram 1). Diagram 1Iran-U.S. Tensions Decision Tree
U.S.-Iran: This Means War?
U.S.-Iran: This Means War?
In short, a period of “fire and fury” is about to ensue between Trump and Rouhani. It will be even more uncertain and disruptive than the summer 2017 showdown between Trump and Kim Jong Un of North Korea (Chart 19), which drove a 35 bps decline in the 10-year Treasury yield. Chart 19Upcoming "Fire And Fury" Will Be More Disruptive Than 2017 Trump-Kim Showdown
Upcoming "Fire And Fury" Will Be More Disruptive Than 2017 Trump-Jong Un Showdown
Upcoming "Fire And Fury" Will Be More Disruptive Than 2017 Trump-Jong Un Showdown
There is a pathway for Trump’s pressure tactics to succeed: Iran is vulnerable and the United States and its allies are in a position of relative strength in terms of global oil supply. Therefore, it is possible that Trump could fully enforce the sanctions and yet avoid any uncontrollable crisis or oil shock. However, this pathway, at a subjective 26% probability, is less likely than the combined 48% probability of the alternatives: either escalation short of war, or ultimatums leading to Middle Eastern instability and much higher odds of war. Bottom Line: The geopolitical risk of U.S.-Iran confrontation is not contained. But we do not expect Iran to overreact unless Trump plows forward with full and immediate sanctions enforcement and offers no realistic “off ramp” for negotiations. At that point Iranian retaliation will be concrete and escalation could spiral out of control. Investors should keep in mind that Iran is not North Korea. Unlike the hermit kingdom, Iran has the ability to retaliate with a number of different levers. Indeed, it has threatened to shut the Strait of Hormuz in the past, and could, at the limit, be backed into that corner. While the risk of this is extremely low, should it occur the consequences would be huge – close to 20% of the world’s daily oil supply passes through the Strait daily. Indeed, just this week Iran’s Oil Minister Bijan Zanganeh again threatened to take action against any OPEC member working against its interests. Following a meeting with the Cartel’s president, he is reported to have said, “Iran is a member of OPEC because of its interests, and if other members of OPEC seek to threaten Iran or endanger its interests, Iran will not remain silent.”8 Investment Conclusions The Trump administration’s decision to apply maximum pressure to Iran is a significant and unexpected injection of geopolitical risk that we believe fundamentally changes the investment landscape in 2019-20. While our base case is that the U.S. will enforce the oil sanctions gradually and in such a way as to avoid causing an oil shock, policy-induced volatility and the oil risk premium will rise. Geopolitical tail risks have gotten fatter and the odds of a recession have also increased. Robert P. Ryan, Chief Commodity & Energy Strategist rryan@bcaresearch.com Matt Gertken, Geopolitical Strategist mattg@bcaresearch.com Roukaya Ibrahim, Editor/Strategist roukayai@bcaresearch.com Footnotes 1 Please see Humeyra Pamuk and Timothy Gardner, “How Trump’s hawkish advisors won debate on Iran oil sanctions,” Reuters, May 1, 2019, available at reuters.com. 2 Heavy-sour crudes are those with low API gravity (a measure of how easily a crude flows) and higher sulfur content. Light-sweet crudes have higher API gravity and lower sulfur content. 3 Please see BCA Commodity & Energy Strategy Weekly Report, “IMO 2020: The Greening Of The Ship-Fuel Market,” February 28, 2019, available at ces.bcaresearch.com. 4 OPEC 2.0 is the name we coined for the producer coalition led by KSA and Russia, which was formed in 2016 to manage global crude oil output. Its goal is to drain the massive storage overhang caused by the market-share war launched by KSA in 2014. 5 Iran cited dissatisfaction with Iraq over the accumulation of unpaid bills as the cause of the halt in electricity exports to Iraq. This prompted Iraqi authorities – under pressure from domestic unrest – to send a delegation to Saudi Arabia in attempt to negotiate an electricity agreement. 6 Please see Edward Wong, “Trump Pushes Iraq to Stop Buying Energy From Iran,” The New York Times, February 11, 2019, available at nytimes.com. 7 Please see Geneive Abdo and Firas Maksad, “Iraq’s Place in the Saudi Arabian-Iranian Rivalry,” The National Interest, April 15, 2019, available at nationalinterest.org. 8 Please see Babk Dehghanpisheh, “Iran will respond if OPEC members threaten its interests: oil minister,” Reuters, May 2, 2019, available at reuters.com. Investment Views and Themes Recommendations Strategic Recommendations Tactical Trades TRADE RECOMMENDATION PERFORMANCE IN 2019 Q1
Image
Commodity Prices and Plays Reference Table Trades Closed in 2019 Summary of Closed Trades
Image
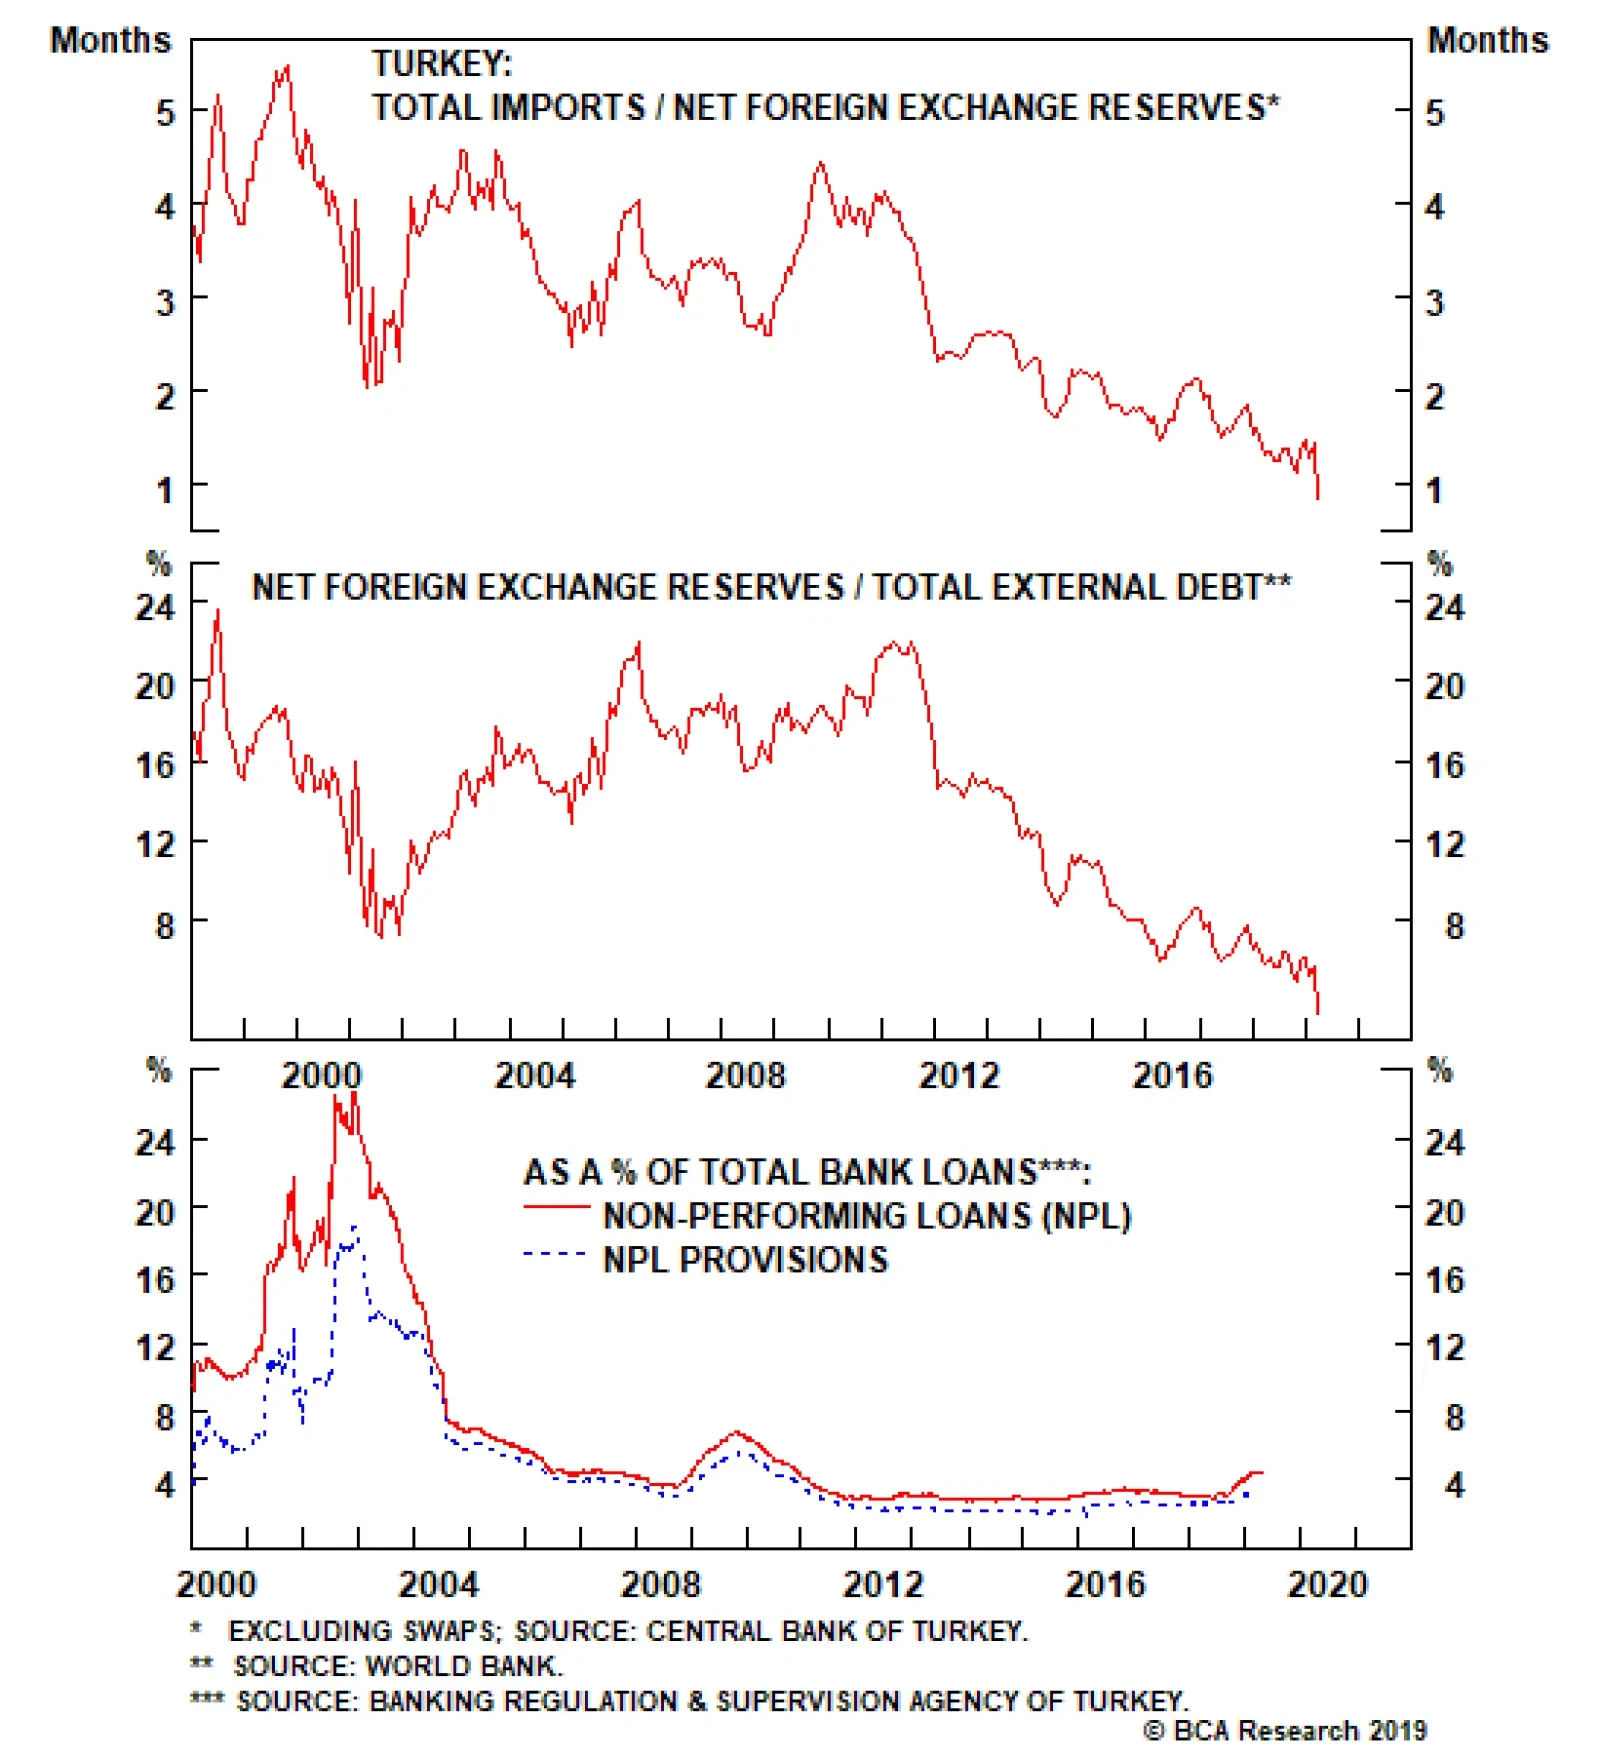
The recent plunge in the central bank’s net foreign exchange reserves excluding swaps (i.e. net international reserves) has put many pertinent metrics at record lows. In particular, net international reserves are at a precarious level relative to both total…
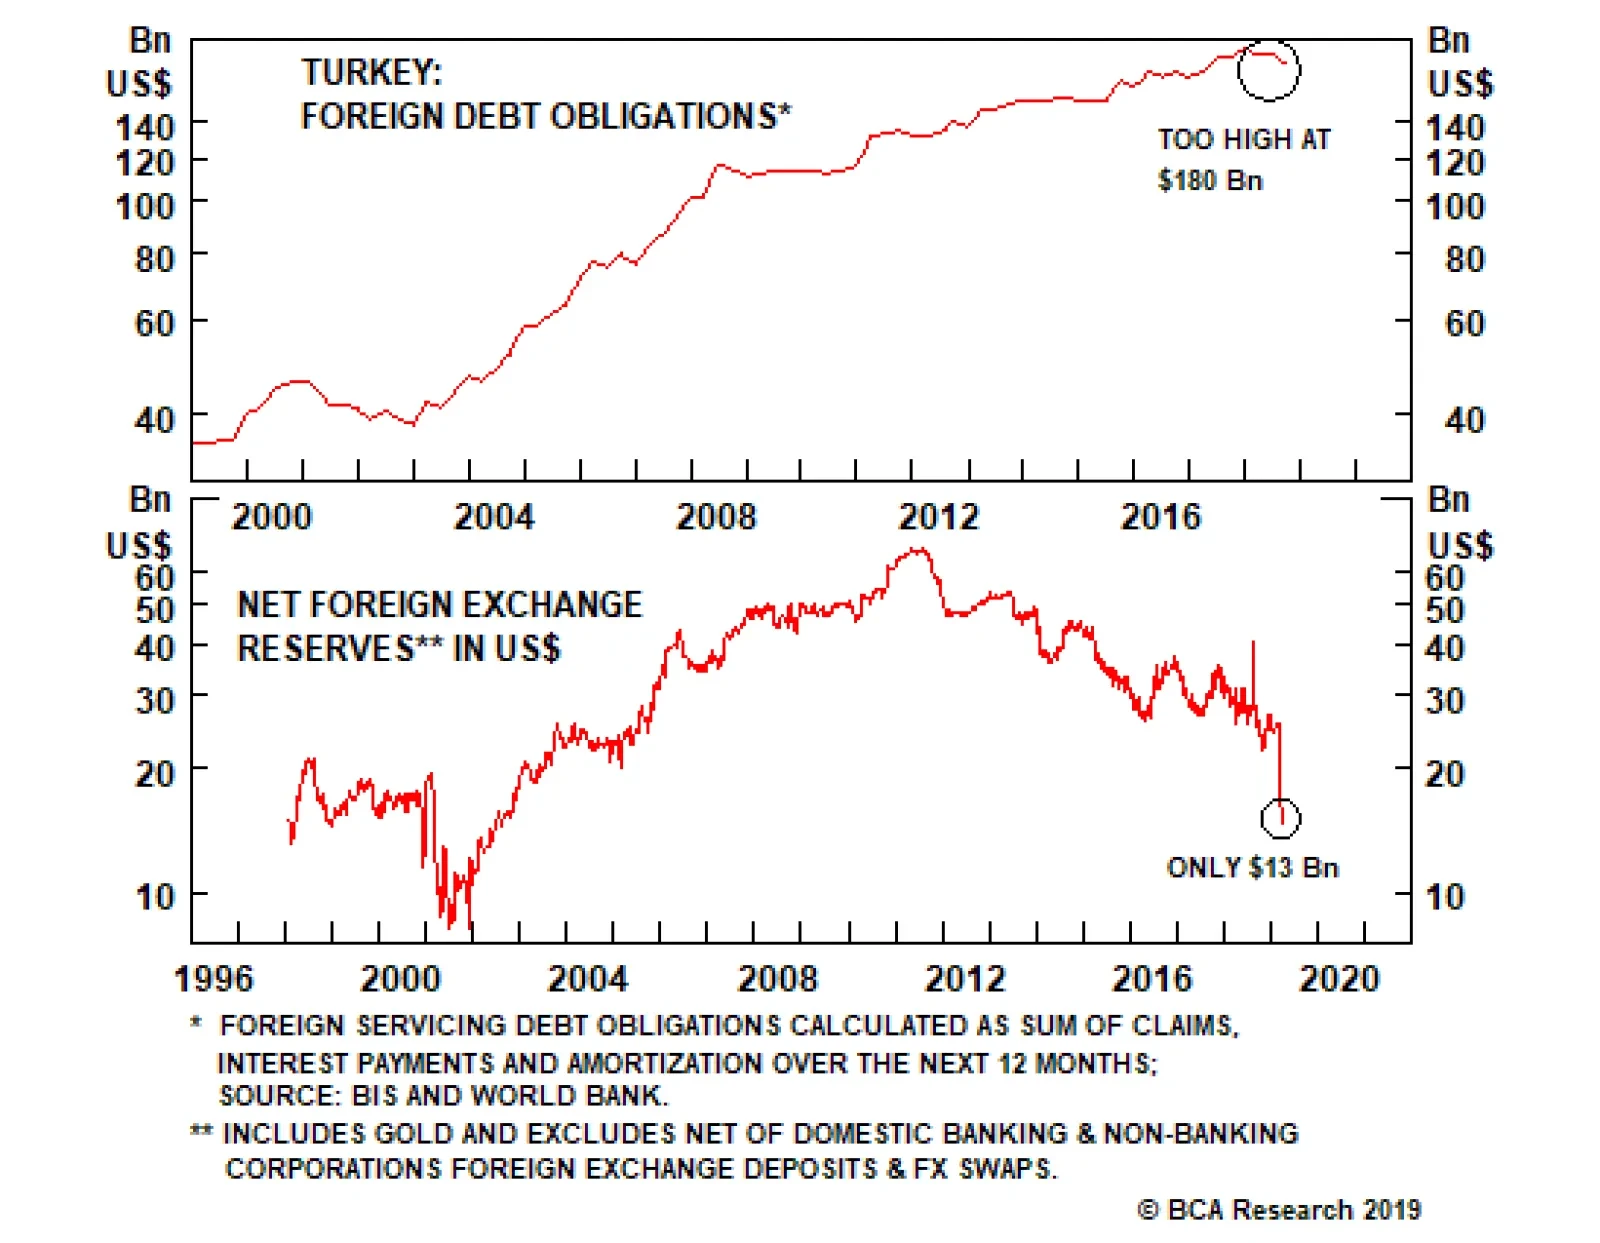
The key imbalance remains the gap between foreign debt obligations (FDOs) and the availability of foreign currency to meet these debt obligations. Turkey’s FDOs in 2019 are equivalent to $180 billion. FDOs measure the sum of short-term claims, interest…
Highlights In Indonesia, investors are ignoring the weakness in global growth, which is an important driver of the country’s financial markets. The Indonesian currency, equities and local currency bonds all remain vulnerable. We continue to recommend underweighting Indonesian assets for now. In Turkey, additional adjustments in the exchange rate and interest rates are unavoidable. Stay put/underweight Turkish financial markets. In the UAE, the economy is set to improve marginally this year. We recommend overweighting UAE equities and corporate spreads within their respective EM portfolios. Feature Indonesia: The Currency And Bank Stocks Are At Risk Indonesian financial assets have benefited from the Federal Reserve’s dovish turn and corresponding fall in U.S. bond yields (Chart I-1, top panel). Moreover, the market is cheering President Joko Widodo’s lead in the presidential vote tally. Yet investors are ignoring the budding weakness in industrial metals prices, which has historically been an important driver of Indonesia’s exchange rate (Chart I-1, middle panel). Going forward, the Indonesian currency, equities and local currency bonds all remain vulnerable: Falling global growth in general and Chinese imports in particular will intensify Indonesia’s exports contraction and worsen the country’s already wide current account deficit. In turn, the latter will induce currency depreciation, which will then lead to higher interbank rates (Chart I-2). Chart I-1Global Growth Matters For Indonesian Markets
Global Growth Matters For Indonesian Markets
Global Growth Matters For Indonesian Markets
Chart I-2Falling Current Account Deficit = Higher Local Rates
Falling Current Account Deficit = Higher Local Rates
Falling Current Account Deficit = Higher Local Rates
Upward pressure on local interbank rates will cause a slowdown in domestic private loan growth. The Indonesian central bank – Bank Indonesia (BI) – has been attempting to lower interbank rates, which have been hovering above the central bank's policy rate (Chart I-3). To achieve this, the central bank has substantially increased excess reserves in the banking system (Chart I-4). It has done so by purchasing central bank certificates from commercial banks, conducting foreign exchange swaps and providing repo lending. Chart I-3A Sign Of Liquidity Strains
A Sign Of Liquidity Strains
A Sign Of Liquidity Strains
Chart I-4Bank Indonesia Is Injecting Liquidity
Bank Indonesia Is Injecting Liquidity
Bank Indonesia Is Injecting Liquidity
Yet by expanding banking system liquidity so aggressively, BI risks renewed currency depreciation. Like any central bank in a country with an open capital account, BI cannot expect to have full control over the exchange rate while simultaneously targeting local interest rates. The Impossibly Trinity dilemma dictates that a central bank needs to choose between controlling the two. Yet investors are ignoring the budding weakness in industrial metals prices, which has historically been an important driver of Indonesia’s exchange rate. Therefore, if BI continues to inject local currency liquidity to cap or bring down interest rates (interbank rates), the resulting excess liquidity could encourage and facilitate speculation against the rupiah. Scratching below the surface, the recent strong outperformance of Indonesian equities has been entirely due to the surge in the country’s bank share prices (Chart I-5, top panel). Remarkably, the performance of Indonesian non-financial as well as small-cap stocks has been especially dismal (Chart I-5, middle and bottom panels). This is an upshot of poor profitability among Indonesia’s non-financial listed companies (Chart I-6). Chart I-5Indonesian Bank Stocks Are The Only Outperformers
Indonesian Bank Stocks Are The Only Outperformers
Indonesian Bank Stocks Are The Only Outperformers
Chart I-6Falling Non-Financial Corporate Profitability
Falling Non-Financial Corporate Profitability
Falling Non-Financial Corporate Profitability
Furthermore, deteriorating financial health of non-financial corporates, especially small companies, will lead to higher NPLs on banks’ books. Notably, Indonesian banks are more heavily exposed to businesses than to households. As NPLs rise anew, Indonesian commercial banks will need to lift their bad-loan provisioning levels, generating a major profit relapse (Chart I-7). Importantly, Indonesian commercial banks have been boosting their profits by reducing NPL provisions since early 2018. Reversing this will materially affect their earnings. Chart I-7Indonesian Bank Share Prices Are Vulnerable
Indonesian Bank Share Prices Are Vulnerable
Indonesian Bank Share Prices Are Vulnerable
Additionally, bank stocks are vulnerable due to falling net interest income margins. Moreover, their share prices are overbought and not cheap. To be clear, we are not negative on Indonesia’s structural outlook. The above-mentioned alarms are more near-to-medium terms issues. Still, foreign ownership of local currency bonds and stocks – at 38% each – are high, and could be a major source of potential outflows if the rupiah depreciates. This would cause Indonesian stocks and local currency bonds to sell off severely. Bottom Line: The global growth slowdown/commodities downturn and the U.S. dollar upturn are not yet over. Consequently, foreign flows into EM will diminish, which will be particularly negative for Indonesian financial markets. We recommend investors continue underweighting Indonesian equities and avoid Indonesian local currency bonds for now. We continue to recommend a short position in the IDR versus USD. Ayman Kawtharani, Associate Editor ayman@bcaresearch.com Turkey’s Foreign Debt Bubble: The Worst Is Not Yet Behind Us Turkish financial assets, and the currency especially, will remain under selling pressure in the coming months. Additional adjustments in the exchange rate and interest rates - as well as in the real economy and current account balance - appear unavoidable. The key imbalance remains the gap between foreign debt obligations (FDOs) and the availability of foreign currency to meet these debt obligations. Turkey’s FDOs in 2019 are equivalent to $180 billion (Chart II-1). FDOs measure the sum of short-term claims, interest payments and amortization over the next 12 months. This consists of $15 billion in interest payments, $65 billion in debt amortization and $100 billion in maturing short-term (under one year) claims. In theory, these debt obligations can either be rolled over, or the nation should generate current account and capital account surpluses and use these surpluses to pay down FDOs. Even though the current account deficit is shrinking, it is still in a deficit of $18 billion. Net FDI inflows remain weak at US$10 billion. Hence, it appears that Turkey’s only options are either to roll over maturing foreign currency debt or to lure foreign investors into local currency assets and use the surplus in net portfolio inflows to meet these FDOs. The central bank’s foreign currency reserves excluding both commercial banks’ deposits at the Central Bank of Turkey and FX swaps now stand at $13 billion. However, due to a lack of credibility in the Turkish government’s macro policies - in addition to the ongoing deep economic recession and heightened financial market volatility - external creditors will be unwilling to roll over the debt. In fact, net portfolio flows into government debt and equities have tumbled for the same reason. Typically, when foreign funding dries up temporarily, a country can use its foreign exchange reserves to meet its FDOs. However, Turkey’s foreign exchange reserves have already plummeted to extremely low levels (Chart II-2). The central bank’s foreign currency reserves excluding both commercial banks’ deposits at the Central Bank of Turkey and FX swaps now stand at $13 billion. This is negligible compared with the $180 billion FDO figure due in 2019. Chart II-1Turkey: A Large Foreign Debt Servicing Burden
Turkey: A Large Foreign Debt Servicing Burden
Turkey: A Large Foreign Debt Servicing Burden
Chart II-2Foreign Exchange Reserves Are Too Small
Foreign Exchange Reserves Are Too Small
Foreign Exchange Reserves Are Too Small
The recent plunge in the central bank’s net foreign exchange reserves excluding swaps (i.e. net international reserves) has put many pertinent metrics at record lows. In particular, net international reserves are at a precarious level relative to both total imports and external debt (Chart II-3). Finally, the net international reserves-to-broad money supply ratio has fallen to 7% (from 15% in 2014) despite the fact that the massive lira depreciation reduced the U.S. dollar measure of broad money supply (Chart II-4). Chart II-3FX Reserves Do Not Cover Imports Or External Debt
FX Reserves Do Not Cover Imports Or External Debt
FX Reserves Do Not Cover Imports Or External Debt
Chart II-4Low Coverage Of Broad Money By International Reserves
Low Coverage Of Broad Money By International Reserves
Low Coverage Of Broad Money By International Reserves
The currency will have to depreciate further and interest rates will have to move higher to shrink domestic demand/imports more. This is needed to generate a current account surplus that could be used to service FDOs, or that otherwise entices foreign creditors to be willing to roll over foreign debt or invest in Turkey. Finally, while the adjustment in the real economy is advanced, it is unlikely to be over, due to the large foreign debt bubble. Importantly, with large foreign and local currency debt obligations coming due for both companies and households - in addition to the deterioration in economic activity and higher interest rates - NPLs are bound to rise (Chart II-5). This is especially likely to occur because a lot of borrowing has been used in the property market both for construction and purchases. Notably, real estate volumes are shrinking, and prices are deflating in real terms (Chart II-6). Chart II-5NPLs Will Rise A Lot
NPLs Will Rise A Lot
NPLs Will Rise A Lot
Chart II-6Turkey: Real Estate Is In Free Fall
Turkey: Real Estate Is In Free Fall
Turkey: Real Estate Is In Free Fall
Bottom Line: The macro adjustment in Turkey is not yet complete. The country still lacks foreign currency supply to service its enormous 2019 FDOs. Further currency depreciation and higher interest rates are required to depress domestic demand/imports and push the current account into surplus. Stay put / underweight Turkish financial markets. The authorities are becoming desperate, and the odds of capital control enforcement are not negligible. While such an outcome is not possible to forecast with any certainty or time frame, investors should consider this very real risk. Andrija Vesic, Research Analyst andrijav@bcaresearch.com Overweight UAE Equities And Corporate Bonds Over the next six to nine months, we believe both UAE equities and corporate spreads will outperform their respective emerging market (EM) benchmarks. The UAE economy is set to improve marginally this year (Chart III-1). It will benefit from expansionary fiscal policy, rising oil output, a buoyant tourism sector, a resilient banking sector and less of a drag from the real estate sector. First, sizable fiscal spending will lead to rising non-oil economic growth. The UAE’s federal budget spending for 2019 will increase by 17.3% from a year ago, much higher than the 5.5% year-on-year growth in 2018. Second, UAE oil output could increase by 15% later this year from current levels (Chart III-2). The U.S. announced on April 22 that all Iran sanction waivers will not be extended beyond the early-May expiration date. The U.S. administration also stated that it has secured pledges from Saudi Arabia and the UAE to increase their oil production in order to offset disrupted supply from Iran. Rising oil output will mitigate the negative impact of potentially lower oil prices on the UAE’s economy. Chart III-1Improving UAE Economy
Improving UAE Economy
Improving UAE Economy
Chart III-2Rising Oil Output
Rising Oil Output
Rising Oil Output
Third, the outlook for the tourism sector is also positive. The number of tourists is set to rise as Expo 2020 approaches. The government is targeting 20 million visitors in 2020, 26% higher than last year’s levels. The UAE is building theme parks, museums, hotels and infrastructure to attract more tourists. The UAE economy is set to improve marginally this year. Fourth, the UAE’s banking sector will enjoy rising credit growth, robust profitability and improved asset quality this year. The banking system has been in consolidation mode since January 2016, with a 15% reduction in branches and a 14% drop in the number of employees. This has improved the banking sector’s profitability by cutting operating costs and increasing efficiency. The improving growth outlook will lift credit growth. The central bank’s most recent Credit Sentiment Survey suggests banks’ lending standards for both business and personal loans are loosening (Chart III-3). In addition, UAE banks enjoy large capital buffers. Despite rising non-performing loans (Chart III-4), UAE banks still reported a Tier-1 capital adequacy ratio of 17% as of December 2018. Chart III-3Credit Growth Is Likely To Increase
Credit Growth Is Likely To Increase
Credit Growth Is Likely To Increase
Chart III-4Rising NPLs, But Still Large Capital Buffers
Rising NPLs, But Still Large Capital Buffers
Rising NPLs, But Still Large Capital Buffers
Lastly, the real estate markets in both Dubai and Abu Dhabi have suffered from oversupply (from both mushrooming supply and weaker demand) over the past several years. Property prices have already fallen over 20% in both Dubai and Abu Dhabi from their 2014 peaks (Chart III-5). Odds are high that the most dangerous phase of the property market downturn is behind us. Chart III-5Real Estate Adjustment Is Advanced
Real Estate Adjustment Is Advanced
Real Estate Adjustment Is Advanced
In addition, the government’s efforts to attract people to stay in the country longer will somewhat offset the ongoing exodus of expatriates. Last May, the UAE introduced a new visa system that will allow investors, innovators and talented specialists in the medical, scientific, research and technical fields to stay in the country for up to 10 years. Overall, a potential bottom in property demand and restrained supply will likely make the real estate sector less of a drag on this bourse this year. Finally, the authorities are also more open to increasing the foreign ownership cap in the banking sector, albeit not up to 100%. For example, in early April, the largest UAE lender – First Abu Dhabi Bank – obtained regulatory approval to increase its foreign ownership limit to 40% from 25%. This has boosted foreign equity purchases and has supported the equity index. Bottom Line: We recommend an overweight position in UAE equities within an EM portfolio this year (Chart III-6). For fixed income investors, we recommend overweighting UAE corporate credit in an EM corporate credit portfolio. UAE corporate credit is a lower beta market and will outperform as EM corporate spreads widen (Chart III-7). Most UAE-dollar corporate bonds have been issued by banks. Banks in the UAE do not suffer from structural overhangs, and the cyclical downturn in the property market is well advanced. This is why they have been, and will remain, a lower beta sector within an EM corporate credit portfolio. Chart III-6Overweight UAE Equities Within An EM Portfolio
Overweight UAE Equities Within An EM Portfolio
Overweight UAE Equities Within An EM Portfolio
Chart III-7UAE Corporate Credit Will Likely Outperform EM Benchmark
UAE Corporate Credit Will Likely Outperform EM Benchmark
UAE Corporate Credit Will Likely Outperform EM Benchmark
Ellen JingYuan He, Associate Vice President ellenj@bcaresearch.com Footnotes Equity Recommendations Fixed-Income, Credit And Currency Recommendations
Highlights The March data brought the first signs of a stabilization in China’s “hard” economic data, albeit from a weak level. The April PMIs disappointed, but they remained in expansionary territory; this is in addition to a continued significant improvement in the trade-related subcomponents of the official survey. Chinese credit growth is unlikely to relapse over the coming year, despite recent investor concerns that Chinese policymakers may dial back their stimulus efforts. The pace of growth may moderate, but halting the uptrend in growth this year would constitute a major policy mistake that we do not expect. Chinese stocks may trend flat-to-down in the very near term as investors await a signed trade deal with the U.S. and further signs of a recovery in activity. Over the next 6-12 months, however, an overweight stance is warranted, barring a major relapse in our leading indicator. Feature Tables 1 and 2 on pages 2 and 3 highlight key developments in China’s economy and its financial markets over the past month. On the growth front, March’s data brought the very first (albeit modest) signs of stabilization in actual Chinese economic activity. While the April manufacturing PMIs released earlier this week disappointed, the trade related components of the official survey continued to improve meaningfully, which implies that an improvement in domestic demand is still early. This conclusion is not particularly surprising given that the first green shoots in the actual data are emerging from a depressed level of activity. Credit growth has only recently picked up, implying that actual activity will strengthen over the coming 6-12 months followed a signed trade deal and a continued (modest) uptrend in credit. Table 1China Macro Data Summary
China Macro And Market Review
China Macro And Market Review
Table 2China Financial Market Performance Summary
China Macro And Market Review
China Macro And Market Review
Within financial markets, the most significant recent development has been that Chinese stocks have sagged somewhat due to concerns that policymakers may meaningfully dial back their stimulus efforts over the coming year. In our view, recent statements from policymakers, as well as the fact that the recovery in activity is only now beginning, underscores that credit growth is unlikely to relapse over the coming year. It may not grow at the breakneck pace observed in the first quarter, but beyond the near-term jitters that this may introduce into the equity market, we do not see it as a threat to an overweight stance towards Chinese stocks over the coming 6-12 months. In reference to Tables 1 and 2, we provide below several detailed observations concerning developments in China’s macro and financial market data: Chart 1 highlights that March brought the first sign of a stabilization in actual Chinese economic activity. When measured on a smoothed basis, the Li Keqiang index itself weakened further in March, but total import growth moved sideways and nominal manufacturing output ticked higher. We noted in our last Macro & Market review that future changes in activity measures were now more likely to reflect actual changes in underlying economic circumstances given that the previously beneficial tariff front-running effect had probably washed out of the data. March’s data confirms this view, and underscores that activity will pickup in the second half of the year. Chart 1The First (Albeit Tentative) Sign Of Economic Stabilization
The First (Albeit Tentative) Sign Of Economic Stabilization
The First (Albeit Tentative) Sign Of Economic Stabilization
Chart 2 shows that the uptrend in our leading indicator for Chinese economic activity is so far modest, but also that it is now at a 2-year high relative to its 12-month moving average. The indicator is being weighed-down by weak money growth (M2 and our definition of M3), even though monetary conditions remain easy and our measures of credit growth picked up sharply in Q1. We doubt that the trend in Chinese money and credit growth can sustainably decouple in a scenario where the latter is sustainably improving, as it would imply that all of the credit improvement was originating from non-bank financial institutions. As such, we expect money growth to catch up to credit growth in the coming months. The annual change in the PBOC’s pledged supplementary lending injection remained in negative territory in March, and both floor space started and sold decelerated modestly further. Construction and sales activity continue to diverge, with the latter still pointing to a further slowdown in the former. We will be updating our Chinese housing outlook in a Special Report next week. April’s Caixin and official manufacturing PMI disappointed, but this overshadowed a continued significant improvement in the new export orders and import components of the official PMI (Chart 3). In our view, this is consistent with a stabilization in the export outlook, but implies that Chinese domestically-oriented manufacturing activity is not yet booming. Nonetheless, a signed trade deal, improving importer/exporter sentiment, and an uptrend in credit growth still implies that activity will pick up meaningfully later in the year. Chart 2Our Leading Indicator Is Now Modestly Trending Higher
Our Leading Indicator Is Now Modestly Trending Higher
Our Leading Indicator Is Now Modestly Trending Higher
Chart 3Trade-Related Components Of The Official PMI Continue To Rise
Trade-Related Components Of The Official PMI Continue To Rise
Trade-Related Components Of The Official PMI Continue To Rise
Over the past month, Taiwanese and domestic Chinese stocks have been the best performers within “Greater China”, relative to the MSCI Hong Kong index, the MSCI China index, and the Hang Seng China Enterprises index. The latter in particular has lagged other Chinese equity indexes since late-March (Chart 4), and may be due for a catch-up. Over the nearer-term, Chinese stocks, especially the domestic market, have sagged due to concerns that Chinese policymakers may meaningfully dial back their stimulus efforts over the coming year. We discussed this risk in our April 17thWeekly Report,1 and noted that while we expected credit growth to moderate somewhat, a more meaningful slowdown, particularly if coupled with signals from policymakers that a much slower pace of growth is desired, could pose a risk to our overweight equity stance. The April manufacturing PMIs disappointed, but the trade-related components of the official survey continued to improve meaningfully. In our view, recent statements from policymakers, particularly from PBOC Deputy Governor Liu Guoqiang,2 underscores that credit growth is unlikely to relapse over the coming year; it will simply not be growing at the breakneck pace observed in the first quarter. Beyond the near-term jitters that this may introduce into the equity market, we do not see it as a threat to an overweight stance towards Chinese stocks over the coming 6-12 months. Chart 5 highlights that Chinese consumer stocks have been the clear winners since the beginning of the year, particularly in the domestic market. Consumer stocks, including staples, sold off substantially in 2H2018 as investors responded to shockingly weak consumer spending data. Stimulus measures targeted to Chinese households, along with a meaningful improvement in some measures of consumer spending, has helped restore investor confidence in consumer stocks (which had previously been viewed as a bullish “no-brainer” structural trade). Chart 4Is An H-Share Catchup##br## Looming?
Is An H-Share Catchup Looming?
Is An H-Share Catchup Looming?
Chart 5Chinese Consumer Stocks Have Been On Fire
Chinese Consumer Stocks Have Been On Fire
Chinese Consumer Stocks Have Been On Fire
The sharp rise in the 7-day interbank repo rate in April fed concerns among equity investors that Chinese policymakers might be in the process of paring back their stimulus efforts. However, as Chart 6 shows, China’s 7-day repo rate is extraordinarily volatile, and is affected by a variety of seasonal and technical factors. The chart shows that a 1-month moving average of the 7-day repo rate is broadly in line with the level that has prevailed over the past 9 months. In addition, the 3-month repo rate (which we have argued has been a more informative predictor of China’s monetary policy stance) remains well on the low end of its range over the past year. In short, despite investor concerns, Chinese interbank repo rates are not signaling a change in China’s monetary policy stance. Tighter monetary policy is not in the cards for this year. After having risen noticeably in late-March, Chinese onshore corporate bond spreads have fallen back to the low end of their trading range over the past 8 months. We continue to recommend that domestic investors hold a diversified portfolio of SOE corporate bonds, on the basis that actual bond defaults over the coming 6-12 months are likely to be materially lower than what investors are pricing in even though they are indeed likely to rise. Chart 7 shows that USD-HKD has eased somewhat over the past month from the top end of the band, and now trades closed at 7.845. This modest appreciation in HKD appears to have been catalyzed by a further reduction in the supply of interbank liquidity by the HKMA. While the appreciation in HKD is some modest good news for Hong Kong’s monetary authority, it remains reluctant to reduce liquidity in the system given how extremely weak loan growth is in Hong Kong. This implies that, barring a meaningful upturn in credit, a significant appreciation in HKD is not likely in the cards. Chart 6Interbank Repo Rates Are Not Trending Higher
Interbank Repo Rates Are Not Trending Higher
Interbank Repo Rates Are Not Trending Higher
Chart 7A Modest Appreciation In HKD (Which Is Not Likely To Continue)
A Modest Appreciation In HKD (Which Is Not Likely To Continue)
A Modest Appreciation In HKD (Which Is Not Likely To Continue)
Jonathan LaBerge, CFA, Vice President Special Reports jonathanl@bcaresearch.com Footnotes 1 Please see China Investment Strategy Weekly Report “In The Wake Of An Upgrade: An Investment Strategy Post-Mortem,” dated April 17, 2019, available at cis.bcaresearch.com 2 During a PBOC briefing on April 25, Deputy Governor Guoqiang noted that “no one can bear it if policy swings back and forth between tightening and loosening many times a year”. Cyclical Investment Stance Equity Sector Recommendations
It’s official, the Italian technical recession is over. Italian GDP growth moved back into positive territory in the first quarter. Additionally, Spanish GDP growth rebounded to 0.7% on a quarterly basis, or 2.4% year-on-year. Thanks to those two surprises,…
Highlights Oil & Bond Yields: Global growth indicators are starting to rebound, risk assets have returned to previous cyclical highs, and oil prices remain buoyant. This is a combination that will eventually result in rising global bond yields, but more through higher inflation expectations that will bear-steepen yield curves. Stay below-benchmark on overall portfolio duration, but enter new reflationary trades in core Europe (long inflation breakevens) and Australia (yield curve steepeners). EM vs DM Credit: Signs of a pickup in Chinese growth will be more supportive for growth in EM economies. Hedging against an extended downturn in China is no longer needed. Upgrade EM U.S. dollar denominated sovereign and corporate debt to neutral (3 of 5), at the expense of a smaller overweight position in U.S. investment grade corporates. Feature Chart of the WeekA Consistent Message On Rebounding Growth
A Consistent Message On Rebounding Growth
A Consistent Message On Rebounding Growth
Evidence is starting to point to a bottoming in global economic momentum. Credit growth has notably picked up in China, global leading economic indicators are stabilizing and sentiment measures like our Duration Indicator have started to climb (Chart of the Week). While it is still early in this reflation process, the leading data is now moving in a direction that bodes well for continued gains in global equities and growth-sensitive spread product. The sharp rallies across risk assets seen so far this year have merely retraced the stinging losses incurred in the final months of 2018. Those moves were fueled by a combination of slowing global growth and overly hawkish central bankers. Now that policymakers have “course corrected” towards dovishness, led by the Fed’s 180-degree turn on the outlook for rate hikes in 2019 that drove U.S. Treasury yields lower, the next leg of the risk rally can begin, led by improving global growth. At some point, looser financial conditions – higher equity prices, tighter credit spreads and lower market volatility – will require global central bankers to retreat from dovish forward guidance (Chart 2). Policymakers who have been focused on sluggish global growth, “persistent uncertainty” (as ECB President Mario Draghi has described it), and falling inflation expectations will eventually have to adjust their policy bias once those factors reverse. On that front, the combination of improving global growth, rising oil prices and an increasingly likely U.S.-China trade deal will help boost global bond yields through rising inflation expectations first and higher interest rate expectations later (Chart 3). Chart 2A Full Unwind Of Late-2018 Moves...Except For Inflation
A Full Unwind Of Late-2018 Moves...Except For Inflation
A Full Unwind Of Late-2018 Moves...Except For Inflation
Chart 3Get Ready For A Bond-Bearish Turn In Growth
Get Ready For A Bond-Bearish Turn In Growth
Get Ready For A Bond-Bearish Turn In Growth
We continue to recommend a high-level fixed income portfolio construction that will benefit from these trends: below-benchmark on overall duration exposure with overweights on global corporate debt versus government bonds. We also see a case to selectively position for steeper yield curves and higher inflation expectations in countries more sensitive to higher oil prices and where central banks will be less hawkish/more dovish. Most importantly, we no longer see a need to maintain a defensive underweight in emerging market (EM) hard currency spread product, as we discuss later in this report. Yes, Oil Prices Still Matter For Bond Yields Global oil prices hit a new 2019 high last week on news that the Trump administration was letting waivers expire on U.S. sanctions of Iranian oil exports. Coming on top of the lost output from Venezuela, increased tensions in Libya and persistent production discipline from the major oil players (OPEC, the so-called “OPEC 2.0” of Russia and Saudi Arabia, and even U.S. shale producers), a boost to global oil demand from faster global growth is likely to result in even higher oil prices in the next 6-9 months. The combination of improving global growth, rising oil prices and an increasingly likely U.S.-China trade deal will help boost global bond yields. Our colleagues at BCA Commodity & Energy Strategy remain steadfast bulls on oil prices, with a year-end price target of $80/bbl on the Brent crude benchmark. They view the supply constraints as large and persistent enough to cause oil prices to continue rising alongside firmer global demand. Our most optimistic forward-looking growth indicator, the diffusion index of global leading economic indicators, is now calling for a sharp rebound in cyclical data like the global manufacturing PMI in the latter half of 2019. A move back to the 55-60 range for the global PMI, which the diffusion indicator is pointing towards (Chart 4, bottom panel), would be consistent with the +50% year-over-year growth rates in oil prices implied by BCA’s bullish oil forecasts (middle panel). Chart 4The 2019 Oil Rally Is Not Over Yet
The 2019 Oil Rally Is Not Over Yet
The 2019 Oil Rally Is Not Over Yet
Over the past several years, there has been a strong correlation between oil prices and government bond yields in most developed economies (Chart 5). Since the most recent bottom in global yields back on March 27, that behavior has persisted. Longer-term bond yields have risen more than shorter-dated yields, alongside higher inflation expectations further out the yield curve (Table 1). Chart 5Inflation Expectations Still Driving Bond Yields
Inflation Expectations Still Driving Bond Yields
Inflation Expectations Still Driving Bond Yields
Such “bear-steepenings” do not usually last for long periods of time. Inflation targeting central banks typically look at the reflationary implications of higher oil prices – faster economic growth with more future inflation as energy costs seep into core inflation measures – as a sign to maintain a more hawkish bias for monetary policy. That is not the case today, though, as data dependent central bankers have been more focused on past soft readings on both growth and inflation momentum. This should support a growth-driven rise in global oil prices in the coming months, as policymakers will be reluctant to alter the current dovish guidance without signs of both faster growth and higher realized inflation. Within the major developed markets, the recent correlations between oil prices (in local currency terms) and inflation expectations have been weakest in regions where central banks are most likely to keep policy interest rates stable. In the euro area, Japan and Australia – where core inflation rates are well below central bank targets and money markets are discounting flat-to-lower interest rate expectations over the next 1-2 years – market-based measures of inflation expectations like CPI swap rates have diverged from the rising path of local-currency denominated oil prices (Chart 6). In the U.S. and Canada, which have only recently paused their rate hike cycles, the correlation between oil prices and inflation expectations has been a bit more in line with the experience of the past several years. The same goes for the U.K., although inflation expectations there seem more driven by currency weakness stemming from the Brexit uncertainty rather than a central bank that is perceived to be too hawkish (even though the Bank of England only recently shifted away from its past language signaling a desire to start normalizing very low interest rates). Table 1A Reflationary Bear-Steepening Of Yield Curves Since Yields Troughed In March
It's Time To Break Out The Fine China
It's Time To Break Out The Fine China
Correlations between longer-term inflation expectations and the slopes of government bond yield curves have also become less consistent across countries (Chart 7). In particular, 2-year/10-year yield curves been more positively correlated to inflation expectations in the euro zone, Australia and even Japan (where the BoJ is actively targeting the yield curve) than in the U.S., U.K. and Canada. Chart 6Higher Oil, Higher Inflation Expectations
Higher Oil, Higher Inflation Expectations
Higher Oil, Higher Inflation Expectations
Chart 7Position For Reflationary Yield Curve Steepening
Position For Reflationary Yield Curve Steepening E
Position For Reflationary Yield Curve Steepening E
Given BCA’s bullish oil forecast, we recommend positioning for higher inflation expectations and steeper yield curves in selected countries based on the above correlations. We are already doing this in the U.S., where we are running a long position in U.S. 10-year TIPS breakevens. This week, we are entering the following new positions in our Tactical Trade portfolio (see page 15): Long 10-year CPI swaps (or inflation-linked bonds versus nominal debt) in Germany A 2-year/10-year government bond curve steepener in Australia We are not confident enough about the growth outlook in Canada and Japan, and the political outlook in the U.K., to recommend inflation-focused trades in those markets at the present time. We recommend positioning for higher inflation expectations and steeper yield curves in selected countries. Bottom Line: Global growth indicators are starting to rebound, risk assets have returned to previous cyclical highs, and oil prices remain buoyant. This is a combination that will eventually result in rising developed market global bond yields, but more through higher inflation expectations that will bear-steepen yield curves. Stay below-benchmark on overall portfolio duration, but enter new reflationary trades in core Europe (long inflation breakevens) and Australia (yield curve steepeners). Upgrade EM U.S. Dollar Denominated Debt To Neutral Chart 8A Cyclical Rebound In China Is Underway
A Cyclical Rebound In China Is Underway
A Cyclical Rebound In China Is Underway
Back in January, we upgraded our recommended allocation for global corporate debt to overweight, while downgrading developed market government bonds to underweight.1 That decision was in response to the Fed’s dovish turn, which lowered the risk of a monetary policy-induced U.S. recession that spooked investors in late 2018. Yet while a more accommodative Fed meant an extension of the U.S. business cycle expansion, it did not solve the problems of slowing growth elsewhere in the world – most notably in China and Europe. For that reason, we have maintained a preference for U.S. investment grade and high-yield corporate debt relative to European and EM spread product, even within an overall overweight recommended allocation to global corporates. In particular, we maintained an outright underweight stance on EM U.S. dollar denominated sovereigns and corporates within our model bond portfolio. That tilt served as a hedge to the risk of persistent softening growth in China – the nation to which EM economies remain most highly levered. It is the pickup in the China credit impulse that is most relevant for EM growth and asset markets. Now, amid signs that Chinese policy stimulus is starting to show up in faster credit growth – a reliable precursor to greater Chinese domestic demand (Chart 8) – that EM hedge to our overweight stance on global corporates is no longer needed. Thus, this week, we are upgrading our recommended exposure on EM USD-denominated sovereign and corporate debt to neutral, while reducing the size of our recommended overweight in U.S. investment grade corporates in our model bond portfolio (see the changes on page 14). The broadening rebound in Chinese economic data makes us more confident that growth there has turned the corner (Chart 9): Aggregate government spending is up 15.5% on a year-over-year basis. Infrastructure spending is now starting to grow again after the sharp slowdown seen in 2018. The China manufacturing PMI rose sharply in March, with the surge in the import sub-component of the overall PMI suggesting that domestic demand may be improving. In addition, with all signals pointing to a U.S./China trade deal being signed by the end of May, a major source of uncertainty weighing on the Chinese (and global) economy will soon be lifted. It is the pickup in the China credit impulse that is most relevant for EM growth and asset markets. Over the past decade, the credit impulse has led both the EM (ex-China) manufacturing PMI and annual growth in overall EM corporate earnings by around 9-12 months (Chart 10). The credit impulse bottomed back in October 2018, which means EM growth should begin to improve in the third quarter of 2019. Financial markets will discount that improvement in advance, however, which is why it makes sense to increase EM credit allocations today. Chart 9The Arrows Are Pointing 'Up' For Chinese Growth
The Arrows Are Pointing 'Up' For Chinese Growth
The Arrows Are Pointing 'Up' For Chinese Growth
Chart 10EM Growth Is Highly Dependent On China
EM Growth Is Highly Dependent On China
EM Growth Is Highly Dependent On China
As can be seen in the bottom panels of Chart 11 and Chart 12, there is a strong correlation between Chinese credit (as a % of GDP) and the relative performance of EM U.S. dollar denominated spread product versus U.S. investment grade corporates. Our colleagues at BCA China Investment Strategy recently noted that if the pace of China’s credit expansion seen in Q1 were to be maintained over the rest of 2019, this would imply a credit overshoot beyond the stated medium-term goal of Chinese policymakers to avoid significant further increases in leverage.2 Such additional stimulus would very beneficial for EM growth (via strong Chinese import demand), supporting continued EM credit market outperformance. Chart 11Upgrade EM USD Sovereigns Vs U.S. IG Corporates
Upgrade EM USD Sovereigns Vs U.S. IG Corporates
Upgrade EM USD Sovereigns Vs U.S. IG Corporates
Chart 12Upgrade EM USD Corporates Vs U.S. IG Corporates
Upgrade EM USD Corporates Vs U.S. IG Corporates
Upgrade EM USD Corporates Vs U.S. IG Corporates
By moving our EM credit allocation only to neutral, we are merely responding to the pickup in Chinese credit growth seen over the past several months. The increasingly positive cyclical story is not yet bullish enough to justify a full-blown overweight stance on EM credit, however, for several reasons: Past periods of EM credit market outperformance have typically occurred during periods of U.S. dollar weakness. Chart 13A Weaker USD Is Good For EM Markets
A Weaker USD Is Good For EM Markets
A Weaker USD Is Good For EM Markets
The amount of policy stimulus likely to be delivered in China in 2019 will be more limited than in past cycles, given policymakers’ concerns over high Chinese debt levels and excess industrial capacity. A U.S.-China trade deal may not involve the swift reduction in U.S. tariffs on Chinese imports, if the White House chooses to use tariffs as the mechanism to ensure Chinese compliance with the terms of an agreement. “Hard data” in China that measures private sector spending (retail sales, autos sales, etc.) has yet to bottom, which may indicate that the improvement seen in the credit aggregates and survey data like the manufacturing PMI is overstating the growth rebound. The U.S. dollar remains firm, and past periods of EM credit market outperformance have typically occurred during periods of dollar weakness (Chart 13). We do anticipate moving to an overweight position sometime in the next several weeks, after getting more Chinese economic data to confirm the improvement seen in March. This also lines up with the timetable for a potential trade deal, the details of which will be critical for boosting investor sentiment towards assets sensitive to Chinese demand, like EM credit. We will also look for signs of the U.S. dollar breaking to the downside to confirm any decision to upgrade EM credit. One final point – we are only reducing our recommended overweight on U.S. investment grade credit in our model bond portfolio as part of this EM upgrade. We are leaving our U.S. high-yield credit overweights untouched, as U.S. investment grade is much closer to the spread targets laid out by our colleagues at BCA U.S. Bond Strategy than U.S. high-yield. Bottom Line: Signs of a pickup in Chinese growth will be more supportive for growth in EM economies. Hedging against an extended downturn in China is no longer needed. Upgrade EM U.S. dollar denominated sovereign and corporate debt to neutral (3 of 5), at the expense of a smaller overweight position in U.S. investment grade corporates. Robert Robis, CFA, Chief Fixed Income Strategist rrobis@bcaresearch.com Footnotes 1 Please see BCA Global Fixed Income Strategy Weekly Report, “Enough With The Gloom: Upgrade Global Corporates On A Tactical Basis”, dated January 15th, 2019, available at gfis.bcaresearch.com. 2 Please see BCA China Investment Strategy Weekly Report, “In The Wake Of An Upgrade: An Investment Strategy Post-Mortem”, dated April 17th, 2019, available at cis.bcaresearch.com. Recommendations The GFIS Recommended Portfolio Vs. The Custom Benchmark Index
It's Time To Break Out The Fine China
It's Time To Break Out The Fine China
Duration Regional Allocation Spread Product Tactical Trades Yields & Returns Global Bond Yields Historical Returns
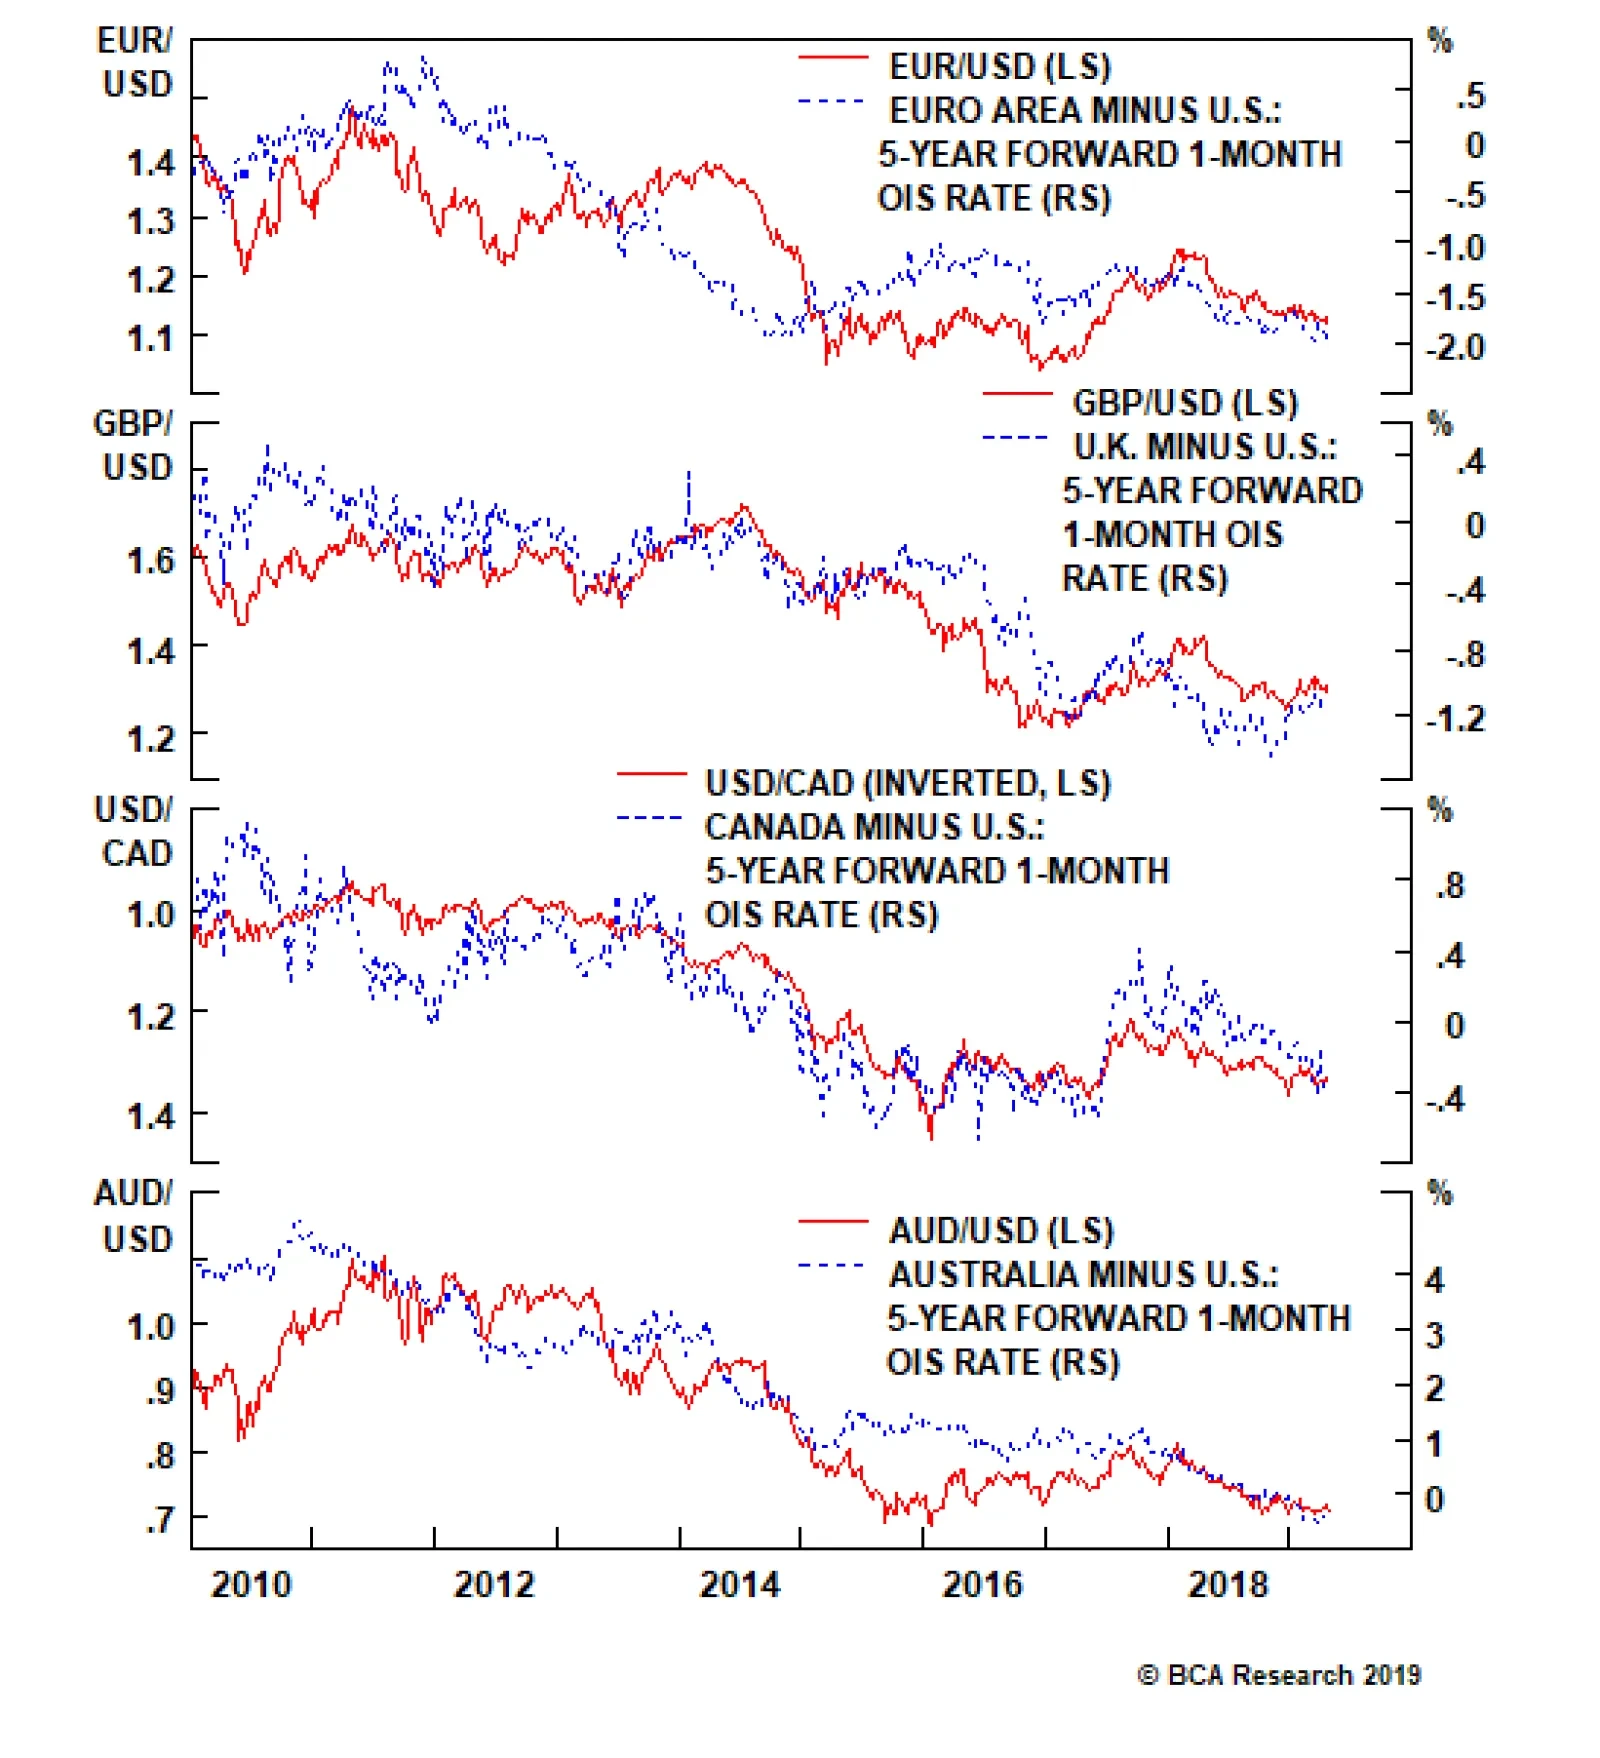
European domestic demand should benefit from an easing of fiscal policy of around 0.5% of GDP. Faster growth in the U.S. in relation to the euro area has caused the spread in expected interest rates to widen between the two regions. The spread in…
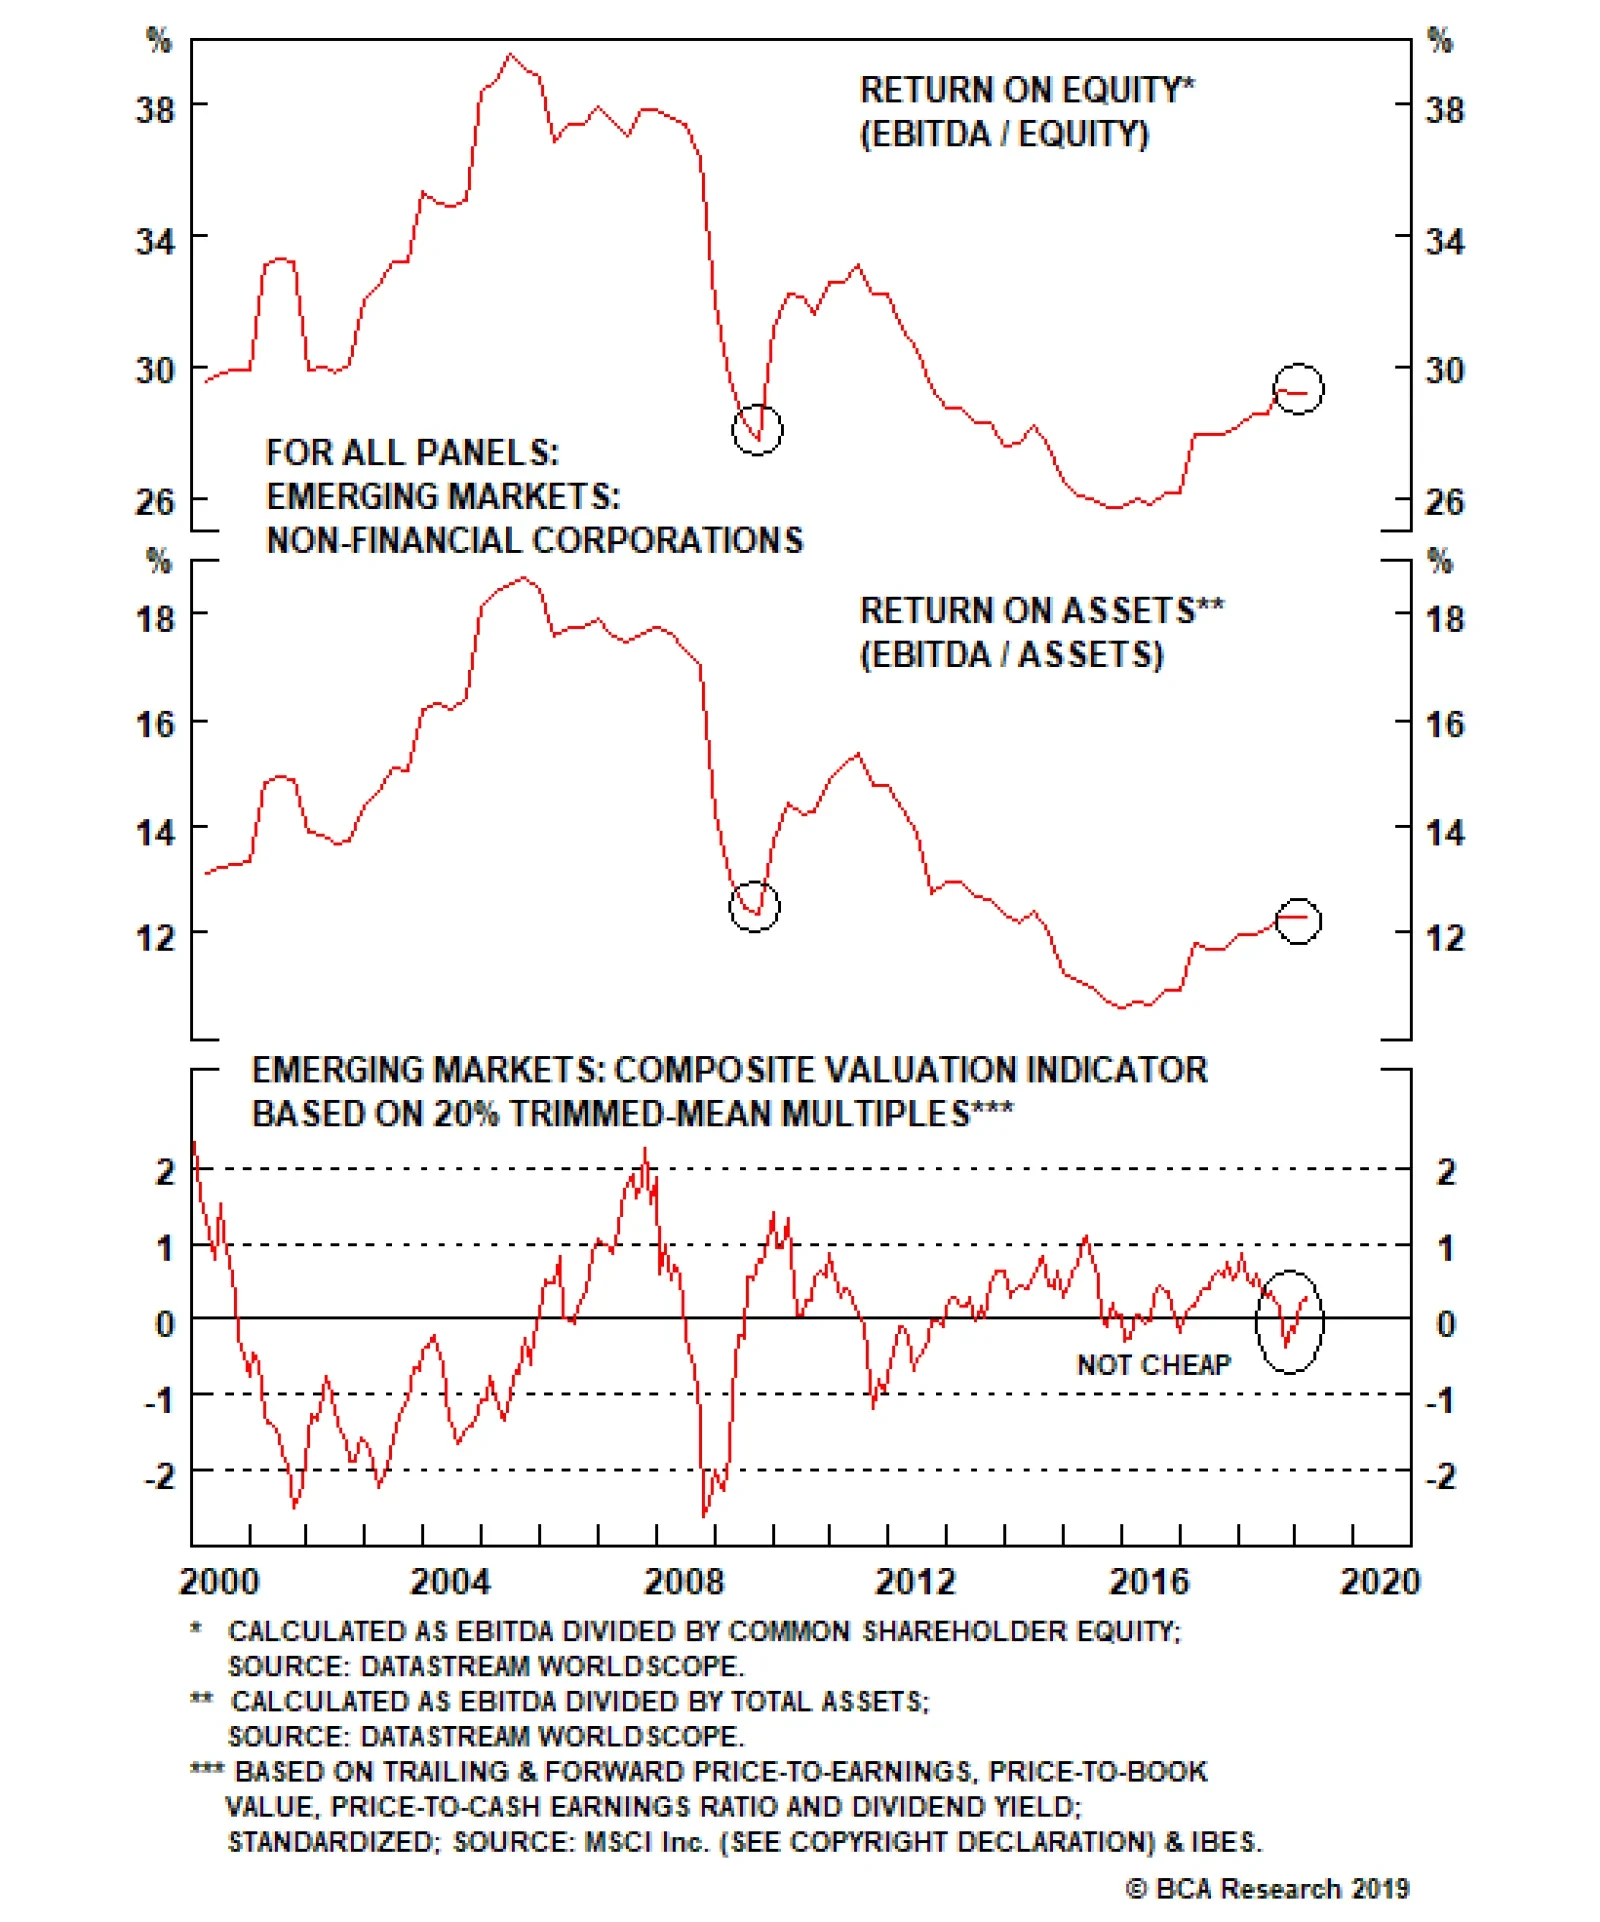
Is it possible that EM corporate profitability is currently improving and valuations are already discounting a lot of the negatives? Shouldn’t relative corporate profitability be compared with relative equity valuations between EM and the U.S.? For now,…