Emerging Markets
Mexico & Fiscal Sustainability: A Comparative Analysis
…

Highlights The Taiwanese equity market has closely tracked the global benchmark over the past few years, meaning Taiwan is particularly an “alpha” rather than a “beta” play. This means that a bullish 6-12 month outlook for Taiwanese relative performance rests on the odds of a positive “Taiwan-specific” event. In our view, the forthcoming recovery in Chinese economic activity likely qualifies as an alpha catalyst for Taiwanese stocks over the coming 6-12 months, given the strong link between export-related indicators and Taiwanese relative performance. Investors should increase exposure relative to global equities (to overweight) over a 6-12 month time horizon in US$ terms. Evidence of Taiwanese central bank intervention implies that there is limited potential for TWD appreciation versus the U.S. dollar over the coming year. Our bet is that TWD-USD will remain broadly flat. Feature BCA’s China Investment Strategy team recommended that investors upgrade Chinese stocks to overweight (both investable and domestic) in an April 12 Special Alert,1 and last week’s report provided a detailed analysis and review of the Chinese economic and financial market outlook following our upgrade.2 This week’s report briefly updates the outlook for Taiwanese stocks, and argues that investors should increase exposure relative to global equities (to overweight) over a 6-12 month time horizon in US$ terms. However, we see somewhat less upside for Taiwanese stocks than for Chinese stocks, and recommend that investors reduce exposure to neutral once Taiwan registers a 6% relative return (versus the global benchmark) over the coming year. Relative To Global Stocks, Taiwan Is An Alpha (Not A Beta) Play It is a little known fact that Taiwan’s equity market has exhibited a remarkably different relative performance profile over the past decade than it did during the prior decade. On a rolling 10-year basis, Chart 1 shows that Taiwan consistently ranked poorly relative to other equity markets until the onset of the global financial crisis. But since 2008, and especially since 2013, Taiwan’s relative performance has improved meaningfully compared with other markets, recently scoring as highly as in the 90th percentile. Chart 2 highlights that this comparative improvement in relative performance has largely occurred because Taiwan has neither significantly outperformed or underperformed the global benchmark, in contrast to the U.S., emerging markets (EM), and developed markets (DM) ex-U.S. Chart 2 shows that regional equity performance since 2008 has been a simple story of massive U.S. outperformance alongside significant EM and DM ex-U.S. underperformance. Simply by keeping up with global stocks in the aggregate, Taiwan has managed to outperform most individual equity markets over the past decade. Chart 1Over The Past Decade, Taiwan Has Ranked Highly Compared With Other Equity Markets
Over The Past Decade, Taiwan Has Ranked Highly Compared With Other Equity Markets
Over The Past Decade, Taiwan Has Ranked Highly Compared With Other Equity Markets
Chart 2Since 2013, Taiwan Has Tracked Global Stocks
Since 2013, Taiwan Has Tracked Global Stocks
Since 2013, Taiwan Has Tracked Global Stocks
For investors, the consequence of Taiwan closely tracking the global benchmark over the past few years is that the Taiwanese equity market is particularly an “alpha” rather than a “beta” play, implying that a bullish 6-12 month outlook for Taiwanese relative performance rests on the odds of a positive “Taiwan-specific” event. Stronger Chinese Growth: A Likely “Alpha” Catalyst In our view, the forthcoming recovery in Chinese economic activity that we discussed in last week’s report likely qualifies as an alpha catalyst for Taiwanese stocks over the coming 6-12 months. Taiwanese relative performance has already reflects some of this likely improvement, but we believe that investors stand to gain somewhat further over the coming year. Investors should increase Taiwanese equity exposure relative to global stocks (to overweight) over a 6-12 month time horizon in US$ terms. Chart 3Exports To China, 12-Month Forward EPS, And Relative Stock Prices: All Likely To Improve
Exports To China, 12-Month Forward EPS, And Relative Stock Prices: All Likely To Improve
Exports To China, 12-Month Forward EPS, And Relative Stock Prices: All Likely To Improve
Chart 4Buy Taiwanese Stocks, But Book Profits After A 6% Relative Return
Buy Taiwanese Stocks, But Book Profits After A 6% Relative Return
Buy Taiwanese Stocks, But Book Profits After A 6% Relative Return
Chart 3 presents the cyclical case for Taiwanese stocks in a nutshell. Panels 1 & 2 show that the new export orders component of the official Taiwanese manufacturing PMI rebounded massively in March, and that it has historically coincided with both Taiwanese exports to China and the relative Taiwanese Markit manufacturing PMI (versus the JPMorgan Global Manufacturing PMI). The latter, in turn, reliably leads the growth in absolute Taiwanese forward EPS, which have fallen sharply into negative territory over the past several months (Panel 3). Taiwanese relative US$ performance has typically correlated well with accelerating absolute Taiwanese forward earnings, underscoring that a period of relative gains loom. Given the likely uptrend in Taiwanese relative performance over the coming 6-12 months, we are opening a long MSCI Taiwan Index / short MSCI All Country World Index (US$) trade today, initiated at 0.725. Chart 4 highlights that a rally to 0.77 would mark both a 6% relative return from today’s levels and would almost constitute a return back to the post-2013 high in Taiwanese relative performance (90th percentile). As such, we would recommend that investors use this point as a stop-sell for our recommendation to favor Taiwanese stocks within a global equity portfolio. What’s Next For The Taiwanese Dollar? Over the coming 6-12 months, our bet is that TWD-USD will remain broadly flat. While it is difficult to conclusively prove, three observations point to recent intervention by the Taiwanese central bank, which is likely to limit major trends in the exchange rate: Over the coming 6-12 months, our bet is that TWD-USD will remain broadly flat. Chart 5The Taiwanese Dollar Has Not Been Responding To Interest Rate Differentials
The Taiwanese Dollar Has Not Been Responding To Interest Rate Differentials
The Taiwanese Dollar Has Not Been Responding To Interest Rate Differentials
TWD-USD has trended flat since the middle of last year, after having fallen from its early-2018 highs. The earlier decline reflected the risk posed to the Taiwanese economy by the U.S.-Sino trade war, but was also consistent with an ever-widening interest rate differential between Taiwan and the U.S. (Chart 5). In the face of this gap and frequent positive and negative developments concerning the trade war, TWD’s extremely stable profile is quite suspicious. Chart 6 highlights that the ability of changes in the U.S. dollar to explain changes in TWD-USD has fallen sharply over the past several months, to a multi-year low. While the U.S. dollar has never been able to strongly explain changes in TWD-USD, a sudden weakening in the relationship is consistent with increased central bank intervention. In addition, panel 2 shows that the recent decline in the predictive power of the dollar has corresponded with a sharp pickup in the growth rate of official foreign exchange reserves. Chart 7 shows that TWD-CNY has been trading over the past two years at the high end of its post-2008 range. Taiwanese exports to China are meaningfully larger than those to the U.S., which highlights that there is an incentive for Taiwanese policymakers to limit further gains. To the extent that a strong link between TWD-USD and CNY-USD exists, our bias for a flat trend in the latter suggests that a strong trend in the former is unlikely. Chart 6Over The Past Year, TWD Has Largely Been Unresponsive To Dollar Moves
Over The Past Year, TWD Has Largely Been Unresponsive To Dollar Moves
Over The Past Year, TWD Has Largely Been Unresponsive To Dollar Moves
Chart 7The Taiwanese Dollar Is Fairly Elevated Compared To CNY
The Taiwanese Dollar Is Fairly Elevated Compared To CNY
The Taiwanese Dollar Is Fairly Elevated Compared To CNY
As a final point, limited potential for TWD appreciation versus the U.S. dollar also implies that a full return to the March 2018 high for Taiwanese relative US$ performance is unlikely. This underscores the importance of our stop-sell recommendation, and reinforces that we are favoring Taiwanese stocks as a cyclical catch-up play, rather than as a high-conviction, long-term buy. Jonathan LaBerge, CFA, Vice President Special Reports jonathanl@bcaresearch.com Footnotes 1 Please see BCA Research’s China Investment Strategy Special Alert, “Upgrade Chinese Stocks To Overweight,” published April 12, 2019. Available at cis.bcaresearch.com. 2 Please see BCA Research’s China Investment Strategy Weekly Report, “In The Wake Of An Upgrade: An Investment Strategy Post-Mortem,” published April 17, 2019. Available at cis.bcaresearch.com. Cyclical Investment Stance Equity Sector Recommendations
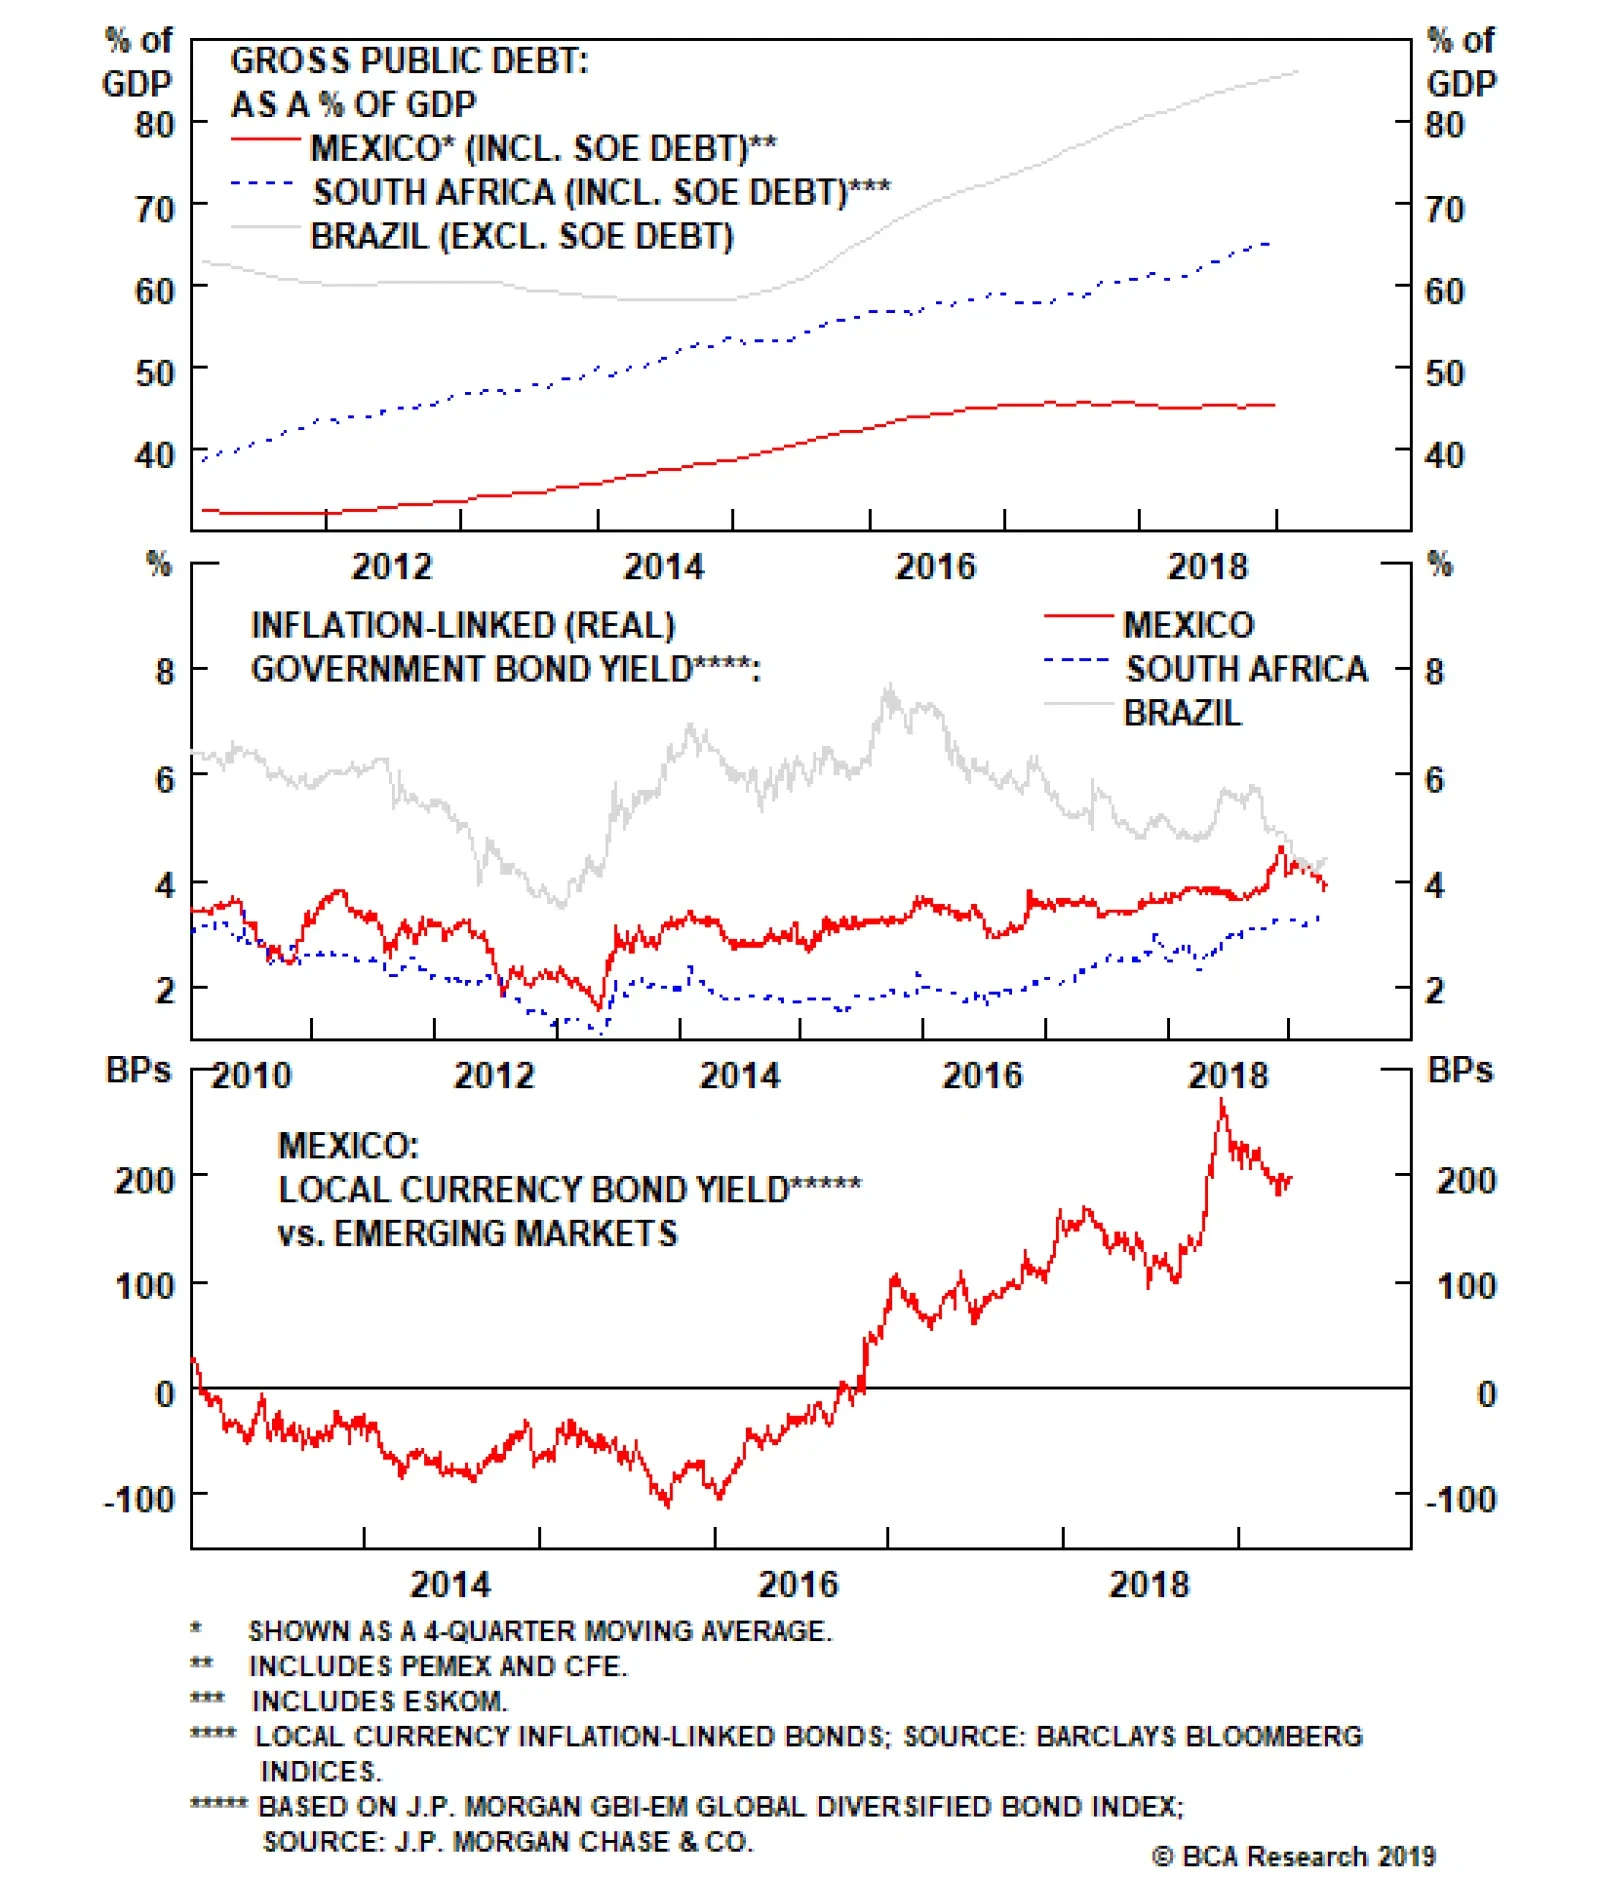
Highlights We continue to recommend overweighting Mexican local fixed-income markets, the peso and sovereign credit relative to their respective EM benchmarks. A new trade: Sell Mexican CDS / buy Brazilian and South African CDS. Continue holding the long MXN / short ZAR position. We have a lower conviction view that Mexican equities will outperform the EM benchmark. Feature Since the election of Andrés Manuel López Obrador – or AMLO, as he is commonly known – as President, investors have been worrying about Mexico’s fiscal policy and public debt sustainability. Specifically, investors have expressed concern over the debt dynamics of state-owned petroleum company Pemex and its impact on the country’s public debt. While these concerns are not groundless, on balance we find the risk-reward profile of Mexico’s sovereign credit and local currency bonds superior relative to their respective EM peers. Fiscal Sustainability: A Comparative Analysis We discussed debt sustainability in Brazil and South Africa in two of our recent reports, and concluded that their public debt dynamics are unsustainable without drastic fiscal reforms. However, a closer look at debt sustainability in Mexico reveals a different picture. Chart 1Public Debt Burden Including SOE Debt
Public Debt Burden Including SOE Debt
Public Debt Burden Including SOE Debt
Mexico’s public debt level including the debt of state-owned enterprises is lower than those in Brazil and South Africa (Chart 1). Notably, Mexico’s public debt-to-GDP ratio has been flat over the past three years. Importantly, as detailed below, the two primary conditions for public debt sustainability – the level of government borrowing costs and the primary fiscal balance - are far superior in Mexico relative to Brazil and South Africa. Government borrowing costs in local currency terms are only slightly above nominal GDP in Mexico. Brazil and South Africa score much worse on this measure (Chart 2). The primary fiscal balance in Mexico is much better than in Brazil and South Africa (Chart 3). In fact, Mexico is targeting a primary surplus of 1% for 2019. Chart 2Local Borrowing Costs Versus Nominal GDP
Local Borrowing Costs Versus Nominal GDP
Local Borrowing Costs Versus Nominal GDP
Chart 3Primary Fiscal Balances
Primary Fiscal Balances
Primary Fiscal Balances
Even with potential pension reforms, Brazil will continue to run primary deficits for the next few years. As we discussed in our recent report on Brazil, the government’s submitted draft on social security reforms will save only BRL190 billion over the next four years, or 0.7% of GDP per year. The current primary deficit is 1.5% of GDP. Unless nominal GDP growth and government revenue growth shoot up, the primary deficit will not be eliminated in the next four years. Unlike Brazil and South Africa, the growth of public sector debt in Mexico is not outpacing nominal GDP growth (Chart 4). Critically, the latter point is also true in Mexico if one includes state-owned enterprises’ debt. Brazil and South Africa sovereign spreads are currently only 40 and 85 basis points above those in Mexico, respectively. The spread will widen further in favor of Mexico, given the latter’s superior fundamentals (Chart 5). In terms of local currency bonds, real yields in Mexico are also on par with Brazil but are well above those in South Africa (Chart 6). Hence, Mexican local bonds offer relative value versus many of their EM peers. Chart 4Public Debt and GDP Growth
Public Debt and GDP Growth
Public Debt and GDP Growth
Chart 5Sell Mexican CDS / Long South African and Brazilian CDS
Sell Mexican CDS / Long South African and Brazilian CDS
Sell Mexican CDS / Long South African and Brazilian CDS
Nominal local currency bond yields in Mexico are about 200 basis points above the EM GBI benchmark domestic bond yield index (Chart 7). This is great value. Clearly, Mexico’s fiscal worries are overblown relative to those in Brazil and South Africa. Besides, relative valuations of sovereign credit and local bonds adjusted for relative fundamentals warrant outperformance in Mexico versus the other two markets as well as against the respective EM benchmarks in the months ahead. Chart 6Real Bond Yields: Decent Value In Mexico
Real Bond Yields: Decent Value In Mexico
Real Bond Yields: Decent Value In Mexico
Chart 7Nominal Bond Yields: Great Value In Mexico
Nominal Bond Yields: Great Value In Mexico
Nominal Bond Yields: Great Value In Mexico
In addition, AMLO’s administration has proven to be committed to fiscal austerity. Last month, the Ministry of Finance reinforced this notion by announcing a reduction in public spending on social programs in order to balance the loss of fiscal revenue from decreasing oil revenues and lower GDP estimates. Mexico’s fiscal worries are overblown relative to those in Brazil and South Africa. Besides, relative valuations of sovereign credit and local bonds adjusted for relative fundamentals warrant outperformance in Mexico versus the other two markets as well as against the respective EM benchmarks in the months ahead. We view the primary fiscal target of 1% for 2019 as aggressive and potentially unattainable due to a shortfall in revenues. However, these actions prove that AMLO’s administration is not intending to run a large fiscal deficit to finance populist spending programs, as investors had feared. Adding Pemex To Public Finances Pemex’s financial position and the government budget’s reliance on oil revenues are an Achilles’ heel for Mexico’s public finances. Therefore, we have incorporated Pemex into the budget. The resulting fiscal deterioration is not calamitous. Specifically, international credit agencies estimate that Pemex needs an additional $13 billion to $20 billion in capital expenditures per year in order to maintain current operations and replenish reserves. This is in addition to its debt service obligations in the coming years, as shown in Table 1. Table 1Pemex Debt Servicing
Mexico: The Best Value In EM Fixed Income
Mexico: The Best Value In EM Fixed Income
We have the following considerations on this issue: First, this year the government announced $5.7 billion of financing for Pemex in the form of direct investment, tax breaks, deductions for drilling and exploration costs and revenue recovered from oil theft. In addition, the government will also do a one-time transfer of $6.8 billion from its $15.4 billion budget stabilization fund in order to finance Pemex’s debt payments due by the end of this year. While Congress must first approve the use of these funds, odds are that the bill will pass as AMLO’s party holds a majority. That would bring total capital injection into Pemex to $12.5 billion for the year, almost enough to finance the company’s capital spending this year. Second, in order to revive operations at Pemex in the medium to long term, the government must maintain this level of investment on an annual basis. Essentially, AMLO’s administration will inevitably have to sacrifice part of the $29 billion in net oil transfers it receives every year to finance the oil company and prevent further downgrades to its credit rating. How large is this required Pemex financing as a share of the public budget? We performed a simulation including into the public budget all of Pemex’s payments and all its receipts from the government. While the overall fiscal position deteriorates, it is not unsustainable. The primary and overall deficits would widen to 1.9% and 4.4% of GDP, respectively, if the government eliminates all transfers to Pemex and if the company stops all payments to the government budget, including direct transfers and indirect oil taxes1 (Table 2, Scenario 1). Table 2Mexico: Pemex And Government Budget
Mexico: The Best Value In EM Fixed Income
Mexico: The Best Value In EM Fixed Income
In such a scenario, Pemex would gain $ 29 billion each year to invest in exploration and production. Pemex is the largest fiscal challenge for Mexico. Yet, even including Pemex debt and required financing, the nation’s fiscal accounts are not worrisome. Chart 8Mexico's Budget Balance Adjusted For Financing To Pemex
Mexico's Budget Balance Adjusted For Financing To Pemex
Mexico's Budget Balance Adjusted For Financing To Pemex
Third, provided Pemex’s capital spending needs could be met by half of this $29 billion, the government could provide the company just half of this amount (Table 2, Scenario 3). In this scenario, the oil company will have sufficient funds to invest. Meanwhile, the government’s primary and overall fiscal deficit will deteriorate only moderately to 0.7% and 3.2% of GDP, respectively (Chart 8 and Table 2). Finally, the importance of oil revenues – both directly from Pemex and via indirect taxation on the oil industry – have already declined as a share of total fiscal revenues – from 40% in 2012 to 18.3% currently (Chart 9). In short, Mexico’s budget is less reliant on oil revenues. If economic growth picks up, non-oil revenues will improve. Consequently, the government’s fiscal position will improve, giving it more maneuvering room to deal with Pemex. Bottom Line: Pemex is the largest fiscal challenge for Mexico. Yet, even including Pemex debt and required financing, the nation’s fiscal accounts are not worrisome. Cyclical Economic Conditions The Mexican economy is slowing and inflationary pressures are subsiding. Narrow money (M1) and retail sales growth are decelerating (Chart 10, top panel) Capital spending is contracting and non-oil exports will be in a soft spot over the next six months, according the U.S. manufacturing ISM new orders-to-inventory ratio (Chart 10, bottom panel). Core inflation is at 3.55% and is heading south. Chart 9Dependence On Oil Revenues Has Declined A Lot
Dependence On Oil Revenues Has Declined A Lot
Dependence On Oil Revenues Has Declined A Lot
Chart 10Mexico: Cyclical Conditions
Mexico: Cyclical Conditions
Mexico: Cyclical Conditions
Barring major turmoil in EM currency markets that weighs on the peso, weakening growth and disinflation will lead the domestic fixed-income market to discount rate cuts. Mexico’s central bank is very hawkish and will be slow to ease policy. Yet, such a policy stance warrants a bullish view on domestic bonds. The basis is that the longer they delay rate cuts, the more they will need to cut in the future. Investment Strategy We have been recommending an overweight position in Mexico in EM local currency and sovereign credit portfolios, and are reiterating these strategies. Relative value investors should consider this trade: Sell Mexico CDS / buy Brazilian and South African CDS. The Mexican sovereign credit market has made a major bottom versus the EM benchmark and the path of least resistance is now up (Chart 11). EM local currency bond portfolios should continue overweighting Mexico while underweighting Brazil and South Africa (Chart 12). Chart 11Sovereign Excess Returns: A Relative Bull Market In Mexico
Sovereign Excess Returns: A Relative Bull Market In Mexico
Sovereign Excess Returns: A Relative Bull Market In Mexico
Chart 12Total Return on Local Currency Bonds in Dollar Terms
Total Return on Local Currency Bonds in Dollar Terms
Total Return on Local Currency Bonds in Dollar Terms
Similarly, among EM currencies, we favor the Mexican peso because it is cheap (Chart 13). Specifically, we continue to hold the long MXN / short ZAR position; investors who are not yet in this trade should consider entering it now. Chart 13The Mexican Peso Is Cheap
The Mexican Peso Is Cheap
The Mexican Peso Is Cheap
Finally, in the EM equity universe, we are overweight Mexican stocks, but our conviction level is lower than in the case of fixed-income markets. The basis is that AMLO’s policies intend to weaken oligopolies and monopolies and undermine their pricing power. These policies are very positive for fixed-income markets and the exchange rate in the long run, as they entail lower inflation resulting from a more competitive environment. Yet, they could hurt profits of incumbent monopolies and oligopolies. This is why we recommend equity investors focus on Mexican small-caps. That said, from a macro perspective, resulting disinflation and lower local rates are also positive for equity multiples. Hence, the Mexican stock market will also likely outperform the EM benchmark in common currency terms. Arthur Budaghyan Chief Emerging Markets Strategist arthurb@bcaresearch.com Juan Egaña, Research Associate juane@bcaresearch.com Footnotes 1 Indirect oil taxation includes different taxes for the oil fund for stabilization and development, such as rights on drilling and exploration, import and export duties on oil and gas and financing for oil and gas research.
3. Chinese Debt Growth Is Sustainable Much of China’s debt stock is composed of state-owned enterprise, local government, and other forms of quasi-public sector debt. Credit policy in China is often indistinguishable from fiscal policy. Given the abundant…
Long-term investors should steer clear of any growth-sensitive assets. It is a seductive argument. But our Global Investment Strategy service argues that it is wrong. Chinese re-leveraging is: 1) inevitable; 2) desirable; and 3) sustainable. 1. Chinese…
Our Commodity & Energy Strategy team believes that Russia’s threat of a market-share war is a feint: A market-share war would damage the Russian economy more than the balance sheets of U.S. shale producers, particularly those that hedge the first year or…
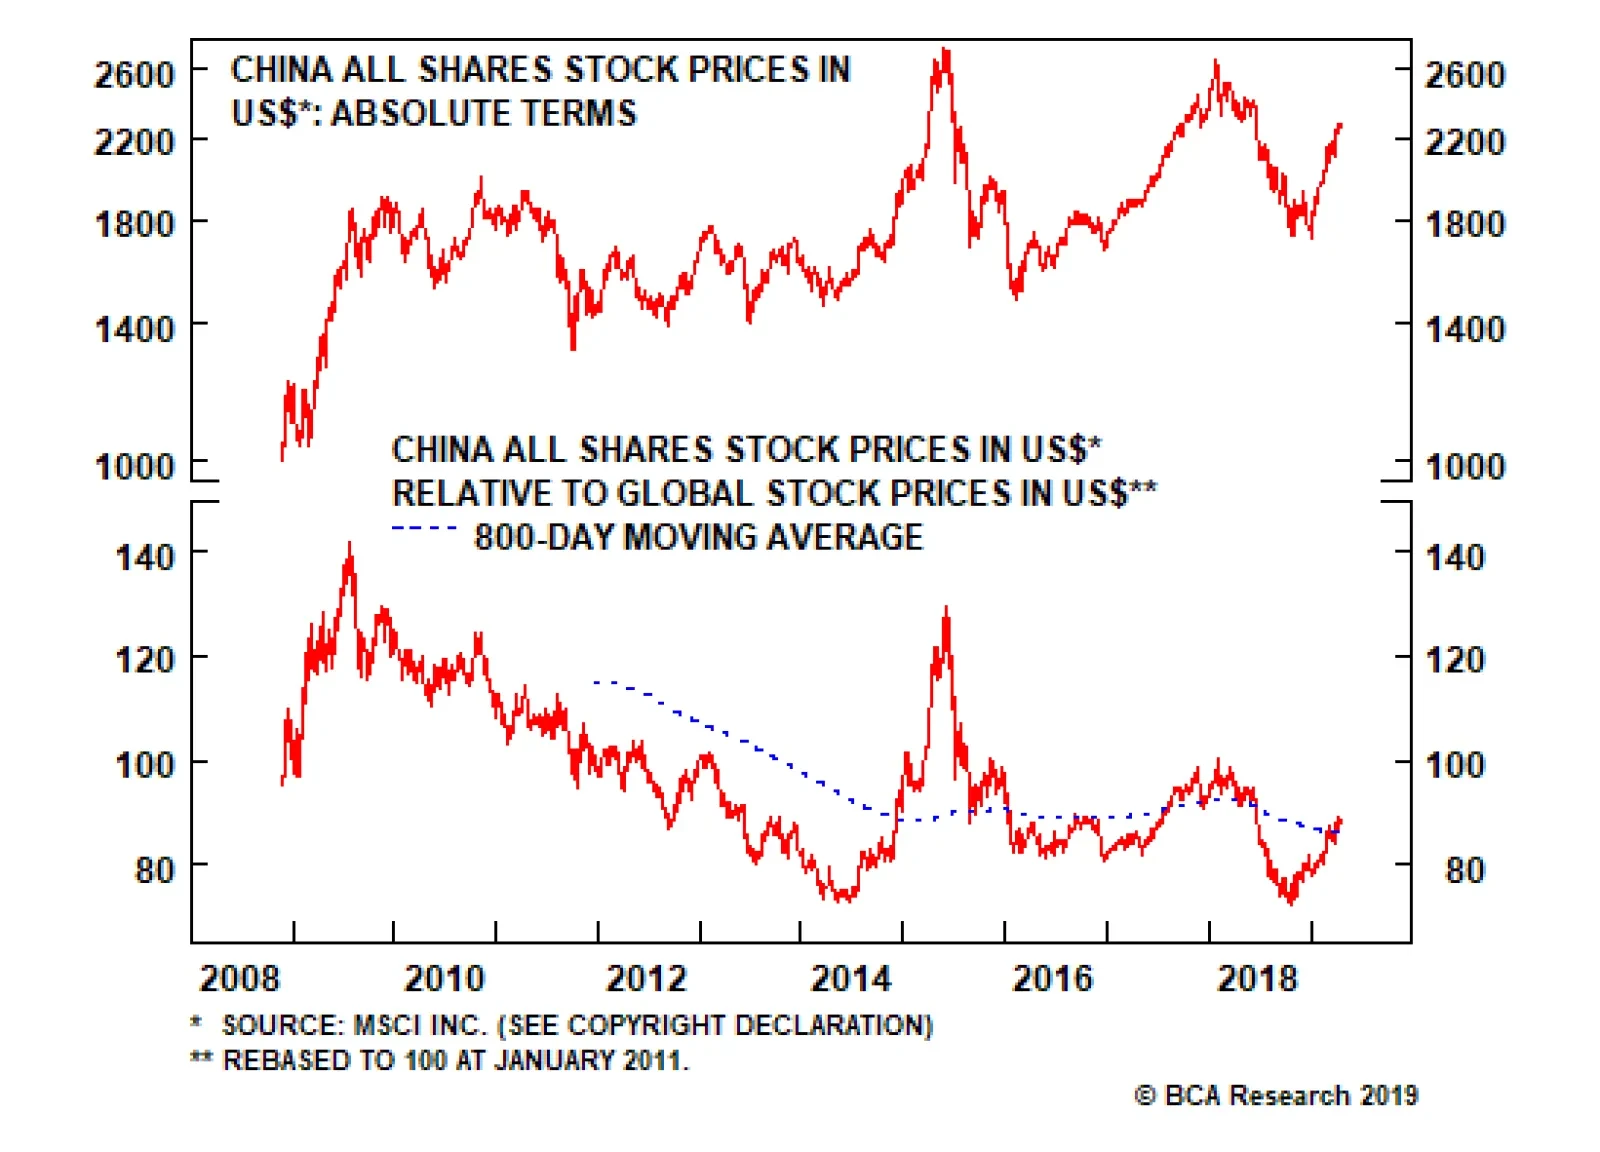
In reality, however, economic and especially financial market mini-cycles are not symmetric, and investors can make money only if they time them properly. In fact, this decade Chinese share prices – both in absolute terms and relative to global stocks – have…
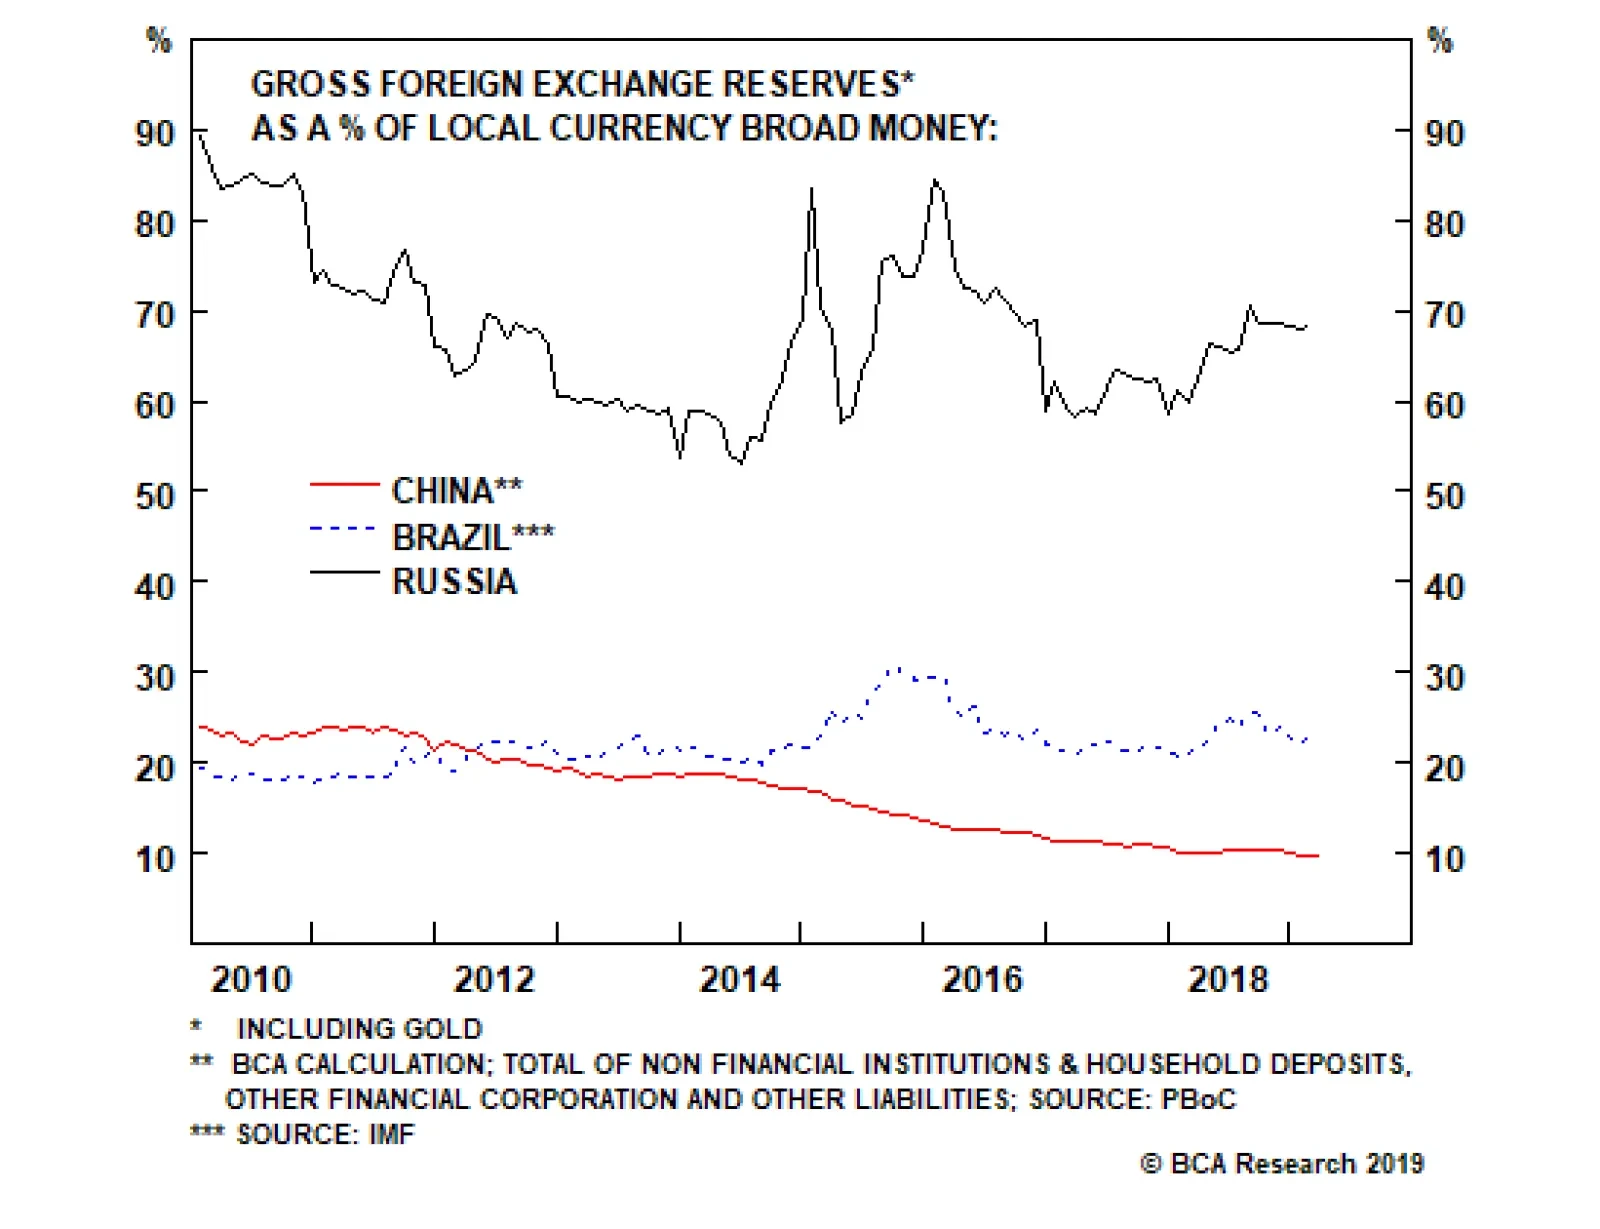
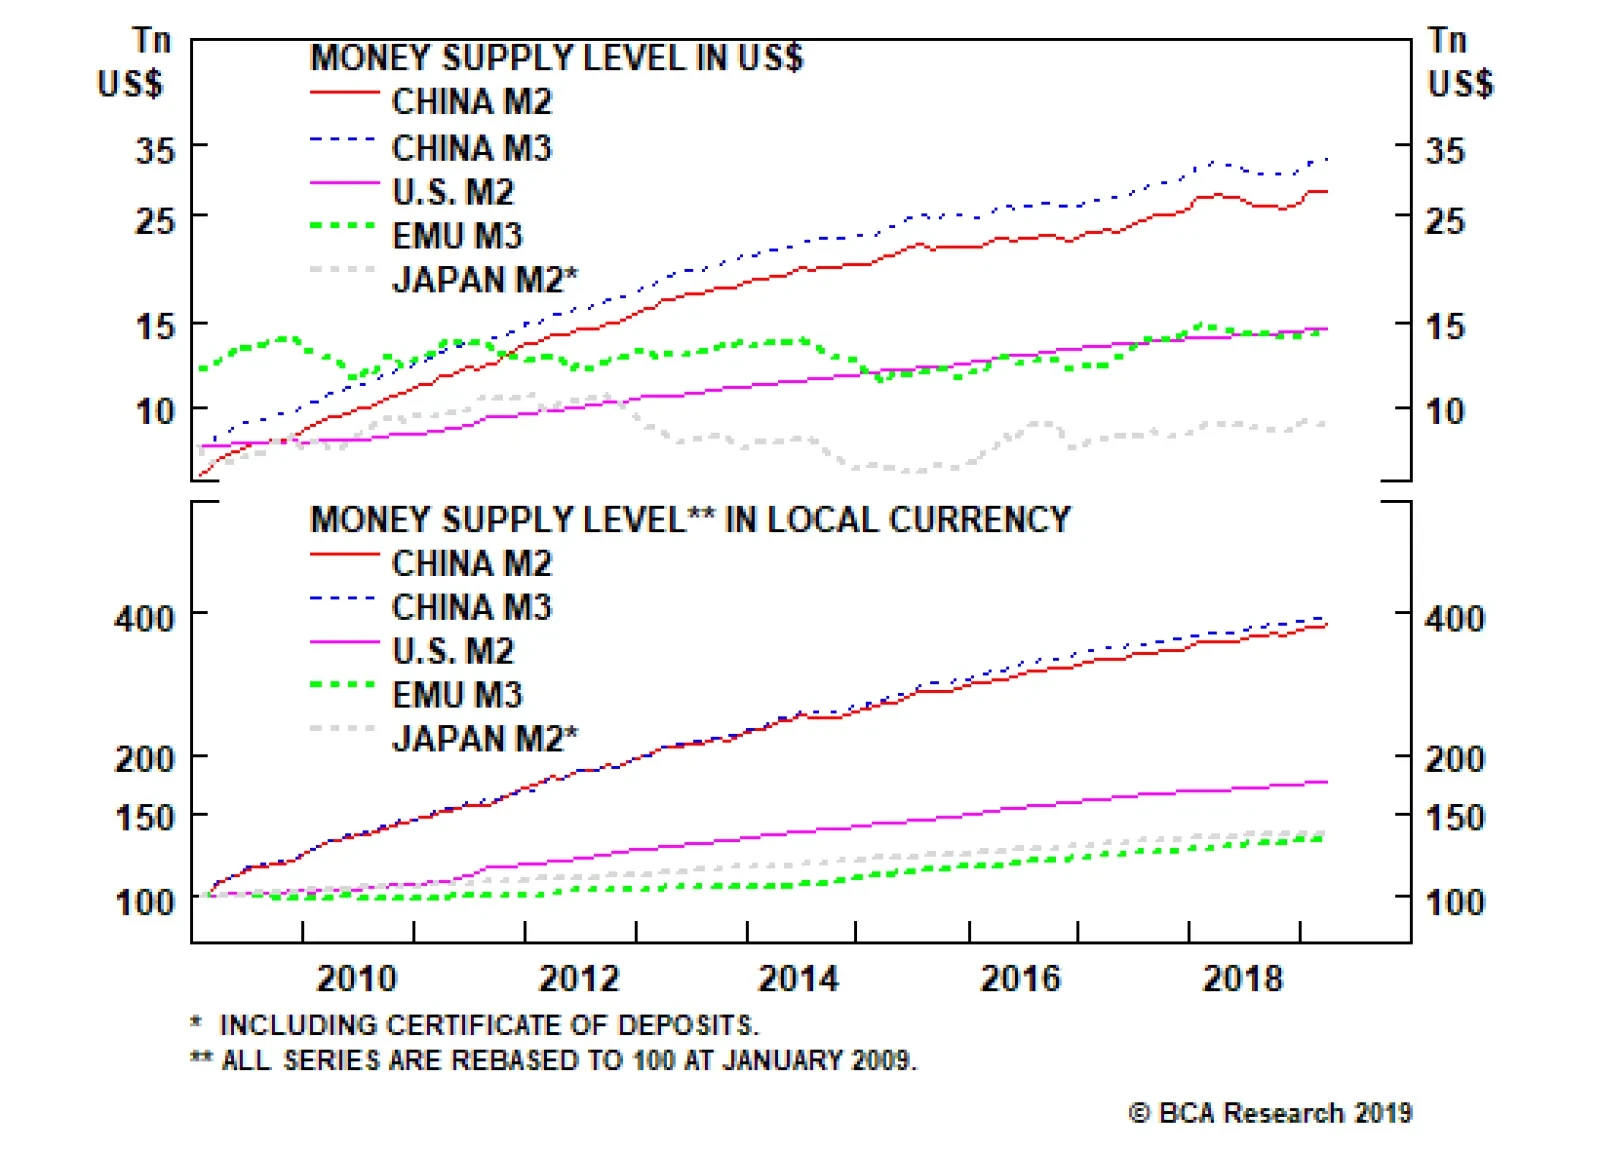
Chinese households and businesses are eager to diversify their copious and mushrooming renminbi deposits into foreign currencies and assets. The PBoC’s foreign exchange reserves of $3 trillion are equal to only 10% of the amount of yuan deposits and cash in…
China holds the world record with respect to corporate sector leverage. Households in China are more leveraged than those in the U.S. Given that borrowing costs for households are higher in China than in the U.S., interest payments take up a larger share of…
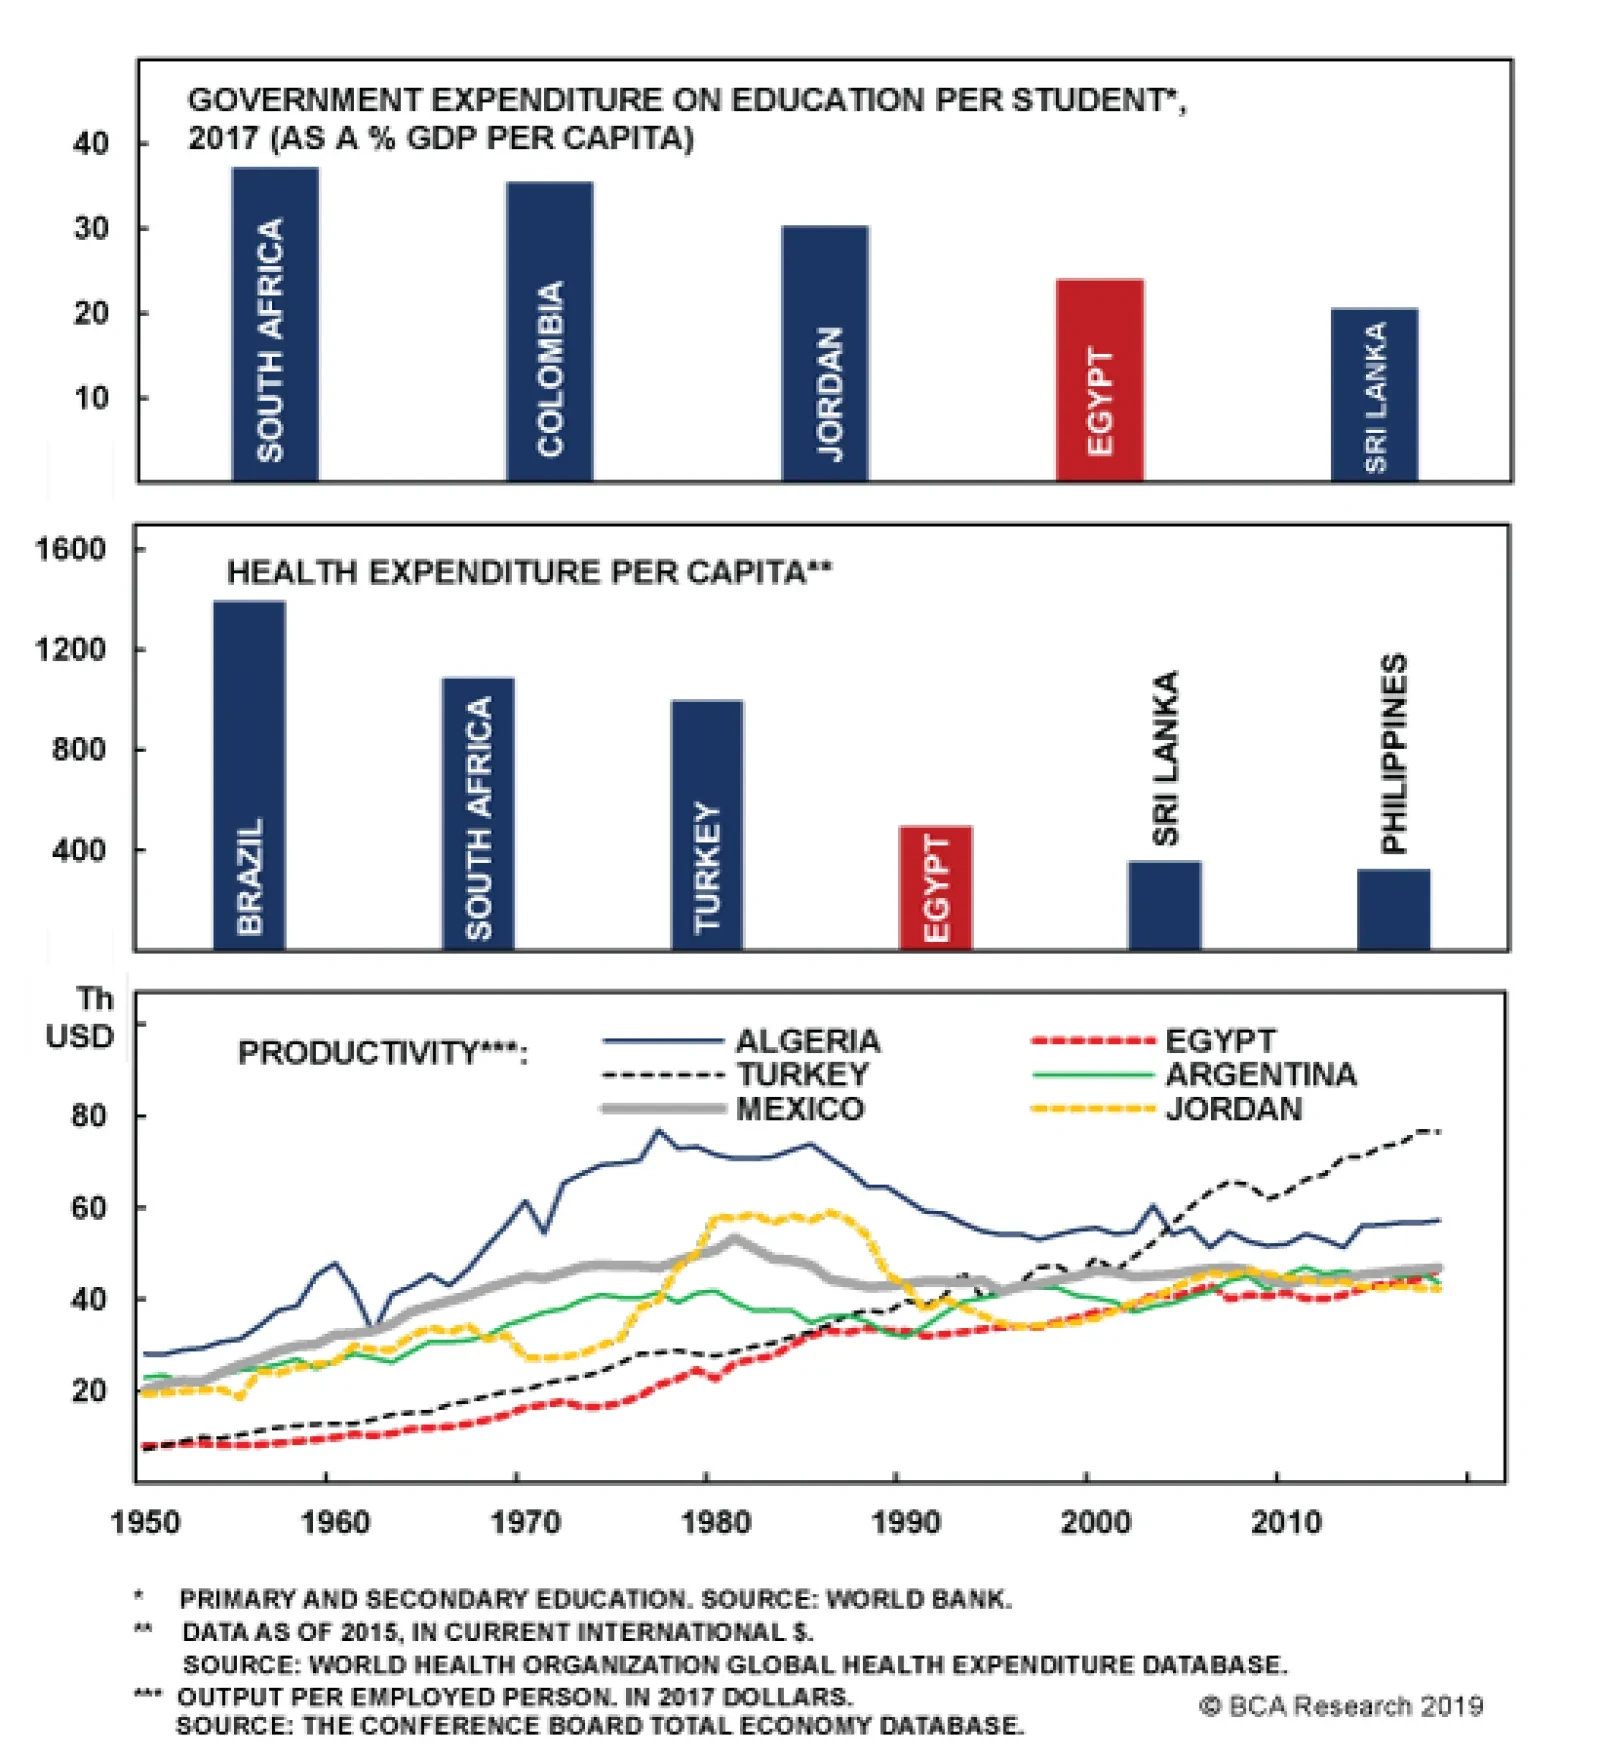
For one, Egypt remains heavily reliant on its external environment. This environment has been largely cooperative throughout Sisi’s term in office, but a global or EM downturn could cause investment to collapse. Meanwhile, the cyclical rise in oil prices will…